
Abstract
The induction of vasculature formation is proposed to be a significant mechanism behind the non-genotoxic carcinogenicity of a chemical. The vasculature formation model used in this study is based on the coculture of human primary HUVECs and hASCs. This model was used to develop an assay to assess the induction of vasculature formation. Three assay protocols, based on different conditions, were developed and compared in order to identify the optimal conditions required. Some serum supplements and growth factors were observed to be essential for initiating vasculature formation. Of the studied putative positive reference chemicals, aspartame, sodium nitrite, bisphenol A and nicotine treatment led to a clear induction of vasculature formation, but arsenic and cadmium treatment only led to a slight increase. This human cell-based assay has the potential to be used as one test within a next generation testing battery, to assess the non-genotoxic carcinogenicity of a chemical through the mechanism of vasculature formation induction.
Keywords
Introduction
The main task of the vascular system is to carry blood throughout the body to deliver oxygen and nutrients to the tissues, and to take away waste material to be excreted primarily via the faeces and urine. The vascular system also plays an important role in inflammation, organ development and tissue morphogenesis, and barrier formation and wound healing; it also functions as a supporting structure in tissues and helps in the maintenance of the tissue microenvironment.1–5 In adults, under normal physiological conditions, endothelial cells are in a quiescent state. When activated, certain processes take place, such as degradation of the underlying basement membrane to produce space for the newly formed blood vessels, and proliferation and migration of endothelial cells to generate new basement membrane and lumen for the new blood vessels. 6
Vasculogenesis is the de novo formation of blood vessels from mesoderm cell precursors whereas, in angiogenesis, new blood vessels form from pre-existing vessels. The first vessels in the developing embryo form through the process of vasculogenesis, after which angiogenesis is responsible for most of the embryonal blood vessel growth. Similarly, in adults and in pathological conditions, blood vessels form through angiogenesis, although some vasculogenesis can occur in the adult organism via circulating endothelial progenitor cells.
Chemicals may induce or inhibit vasculature formation by affecting angiogenesis and vasculogenesis. Insufficient or excessive angiogenesis may result in delayed wound healing, ischaemic heart disease, stroke, diabetic vasculopathy, solid tumours, rheumatoid arthritis and other inflammatory disorders. 7 The chemical inhibition of angiogenesis has been suggested as a major mechanism in teratogenesis,8,9 while the induction of vasculature formation has been proposed to be one of the mechanisms behind non-genotoxic carcinogenicity,10,11 although the molecular mechanisms have not yet been determined.
New blood vessel formation is crucial for cancer tissue growth and survival. 12 Without blood vessels, tumours may grow up to a maximum size of 1–2 mm3, 13 after which they need to exploit existing blood supply or induce the formation of new vessels. 14 Additionally, the vasculature is crucial in the process of metastasis via haematogenous spread.15,16 Thus, vessel and stromal remodelling are proposed to be an essential part of future cancer therapies. 17 Inhibition of angiogenesis is used in many cancer therapies because it functions as a rate-limiting factor in tumour growth and metastasis. 18 Therapies inducing vasculature formation in cancer tissue are rare, but are used with some cancers as a means to improve treatment efficacy. 19
Although environmental chemicals have never been tested systematically for angiogenesis induction, several methods have been published for the determination of angiogenesis, mainly for use in the development of therapeutic strategies. Stryker et al. 20 summarised a number of earlier reviews,21,22 in order to collate information on the currently available assays in the field, including those based on in vitro proliferation, in vitro migration, in vitro tubule formation, as well as ex vivo and in vivo methods. Below, we briefly describe some of these methods, which all include vascular structure formation and are potentially useful as a replacment of methods which are regulatred as animal tests animal replacement methods.
Zebrafish embryo model
The zebrafish embryo, up to 120 hours post-fertilisation, is a widely used model. Zebrafish embryos are transparent and vascularisation in the yolk sac can be viewed easily with a microscope. This task can be made even easier with the use of transgenic zebrafish expressing green fluorescent protein in the blood vessels. Thus, the effects of chemicals, biological factors or genes on the vascularisation process can be measured non-invasively.23,24
Hen’s egg test–chorioallantoic membrane (HET-CAM) assay
The hen’s egg test–chorioallantoic membrane (HET-CAM) assay can be used to study the effects of substances on vasculature formation, either by direct chemical exposure of the CAM or the egg,25–27 or by transplanting tumour cells into the CAM and studying vessel outgrowth (the ‘tumour cell–CAM model’). 28 The use of the latter model is currently impractical for regulatory purposes, since it would require the use of many different types of specific tumour cells, as well as needing to draw on (currently lacking) knowledge for the informed selection of these cells. However, this model may be an interesting avenue for future investigation — not only for use in tumour therapy, but also in studies on how various tumour cell types may induce angiogenesis within the CAM and how chemicals could influence this interaction. Use of the tumour cell–CAM model may also complement other HET-CAM assays that aim to identify the potential effects of chemicals on angiogenesis and vasculogenesis. The HET-CAM assay can also be used to measure haemorrhage (bleeding from the vessels), vascular lysis (blood vessel disintegration) and coagulation (intra-vascular and extra-vascular protein denaturation). 29 However, in common with the zebrafish embryo assay, the HET-CAM assay still requires the breeding and use of animals. They are also less practically amenable and have lower testing throughput, as compared to the available in vitro methods.
Currently available in vitro methods
In vitro methods that are conceptually similar to the tumour cell–CAM model have been described in the literature, and have been used to study the interaction of tumour cells with the extracellular matrix or with embryoid bodies.30–32 However, as explained above, for the tumour cell--CAM model this is currently impractical, but it might be a long term goal.
Cell culture-based methods are available that involve culturing human umbilical vessel endothelial cells (HUVECs) in a murine matrix with the test substance for 4–18 hours, depending on the study design. Such methods are commercially available from, for example, Thermo Fisher Scientific 33 and Cell BioLabs, 34 and the endpoint is the quantification of the vascular structure formed, which is measured with a light microscope. Human dermal microvascular endothelial cells (HDMECs) have also been used in a similar way. 35 HUVECs can also be cultured in vitro as spheroids, and their sprouting into the extracellular matrix can be measured and used as an endpoint. 36 Furthermore, HUVECs can be cultured together with fibroblasts to form vascular structures for studying angiogenesis. 37 It has also been shown that the coculture of HUVECs with human adipose stromal cells (hASCs) leads to a more mature vasculature formation than is apparent in the culture of HUVECs alone, i.e. the appearance of lumina and pericytes in the vascular structure is evident. 38
The assay developed in the current study
The assay developed in this study is based on our standardised vasculogenesis/angiogenesis model (VAM), which has previously been used for measuring the inhibition of vasculature formation. 9 In our previous studies, the VAM was constructed and used as follows: HUVECs and hASCs were cocultured in VAM stimulation solution, to form a dense vascular network. The VAM stimulation solution contains growth factors and other components that support the development of blood vessel-like structures. 9 After six days, mature vessels were visualised through the immunofluorescent staining of collagen IV and von Willebrand factor. In these mature vessels, collagen IV is seen surrounding the tubule. For the detection of potential inhibitors, the coculture was exposed to test substances after 24 hours of initial vasculature formation, and re-exposed after three days. The endpoints assessed were vessel length and extent of sprouting, which were both calculated from the assessment of the von Willebrand factor-stained vascular structures. 9
The VAM is currently undergoing EURL ECVAM validation for its potential use in a test method to assess thyroid hormone disruption (Thyroid Method 8c: In vitro human adipose stromal cell–human umbilical vein endothelial cell (hASC-HUVEC) vasculogenesis/angiogenesis method). 39
One major advantage of the VAM is that it does not contain any artificial or animal-based matrices, as the vascular structures are formed directly as a result of the HUVEC and hASC coculturing process.38,40 The absence of an animal-based matrix leads to the clearer immunofluorescent staining of the newly formed vasculature and more accurate quantification, and the possibility of a test chemical binding to an artificial matrix is also avoided.41,42 In the VAM coculture we have observed other morphologically relevant cells for blood vessels, such as pericytes and smooth muscle cells. 38 Moreover, hASCs in the VAM have the potential to differentiate into endothelial cells and to form vascular structures without added endothelial cells, therefore modelling vasculogenesis as an additional relevant cellular process (see Supplemental Material, Figure S1).
In this study, the original VAM-based assay method was modified to measure the induction of vasculature formation via angiogenesis and vasculogenesis, rather than its inhibition. Three assay protocols were developed and compared, with major modifications from the original method focusing on the optimisation of: the VAM stimulation solution to be more suitable for the detection of vasculogenesis induction (Protocol 1); the test chemical exposure timings and repetitions (Protocol 2); and the composition of the coculture medium (Protocol 3). This work lays the ground for the establishment of a standardised assay method and shows that exposure to certain chemicals can in fact induce vasculature formation.
Materials and methods
Ethical consideration
This in vitro study conforms to the ethical principles of the Declaration of Helsinki. The tissues were obtained from Tampere University Hospital, Finland, with written informed consent from patients. The umbilical cords were from caesarean sections and the human adipose tissue was excess from surgical procedures. The use of isolated HUVEC and hASC cells from these tissues was approved by the Regional Ethics Committee of Tampere University Hospital’s Responsibility Area, with permit numbers R03058 and R08028, respectively.
Isolation, culture and quality control of hASC and HUVEC primary cells
The isolation, culture and quality control procedures for the HUVEC and hASC, which took place in an OECD GLP-compliant laboratory, were carried out as described previously.38,40
The hASCs consisted of a heterogenous cell population, isolated from the stromal vascular fraction of adipose tissue. The cells were characterised by flow cytometry (FACSCanto II, BD Biosciences, Franklin Lakes, NJ, USA) for markers CD73, CD90 and CD105 (BD Biosciences), as described previously.
38
The hASCs were cultured in DMEM/F12 medium (Gibco, Carlsbad, CA, USA), supplemented with 1%
HUVECs were cultured in endothelial cell growth medium-2 BulletKit™ (EGM™-2; Lonza) containing 2% FBS and 0.04% v/v hydrocortisone, 0.4% v/v FGF fibroblastic growth factor-β (FGF-β), 0.1% v/v vascular endothelial growth factor-A (VEGF-A), 0.1% v/v insulin-like growth factor (IGF), 0.1% v/v human epidermal growth factor (hEGF), 0.1% ascorbic acid and 0.1% v/v heparin, at 37°C with 5% v/v CO2. Cells were cultured in Nunc T75 EasYFlasks (Thermo Scientific, Cat. No. 156472). Both cell lines were tested with the MycoAlert® mycoplasma detection kit (Lonza) and shown to be free of mycoplasma contamination. Before coculturing, the cells were thawed and cultured separately; the hASCs for five days and the HUVECs for four days. At the start of the coculture, the hASC were at passage 1 and the HUVECs at passage 3.
Preparation of dilution series
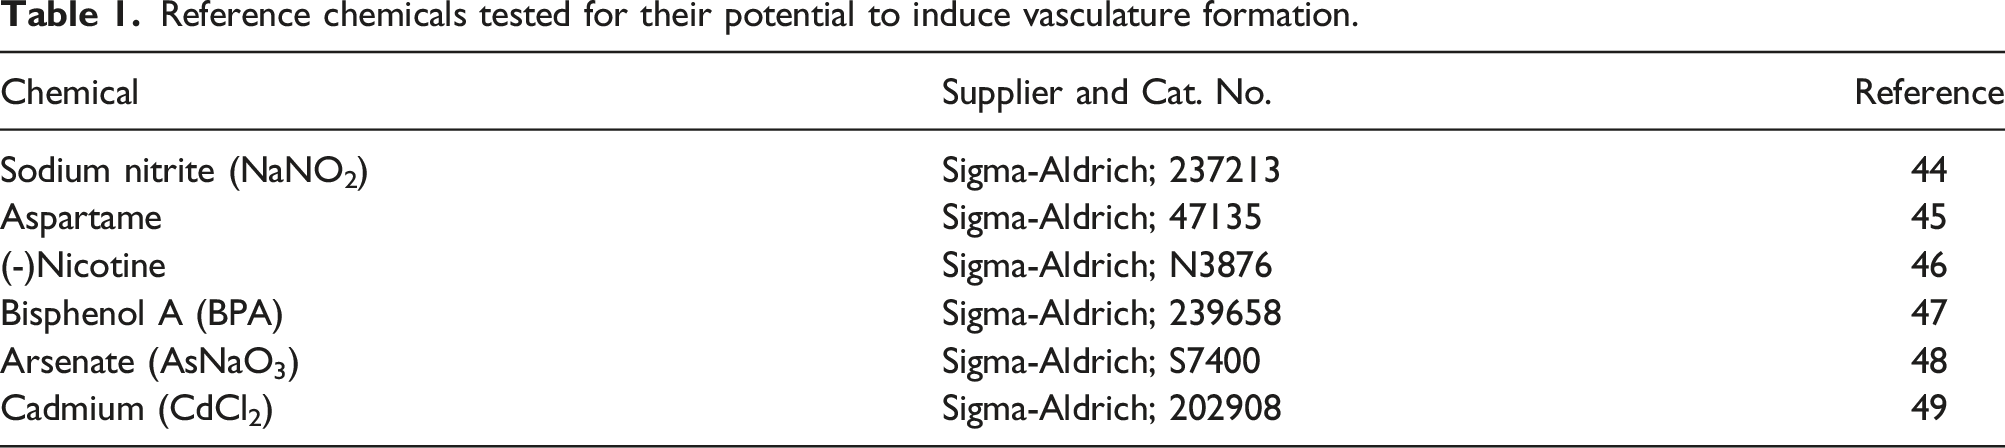
Reference chemicals tested for their potential to induce vasculature formation.
Modifying the VAM assay to assess the induction of vasculature formation
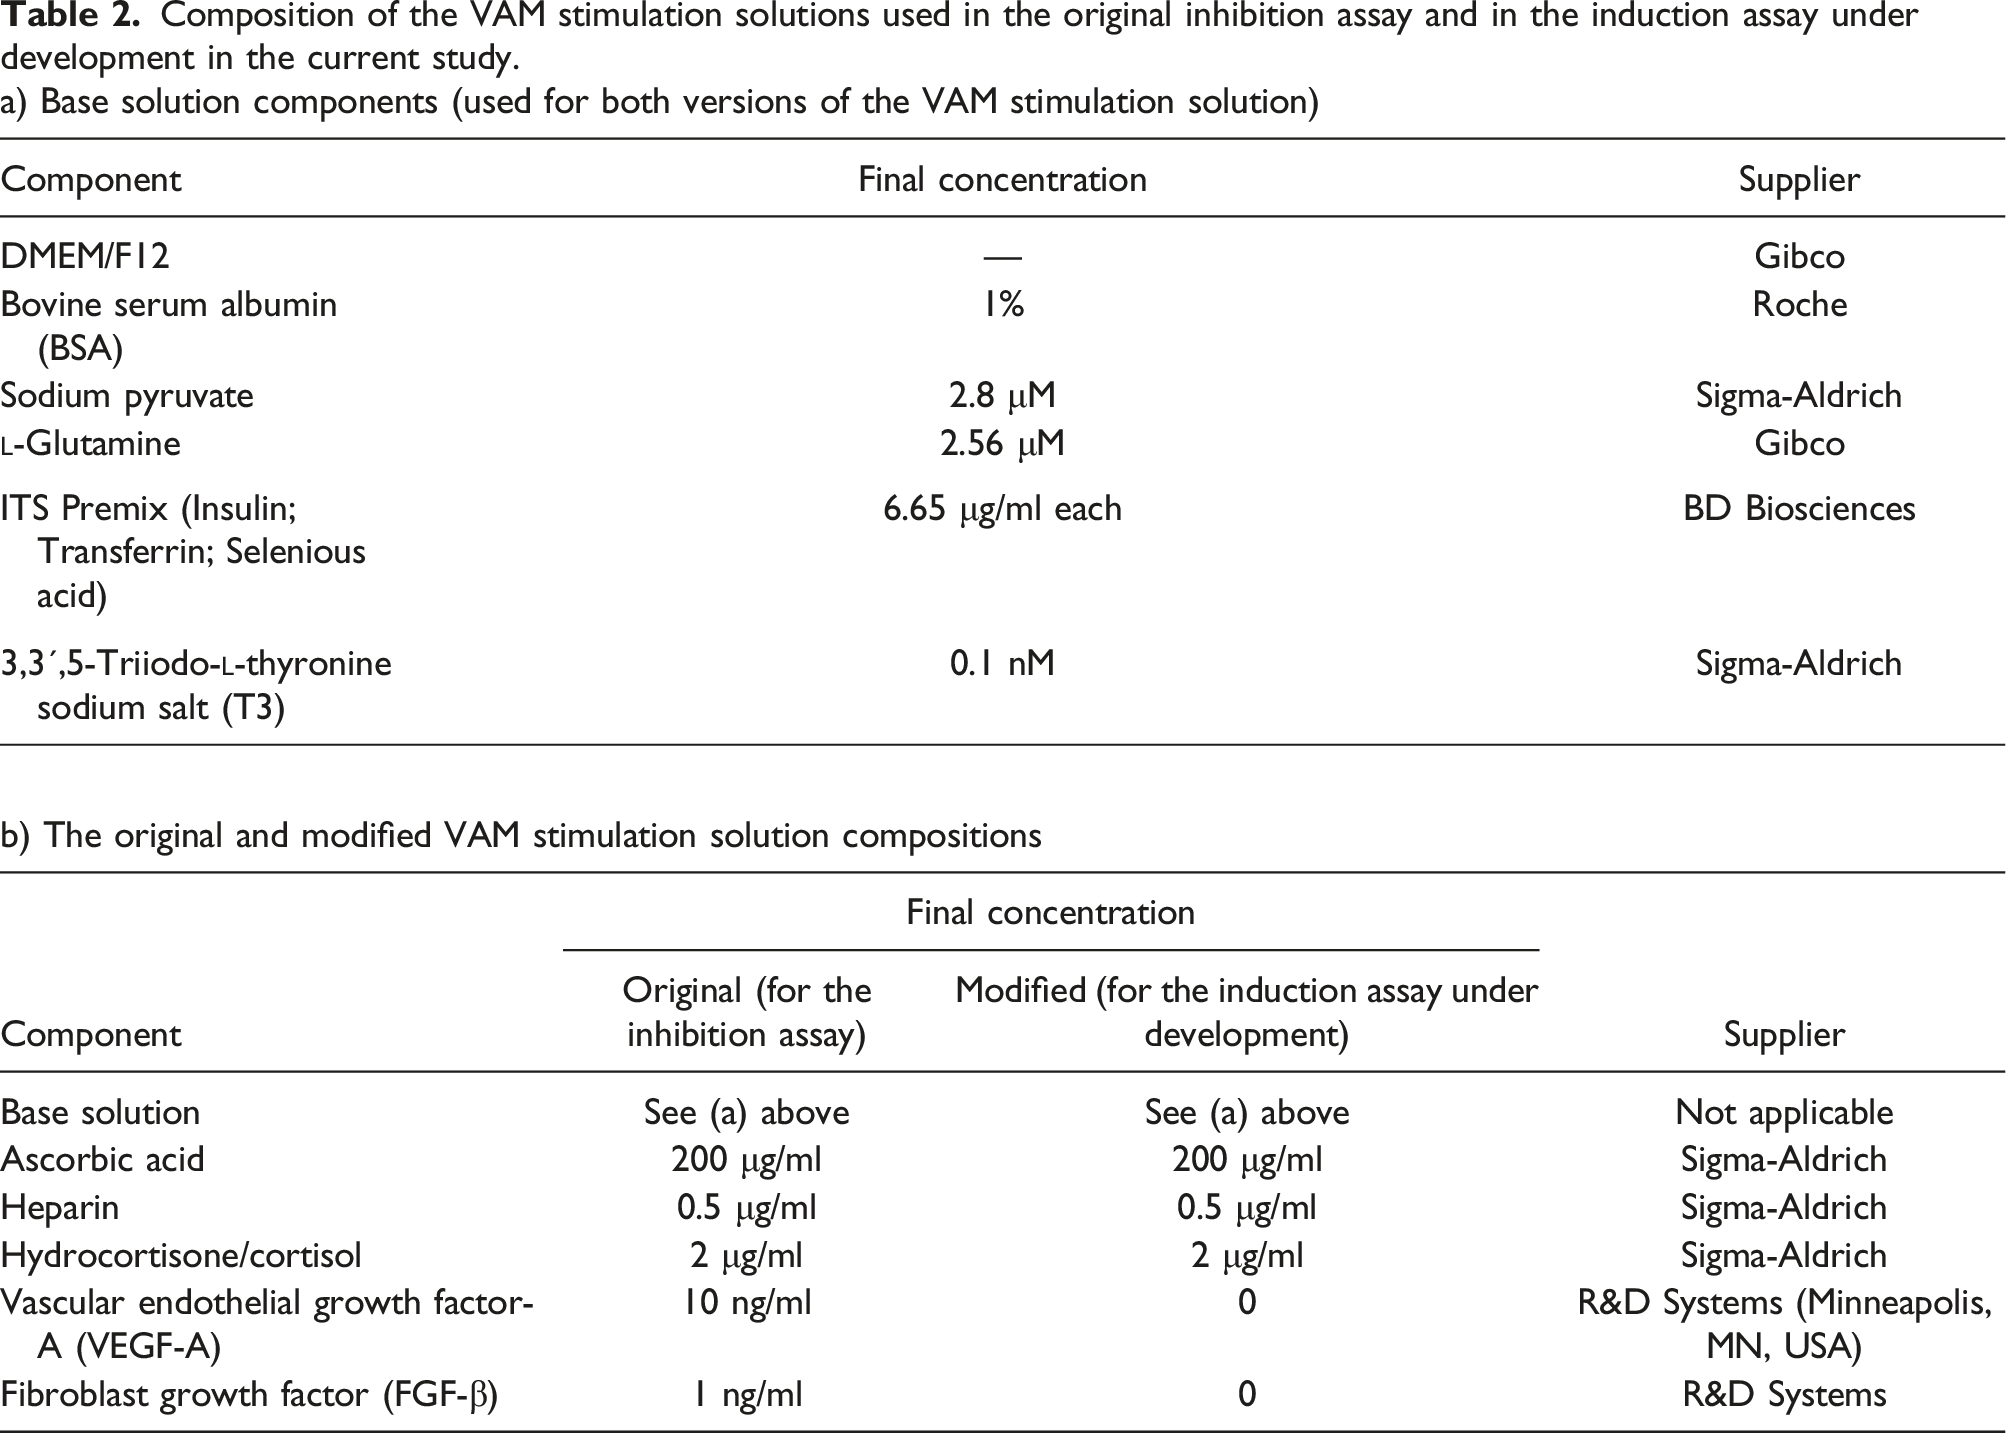
Composition of the VAM stimulation solutions used in the original inhibition assay and in the induction assay under development in the current study. a) Base solution components (used for both versions of the VAM stimulation solution)
The protocol for the original vasculature formation inhibition assay and the three protocols used in this study during the development of the vasculature formation induction assay.
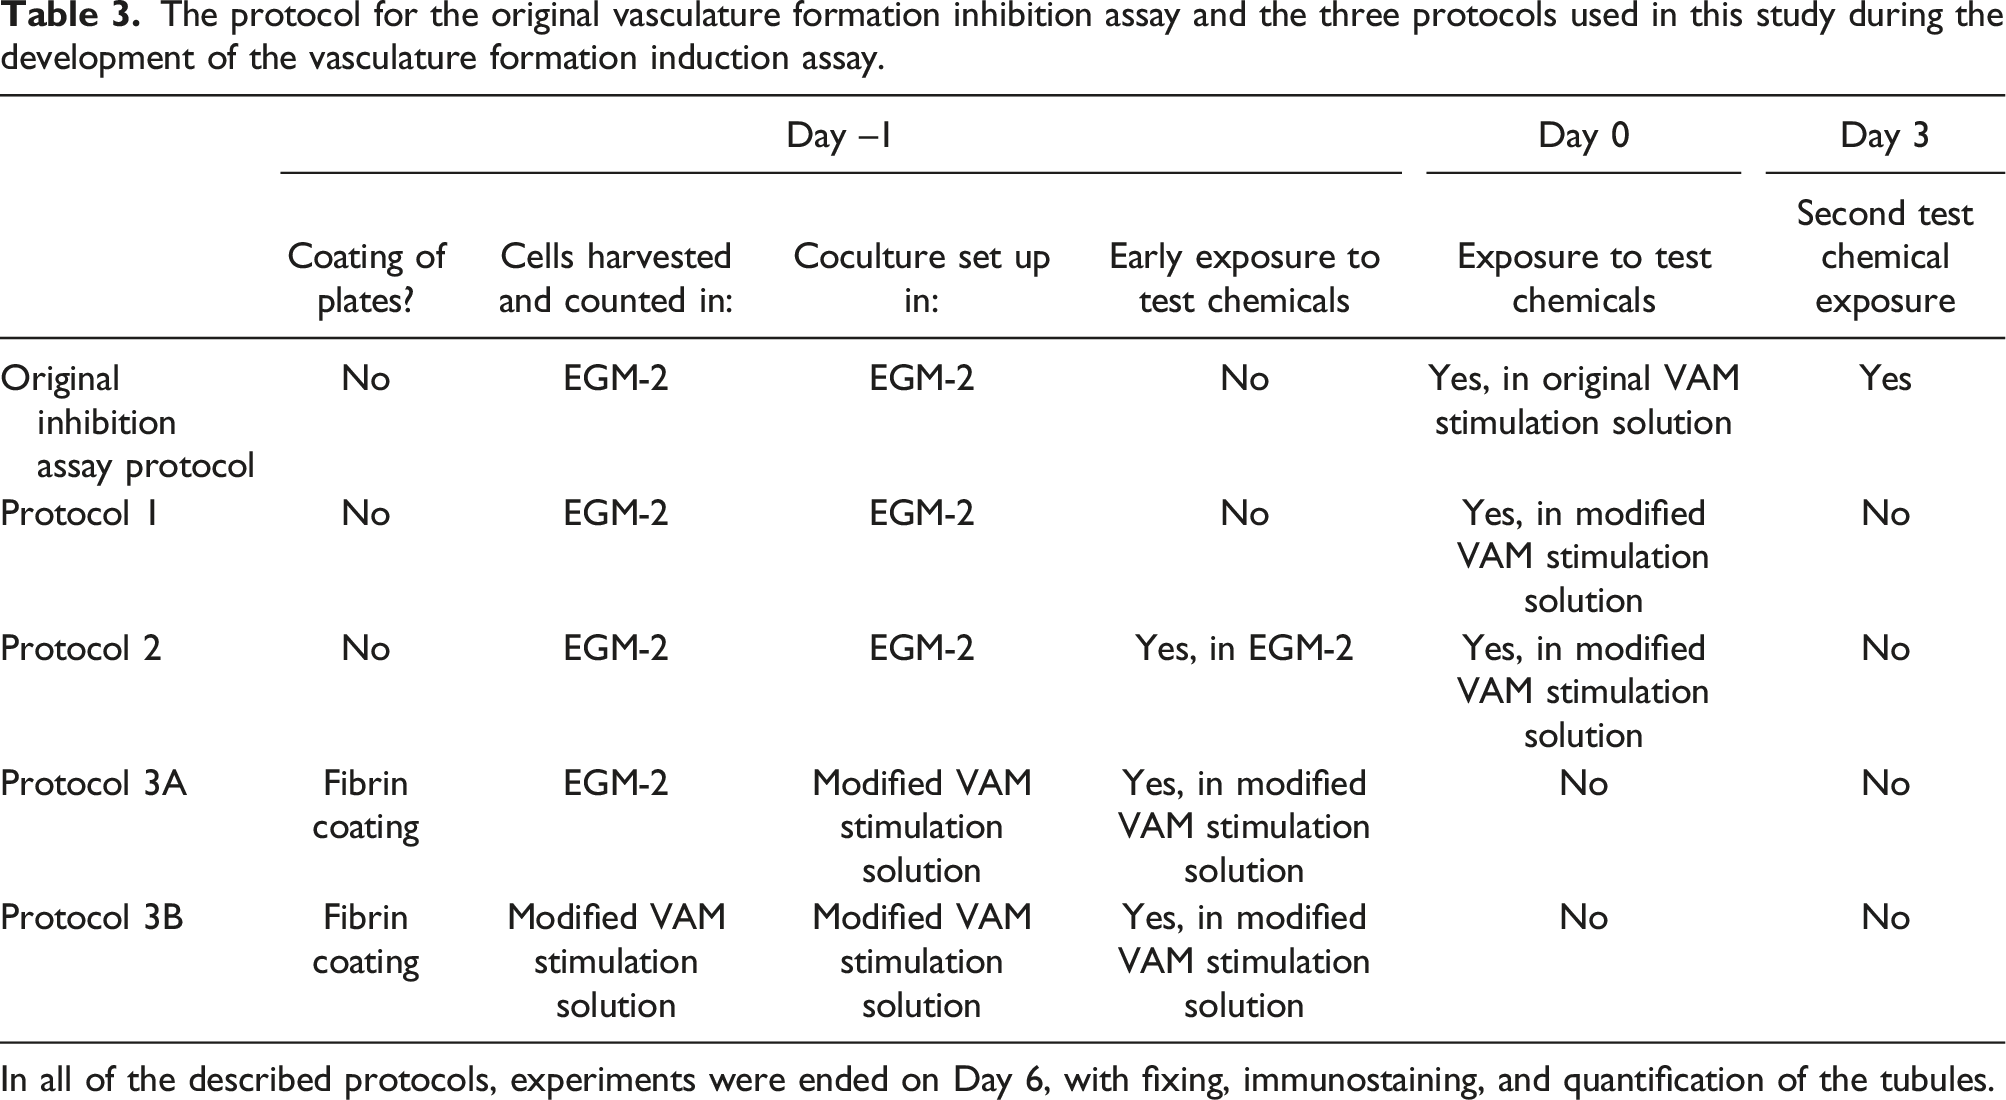
In all of the described protocols, experiments were ended on Day 6, with fixing, immunostaining, and quantification of the tubules.
During optimisation of the VAM assay for assessing induction of vasculature formation, three modified protocols were developed and compared (Table 3).
Protocol 1: This was the most similar to the original VAM assay protocol. The day before the model was required for the assay (Day –1), the coculture was prepared in EGM-2 medium (Lonza) in a 48-well plate (Nunc, Thermo Scientific, Cat. No. 140675), by first seeding 20,000 cells/cm2 of hASCs and then 4000 cells/cm2 of HUVECs on top of the hASCs in a final volume of 500 μl/well. Cells were incubated at 37°C with 5% v/v CO2. At the start of the assay (Day 0), the chemical dilution series was prepared in modified VAM stimulation solution (see Table 2), and the cells were exposed by replacing the culture medium with the diluted test chemicals. Each plate had two replicate concentrations and the experiment was repeated 3 times. Modified VAM stimulation solution without chemical addition was used as the solvent only negative control, and modified VAM stimulation solution with growth factors was used as the positive control. Compared to the original VAM stimulation solution, the modified solution did not contain any growth factors (see Table 2). On Day 3, the medium was refreshed without further chemical exposure and the experiment ended on Day 6, with fixing and immunostaining.
Protocol 2: To potentially generate a greater effect with regard to the induction of vasculogenesis, Protocol 2 featured an earlier and repeated exposure to the test chemicals. Protocol 2 was tested only with NaNO2 and nicotine, because these substances induced the highest level of vasculature formation in Protocol 1. According to this protocol, the first chemical exposure was carried out in EGM-2 on Day –1 (i.e. the day before the usual start of the induction assay). On Day 0, this culture medium was replaced with modified VAM stimulation solution, containing the same concentrations of chemicals as those used on Day –1 in EGM-2. This served to effect a two-step early chemical exposure regimen. Subsequent steps were the same as in Protocol 1.
Composition of the fibrin plate coating.
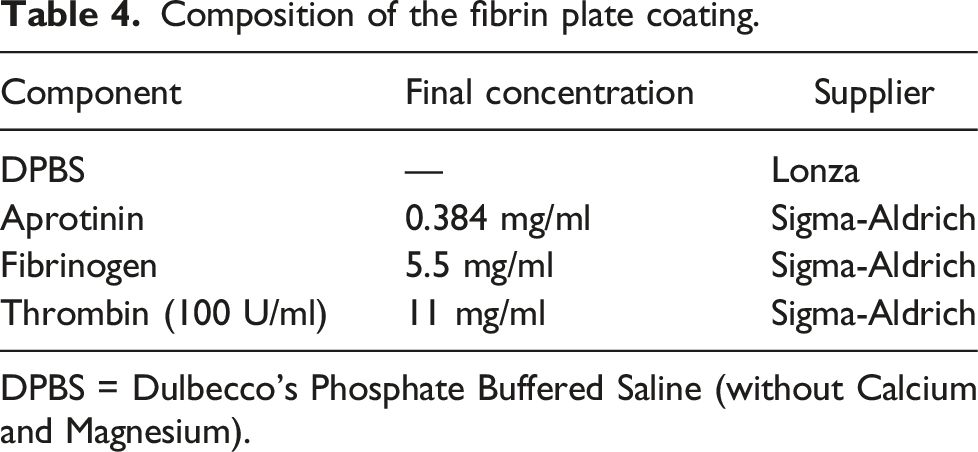
DPBS = Dulbecco’s Phosphate Buffered Saline (without Calcium and Magnesium).
In Protocol 3, the cells were initially harvested separately in either EGM-2 medium (Protocol 3A) or modified VAM stimulation solution (Protocol 3B) and the cell numbers determined for the seeding of the cocultures. The cells were cocultured in modified VAM stimulation solution. In the first case (Protocol 3A), a small amount of EGM-2 medium would have been transferred to the coculture medium following the cell harvesting and counting step. For both variations of Protocol 3, the cells were cocultured from Day –1 (relative to the start of the assay) in modified VAM stimulation solution with the test chemicals included for early exposure of the cells. This exposure continued until Day 3, when the modified VAM stimulation solution was replaced with fresh medium without the test chemicals. The experiment ended on Day 6, with fixing and immunostaining. As was the case for Protocol 2, Protocol 3 was tested only with NaNO2 and nicotine, because these substances induced the highest level of vasculature formation in Protocol 1.
WST-1 cell viability assay
As part of Protocol 1, a WST-1 (water-soluble tetrazolium salt) proliferation assay was performed before immunostaining on Day 6, to investigate whether any of the chemicals tested would affect cell viability. Briefly, 10% v/v of WST-1 reagent (Roche, Switzerland) was added to each well and incubated for 1 hour (at 37°C with 5% v/v CO2), before absorbance was read at 450 nm with a Spark microplate reader (Tecan, Switzerland). The absorbance values for the control blank wells (which contained modified VAM stimulation solution with appropriate concentrations of the reference chemicals), were subtracted from the values obtained for the samples, to remove possible interference from any reference chemical absorbance.
Viability was normalised so that the negative control was attributed a value of 100. The normalised values from the repeat experiments were combined, and the average, standard error of the mean (SEM) and p values (Student’s t-test) were calculated; graphs were created in Microsoft Excel® (Supplemental Material, Figure S2).
Because cell viability was not affected by NaNO2 or nicotine exposure, the viability assay was not repeated for Protocols 2 and 3 (in which only these two substances were tested, as described above).
Immunofluorescent staining and imaging
In order to visualise vascular structures and determine their maturity, immunofluorescent staining and imaging was performed. On Day 6, the cells were fixed with 70% v/v ethanol. Cell permeabilisation was achieved with 0.5% v/v Triton-X 100 (MP Biochemicals, Solon, OH, USA), and non-specific binding sites were blocked with 10% w/v BSA (Roche Diagnostics) in PBS. The following primary antibodies (diluted in 1% BSA in PBS) were applied to the fixed and permeabilised cells, followed by incubation for 45 minutes at room temperature: rabbit anti-human von Willebrand factor IgG (1:100; DAKO, Santa Clara, CA, USA; Cat. No. A0082); mouse anti-human collagen IV (1:500; Sigma-Aldrich, St Louis, MO, USA; Cat. No. C1926). After washing the cells twice with PBS, the following cross-adsorbed secondary antibodies were applied according to their primary antibody specificity: Alexa Fluor™ 568-conjugated goat anti-rabbit IgG (H+L) Alexa Fluor™ 568 (1:400; Invitrogen, Waltham, MA, USA; Cat. No. A-11011); Alexa Fluor™ 488-conjugated goat anti-mouse IgG (H+L) (1:400; Invitrogen; Cat. No. A-11001). The cells were incubated for 1 hour at room temperature in the dark. The secondary antibody solutions were removed from the wells and the cells washed twice with PBS; PBS was added to the wells, in order to maintain the cells during the microscopy step.
Stained cells were visualised with an inverted fluorescence microscope Nikon Ti-S Eclipse. Images were captured by using a 20× or 10× zoom, with a 10×10 or 4×4 grid, with emission wavelengths corresponding to the Alexa Fluor™ conjugation of the secondary antibodies.
Approval of an experiment
An experiment was approved when the positive control yielded a dense vascular tubule network and the negative control showed sparse and short vascular structures, stained primarily for von Willebrand factor. Other than in the negative control cultures, von Willebrand factor staining should appear only on the inside of the tubules; collagen IV should surround the vascular structure, indicating maturation of the vessel.
Analysis of vascular tubule structures
Images of vascular tubule structures obtained with fluorescence microscopy were analysed with AngioTool software. 43 In the analysis, the colour channel for von Willebrand factor staining was used, because it is more specific for vascular structures than that of collagen IV. With AngioTool, we used original settings and collected the values for Total Vessel Length. The values were normalised to that of the negative control. The average, SEM and p values (Student’s t-test) were calculated for each concentration compared to the negative control; graphs were created in Microsoft Excel®.
Results
Optimisation of the modified VAM stimulation solution
The original VAM-based assay
9
to assess the inhibition of vasculature formation was modified in order to measure the induction of vasculature formation via angiogenesis and vasculogenesis, rather than its inhibition. In the VAM, a dense vascular network is formed (see Figure 1a) — however, if the vascular network becomes too dense, it could conceal the vasculogenesis-inducing effects of the test chemicals. Thus, the VAM stimulation solution was modified, in order to reduce the density of the vascular network formed. This was achieved by reducing the concentration of growth factors that induce vasculature formation (Figure 1). The impact of the growth factors FGF-β and VEGF-A on vessel formation. The original VAM stimulation solution contained 10 ng/ml VEGF-A and 1 ng/ml FGF-β. The images show the effects of stimulation solution containing: a) 100% concentration of each growth factor (i.e. original conditions); b) 50%; c) 25%; and d) 12.5% concentration of each growth factor (relative to the original concentration); e) no growth factors; and f) the base solution (negative control). Tubules were stained with an anti-von Willebrand factor antibody (red) and anti-collagen IV antibody (green) on Day 6 of coculture. Images a–f show representative images of three replicates. The images were tiled from 10 × 10 grid view of photos taken with a 20× zoom. g) Shows normalised total vessel length, calculated from von Willebrand factor-stained tubules from three replicate wells. The values were normalised against original VAM stimulation solution samples (i.e. with 100% growth factor concentrations), which were assigned a value of 1; statistical significance relative to this value is indicated by *p < 0.05, **p < 0.01 and ***p < 0.001.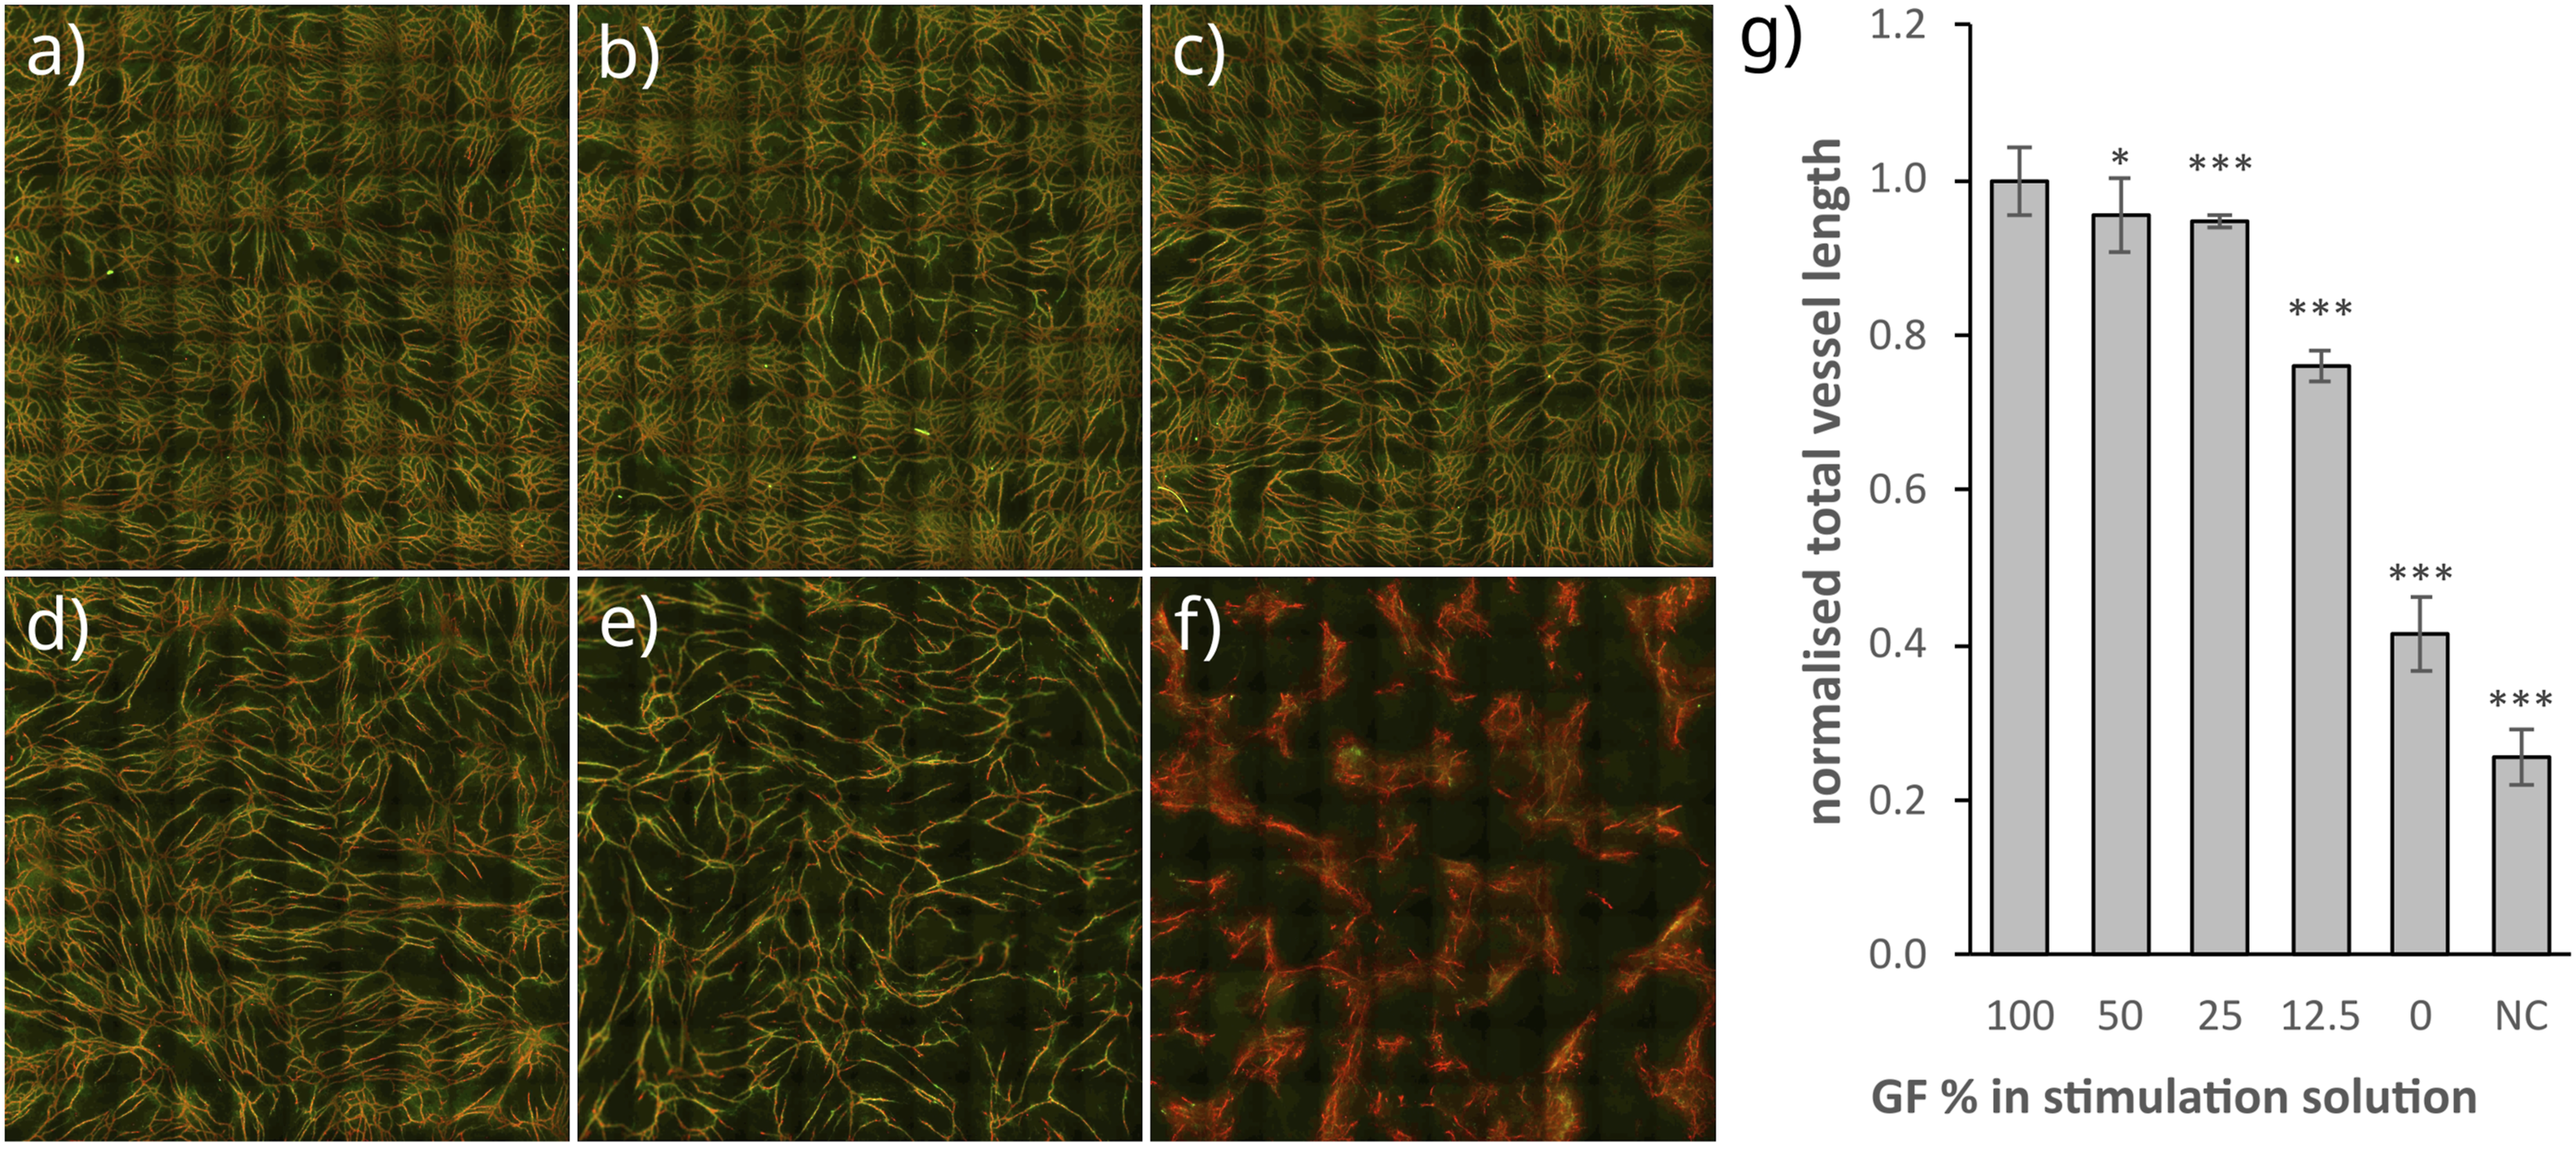
A dose–response correlation was observed in terms of the decreasing density of the tubule network in response to the reduction in the concentration of VEGF-A and FGF-β in the VAM stimulation solution (Figure 1g). Visual examination of von Willebrand factor- and collagen IV-stained vascular structures formed in the presence of the full dilution series of these growth factors indicates that they are not specifically necessary in the VAM stimulation solution for the formation of a vascular network (Figure 1a–e). However, other components in the VAM stimulation solution are required for the maturation of the vascular structures, as demonstrated by the absence of green-stained collagen IV areas in the negative control (Figure 1f). Thus, throughout this study, the modified VAM stimulation solution used in the induction assay protocols was prepared without growth factors (as in Figure 1e), according to the composition described in Table 2.
Modification of the original inhibition assay protocol
During the optimisation process of the method for the new VAM-based vasculature formation induction assay, three potential protocols were created by modifying the original VAM inhibition assay protocol. 9 A comparison of the original protocol and the three protocols that were developed and compared in the current study is shown in Table 3. Based on the current literature, a number of putative positive reference chemicals were selected (Table 1).
In the original protocol, hASCs and HUVECs were harvested and then cocultured in EGM-2 medium, the day before the model was required for use in the vasculature formation inhibition assay (i.e. Day –1). At the start of the assay (Day 0), the EGF-2 medium was changed to VAM stimulation solution, containing FGF-β, VEGF-A and the test chemicals, where appropriate (see Table 2). On Day 3, the chemical exposure was repeated in fresh VAM stimulation solution. On Day 6, the experiment was terminated by fixing the cells, staining them with anti-collagen IV and anti-von Willebrand factor, and quantifying tubule formation by calculating vessel length.
Evaluation of Protocol 1
Protocol 1 was carried out with all six chemicals listed in Table 1. This protocol was similar to the original VAM assay protocol, except that FGF-β and VEGF-A were not included in the modified VAM stimulation solution (see Table 2). The concentrations for each reference chemical were decided based on the available literature.44–49 From the highest chosen concentration, a dilution series was prepared using a dilution factor of 2.15 each time, to obtain concentrations that could be plotted on a three or four-cycle log10 scale graph. Each concentration had two replicates on a 48-microwell plate, and each experiment was repeated at least three times. The negative control (NC) was the dilution solvent only (i.e. modified VAM stimulation solution in all but the case of bisphenol A). A combination of VEGF-A (10 ng/ml) and FGF-β (1 ng/ml) was used as the positive control, to confirm that vasculature formation was induced within the model. Vessel length after exposure to each reference chemical concentration was calculated by using AngioTool
43
(Figure 2). Exposing the VAM to the full set of reference chemicals in Protocol 1. In Protocol 1, the model was exposed to the reference chemicals in modified VAM stimulation solution after one day of coculture of hASC and HUVEC in EGM-2. Total vessel length was calculated by visualising the tubules with anti-von Willebrand factor antibody on Day 6; the values were normalised to the negative (solvent only) control (NC), which was attributed the value of 1 (as indicated by the horizontal dashed line). The dilution series was prepared by dividing each of the highest concentration with a 2.15 dilution factor. Protocol 1 was used to test: a) aspartame (maximum concentration 100 μM); b) arsenate (max. conc. 100 nM); c) BPA (max. conc. 100 nM); d) cadmium (max. conc. 100 nM); e) NaNO2 (max. conc. 150 μM); and d) nicotine (max. conc. 1 μM). For each concentration, the standard error of the mean was calculated from three separate experiments, with two replicates of each concentration per experiment (i.e. n = 6); statistical significance was calculated against the 0 concentration (*p < 0.05, **p < 0.01 and ***p < 0.001). Normalised total vessel length values for the positive control exceeded 2 in all cell plates — thus, for better readability, these values are not presented in the graphs.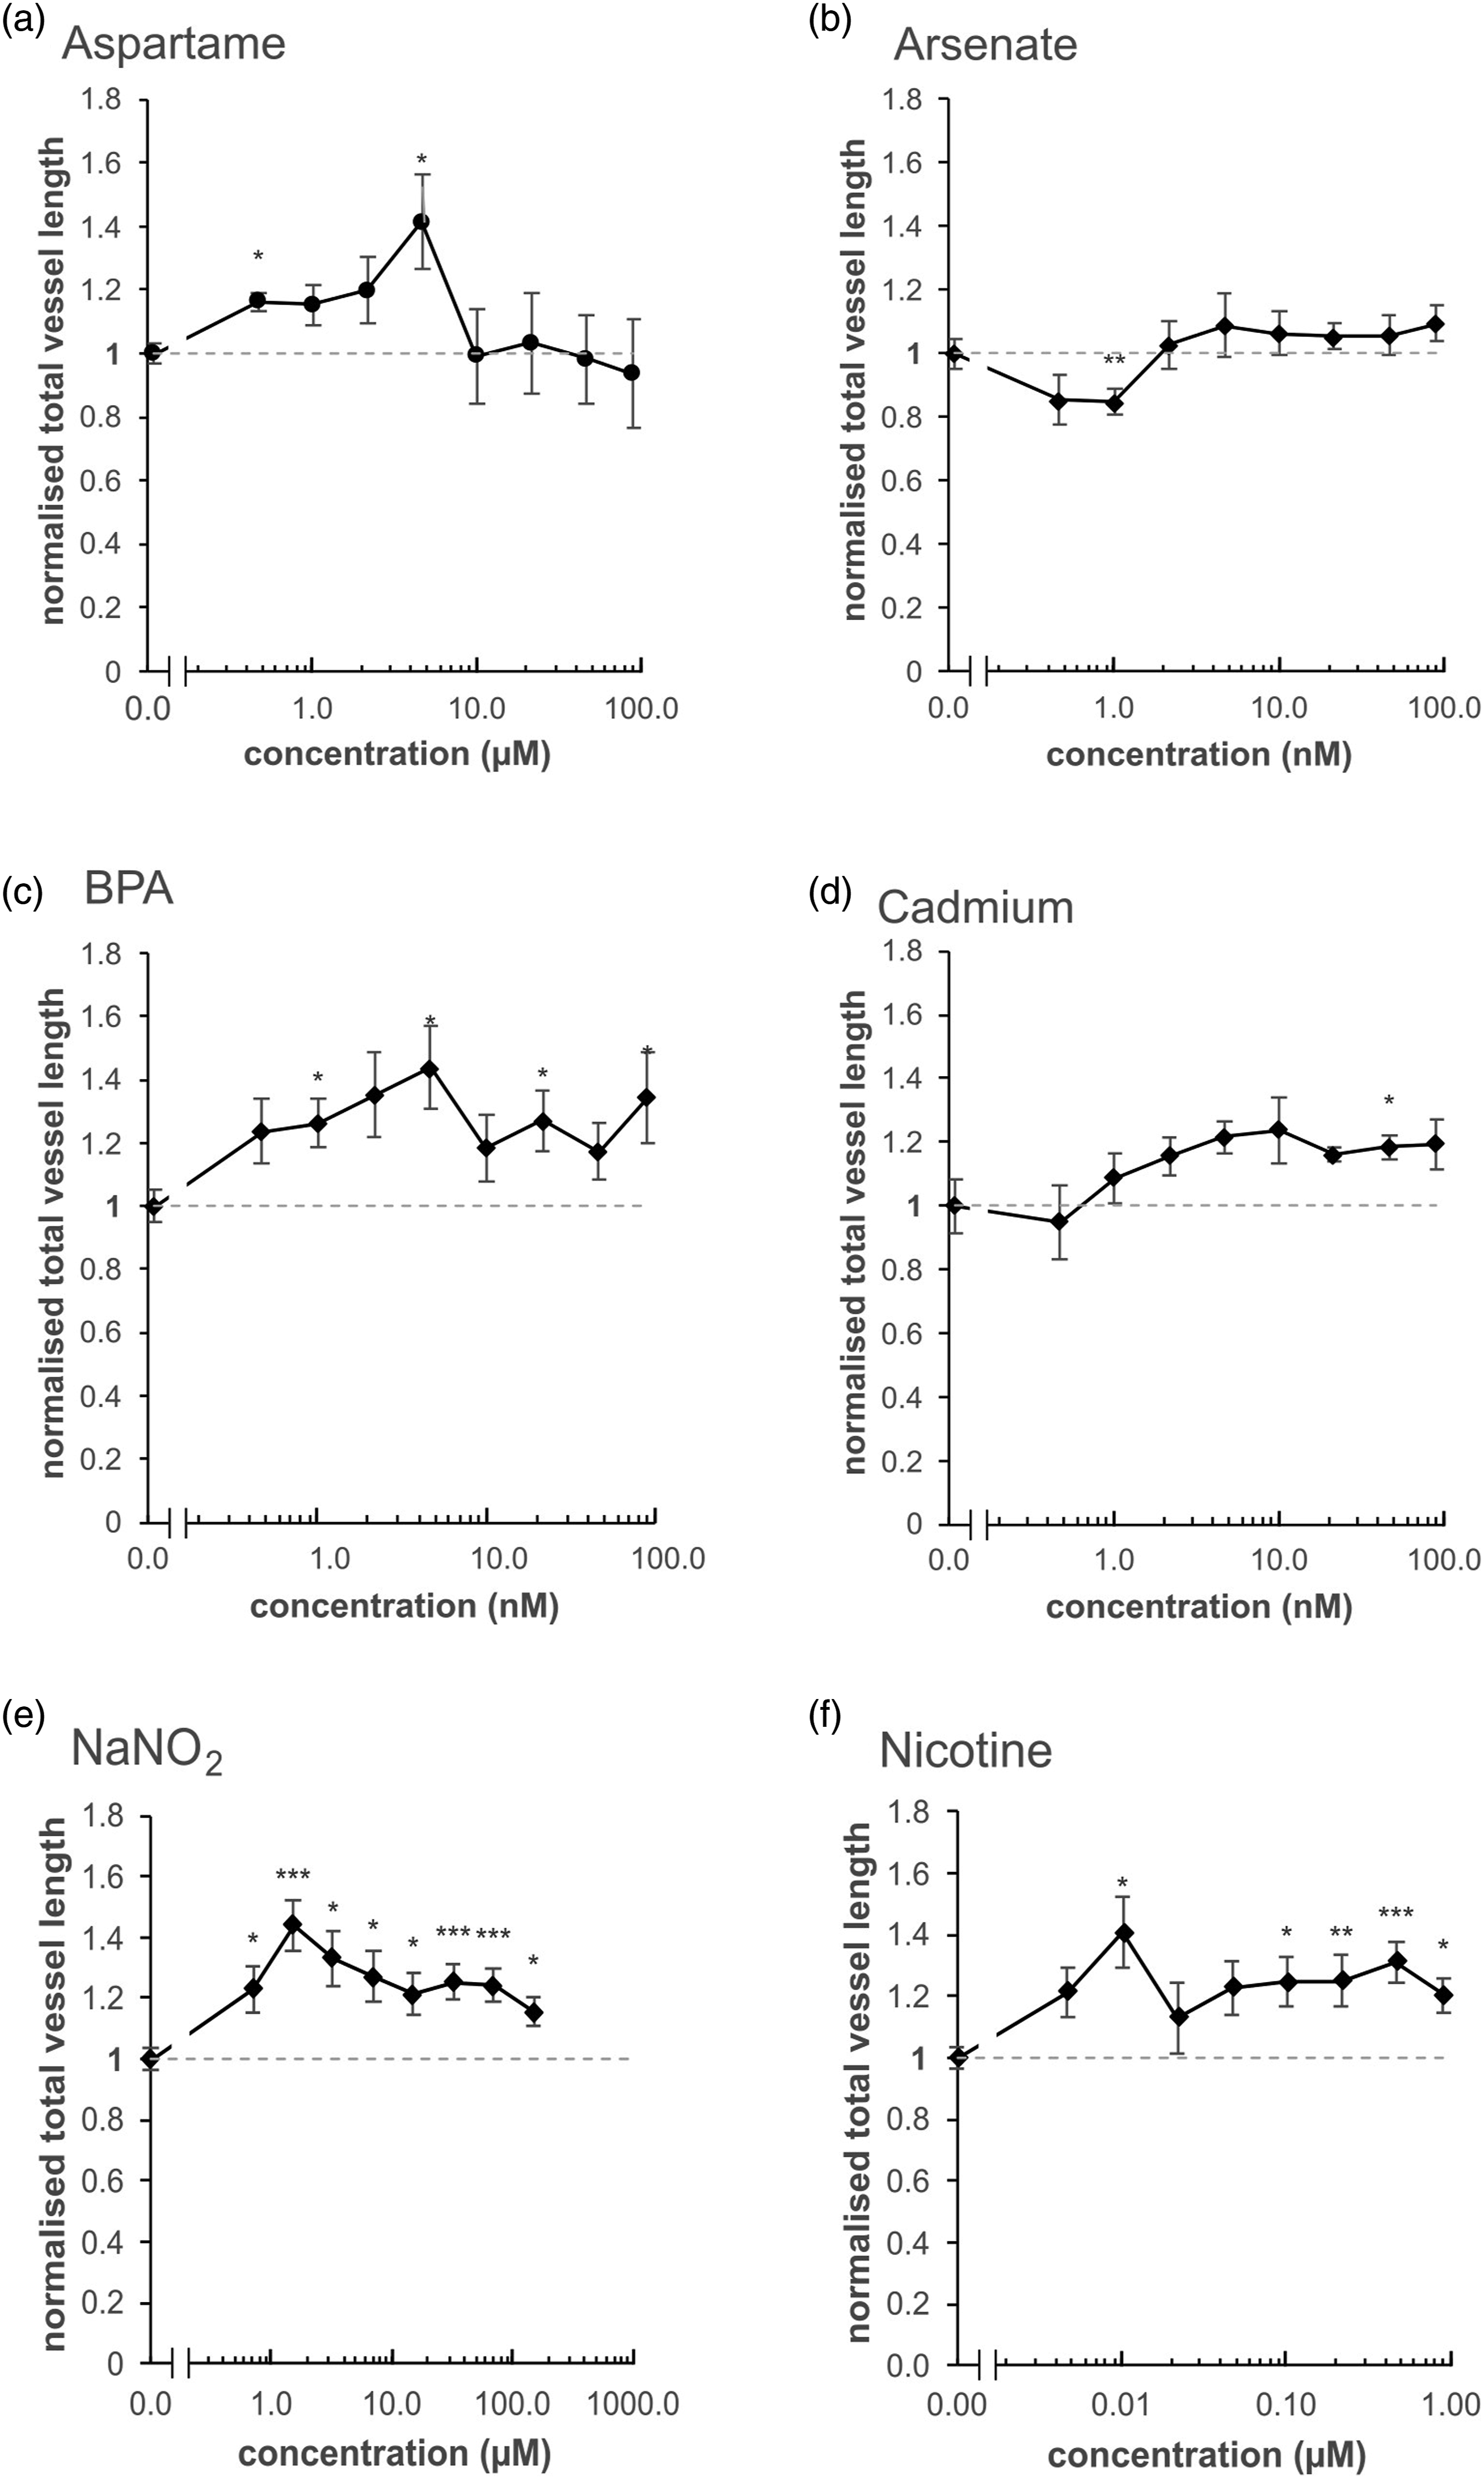
Total vessel length increased significantly for all of the NaNO2 concentrations (Figure 2e) and for most of the nicotine concentrations (Figure 2f). Half of the bisphenol A concentrations increased vessel length (Figure 2c) while, for cadmium and aspartame, only one out of eight or two out of eight concentrations, respectively, led to an increase (Figure 2a and d). Arsenate exposure did not lead to increased vessel length at any of the concentrations tested, but instead led to a significant decrease at one of the concentrations (Figure 2b). This indicates that, at least when using Protocol 1, arsenate exposure does not induce vasculogenesis, cadmium induces it only slightly, while NaNO2, nicotine and BPA exposure led to a marked induction of vasculature formation. However, all exposures to the reference chemicals led to rather small increases, but none displayed a linear dose dependency. Within the range of concentrations tested, none of the reference chemicals decreased viability significantly in the WST-1 cell viability assay, which was performed on cells from the same plates as the vessel length measurement (Supplemental Material, Figure S2). The repeatability of Protocol 1 was calculated from the negative controls of all plates and the pooled relative standard deviation percentage (RSD%) was 13%, indicating good repeatability. The positive controls induced significant vasculogenesis, indicating that the model was functional in terms of vascular formation under Protocol 1 conditions (Supplemental Material, Figure S3).
Evaluation of Protocol 2 and Protocol 3
To potentially generate a greater effect with regard to the induction of vasculogenesis and to enhance the detectability of any effect, two additional approaches were subsequently tested: i) the earlier and repeated exposure to the test chemicals (Protocol 2); and ii) decreasing the initial level of induced vasculature formation (Protocol 3). In Protocol 2, the test chemical exposure was started when establishing the coculture in EGM-2 medium, the day before the start of the assay (see Table 3). On Day 0 (the start of the assay), the EGM-2 medium was replaced with modified VAM stimulation solution containing the test chemical (i.e. further continuing exposure to the test chemical). Thus, in Protocol 2, the cells were exposed to the test chemicals twice.
In Protocol 3, the potential for various components in the culture medium to promote vasculogenesis was reduced, in order to increase the working range of the assay. Thus, the coculture was prepared in modified VAM stimulation solution instead of EGM-2 (which contains VEGF, FGF, IGF and EFG growth factors and FBS). The resulting decrease in the amount of animal-derived serum used in the assay also served to reduce any unwanted interactions between the test chemical and serum components, and to reduce potential variability due to serum batch differences.41,42 A fibrin coating was included, to prevent detachment of the newly formed vascular network from the bottom of the wells. This fibrin coating does not interfere with the imaging of the vascular structures.
For comparison of these conditions, Protocols 2 and 3 were performed on the same 48-well plate with three replicates, and 1 μM nicotine was used as the reference chemical. Nicotine was selected because, in Protocol 1, it showed clear induction of vasculogenesis. Modified VAM stimulation solution only was used as the negative control and 5 ng/ml VEGF-A plus 0.5 ng/ml FGF-β was used as the positive control (Figure 3). The comparison of Protocol 2 and Protocol 3, with 1 μM nicotine. In both Protocols 2 and 3, the cells were harvested in EGM-2 medium prior to the coculture step. In Protocol 2, the cells were plated and exposed to the chemicals in EGM-2 medium on Day –1, while in Protocol 3, this step was carried out in modified VAM stimulation solution. On Day 6, the cells were immunostained with anti-collagen IV and anti-von Willebrand factor antibodies and imaged as shown. a) All calculated vessel lengths were normalised to the Protocol 2 negative (solvent only) control (i.e. modified VAM stimulation solution) (CTRL) to compare the two protocols. Statistical significance was calculated against the 0 concentration for each protocol (*p < 0.05, **p < 0.01 and ***p < 0.001). b) The morphology of the vascular network produced with Protocols 2 and 3 after exposure to nicotine, as well as the positive control (PC) and the negative control (CTRL) for each, are shown. The green signal represents collagen IV expression and the red signal von Willebrand factor expression.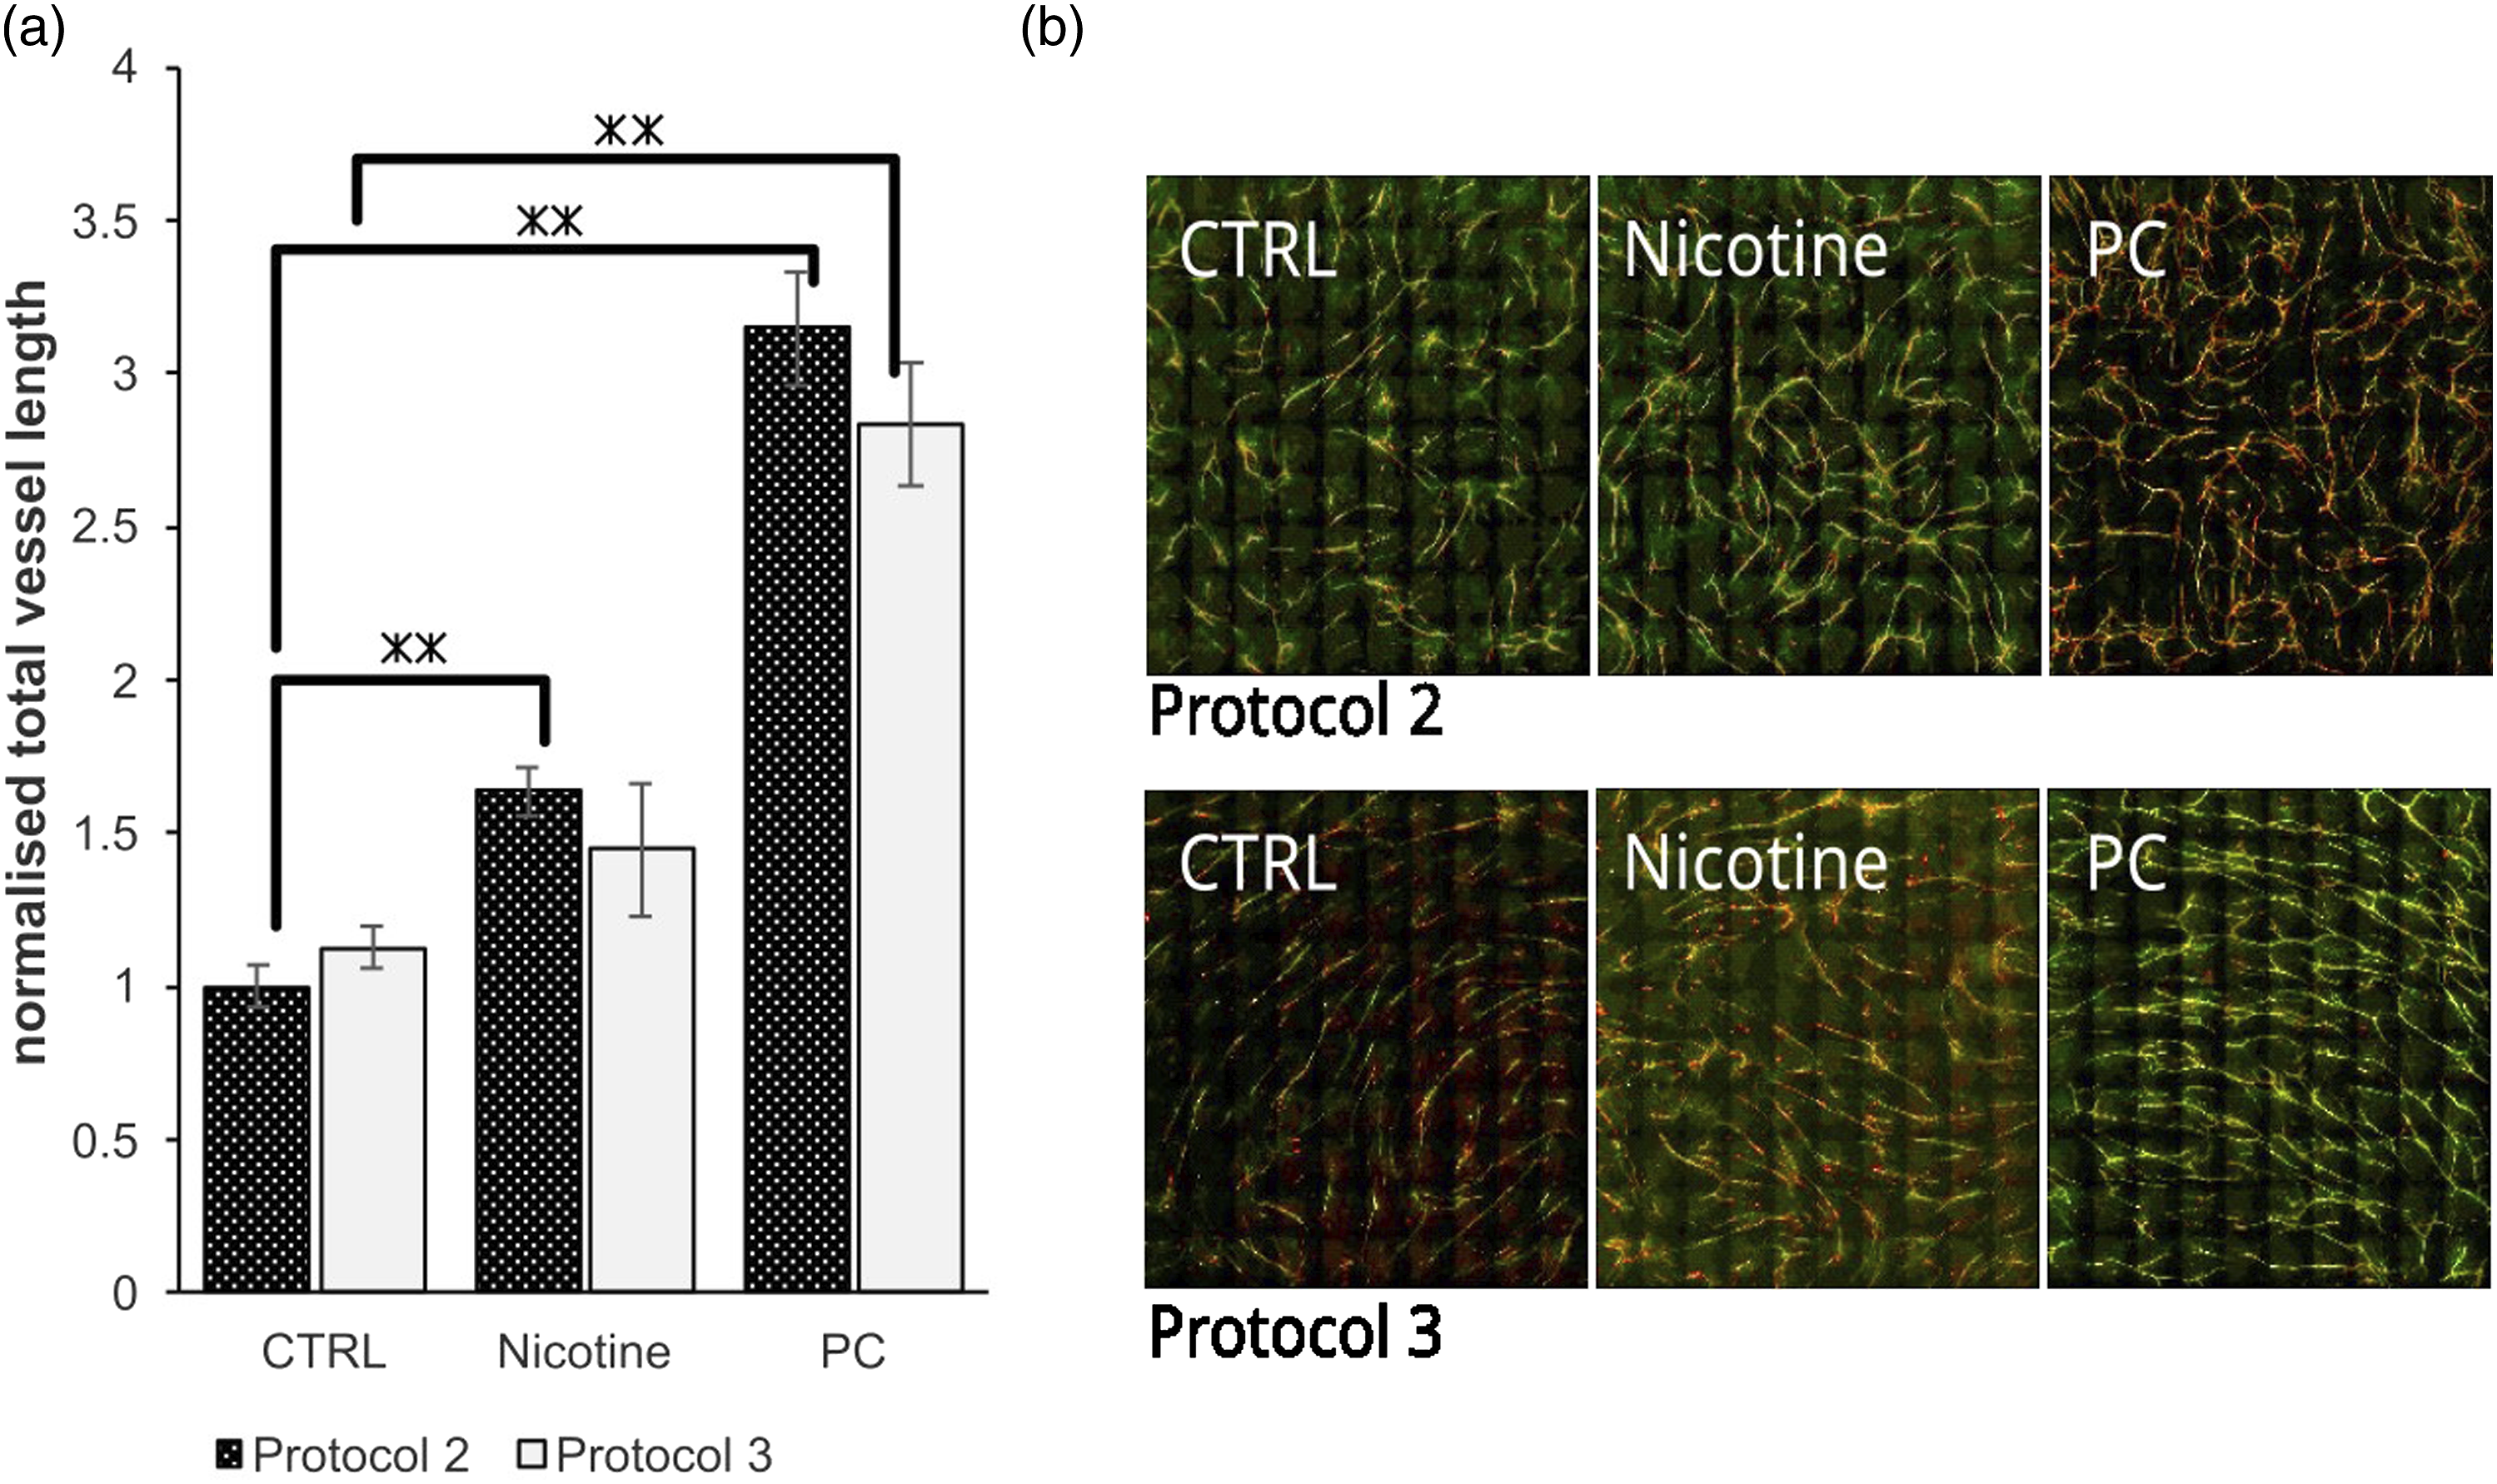
With both protocols, a clear increase in total vessel length was observed with the positive control (Figure 3a and b). Nicotine caused an increase in vessel formation with both protocols, but it was statistically significant only with Protocol 2 (Figure 3a), which might be due to the repeated exposure. The total vessel length of the respective negative controls was similar in both protocols (Figure 3a), even though, in Protocol 3, the coculture was prepared in modified VAM stimulation solution instead of EGM-2 (which contains growth factors and FBS). With both protocols, the cells were initially harvested and counted in EGM-2, thus the coculture in Protocol 3 would have had trace amounts of EGM-2 in its stimulation solution. Immunofluorescent staining (Figure 3b) shows slight structural differences in the tubules between the two protocols. In Protocol 2, the tubules were more spread out, while in Protocol 3, the tubules were oriented in the same direction. Based on this data, both protocols were approved for further testing with nicotine and NaNO2.
As the positive control was successfully able to induce vasculature formation in both Protocol 2 and Protocol 3, these conditions were re-tested with multiple concentrations of NaNO2 and nicotine as the reference chemicals. In Protocol 1, these two reference chemicals were shown to be the most potent inducers of vasculogenesis (Figure 2). The highest test concentration of nicotine was increased to 2 μM, to increase the possibility of greater induction levels. The dilution series was prepared with a 2.15 dilution factor for both chemicals, and to increase the number of replicates, the 48-well plate format was changed to a 96-well plate. The results for Protocol 2 and Protocol 3 are shown in Figures 4 and 5, respectively. In Protocol 2, NaNO2 and nicotine did not increase vessel length. On the contrary, they seemed to act as inhibitors, but no dose-dependent change in either direction was apparent (Figure 4). As shown in the Supplemental Material, Figure S4b, a clear tubule network is still formed in the solvent only control (i.e. modified VAM stimulation solution), possibly masking any induction of vasculature formation from the actual reference chemicals when using Protocol 2. Exposing the VAM to NaNO2 and to nicotine in Protocol 2. According to Protocol 2, the cocultures were exposed to the test chemicals twice: the first exposure took place in EGM-2 medium the day before the start of the assay (Day –1), and the second exposure took place in VAM stimulation solution on Day 0 (i.e. the start of the assay). Total vessel length was calculated by visualising the tubules with anti-von Willebrand factor antibody on Day 6. The graphs show total vessel length after normalisation to the negative (solvent only) control (i.e. modified VAM stimulation solution), which was attributed the value of 1 (indicated by the horizontal dashed line), after exposure to: a) NaNO2 (maximum concentration 150 μM), and b) nicotine (max. conc. 2 μM). For each concentration, standard error of the mean (average normalised total vessel length mean ± SEM from six replicates in one experiment) and the statistical significance with respect to the negative control were calculated (*p < 0.05, **p < 0.01 and ***p < 0.001). Exposing the VAM to NaNO2 and to nicotine in Protocols 3A and 3B. In Protocol 3, the coculture was prepared in modified VAM stimulation solution on fibrin-coated plates. Prior to coculture, the cells were harvested and counted in either EGM-2 medium (Protocol 3A) or in the modified VAM stimulation solution (Protocol 3B). Total vessel length was calculated by visualising the tubules with anti-von Willebrand factor antibody on Day 6. The Protocol 3A results are from: a) cells collected in EGM-2 and exposed to NaNO2 (maximum concentration 150 μM), and b) cells collected in EGM-2 and exposed to nicotine (max. conc. 2 μM). The Protocol 3B results are from: c) cells harvested and counted in modified VAM stimulation solution and exposed to NaNO2 (max. conc. 150 μM), and d) cells harvested and counted in modified VAM stimulation solution and exposed to nicotine (max. conc. 2 μM). Total vessel length was normalised against the respective negative (solvent only) control (i.e. modified VAM stimulation solution), which was attributed the value of 1 (as indicated by the horizontal dashed line). For each reference chemical concentration, standard error of the mean (average normalised total vessel length mean ± SEM from six replicates of one experiment) and statistical significance was calculated with respect to the negative control (*p < 0.05, **p < 0.01 and ***p < 0.001). Positive controls are not presented in these graphs, in order to improve the readability of the effects of the reference chemicals.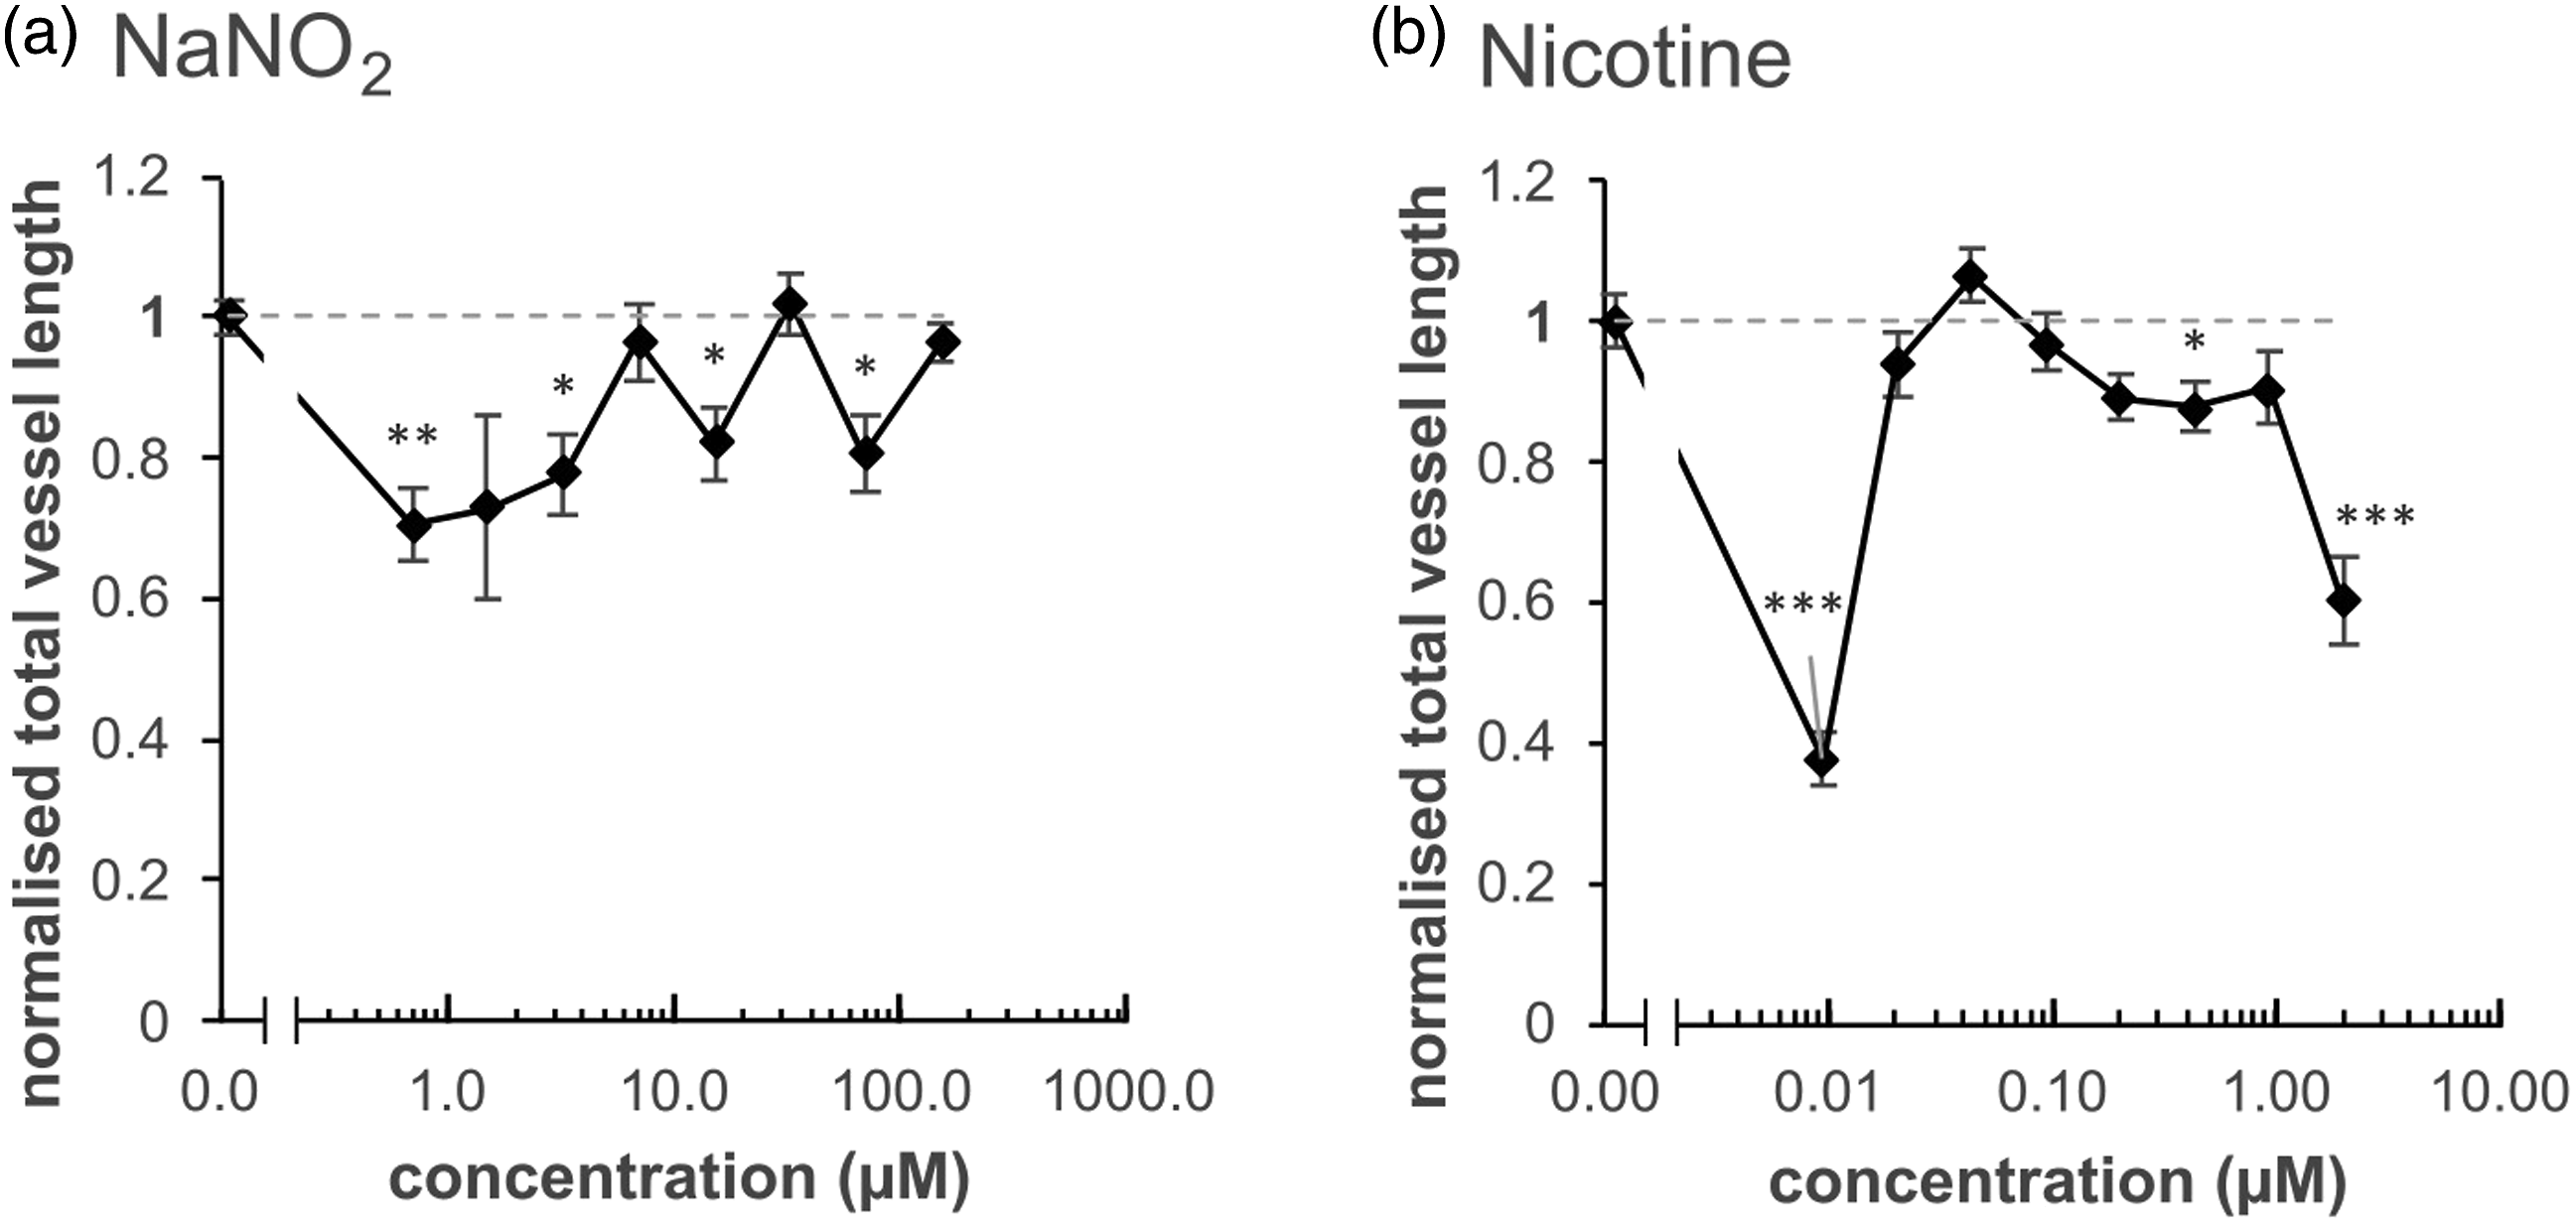
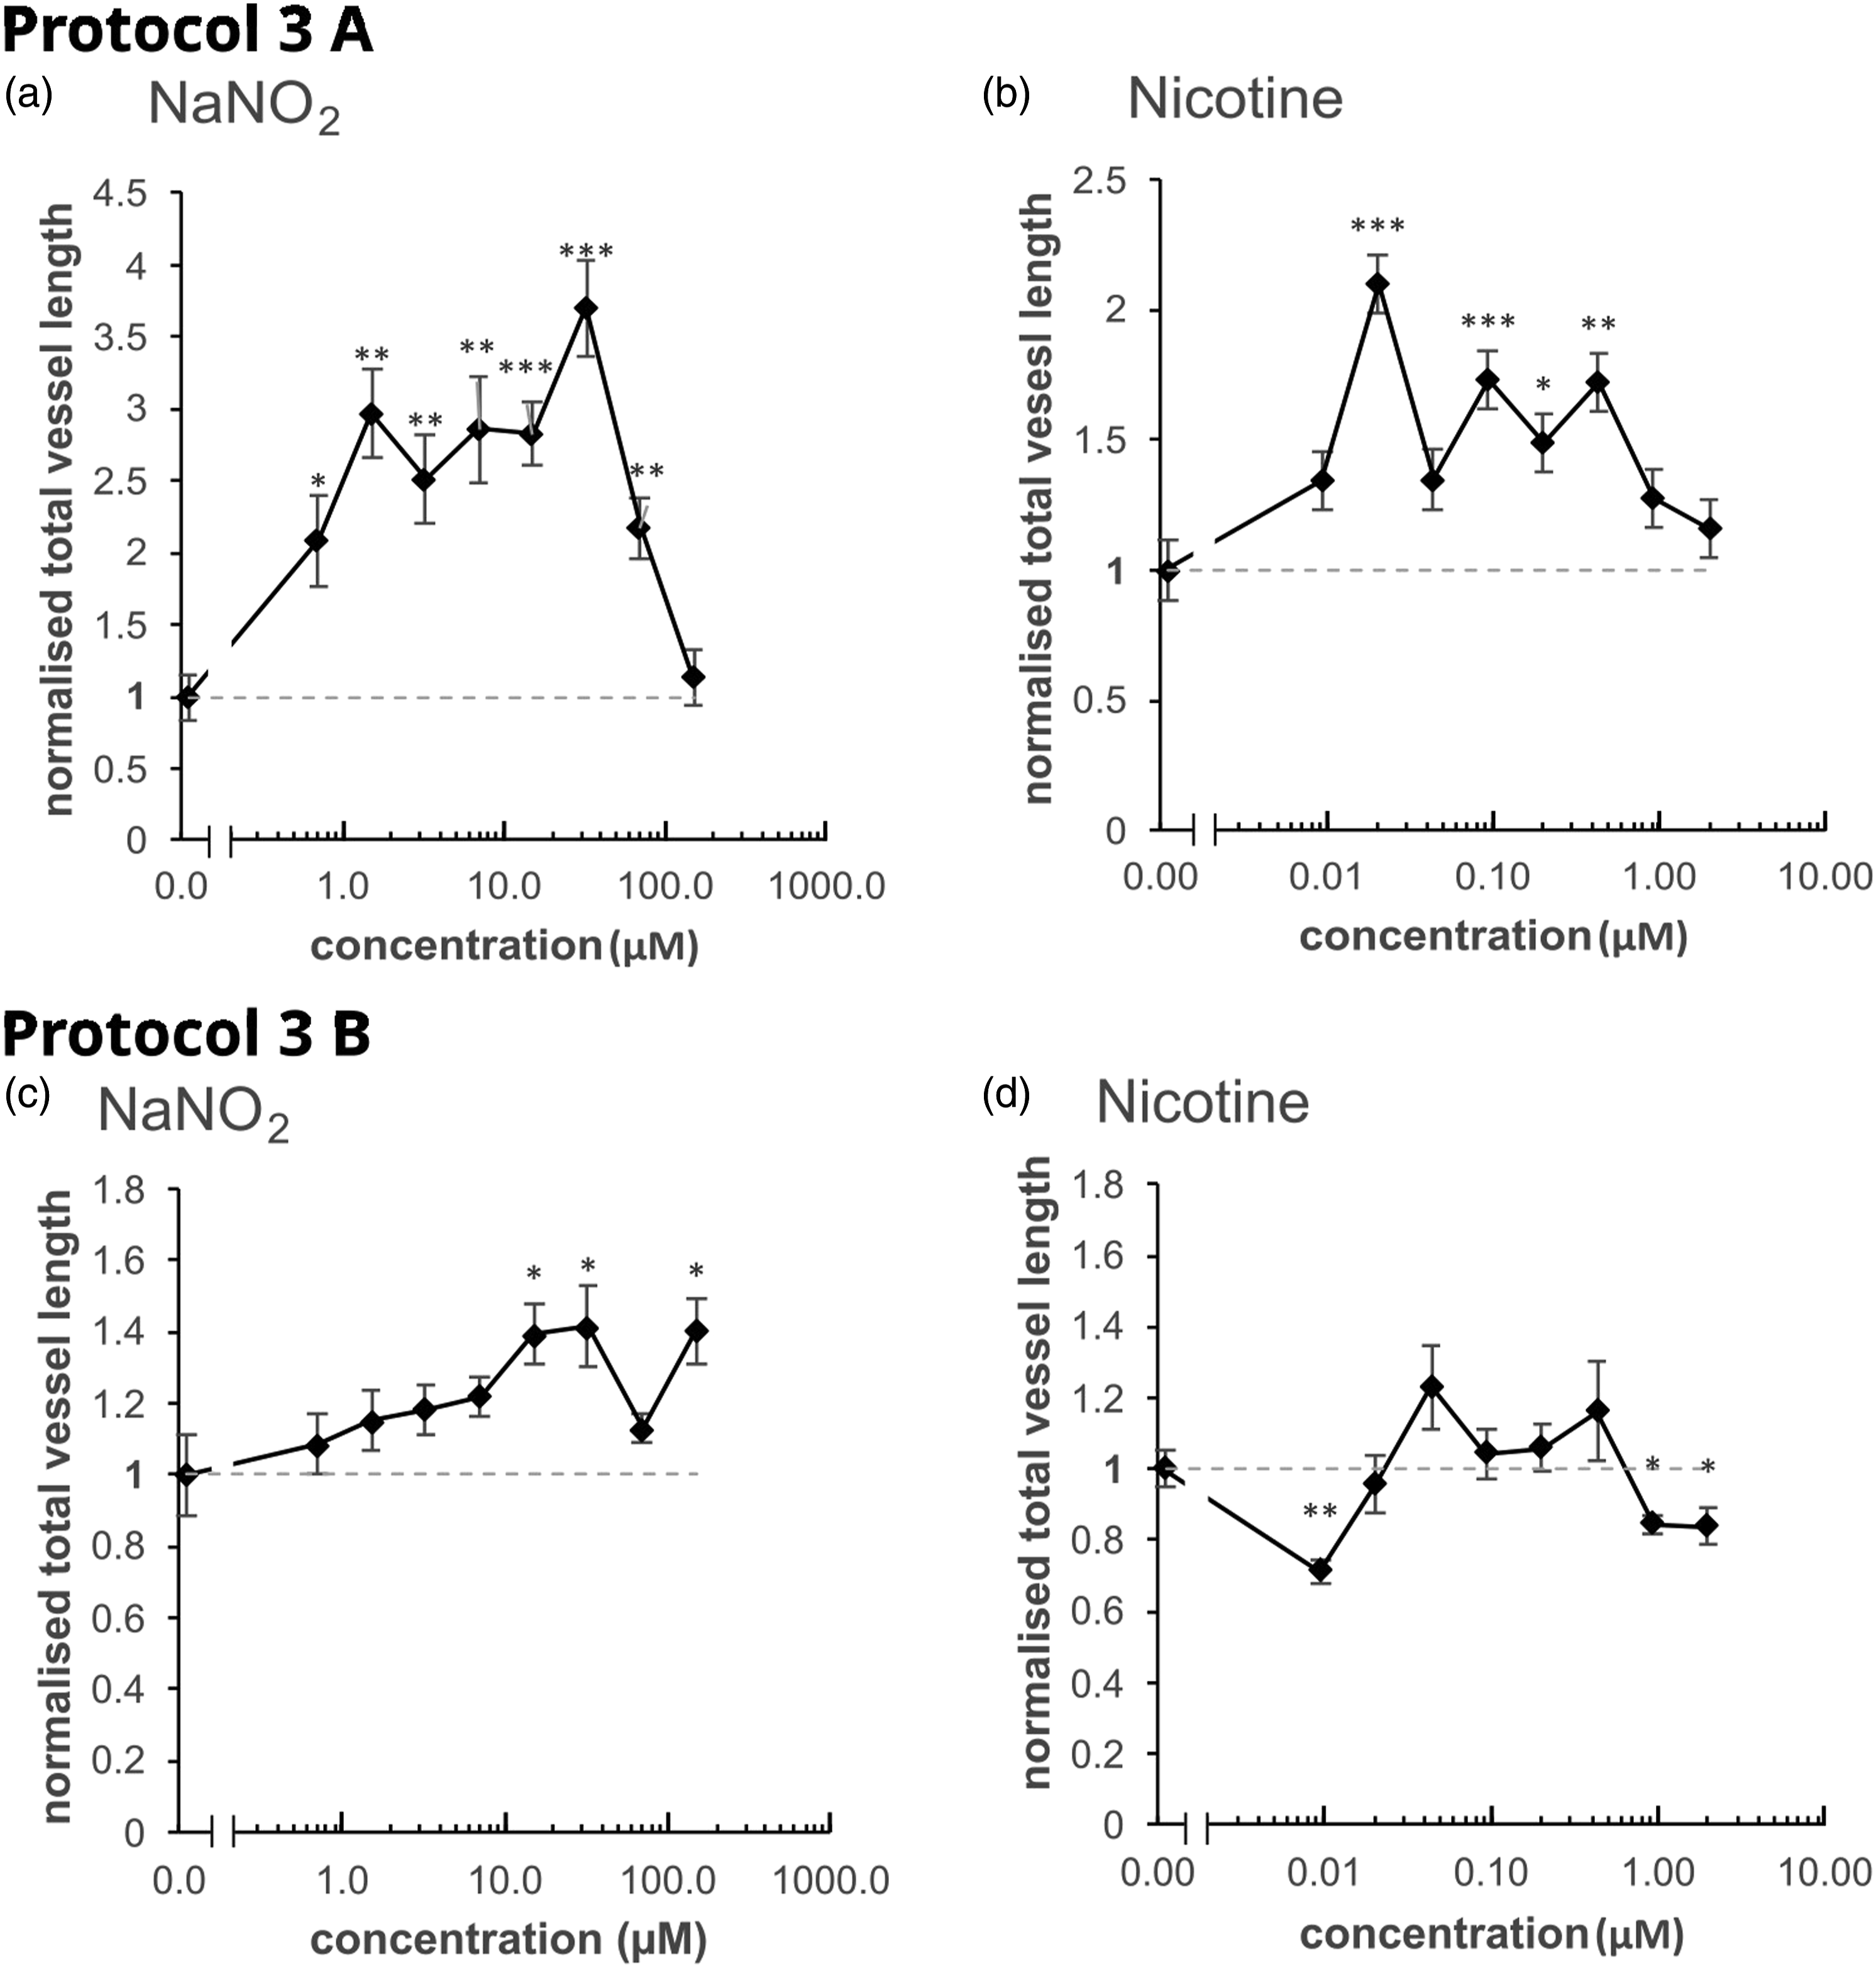
Subdivision of Protocol 3 into 3A and 3B for further evaluation
Protocol 3 investigated the effects of reduced serum and growth factors in the coculture medium. Further subdivision of this protocol was carried out, in which the cells were harvested and counted in either: EGM-2 (2% serum and growth factors) (Protocol 3A; Figure 5a and b); or in modified VAM stimulation solution (no serum or growth factors) (Protocol 3B; Figure 5c and d). When the cells were harvested and counted in EGM-2, residual amounts of growth factors and serum would have been carried over when the cells were transferred into the modified VAM stimulation solution for the coculture step. In this experiment, the level of transferred EGM-2 in the modified VAM stimulation solution was 1.55%. This trace amount of EGM-2 significantly increased tubule network formation in Protocol 3A in the solvent only control (i.e. modified VAM stimulation solution), as compared to Protocol 3B (see Supplemental Material, Figures S4c and d, respectively).
When the cells were harvested in EGM-2 (Protocol 3A), a clear induction of vascular formation with NaNO2 (Figure 5a) was observed, and some increase was also observed with nicotine (Figure 5b). When the cells were harvested in modified VAM stimulation solution (Protocol 3B), the changes were much less pronounced when normalised to the respective solvent only controls (i.e. modified VAM stimulation solution) (Figure 5c and d). NaNO2 exposure showed a dose-responsive induction of vascular formation (Figure 5c), while the effect of nicotine was inconclusive (Figure 5d). The low level of vasculature formation when cells were both harvested and cocultured in the modified VAM simulation solution (i.e. without serum) may indicate the need for a type of ‘booster’ of the vasculogenesis process, in order to promote its induction by the test chemicals.
Based on these comparisons, Protocol 3A, in which the cells are harvested and counted in EGM-2 (Figure 5a and b), appears a better choice than Protocol 3B, which uses modified VAM stimulation medium for this step (Figure 5c and d).
Overall comparison of the four protocols
An overall comparison of the four protocols for NaNO2 and nicotine is shown in Figure 6a and b. It is evident from the combined data that the use of Protocol 3A results in the greatest level of induction of vasculogenesis with these two reference chemicals. Also, under Protocol 3A conditions, the general extent of induction was higher after exposure to NaNO2 than to nicotine. Thus, according to these data, NaNO2 appears to be a more potent inducer of vasculature formation than nicotine. Normalised total vessel length resulting from exposure to either NaNO2 or nicotine, in the four different protocols under evaluation. The data sets for the normalised total vessel length obtained by using the four different protocols are shown for a) NaNO2 and b) nicotine. The data were normalised against the relevant negative (solvent only) control, which was attributed the value of 1 (as indicated by the horizontal dashed line). The error bars and asterisks were omitted for clarity, but the datapoints are the same as those in Figures 2, 4 and 5.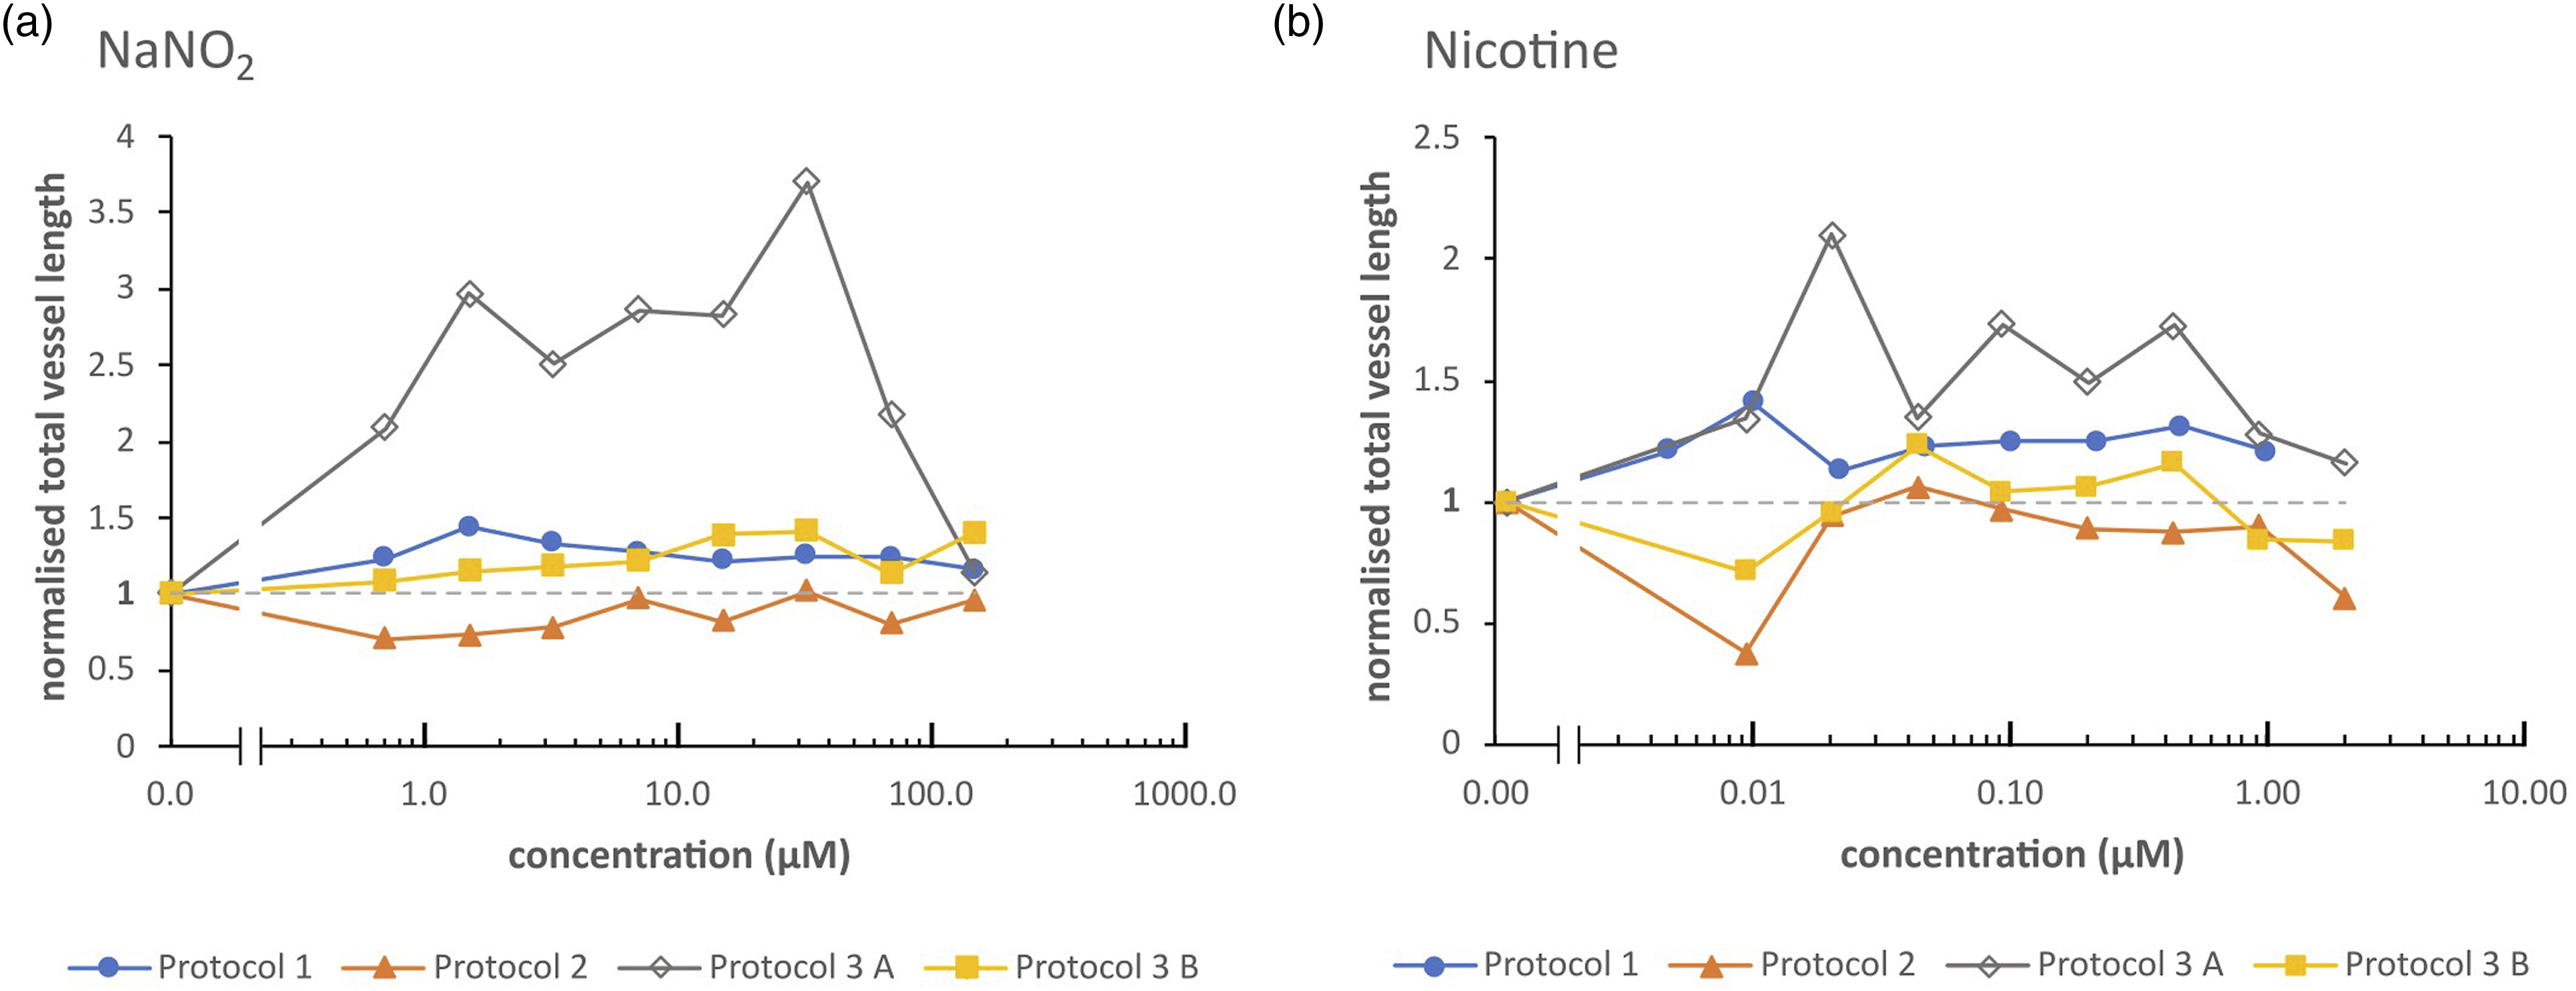
Discussion
The standardised vasculogenesis/angiogenesis model (VAM) 9 used in this study consists of a coculture of HUVECs and hASCs. HUVECs are healthy endothelial cells that are commonly used in simple, as well as complex, 3-D models of the healthy human endothelium. 50 HUVECs can be purchased from commercial sources, but often they are isolated from umbilical cord vein by the actual laboratory performing the study. In these cases, the laboratory must comply with certain standardised conditions, and specific quality control parameters should be employed — for example, adherence to the optimal passage number in order to ensure assay reproducibility. 9
In an earlier study, we showed that HUVECs and hASCs in coculture, and in the presence of a certain growth factor cocktail, formed a dense vascular network over a six-day culture period. 38 Characterisation, by using immunofluorescent staining and scanning electron microscopy, showed features of mature vasculature, including extracellular matrix, junctions, mature and young endothelial cells, smooth muscle cells and pericytes.39,40 Thus, these HUVECs in coculture with hASCs offer a phenotypically accurate readout that could indicate the direct interference of a chemical with vasculogenic and angiogenic signalling processes.38,40 So far, the VAM has been optimised and validated for the purpose of embryonic/fetal toxicity testing, to test the potential of chemicals to inhibit vasculogenesis and angiogenesis. 9 Furthermore, this test method is currently being validated by EURL ECVAM for the detection of thyroid disrupting agents. 39
Development of the new assay method
To obtain an assay method that is adequate for use in next generation risk assessment, the method should be characterised, reproducible, repeatable and relevant for the assessment of effects on human health for a specific endpoint. In the current study, this is represented by the induction of vasculogenesis as a hallmark of non-genotoxic carcinogenicity. Here, we developed and compared three protocols utilising hASC and HUVEC coculture to assess the induction of vasculature formation. As the protocols were based on the standardised VAM inhibition model, 9 it was unnecessary to characterise and standardise the basic cell culture conditions (such as optimal passage numbers for the HUVECs and hASCs and the vasculature quantification method). However, it was necessary to determine conditions that enabled the induction of vasculature formation to be detected over a wide range.
To try to achieve this goal, the initial change was to decrease the level of growth factors present in the test chemical exposure medium (i.e. modified VAM stimulation solution (without growth factors) was used for this exposure step in Protocol 1). The use of this protocol led to a tendency toward increased vasculature formation being observable for five out of the six reference chemicals — however, the observed increase was fairly low (Figure 2).
The next change (in Protocol 2) was to begin the test chemical exposure at an earlier stage, i.e. at the same time as the establishment of the coculture on the day prior to the usual start of the assay. In Protocol 2, no induction of vasculogenesis was observed with the reference chemicals NaNO2 and nicotine (Figure 4).
In the third protocol modification, the aim was to reduce the amount of animal-derived serum used in the assay (Protocol 3). Protocol 3 was further subdivided into Protocol 3A (where the cells were harvested and counted in EGM-2 (containing serum and growth factors) but were cocultured in modified VAM stimulation solution containing none of these components) and Protocol 3B (where both of these steps were carried out in modified VAM stimulation solution). Both protocols 3A and 3B led to the clear induction of vasculature formation with the reference chemicals (Figure 5). Of these two protocols, the use of Protocol 3A resulted in the greatest level of vasculogenesis induction, in comparison to the respective solvent only controls (i.e. modified VAM stimulation solution) (Figure 6). It should be noted that, in the case of Protocol 3A, residual amounts of serum and growth factors would have been present in the coculture, as a result of carry-over from harvesting the cells in EGM-2. However, these residual amounts transferred to the coculture would vary, depending on the harvested cell density and thus the seeding volume.
Thus, although Protocol 3A appears to be very promising, it requires further optimisation with regard to these components, and it would also need further evaluation with a larger set of positive and negative reference chemicals.
The importance of the initial vascular network density
Vasculature formation in the negative (solvent only) controls (i.e. modified VAM stimulation solution) was analysed and compared, in order to assess the extent of basal (i.e. uninduced) vasculature formation under each set of conditions (Supplemental Material, Figure S4). In Protocol 1 and Protocol 2, well-structured vascular networks were formed. Protocol 3A resulted in the formation of sparse vascular tubules around the plate, with few junctions formed; Protocol 3B led to the formation of very few vascular structures. The greatest level of observable vasculature formation induced by subsequent exposure to NaNO2 and to nicotine was seen with Protocol 3A, indicating that this sparse initial level of vasculature formation was optimal in this respect. Protocols 1 and 2 led to the formation of vascular networks that may have been too dense, thus potentially masking any vasculature formation induced by the reference chemicals. Protocol 3B may have resulted in an initial vasculature formation that was too low or lacked structural stability due to the absence of serum (Supplemental Material, Figure S4). Based on the positive control data, however, induction of vasculogenesis with the growth factor cocktail was successful in all four evaluated protocols (Supplemental Material, Figure S3). In Protocol 1 and Protocol 3A, the extent of induction in the positive control was close in range to that of the reference chemicals (Figures 2 and 5), thus supporting the correct choice of these chemicals for the purpose of this study.
Consideration of the potential mechanisms involved
The possible mechanisms by which chemicals may induce angiogenesis are numerous — from ligand binding to influencing gene expression, or by modifying enzymes and proteins in signalling networks. The vascular VEGF-A/VEGFR2-signalling pathway network has been shown to be a crucial regulator of angiogenesis, both under normal conditions and in disease states.51,52 VEGFs act together with FGFs through ligand-stimulable tyrosine kinase receptors, functioning as the main regulator proteins of angiogenic activity. 53 The ligand family of both VEGF and FGF contains several isoforms 53 involved in signalling networks that participate in vasculature formation. Thus, a wide range of targets are available for chemicals to interact with, which could lead to the disruption of the various pathways and networks associated with the formation and maintenance of the vascular system. Our proposed model could be useful in elucidating the complex mechanisms involved in the induction of vasculature formation.
In the current study, selection of the reference chemicals aspartame, sodium nitrite, bisphenol A, nicotine, arsenic and cadmium was based on literature indicating that they might possess angiogenic induction capacity.44–49 Of the chemicals tested with Protocol 1, aspartame, sodium nitrite, nicotine and bisphenol A induced significant vasculature formation. The two other test chemicals — arsenic and cadmium — showed only a slight tendency in this respect.
Aspartame induces the formation of vasculature by inducing regenerative cytokine production leading to the activation of mitogen-activated protein kinases (MAPKs). 45 Sodium nitrite has been observed to be an angiogenic inducer in HUVECs in vitro and in the chick chorioallantoic membrane (CAM) test, 44 as well as increasing ischaemic limb vascular density and stimulating endothelial cell proliferation. 54 The proangiogenic mechanism of bisphenol A in HUVECs is mediated via upregulation of the proangiogenic factors VEGFR-2, VEGF-A, endothelial nitric oxide synthase (eNOS) and Cx43; BPA treatment also increased NO production. 47 The mechanisms behind nicotine-induced angiogenesis, which were studied in certain adenocarcinoma and squamous cell carcinoma cells, are linked to the nicotinic acetylcholine receptor (nAChR)-mediated activation of multiple signalling pathways. 46 With cadmium and arsenic, one key proangiogenic mechanism is proposed to be the activation of the MAPK signalling transduction cascade. 49 The effect of cadmium in tumour angiogenesis can be either stimulatory or inhibitory, depending on the concentration. 49
In order to further study how these pathways are affected after the chemical exposure of our model, omics-based approaches could be utilised. However, because the model is used to identify chemicals that cause morphological changes (i.e. the induction of vasculature formation), we do not consider this type of approach to be a necessary part of the basic protocol. However, omics-based approaches would definitely represent useful additions to the basic protocol, when studying the mechanisms of action of chemicals on vascular induction. The successful linking of omics read-outs with functional endpoints in the HUVEC/hASC coculture system would require further in vitro studies. However, this type of approach — termed ‘phenotypic anchoring’ of mechanistic omics data11,55 — may indeed prove to be one of the most convincing for regulators.
Conclusion
In summary, various models are available to study vasculogenesis and angiogenesis in healthy tissues, including in vitro models for endothelial cell proliferation, migration and (mechanistically, the most comprehensive) tubule formation, as well as ex vivo and in vivo models based on chicken, zebrafish or rodents. 20 The assay developed in this study, which uses an established HUVEC/hASC coculture-based vasculogenesis/angiogenesis model (VAM), 9 offers one potential method to investigate the potential of chemicals to induce vasculature formation, which may be a hallmark of non-genotoxic carcinogenesis.
Supplemental Material
Supplemental Material - A Human Cell-based Assay to Assess the Induction of Vasculature Formation for Non-genotoxic Carcinogenicity Testing Purposes: A Pilot Study
Supplemental Material for A Human Cell-based Assay to Assess the Induction of Vasculature Formation for Non-genotoxic Carcinogenicity Testing Purposes: A Pilot Study by Veera Hautanen, Tarja Toimela, Martin Paparella, and Tuula Heinonen in Alternatives to Laboratory Animals
Footnotes
Acknowledgements
We would like to give special thanks to Professor Anne Kallioniemi for her support and background knowledge during the optimisation of the models. In addition, we would like to thank all co-workers who helped during the practical work in laboratory.
Declaration of Conflicting Interests
The author(s) declared no potential conflicts of interest with respect to the research, authorship, and/or publication of this article.
Funding
The author(s) disclosed receipt of the following financial support for the research, authorship, and/or publication of this article: The Finnish Concordia Fund (3132020); Juliana von Wendt Fund for Research Without Animal Experiments (1052019); Tor, Joe and Pentti Borg (1262020) and Austrian Federal Ministry for Climate Action, Environment, Energy, Mobility, Innovation and Technology, Department V/5 – Chemicals Policy and Biocides (Grand M01: 2021-0.147.112, V/5).
Supplemental Material
Supplemental material for this article is available online.
References
Supplementary Material
Please find the following supplemental material available below.
For Open Access articles published under a Creative Commons License, all supplemental material carries the same license as the article it is associated with.
For non-Open Access articles published, all supplemental material carries a non-exclusive license, and permission requests for re-use of supplemental material or any part of supplemental material shall be sent directly to the copyright owner as specified in the copyright notice associated with the article.