
Abstract
The prediction of human toxicities from animal toxicity tests is often poor, and is now discouraged and in some cases banned, especially those involving the LD50 test. However, there is a vast number of historical LD50 data in both public and in-house repositories that are being put to little use. This study examined the correlations between human lethality (doses and concentrations) of 36 MEIC chemicals and the median values of a large number of mouse and rat LD50 values obtained for four different routes of administration. The best correlations were found with mouse and rat intraperitoneal LD50 values (r2 = 0.838 and 0.810 for human lethal dose, and r2 = 0.753 and 0.785 for human lethal concentration). The results show that excellent prediction of human lethal dose and concentration can be made, for this series of chemicals at least, by using uncurated rodent LD50 values, thus offering some reparation for the millions of rodent lives sacrificed in LD50 testing.
Introduction
Rodent acute toxicity is a standard requirement in the assessment of the potential acute toxicity of chemicals to humans. 1 However, the correlation of rodent toxicity with human lethal dose (HLD) is often low. 2,3 Many factors can affect rodent toxicity values, such as species, genetic variability, age, sex, weight, health, diet, administration route, time of assessment after administration, ambient temperature, housing conditions (e.g. isolated or aggregated), time of day/night and time of year. 4 Many of these factors also apply to assessments of HLD values, and thus contribute to uncertainty concerning their accuracy.
Furthermore, concern has been expressed for many years about the use of animals in toxicity testing as a proxy for toxicity in humans, nowhere more so than in regard to lethality tests such as the LD50 test, which determines the dose of a chemical that will kill 50% of test animals in a given time. Because of this concern, many efforts have been made to find acceptable substitutes for the rodent LD50 test, such as in vitro cytotoxicity assays. 5 –11
Bernson et al. 12 proposed a ‘Multicentre Evaluation Study of In vitro Cytotoxicity’ (MEIC), based on a set of 50 very diverse organic and inorganic chemicals. The MEIC chemicals, as they came to be known, have been widely studied. Indeed, it is fair to say that the 50 chemicals can be regarded as a gold standard data set. Ekwall et al. 13 examined the human and rodent acute oral toxicities of the first 10 of these chemicals, and found excellent correlations. They did not give correlation statistics, but from their data, the coefficients of determination r2 were calculated by the present authors to be 0.917 for human versus mouse oral toxicities and 0.836 for human versus rat oral toxicities. A similar study was carried out 14 on the same 10 chemicals; this study did not give HLD or rodent LD50 data, but reported that the human versus mouse oral correlation had a lower prediction error (0.68 log units) than had the human versus rat oral correlation (1.04 log units). For 39 MEIC chemicals, Calleja et al. 15 reported prediction errors of 0.57 log units for the human versus mouse oral LD50 correlation and 0.61 log units for the human versus rat oral LD50 correlation. Similar prediction errors for a slightly smaller set of MEIC chemicals were reported by Calleja et al. 16
Weiss and Sawyer 17 examined human–rodent acute toxicity correlations for the 27 chemicals for which they could find human lethal dosages (HLDs) from the 50 MEIC chemicals. They used mouse (M) and rat (R), oral (or) and intraperitoneal (ip), LD50 values, and gave the Spearman’s Rank coefficients as: Mor = 0.737, Mip = 0.597, Ror = 0.676 and Rip = 0.439, again indicating that the mouse was a better model for the prediction of HLD.
Ekwall et al. 18 published rodent and human toxicity data for the 50 MEIC chemicals, and Ekwall et al. 2 used those rodent LD50 values and results from 61 in vitro methods to predict HLD values of the 50 MEIC chemicals. They found that mouse oral LD50 values correlated reasonably well with HLD (coefficient of determination r 2 = 0.65), while rat oral LD50 values gave a somewhat poorer correlation with HLD (r 2 = 0.61), again indicating that the mouse is a better model than the rat for HLD prediction. Lessigiarska et al. 19 also found that mouse oral LD50 values correlated better (r 2 = 0.683) than did rat oral LD50 values (r 2 = 0.627) with HLD for 25 MEIC chemicals.
Although the primary aim of the MEIC studies was to examine whether cytotoxicity data could replace rodent LD50 values, recent work 11,20 indicates that the apparent inherent lack of reliability in some in vitro data is an additional reason that the use of cytotoxicity alone may not be enough to model acute toxicity. There is also, of course, much variability in rodent LD50 values. Karmaus et al. 21 have recently pointed out that “in vivo acute systemic toxicity studies can produce variable results, even when conducted according to accepted test guidelines.” They examined over 21,000 rat oral LD50 values, and found that some chemicals had reported LD50 values ranging over at least three orders of magnitude.
It is clear that mouse and rat oral LD50 values correlate reasonably well with HLD values for the MEIC chemicals. However, with the exception of the work of Weiss and Sawyer, 17 there does not appear to have been any investigation of whether rodent LD50 values obtained using other routes of administration correlate better with HLD values of the MEIC chemicals.
Using average rodent LD50 values, calculated from a very large number of published values, covering mouse and rat oral, intraperitoneal and intravenous routes of administration, Dearden 22 found that the best correlations of HLD values for up to 18 psychoactive drugs were with mouse subcutaneous (n = 10, r 2 = 0.842), rat intravenous (n = 14, r 2 = 0.823) and mouse intravenous (n = 18, r 2 = 0.756) LD50 values. All other HLD–rodent LD50 correlations had r 2 < 0.6.
It should be mentioned that Nendza et al. 23 stated that while “in silico predictions must include an assessment of the error range of experimental (individual) data quality,” they also commented that “less reliable data can still be adequate for risk assessment in combination with other evidence. The pooling of several studies, one or more of which may be inadequate by itself, may collectively satisfy the overall requirement for valid data.” That is probably why the average rodent LD50 values used by Dearden 22 gave such good HLD predictions.
The HLD–rodent LD50 correlations for the MEIC chemicals discussed above are reasonable but not good, with the exception of those obtained from Ekwall et al., 13 which could be high because they were based on only 10 chemicals. Encouraged by the results obtained by Dearden 22 using averaged rodent LD50 values to predict the HLD values of psychoactive drugs, an attempt is made in the present study to use median LD50 values for the MEIC chemicals to try to improve HLD predictions. Median rather than average LD50 values are used, 7 as they place less weight on the contributions of extreme values. 24 Although the MEIC data set is relatively small, it is very diverse, representing many closely-studied chemical classes having a wide range of physicochemical and other properties. It is therefore appropriate to use this data set to test the hypothesis that median rodent LD50 values can be used to predict HLD values well. Future work could expand upon the MEIC data set, in order to validate the results of the present study.
It is stressed that this work is an attempt to make some reparation for the millions of rodents sacrificed over many decades, often for little or no purpose. It exemplifies how existing data can be used to derive new insights, and in no way does it imply that more rodent LD50 tests should be performed. Madden et al. 25 recently reviewed the use of in silico approaches, such as quantitative structure–activity relationships (QSARs), as alternatives to animal testing, wherein predictions are based on models incorporating molecular structural information. The present study demonstrates the application of an analogous concept — namely, quantitative activity–activity relationships (QAARs). In this approach, new knowledge is derived from existing data from one species to make predictions for another. Maximising the use of data available from in-house or public repositories conforms to the Three Rs principles. 26
It is noted that Bailey and Balls 27 recently stated that: “We reiterate that we welcome any objective efforts to shed light on the value — or lack of value — of animal tests for drugs intended for human use.” The present work accords with that statement.
Methods
Data collection
Fifty MEIC chemicals were used in the historical study of Ekwall et al. 18 However, since the present study used rodent LD50 values calculated by software (as outlined below), as well as measured values, inorganic chemicals, xylene (because there are three isomeric xylenes) and paraquat (as the molecule carries a positive charge) were excluded. This left 36 MEIC chemicals to be studied. Rodent LD50 values were collected from a number of sources (see online Supplementary Information 1). HLD values were taken from Ekwall et al. 18 with the exception of atropine 28 and digoxin. 29
In addition to providing HLD values for the MEIC chemicals, Ekwall et al. 18 also reported the human lethal blood concentrations (HLCs) of the chemicals in three formats: the clinical, the forensic and the peak values. The present study sought to examine how well median rodent LD50 values modelled HLC values for the 36-chemical data set.
As has been reported elsewhere, 21,30,31 a wide variation in reported rodent LD50 values is often evident. For example, the mouse oral LD50 values for atropine ranged from 32.1 to 1040 mg/kg, the rat oral values for 2,4-dichlorophenoxyacetic acid ranged from 300.6 to 4700 mg/kg, and for lindane from 57 to 6000 mg/kg. All LD50 values collected, and their sources, are provided in the Supplementary Information 1, and the calculation of median values is presented in the online Supplementary Information 2. The HLD, HLC and median LD50 values are given in Table 1.
Human lethal doses, human forensic lethal concentrations and rodent median LD50 values, for 36 MEIC chemicals.
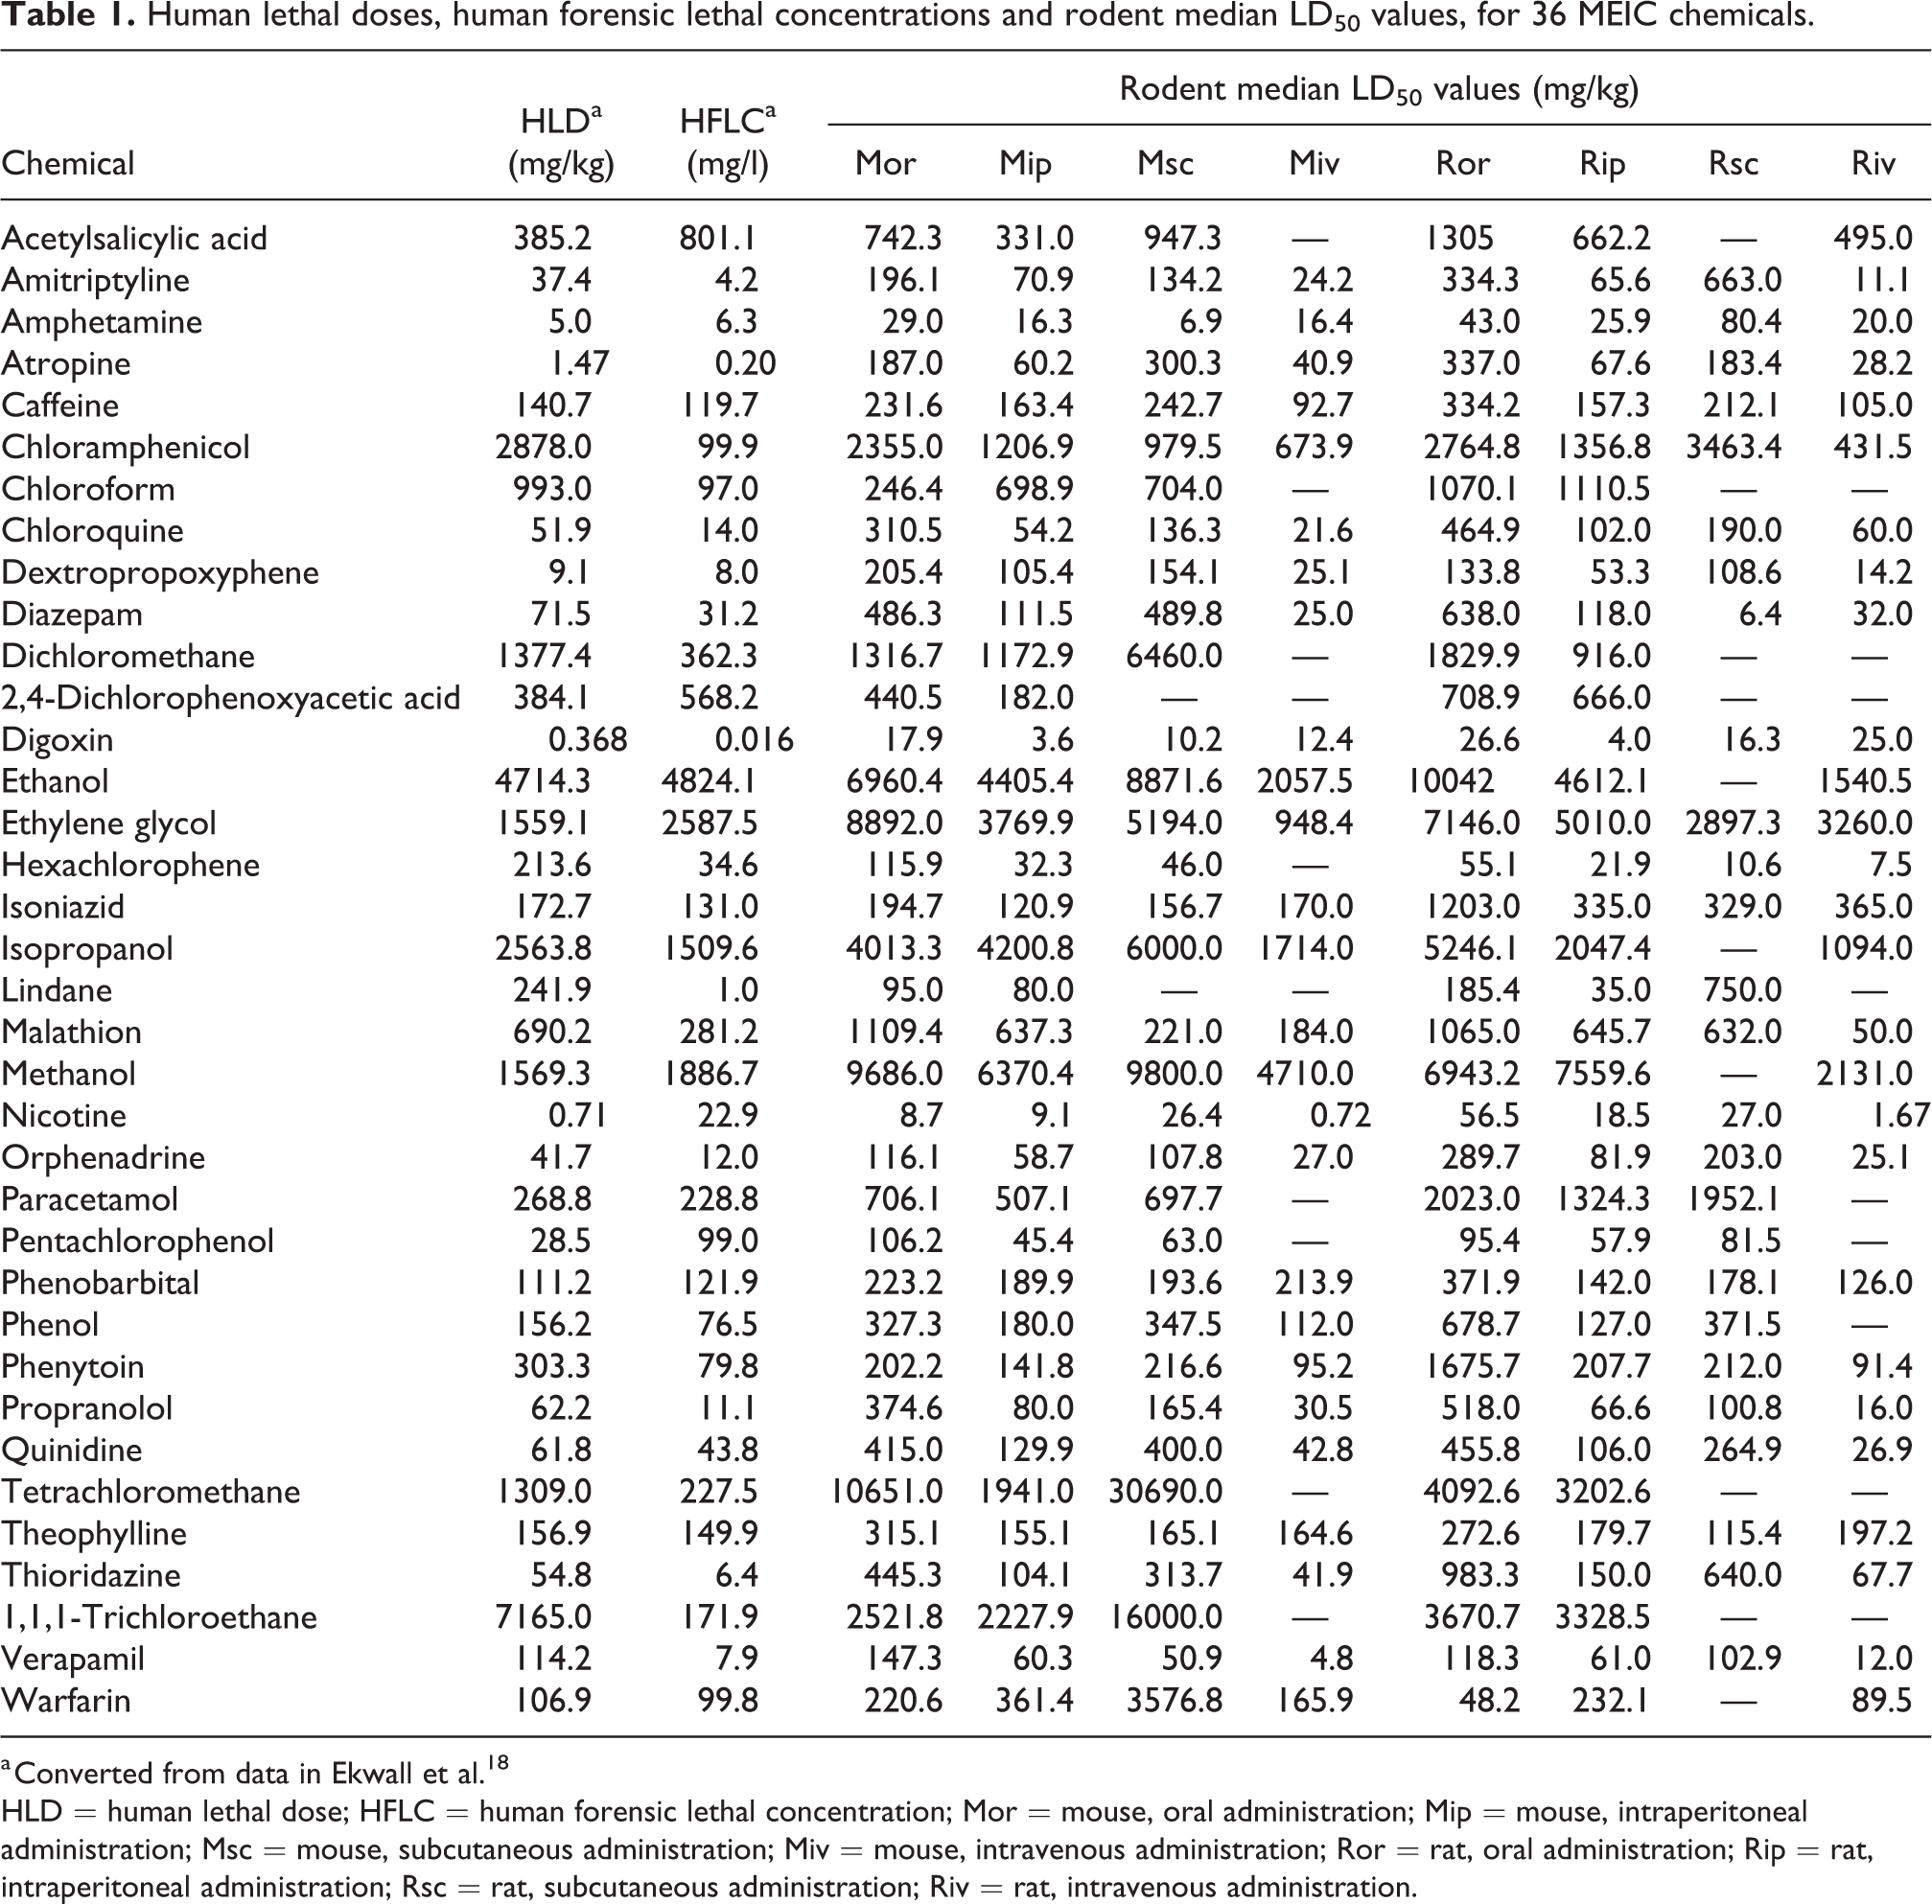
a Converted from data in Ekwall et al. 18
HLD = human lethal dose; HFLC = human forensic lethal concentration; Mor = mouse, oral administration; Mip = mouse, intraperitoneal administration; Msc = mouse, subcutaneous administration; Miv = mouse, intravenous administration; Ror = rat, oral administration; Rip = rat, intraperitoneal administration; Rsc = rat, subcutaneous administration; Riv = rat, intravenous administration.
Rat and mouse LD50 values can also be calculated by a few software programs. Gonella Diaza et al. 32 found the best to be the ACD/Labs ToxSuite 33 (now called I-Lab 2) and the US Environmental Protection Agency’s Toxicity Estimation Software Tool (TEST) program. 34 The former calculates mouse oral (or), intraperitoneal (ip), subcutaneous (sc) and intravenous (iv) LD50 values, as well as rat oral and intraperitoneal LD50 values. The latter calculates rat oral LD50 values only. The ACD/Labs software is a commercial program, but at present it is available free of charge to academics at British universities via the Royal Society of Chemistry website. The present study used these two software programs, and the rodent LD50 values predicted by them are given in Table 2.
ACD I-Lab 2-predicted and TEST-predicted rodent LD50 values for 36 MEIC chemicals.
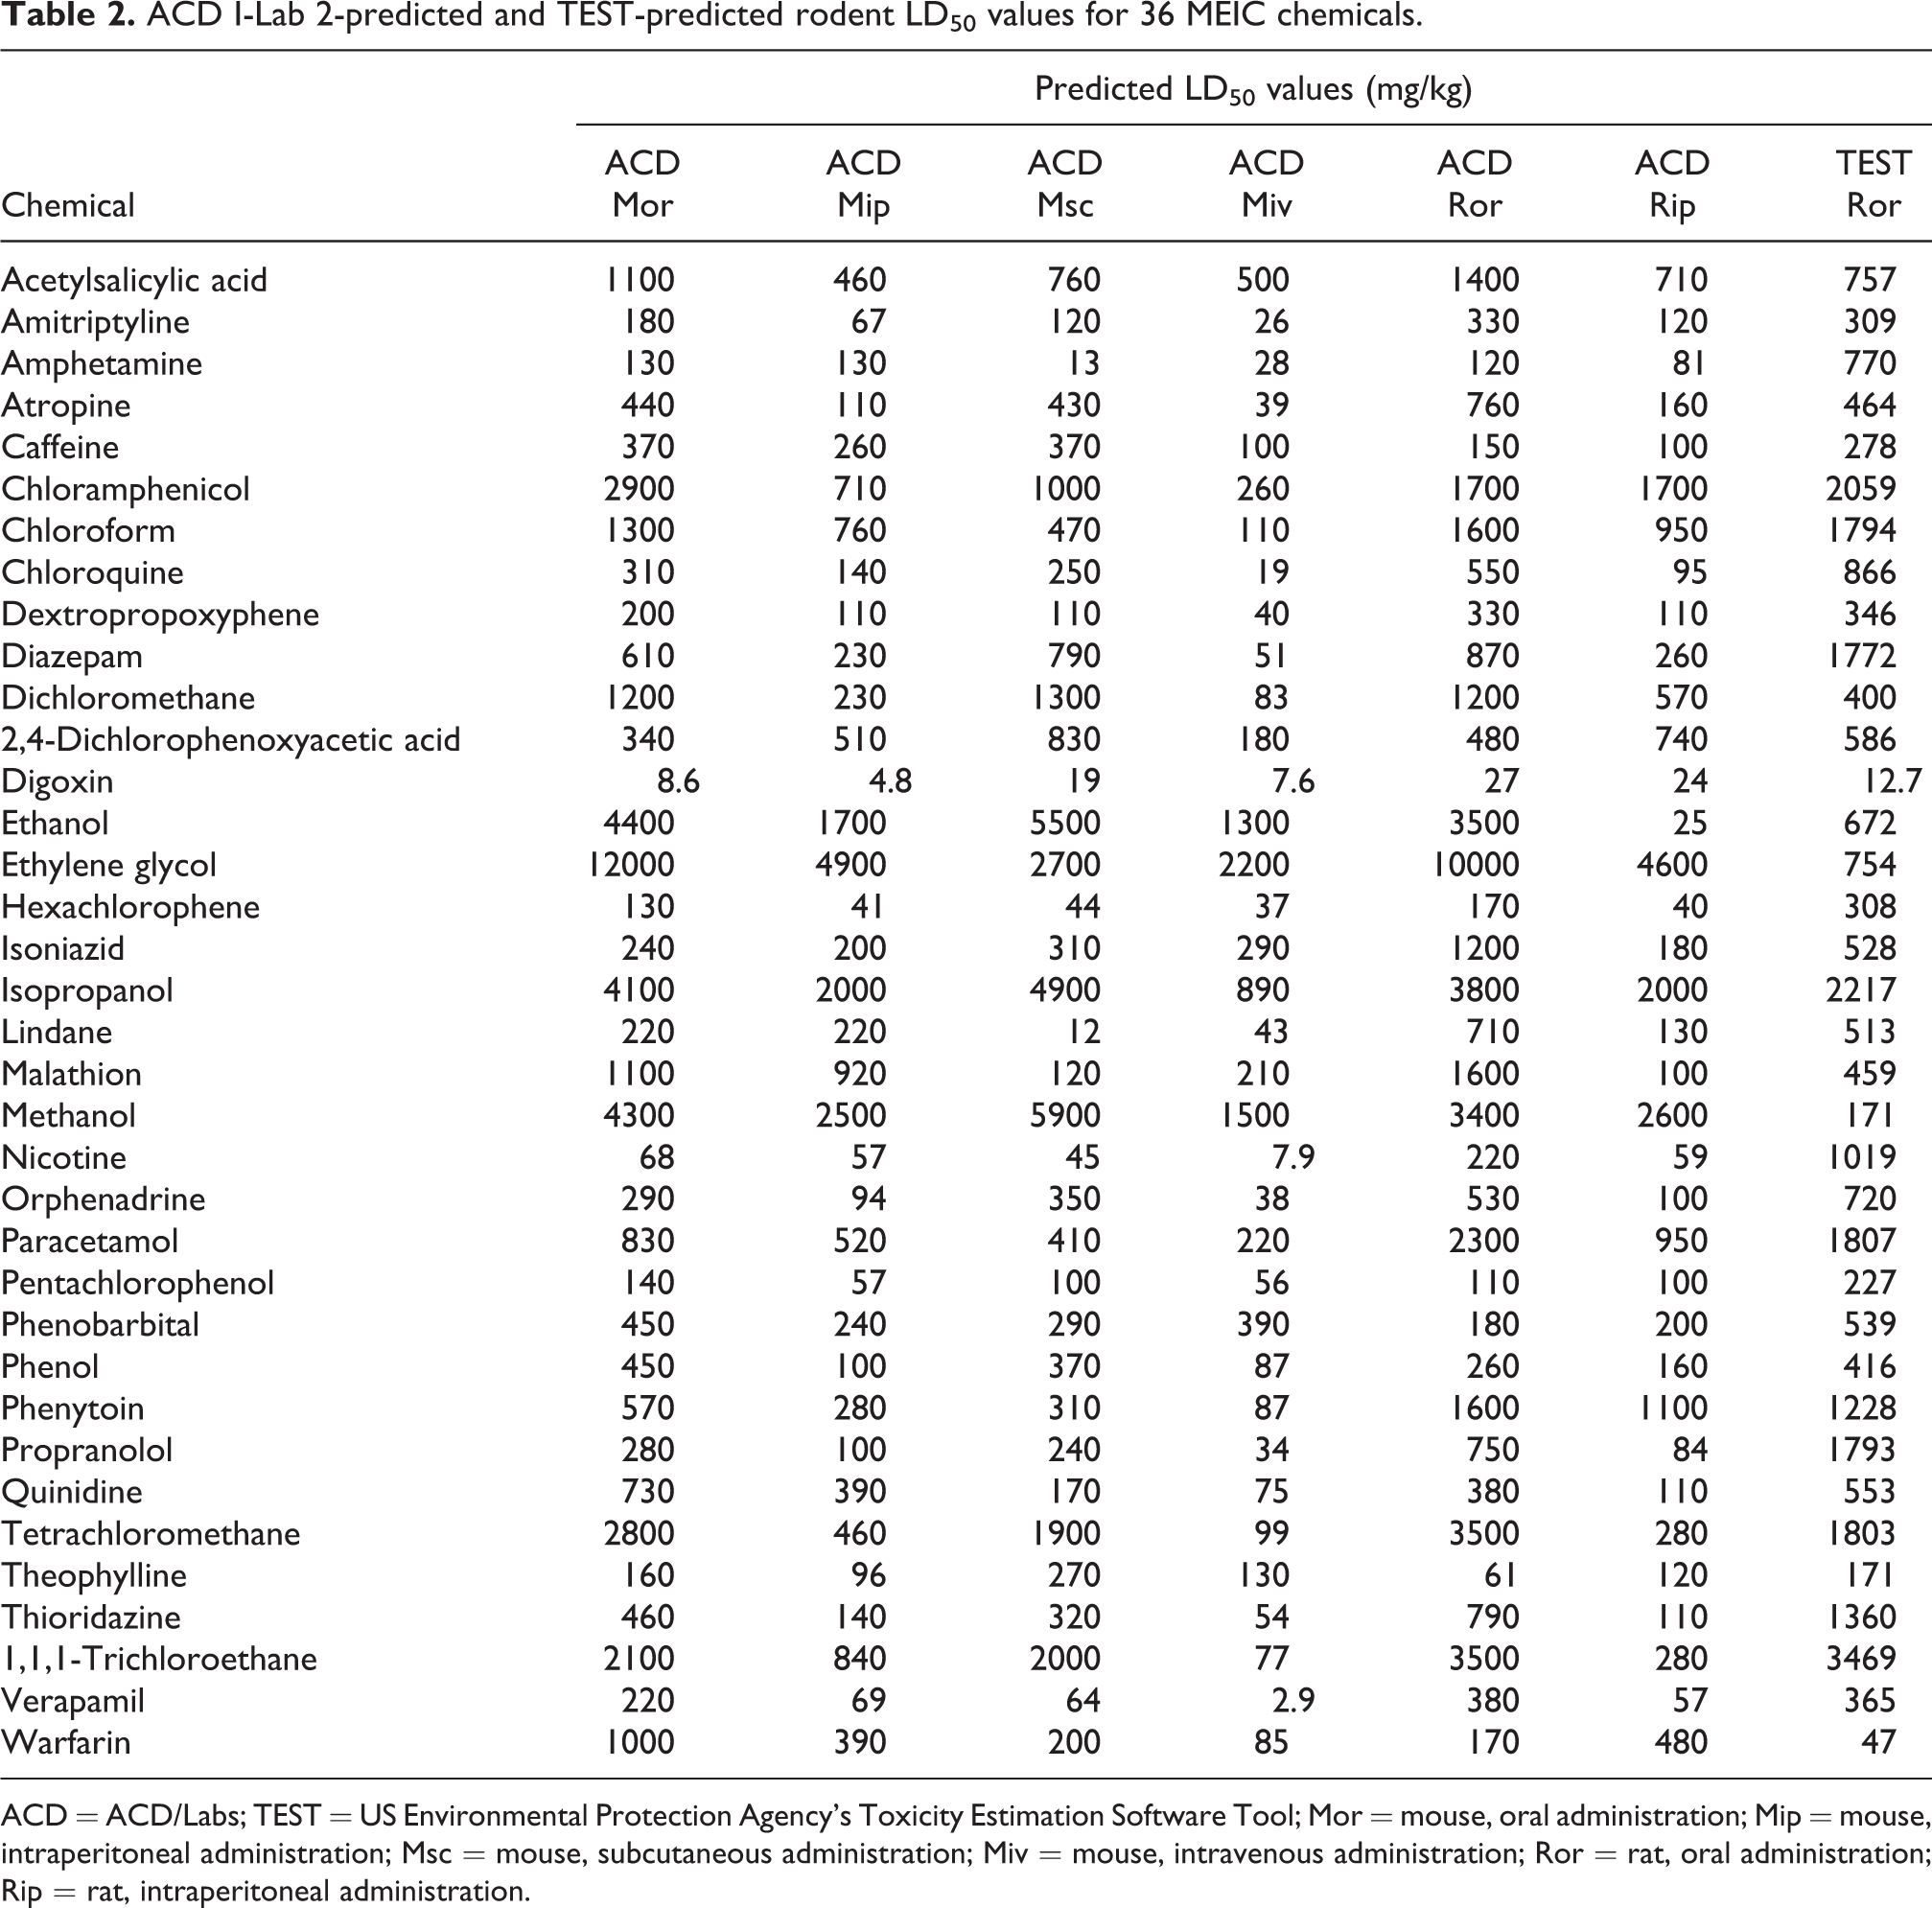
ACD = ACD/Labs; TEST = US Environmental Protection Agency’s Toxicity Estimation Software Tool; Mor = mouse, oral administration; Mip = mouse, intraperitoneal administration; Msc = mouse, subcutaneous administration; Miv = mouse, intravenous administration; Ror = rat, oral administration; Rip = rat, intraperitoneal administration.
All toxicity values were converted to mmol/kg and negative log-transformed for purposes of correlation. Values given for salts were corrected to the corresponding free base or acid. Carai et al. 35 have commented that this may not give the correct value for the free acid or base; for example, for a sodium salt, the sodium ion could have affected mortality by changing the electrolytic homeostasis. However, such salt effects could not be corrected in literature data.
Statistical analysis
Statistical analysis was carried out by using regression analysis in Minitab 19 software. 36
It is now accepted practice to carry out an external validation of a predictive correlation, which is achieved by using it to predict endpoint values for chemicals not included in the data set that was used to develop the correlation (i.e. the training set). 37 Frequently, this is done by removing, say, 20% of the chemicals from the training data set, re-developing the correlation with the remaining 80% of chemicals, and using that correlation to predict the endpoint values of the removed chemicals (i.e. the test set). Selection of the test set chemicals was done by the well-used method 38 of removal of every fifth chemical of the alphabetical list, namely: caffeine, diazepam, ethylene glycol, malathion, pentachlorophenol, quinidine and verapamil.
Results and Discussion
Correlation of the HLD and rodent LD50 values
Correlations of the HLD values with the median measured rodent LD50 values, as well as the calculated rodent LD50 values for the whole data set, are given in Table 3 (see Figure 1 for the best correlation between the values). Table 4 shows the best training set QAARs for HLD values correlated with both measured and calculated rodent LD50 values. The best training set QAARs were used to predict the HLD values of the seven test set chemicals, and these values are given in Table 5.
Correlations of the HLD values of the MEIC chemicals with experimental and calculated rodent LD50 values.
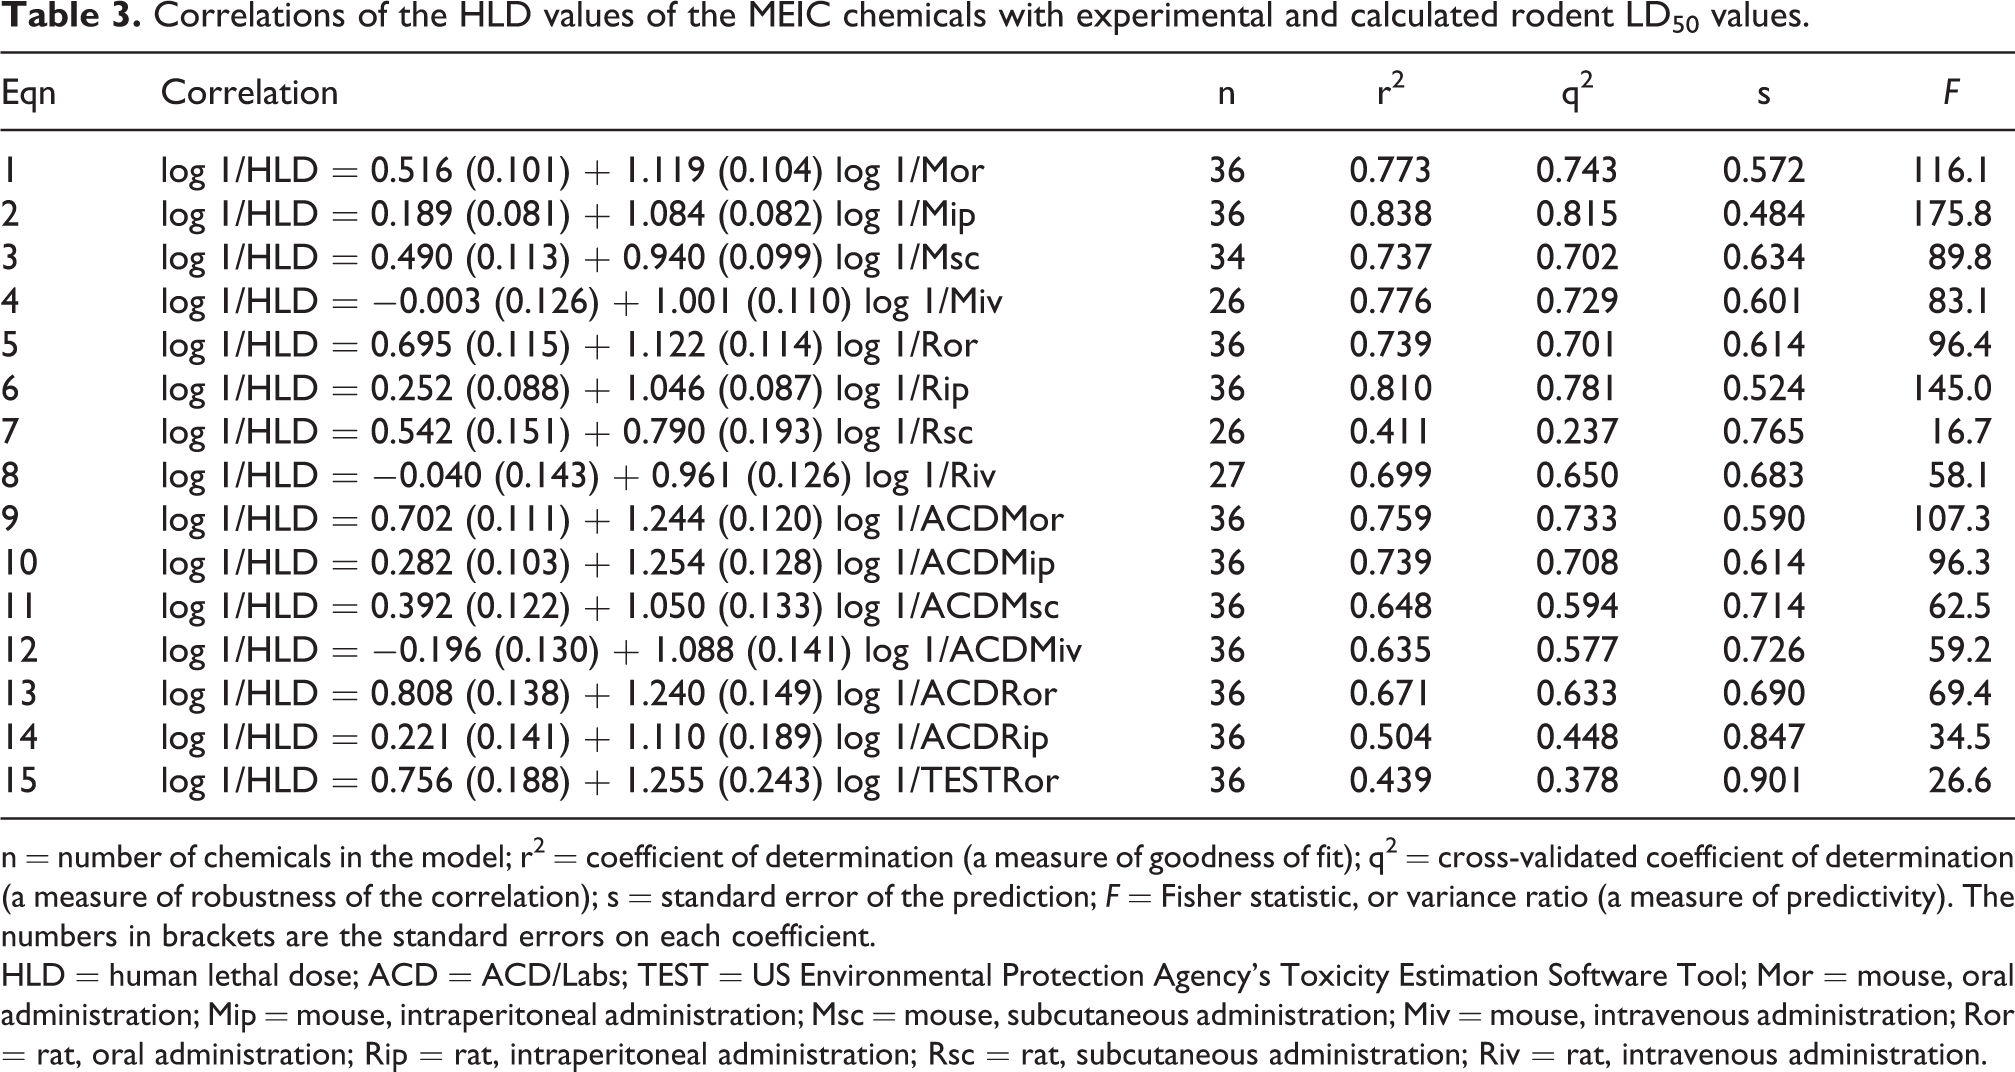
n = number of chemicals in the model; r2 = coefficient of determination (a measure of goodness of fit); q2 = cross-validated coefficient of determination (a measure of robustness of the correlation); s = standard error of the prediction; F = Fisher statistic, or variance ratio (a measure of predictivity). The numbers in brackets are the standard errors on each coefficient.
HLD = human lethal dose; ACD = ACD/Labs; TEST = US Environmental Protection Agency’s Toxicity Estimation Software Tool; Mor = mouse, oral administration; Mip = mouse, intraperitoneal administration; Msc = mouse, subcutaneous administration; Miv = mouse, intravenous administration; Ror = rat, oral administration; Rip = rat, intraperitoneal administration; Rsc = rat, subcutaneous administration; Riv = rat, intravenous administration.
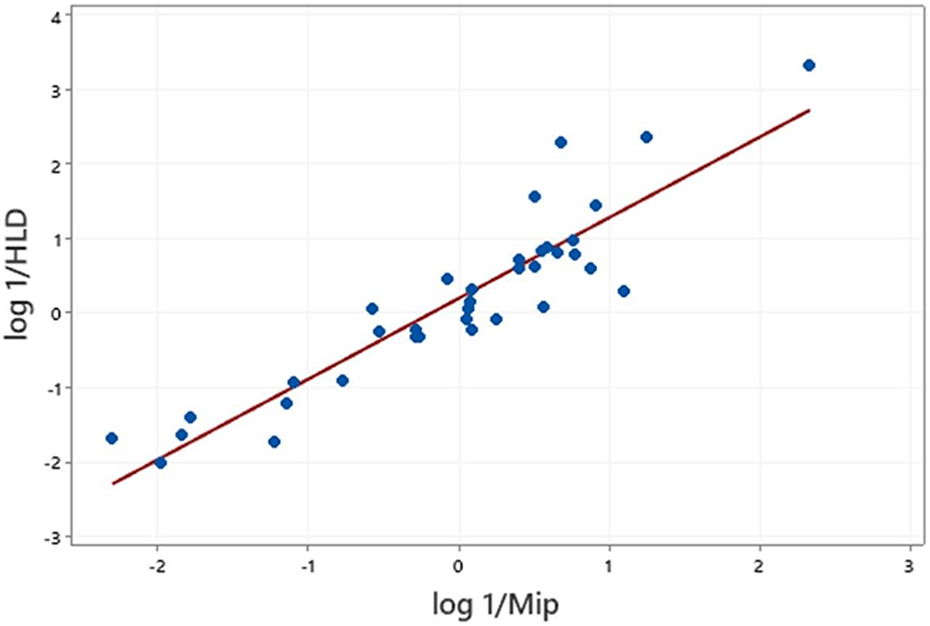
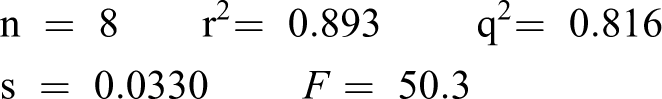
Correlation of human lethal doses and mouse intraperitoneal LD50 values, for 36 MEIC chemicals. HLD = human lethal dose; Mip = mouse, intraperitoneal administration.
Best correlations of the HLD values of the MEIC training set chemicals with experimental and ACD-calculated rodent LD50 values.
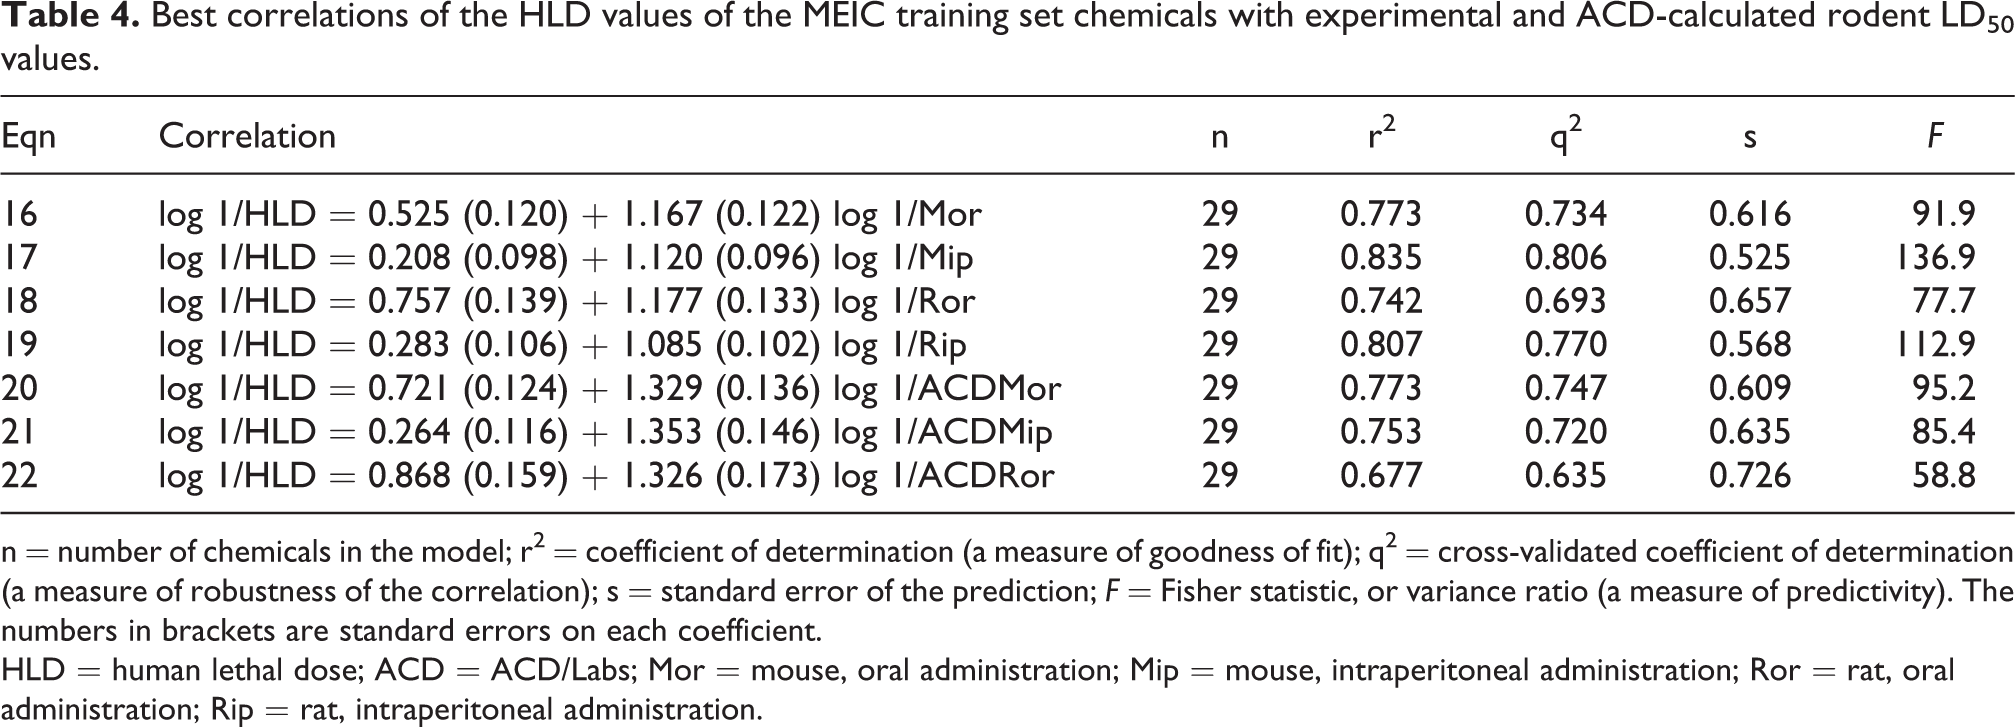
n = number of chemicals in the model; r2 = coefficient of determination (a measure of goodness of fit); q2 = cross-validated coefficient of determination (a measure of robustness of the correlation); s = standard error of the prediction; F = Fisher statistic, or variance ratio (a measure of predictivity). The numbers in brackets are standard errors on each coefficient.
HLD = human lethal dose; ACD = ACD/Labs; Mor = mouse, oral administration; Mip = mouse, intraperitoneal administration; Ror = rat, oral administration; Rip = rat, intraperitoneal administration.
Observed HLD values of the MEIC test set chemicals, and those predicted from equations 16–22.
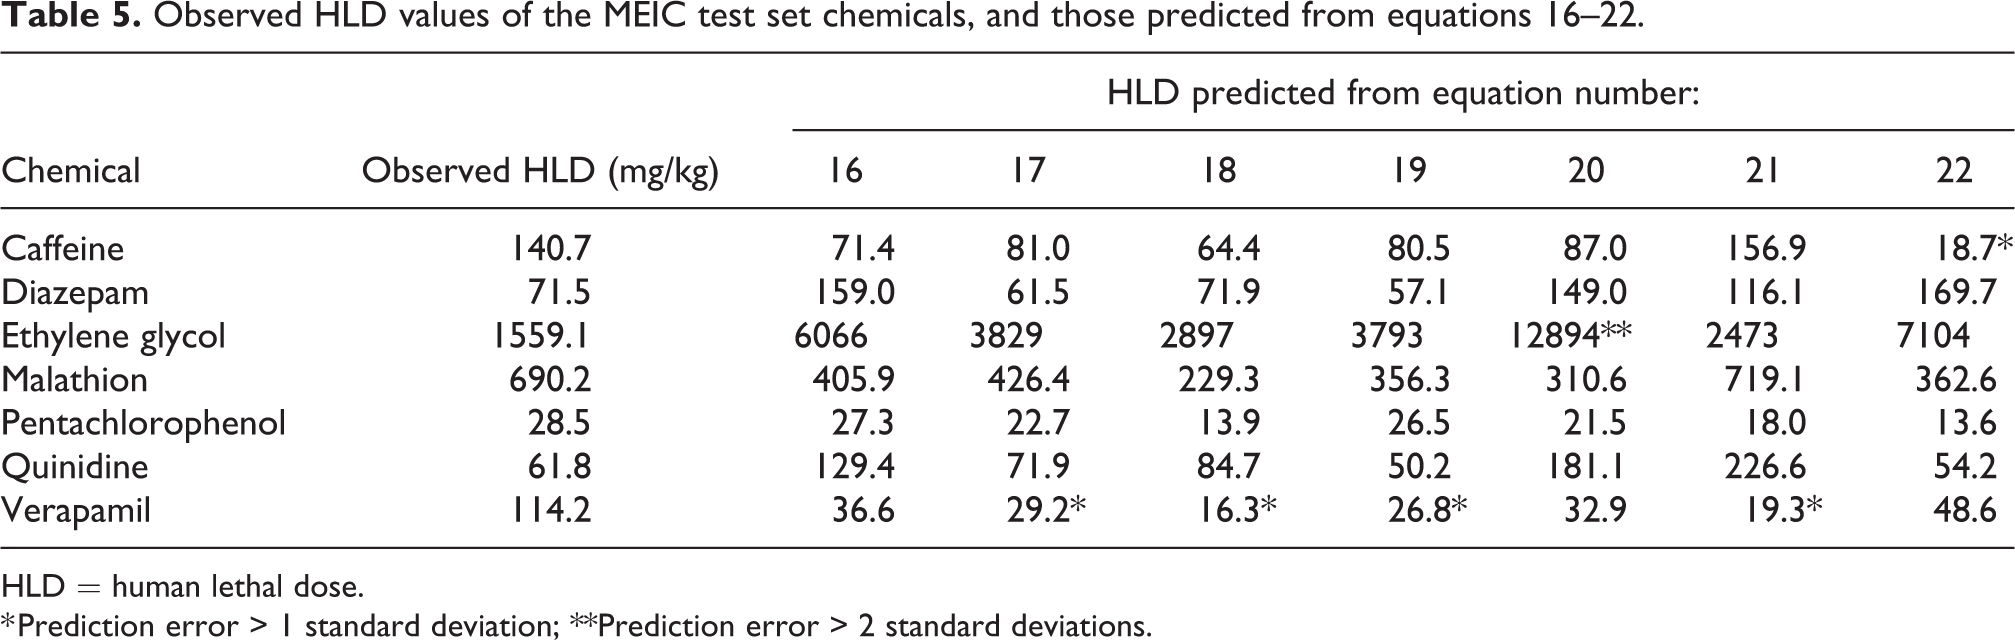
HLD = human lethal dose.
* Prediction error > 1 standard deviation; **Prediction error > 2 standard deviations.
Equations 16–19 gave predicted HLD values within 1 standard deviation (sd), with the exception of verapamil, for which three predictions were between 1 and 2 sd (see Table 5) This is still acceptable, bearing in mind the wide range of some rodent LD50 values, and Lipnick’s comment 39 that only predicted values with errors over 3 sd should be regarded as unacceptable. Hence, equations 16–19 have been successfully externally validated.
HLD predictions from equations 20–22, based on ACD/Labs-predicted rodent LD50 values, were also mostly within 1 sd, with the exception of two values with an error greater than 1 sd and two values with an error greater than 2 sd. Therefore, on the whole, the ACD/Labs I-Lab 2 software yielded good HLD predictions, with 20 out of 21 predictions being acceptable.
It can be seen from Table 3 that mouse intraperitoneal (Mip) and rat intraperitoneal (Rip) LD50 values correlate excellently with HLD values; it is generally acknowledged that r2 values of about 0.8 are as good as can be expected from in vivo data. Mouse oral (Mor) and rat oral (Ror) LD50 values also correlate well with HLD values. These correlations are much better than that reported for HLD–Ror LD50 correlation (r 2 = 0.571) for a 30-chemical data set. 30 Figure 1 illustrates the HLD–Mip LD50 correlation obtained in the present work. It is interesting to note that Fry et al. 40 reported that rodent intraperitoneal LD50 values were more widely available than were those for other routes of administration. However, in the Supplementary Information 2 of the present work, it can be seen that more LD50 values were found for oral administration than for intraperitoneal administration.
The training set QAARs in Table 4 are very similar to those developed for the full data set, given in Table 3. The predicted HLD values in Table 5 are almost all within 1 sd of the observed HLD values, and only one (from the ACDMor prediction) has an error of more than 2 sd. Thus, any of the equations 16–22, and particularly equations 16–19 based on median measured rodent LD50 values, can be used to predict human lethal doses of MEIC chemicals.
HLD values also correlated well with ACD/Labs-predicted Mor and Mip LD50 values, but less well with ACD/Labs-predicted LD50 values via other routes of administration. As can be seen from Table 6, the ACD/Labs I-Lab 2-predicted LD50 values all correlated very well (r 2 ≥ 0.88) with the respective median measured LD50 values, with the exception of the Rip LD50 values (r 2 = 0.70). One reason for these good correlations may be that, with one exception, all the MEIC chemicals are in the ACD/Labs I-Lab 2 database. 33 However, it should be noted that all but one of the ACD/Labs I-Lab 2-predicted LD50 values were different from the measured values in their database.
Correlations of the measured and calculated rodent LD50 values.
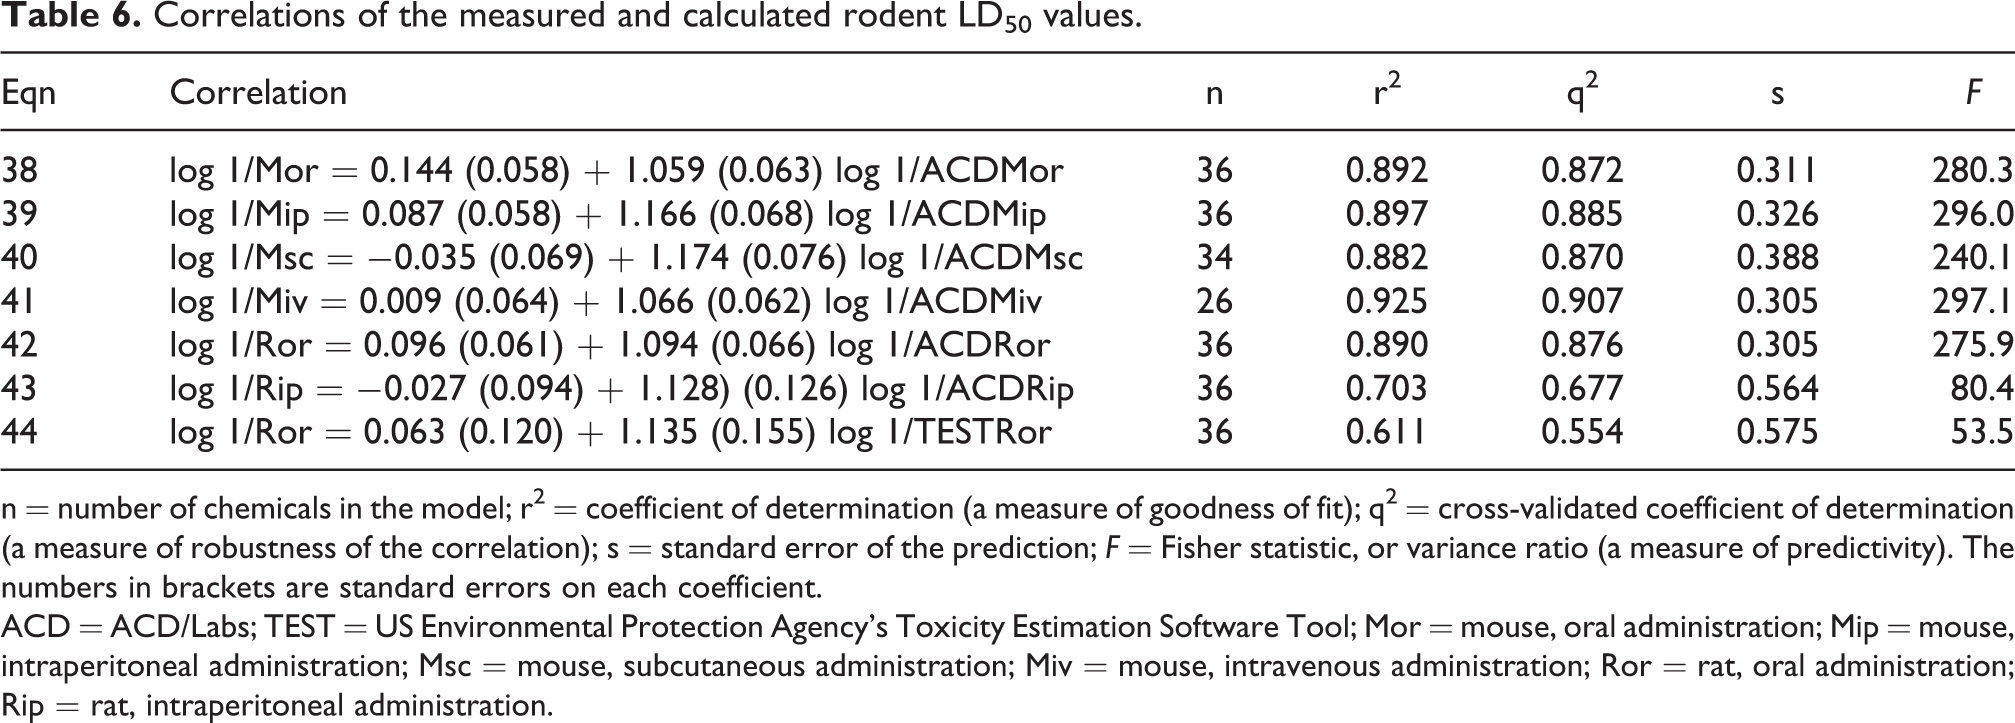
n = number of chemicals in the model; r2 = coefficient of determination (a measure of goodness of fit); q2 = cross-validated coefficient of determination (a measure of robustness of the correlation); s = standard error of the prediction; F = Fisher statistic, or variance ratio (a measure of predictivity). The numbers in brackets are standard errors on each coefficient.
ACD = ACD/Labs; TEST = US Environmental Protection Agency’s Toxicity Estimation Software Tool; Mor = mouse, oral administration; Mip = mouse, intraperitoneal administration; Msc = mouse, subcutaneous administration; Miv = mouse, intravenous administration; Ror = rat, oral administration; Rip = rat, intraperitoneal administration.
The TEST-predicted Ror LD50 values correlated very poorly with HLD values (r 2 = 0.439), which is disappointing. The TEST software-predicted Ror LD50 values also correlated only poorly (r 2 = 0.611) with the median measured Ror LD50 values. Thus, it can be concluded that the ACD/Labs-predicted mouse and rat oral LD50 values are the better choice of the two to predict the HLD values of the MEIC chemicals.
Ekwall et al. 2 found that rat and mouse oral LD50 values correlated well with each other (r2 = 0.852) for the 50 MEIC chemicals, a finding also reported by Hoffmann et al. 30 in their study based on 40 MEIC chemicals (r 2 = 0.800). Table 7 shows rat–mouse LD50 correlations for the log-transformed values of the data given in Table 1, with a better correlation value (r 2 = 0.883) than those calculated by Ekwall et al. 2 and by Hoffmann et al. 30 It is not surprising that rat–mouse LD50 values correlate better than do HLD–rodent values, since the two rodent species share more similar physiology. Indeed, some researchers have used rat and mouse LD50 values interchangeably in studies. 8
QAARs of rat–mouse LD50 values.
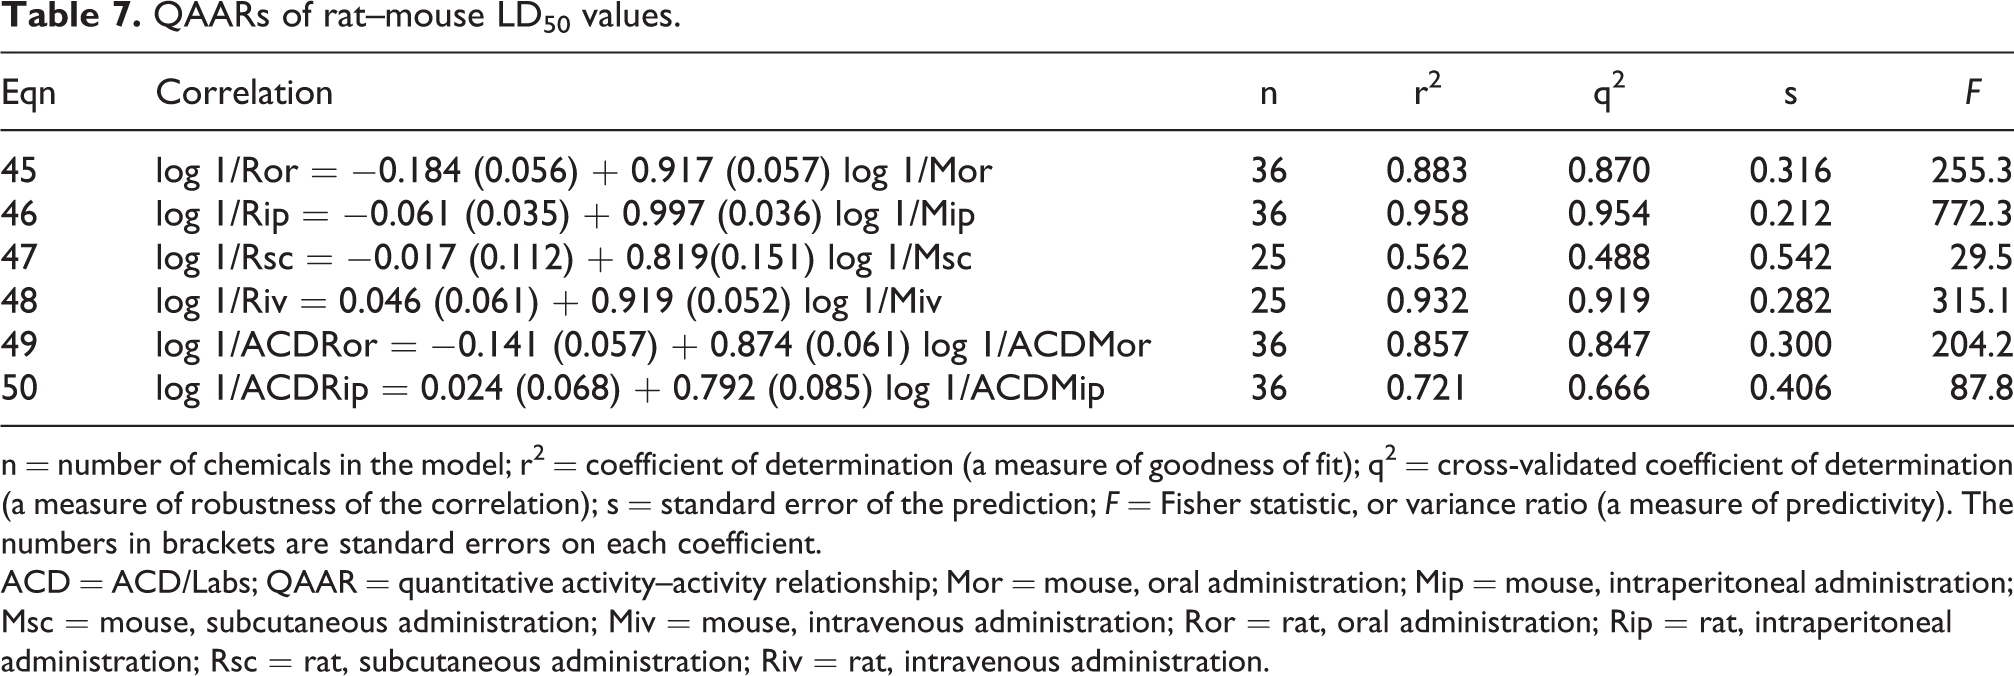
n = number of chemicals in the model; r2 = coefficient of determination (a measure of goodness of fit); q2 = cross-validated coefficient of determination (a measure of robustness of the correlation); s = standard error of the prediction; F = Fisher statistic, or variance ratio (a measure of predictivity). The numbers in brackets are standard errors on each coefficient.
ACD = ACD/Labs; QAAR = quantitative activity–activity relationship; Mor = mouse, oral administration; Mip = mouse, intraperitoneal administration; Msc = mouse, subcutaneous administration; Miv = mouse, intravenous administration; Ror = rat, oral administration; Rip = rat, intraperitoneal administration; Rsc = rat, subcutaneous administration; Riv = rat, intravenous administration.
Table 7 shows that the correlation between log 1/Rsc and log 1/Msc is very poor. Table 3 shows that the correlation between log 1/HLD and log 1/Rsc (r 2 = 0.411) is much poorer than the correlation between log 1/HLD and log 1/Msc (r 2 = 0.737), suggesting that it is the Rsc data that are largely at fault. This could be because only relatively few Rsc LD50 values were found (see Supplementary Information 2), with only a single Rsc LD50 value having been found for many of the studied MEIC chemicals.
The use of rodent LD50 values to model human lethal blood concentrations
Of the three HLC formats (i.e. forensic, clinical and peak), the forensic values correlated best with rodent LD50 values. For example, r 2 values for the correlation of forensic, clinical and peak HLC values with Mip values were 0.753, 0.683 and 0.651, respectively. Therefore, only human forensic lethal concentration (HFLC) values were subsequently used, and their correlations with median measured and calculated rodent LD50 values for the whole data set are given in Table 8 (see Figure 2 for the best correlation between the values). Table 9 gives the best training set QAARs for HFLC values correlated with both measured and calculated rodent LD50 values. The best training set QAARs were used to predict the HFLC values of the seven test set chemicals, and these values are given in Table 10.
Correlations of the HFLC values of the MEIC chemicals with experimental and calculated rodent LD50 values.
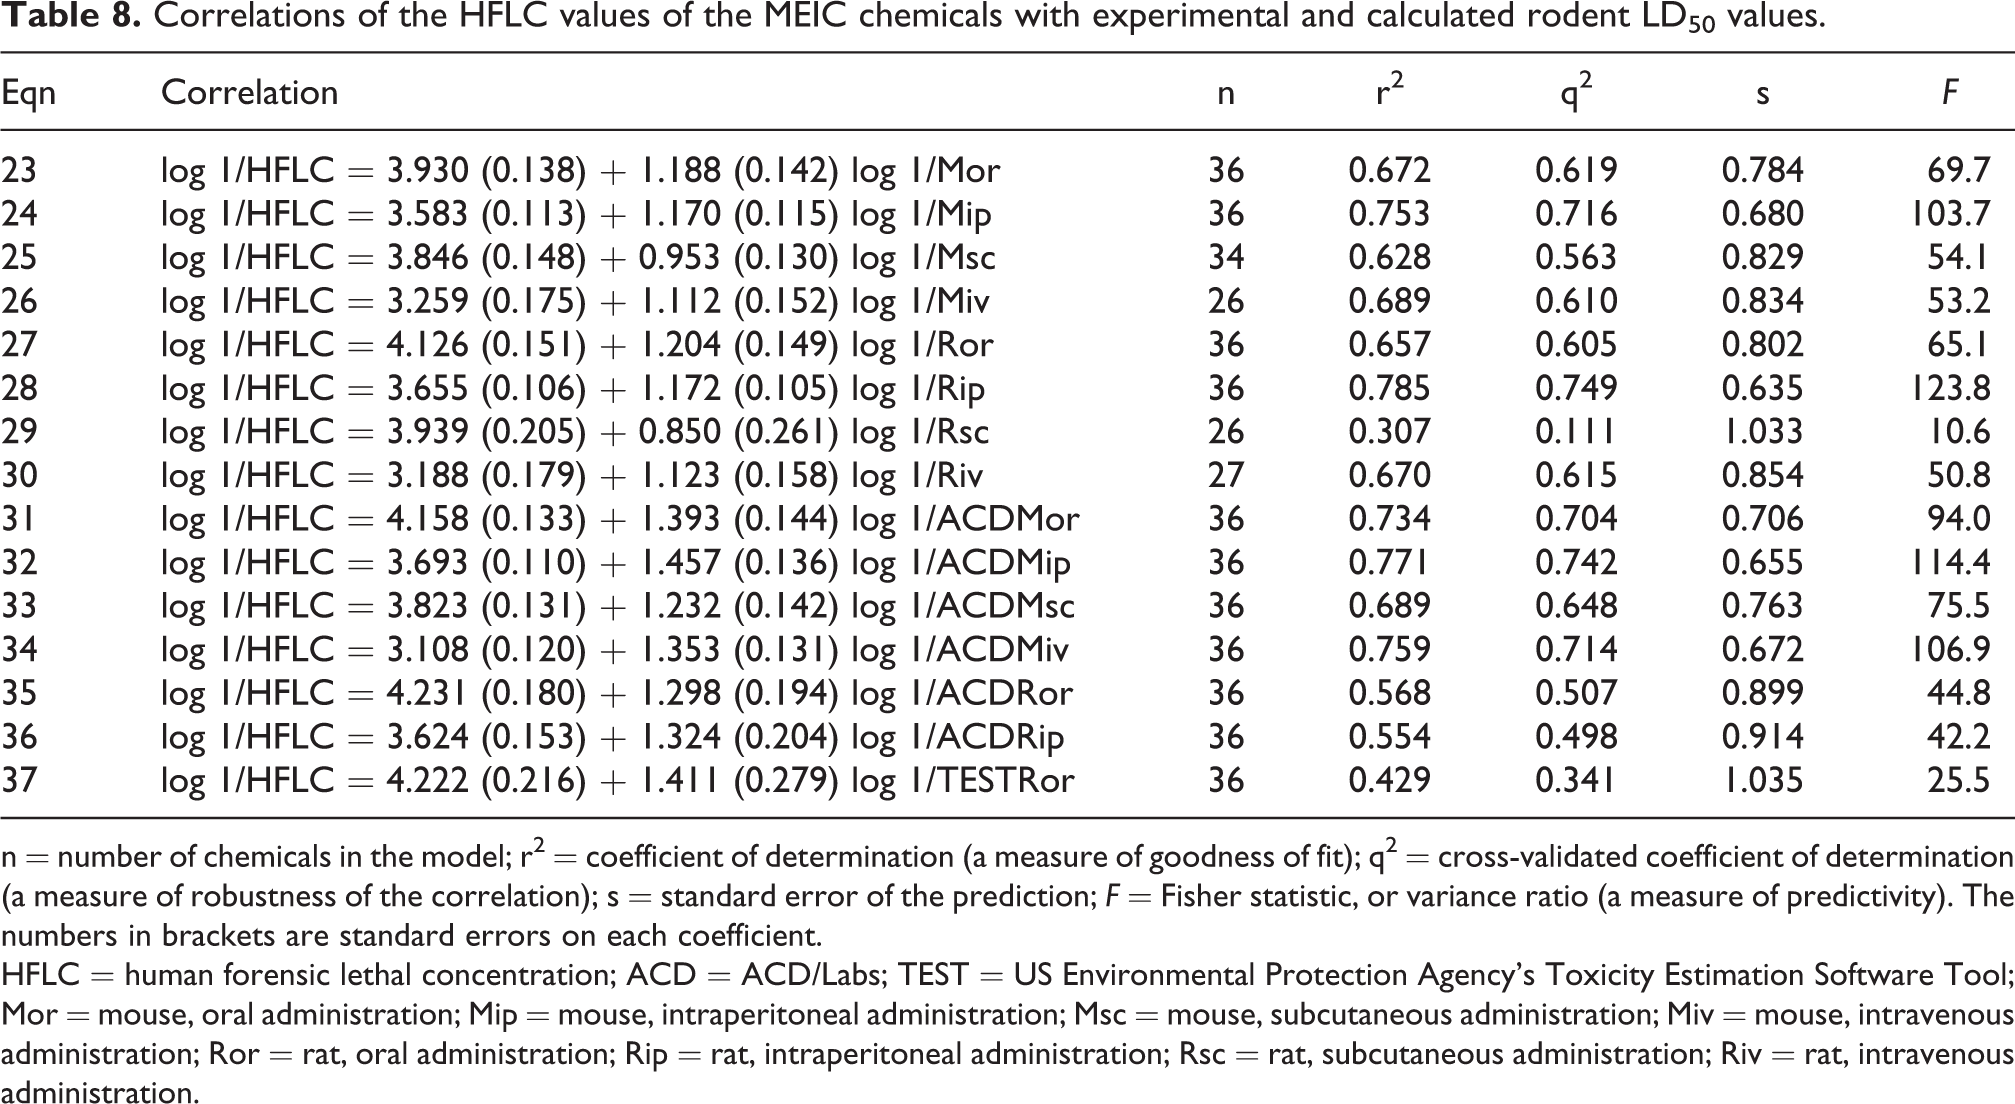
n = number of chemicals in the model; r2 = coefficient of determination (a measure of goodness of fit); q2 = cross-validated coefficient of determination (a measure of robustness of the correlation); s = standard error of the prediction; F = Fisher statistic, or variance ratio (a measure of predictivity). The numbers in brackets are standard errors on each coefficient.
HFLC = human forensic lethal concentration; ACD = ACD/Labs; TEST = US Environmental Protection Agency’s Toxicity Estimation Software Tool; Mor = mouse, oral administration; Mip = mouse, intraperitoneal administration; Msc = mouse, subcutaneous administration; Miv = mouse, intravenous administration; Ror = rat, oral administration; Rip = rat, intraperitoneal administration; Rsc = rat, subcutaneous administration; Riv = rat, intravenous administration.
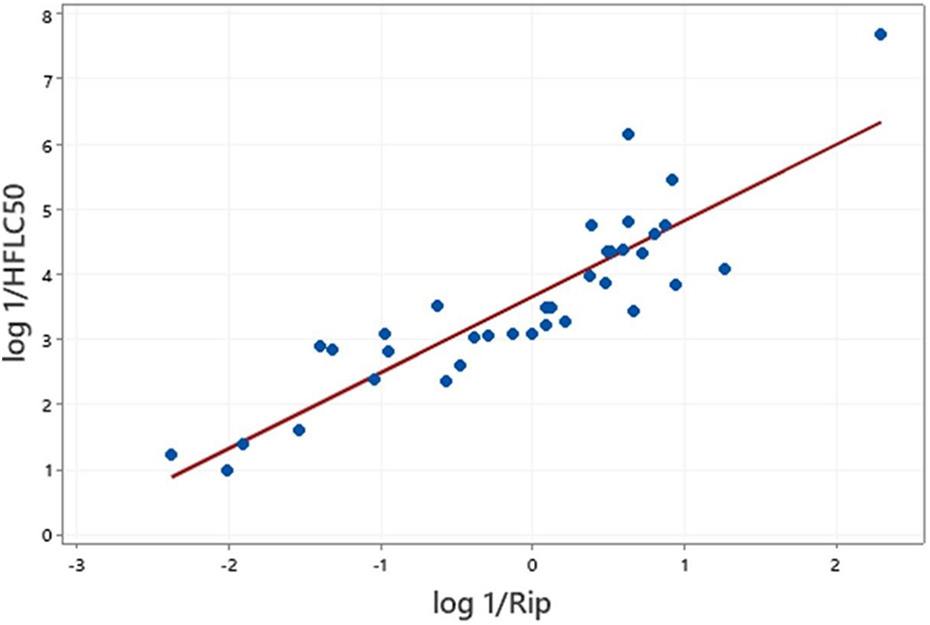
Correlation of human forensic lethal concentrations and rat intraperitoneal LD50 values, for 36 MEIC chemicals. HFLC = human forensic lethal concentration; Rip = rat, intraperitoneal administration.
Best correlations of the HFLC values of the MEIC training set chemicals with experimental and ACD-calculated rodent LD50 values.
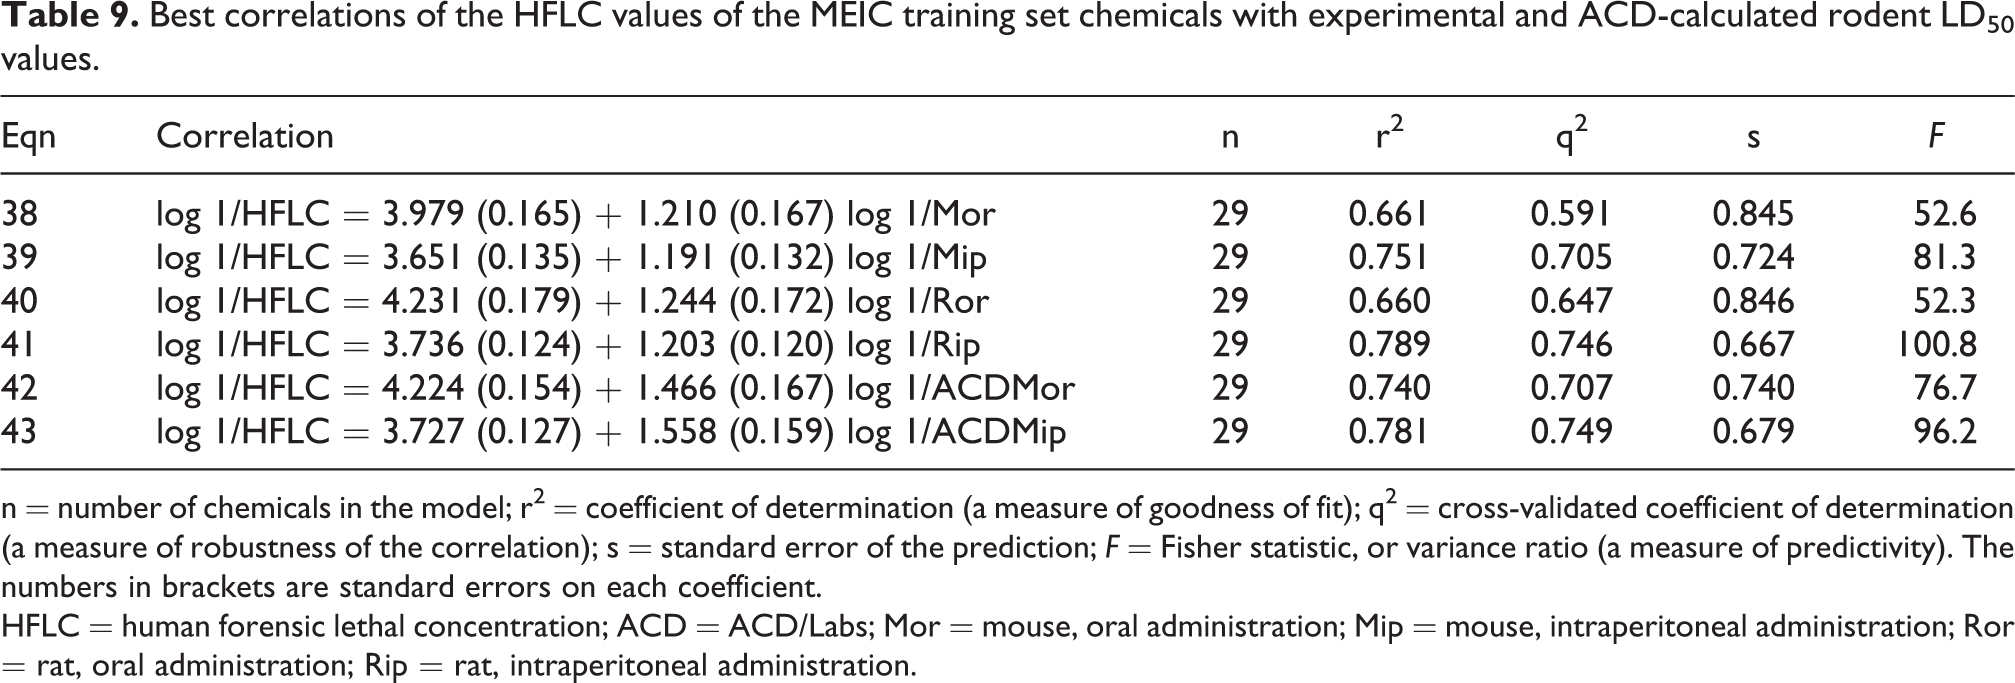
n = number of chemicals in the model; r2 = coefficient of determination (a measure of goodness of fit); q2 = cross-validated coefficient of determination (a measure of robustness of the correlation); s = standard error of the prediction; F = Fisher statistic, or variance ratio (a measure of predictivity). The numbers in brackets are standard errors on each coefficient.
HFLC = human forensic lethal concentration; ACD = ACD/Labs; Mor = mouse, oral administration; Mip = mouse, intraperitoneal administration; Ror = rat, oral administration; Rip = rat, intraperitoneal administration.
Observed HFLC values of the MEIC test set chemicals, and those predicted from equations 38–43.
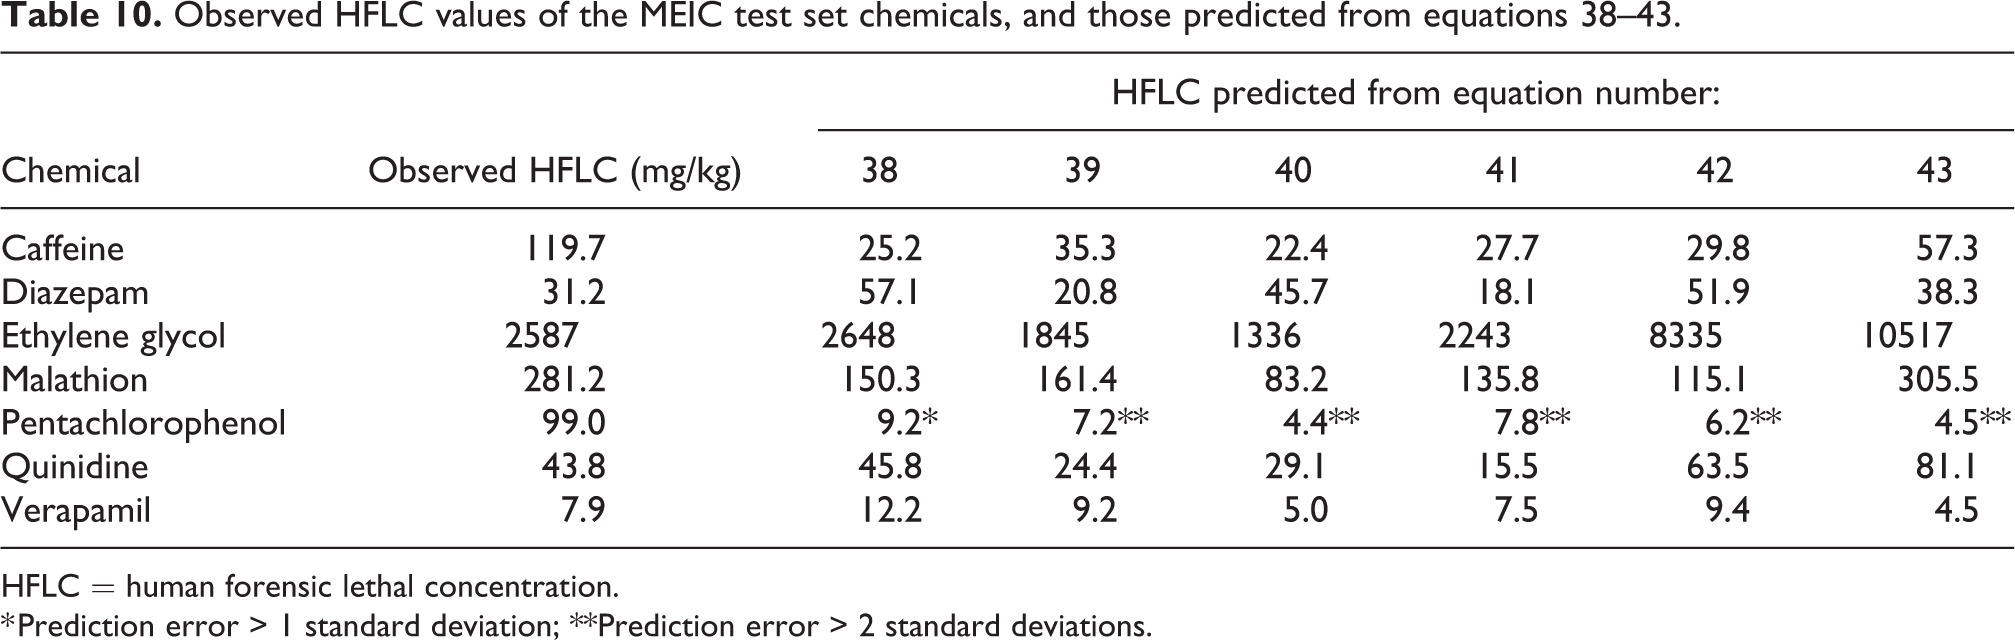
HFLC = human forensic lethal concentration.
* Prediction error > 1 standard deviation; **Prediction error > 2 standard deviations.
In Table 8, it can be seen that most of the median rodent log 1/LD50 values correlate well with log 1/HFLC values, with only two correlations having r 2 values of < 0.65. Two correlations based on ACD/Labs-predicted values also had r 2 values of < 0.65. Table 9 shows the best of those correlations developed from the training set, and Table 10 gives the predicted HFLC values derived from equations 38–43 for the test set chemicals. With the exception of those for pentachlorophenol, the predicted HFLC values were all within 1 sd of the observed values, and even the pentachlorophenol values were less than 3 sd in error, which is acceptable under Lipnick’s guidance. 38 Hence, any of the equations 38–43 can be used to predict human forensic lethal concentrations of MEIC chemicals with acceptable accuracy.
Ekwall et al. 2 also examined correlations between the HLC values of the MEIC chemicals and the IC50 values from 61 in vitro cytotoxicity tests, and found that on the whole they were poor, with only 5 out of 150 correlations having r 2 values of ≥ 0.7. It should be noted that in these five instances, IC50 values from fewer than the full set of 50 MEIC chemicals were used in the correlations, implying perhaps that some data were omitted to improve the extent of correlation.
The use of ‘lowest’ rodent LD50 values to model human acute toxicity values
Several studies 8,17,41 have used the lowest available rodent LD50 values, in order to obtain worst case estimates of toxicity. From the very large number of rodent LD50 values collected for the present study (see Supplementary Information 2), lowest values were used to determine whether better predictions of HLD could be obtained from these data than from the use of median LD50 values. The QAARs developed from these data are given in Table 11.
Correlations of the HLD values of the MEIC chemicals with minimum (worst case) experimental rodent LD50 values.
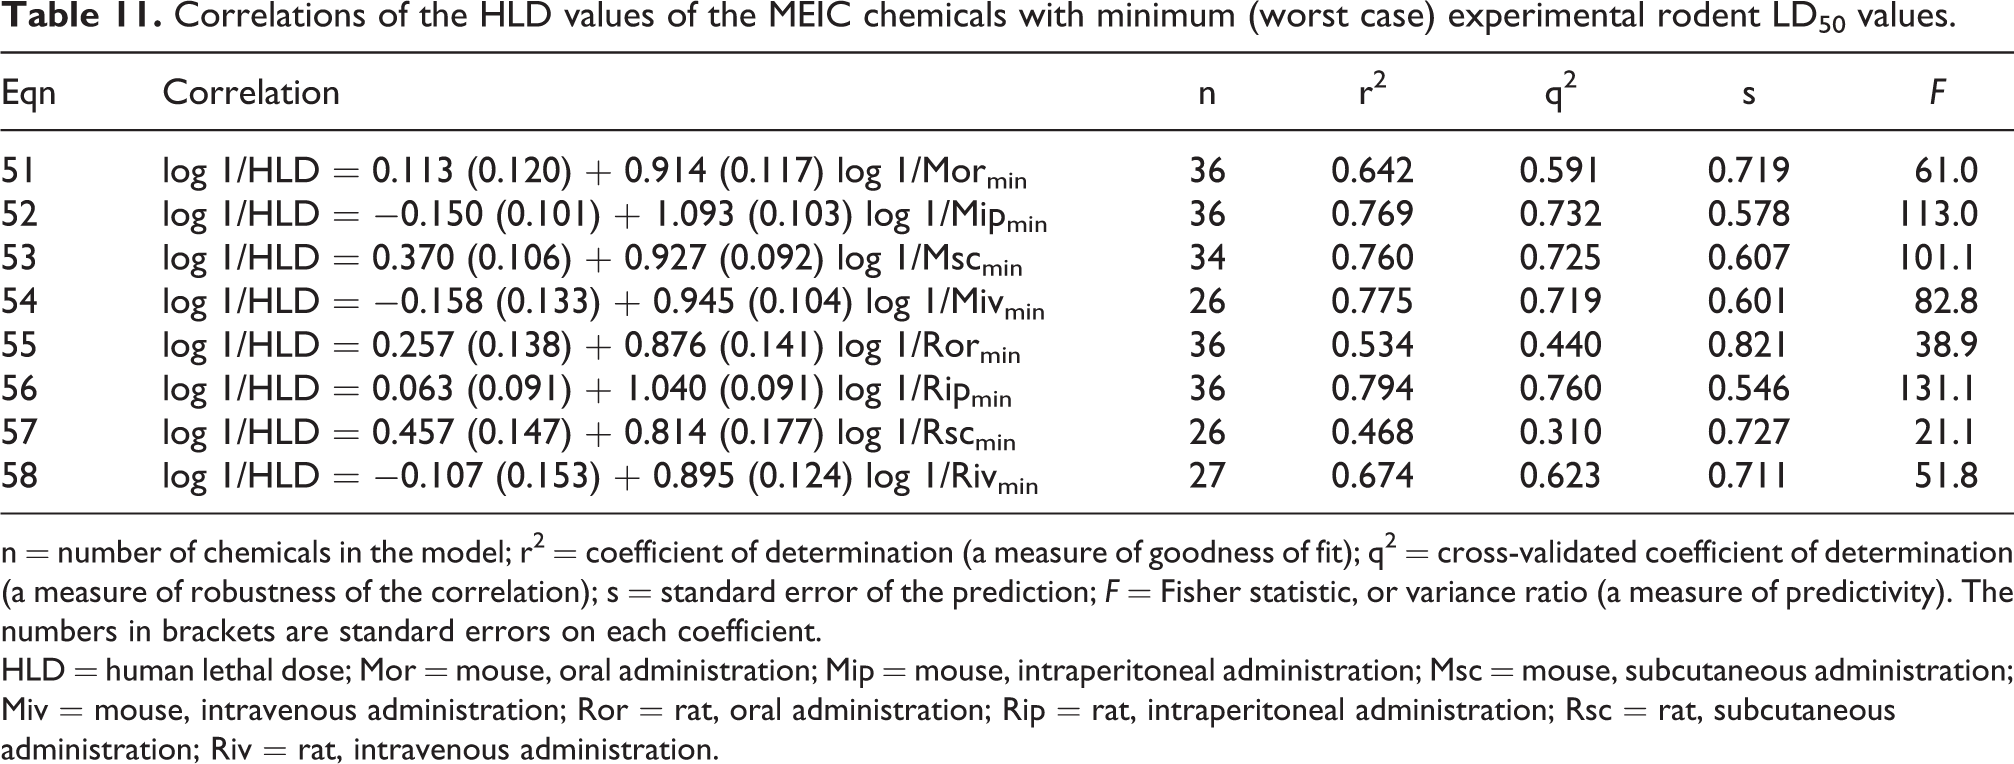
n = number of chemicals in the model; r2 = coefficient of determination (a measure of goodness of fit); q2 = cross-validated coefficient of determination (a measure of robustness of the correlation); s = standard error of the prediction; F = Fisher statistic, or variance ratio (a measure of predictivity). The numbers in brackets are standard errors on each coefficient.
HLD = human lethal dose; Mor = mouse, oral administration; Mip = mouse, intraperitoneal administration; Msc = mouse, subcutaneous administration; Miv = mouse, intravenous administration; Ror = rat, oral administration; Rip = rat, intraperitoneal administration; Rsc = rat, subcutaneous administration; Riv = rat, intravenous administration.
A comparison of the QAARs given in Table 11 with equations 1–8 in Table 3 shows that almost all those in Table 3 have better statistics than do those in Table 11, indicating that the use of median rodent LD50 values is preferable to the use of the worst case (i.e. ‘lowest’) rodent LD50 values for the prediction of HLD and probably other toxicity endpoints. The main exceptions involve intravenous LD50 values, as equations 4 and 54 are almost identical. It can be seen from Supplementary Information 2 that not only are there generally fewer intravenous LD50 values available, but their range is usually much narrower than those obtained from other routes of administration. It would thus appear that the intravenous route gives more accurate LD50 values than does administration by other routes.
Weiss and Sawyer 17 used the 50 MEIC chemicals in their study of the correlation of HLD values with worst case Mor, Mip, Ror and Rip LD50 values, so their results can be compared directly with those found in the present study. The r 2 values from their data were found to be: 0.636 (Mor); 0.784 (Mip); 0.578 (Ror); and 0.769 (Rip). In each case, these r 2 values are appreciably lower than those of the corresponding equations 1, 2, 5 and 6 in Table 3, again indicating that the use of median rodent LD50 values leads to better correlations with HLD values than does the use of ‘lowest’ rodent LD50 values. It should be noted that both approaches require extensive literature searches.
Do more rodent LD50 values yield more accurate median LD50 values?
It might be expected that the more rodent LD50 values that can be found for a given endpoint, the more accurate should be their median value. Equations 1–8 (Table 3) were developed using median rodent LD50 values (given in Supplementary Information 2), while equations 51–58 (Table 11) were developed using single worst-case LD50 values (given in Supplementary Information 2). The difference in the statistics between corresponding equations (e.g. 1 and 51) in Tables 3 and 11 should be a function of the number of rodent LD50 values employed to calculate the median LD50 values used in equations 1–8. The following correlations were obtained:
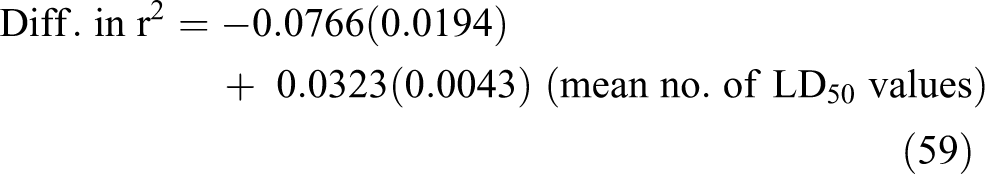
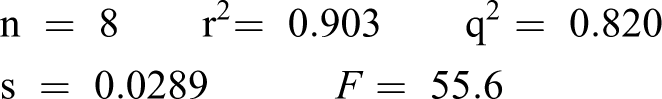
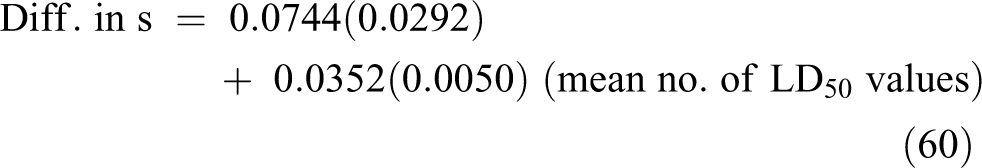
Equations 59 and 60 show clearly that the more rodent LD50 values are available for calculation of median values, the greater the improvement in prediction of HLD values. It follows that studies carried out using only a single set of LD50 values, rather than using average or median values, may be less accurate, although this would be dependent on the quality of the individual data set used. The advantage of the approach demonstrated here is that use of median values improves predictivity without the need for extensive data quality assessment.
Conclusions
Human lethal dosage (HLD) and human forensic lethal concentration (HFLC) values for 36 organic MEIC chemicals have been shown to correlate very well with mouse and rat median intraperitoneal LD50 values, and slightly less well with mouse and rat median oral LD50 values. The correlations of HLD values with subcutaneous and intravenous LD50 values were not as good. The use of median LD50 values gave better results than the use of lowest available LD50 values, with the advantage that no curation of data is required. Therefore, it appears feasible that publicly available median rodent LD50 values could be effectively used to obtain very good predictions of human toxicity, and thus make some reparation for the millions of rodent lives lost in LD50 testing. To this end, it would be admirable if other researchers could also undertake such investigations embracing a wider range of endpoints, in order to maximise — and indeed extend — the utility of the existing data.
Supplemental material
Supplemental Material, sj-pdf-1-atl-10.1177_0261192921994754 - Prediction of Human Lethal Doses and Concentrations of MEIC Chemicals from Rodent LD50 Values: An Attempt to Make Some Reparation
Supplemental Material, sj-pdf-1-atl-10.1177_0261192921994754 for Prediction of Human Lethal Doses and Concentrations of MEIC Chemicals from Rodent LD50 Values: An Attempt to Make Some Reparation by John C. Dearden and Mark Hewitt in Alternatives to Laboratory Animals
Supplemental material
Supplemental Material, sj-pdf-2-atl-10.1177_0261192921994754 - Prediction of Human Lethal Doses and Concentrations of MEIC Chemicals from Rodent LD50 Values: An Attempt to Make Some Reparation
Supplemental Material, sj-pdf-2-atl-10.1177_0261192921994754 for Prediction of Human Lethal Doses and Concentrations of MEIC Chemicals from Rodent LD50 Values: An Attempt to Make Some Reparation by John C. Dearden and Mark Hewitt in Alternatives to Laboratory Animals
Footnotes
Acknowledgements
The authors thank Dr Grace Patlewicz and Dr David Ebbrell for help and advice given.
Declaration of conflicting interests
The author(s) declared no potential conflicts of interest with respect to the research, authorship, and/or publication of this article.
Ethical approval
Ethics approval was not required for this research paper.
Informed consent
Informed consent was not required for this research paper.
Funding
The author(s) received no financial support for the research, authorship, and/or publication of this article.
Supplemental material
Supplemental material for this article is available online.
References
Supplementary Material
Please find the following supplemental material available below.
For Open Access articles published under a Creative Commons License, all supplemental material carries the same license as the article it is associated with.
For non-Open Access articles published, all supplemental material carries a non-exclusive license, and permission requests for re-use of supplemental material or any part of supplemental material shall be sent directly to the copyright owner as specified in the copyright notice associated with the article.