
Abstract
Few attempts have been made to estimate the global use of animals in experiments, since our own estimated figure of 115.2 million animals for the year 2005. Here, we provide an update for the year 2015. Data from 37 countries that publish national statistics were standardised against the definitions of ‘animals’ and ‘procedures’ used in the European Union (EU) Directive 2010/63/EU. We also applied a prediction model, based on publication rates, to estimate animal use in a further 142 countries. This yielded an overall estimate of global animal use in scientific procedures of 79.9 million animals, a 36.9% increase on the equivalent estimated figure for 2005, of 58.3 million animals. We further extrapolated this estimate to obtain a more comprehensive final global figure for the number of animals used for scientific purposes in 2015, of 192.1 million. This figure included animals killed for their tissues, normal and genetically modified (GM) animals without a harmful genetic mutation that are used to maintain GM strains and animals bred for laboratory use but not used. Since the 2005 study, there has been no evident increase in the number of countries publishing data on the numbers of animals used in experiments. Without regular, accurate statistics, the impact of efforts to replace, reduce and refine animal experiments cannot be effectively monitored.
Introduction
Despite growing public concern and the increasing availability of alternative methods, animals continue to be used for scientific purposes all over the world. The main purposes of experiments on live animals are: to gain basic biological knowledge; in the discovery and development of drugs, vaccines and medical devices; in the safety testing of drugs, other chemicals and consumer products; in environmental research; and in education and training.
In 2008, we attempted to estimate the number of animals used in experiments worldwide for the year 2005. 1 Our estimate of 58.3 million animals was the first attempt to derive an evidenced, worldwide figure and was based on the available national reports and a prediction model that used publication rate as a proxy for the number of experiments in those countries without national reports. It also included an extrapolation to a total of 115.3 million animals, to account for those animals killed for the provision of tissues, used to maintain genetically modified (GM) strains and bred for laboratory use but killed as surplus to requirements.
Our 2005 estimate has been widely cited. 2 –8 Aside from a discussion in Alternatives to Laboratory Animals (ATLA) immediately following its publication, suggesting that we should have used weighted averages in our extrapolations 9 (leading us to suggest that a range from 82 million to 154 million may be more appropriate 10 ), there have been few attempts since to improve or update it. The Lush Prize built on our estimate with statistics from eight countries for 2012 to give an updated estimate of 118.4 million for the year 2012. 11
Ten years have now passed since the publication of our estimate. We felt that it was important to revisit it, not only to try to improve the accuracy, but also to see whether there has been an increase or decrease in animal use. Therefore, the aim of this study was to collate data from countries that publish statistics on animal use and to use them (as we did previously 1 ) to create a prediction model to provide an estimate for those countries that do not report their numbers. Since there is particular public concern about the use of dogs and monkeys in scientific procedures, 12,13 we wanted also to provide an estimate for their use.
Improved requirements for the reporting of statistical data on the use of animals for scientific purposes in the European Union (EU) were introduced as part of the implementation of EU Directive 2010/63 on the protection of animals used for scientific purposes (the EU Directive). 14 These are outlined in the Commission Implementing Decision of 14 November 2012 establishing a common format for the submission of the information pursuant to Directive 2010/63/EU of the European Parliament and of the Council on the protection of animals used for scientific purposes 2012/707/EU (the Commission Implementing Decision). 15 According to the EU Directive (Article 54 (2)), member states must submit their statistical reports in line with the Commission Implementing Decision every year to the European Commission (the Commission), beginning with the data from 2014 by 10 November 2015. The Commission will collate these reports and publish a summary every three years, beginning on 10 November 2019 (Article 57 (2)). However, member states must publish their reports publicly annually (Article 54 (2)).
In comparison to the reporting required under the previous Directive (to which the statistics in the 2008 article were aligned), EU countries must now also report the use of cephalopods (e.g. squid, octopi and cuttlefish), independently feeding larval forms, fetal mammals in the last third of their gestation and animals with a harmful genetic mutation that are used to maintain colonies of such animals. Furthermore, member states also need to include information on the actual severity of the procedures (i.e. experiments) for each animal used. To do this, the number of procedures that have been completed in that year are now recorded; previously, it had been the number of animals that had begun to be used in that year.
Member states began reporting according to these new requirements in 2014. Therefore, reflecting the methodology used in 2008 and because a significant proportion of the available statistics still come from the EU, we decided to use the revised definitions of ‘animal’ and ‘procedure’ as set out in the Commission Implementing Decision.
As before, we also wanted to capture non-procedural uses of animals for scientific purposes. In 2005, we were able to estimate the numbers of animals killed for the provision of tissues, those used to maintain GM strains and those killed as surplus to requirements. It was our intention to also seek estimates for these uses and expand on them where possible. However, these estimates were dependent on data availability, that is, countries reporting such uses.
Methods
Collation of official national statistics
The methodology for the collation of official statistical reports, and any necessary adjustments and estimations, followed that outlined by Taylor et al. 1 Publicly available and officially recognised national statistics for the number of scientific procedures involving animals were sought for all user countries, preferably for the year 2015. Effort was made to find data from the countries with evidence of significant animal research (defined as those with more than 200 PubMed publications in 2016 that featured the use of animals). For the United Kingdom and Australia, regional reports (from Northern Ireland and Great Britain and from the various Australian states, respectively) were manually combined.
Adjustment for EU definitions of ‘animal’ and ‘procedure’
For some countries, the final numbers had to be extrapolated upward, to account for types of procedures that are reported in the EU, but were not reported in those countries. This was done by using the proportion used overall in the EU. Any animals or types of procedures falling outside the EU definitions were excluded from the totals of the national reports, where it was clear that their reporting requirements went beyond those of the EU, for example, decapods and non-invasive field studies of animals in the wild.
Definition of ‘animal’
According to the EU Directive (Article 1 (3)), the animals covered are live non-human vertebrate animals, including: independently feeding larval forms; and foetal forms of mammals as from the last third of their normal development and live cephalopods.
Definition of ‘procedure’
According to the EU Directive (Article 3 (1)), a procedure is …any use, invasive or non-invasive, of an animal for experimental or other scientific purposes, with known or unknown outcome, or educational purposes, which may cause the animal a level of pain, suffering, distress or lasting harm equivalent to, or higher than, that caused by the introduction of a needle in accordance with good veterinary practice. This includes any course of action intended, or liable, to result in the birth or hatching of an animal or the creation and maintenance of a genetically modified animal line in any such condition but excludes the killing of animals solely for the use of their organs or tissues.
Importantly, this means that non-GM animals that are bred or used in the creation of a new line, or for the maintenance of an established line (and which have not undergone a procedure related to that and/or are not used in further procedures), are not counted under the EU Implementing Decision. 15 Furthermore, GM animals that are known not to be suffering from a harmful genetic defect, which is used in the maintenance of an established line (and which have not undergone a procedure related to that and/or are not used in further procedures), are also not counted. Whether they are suffering from a harmful genetic defect is determined after two generations from the creation of the line and following animal welfare assessment. 15
Estimation of data for missing countries, by using animal study-based publication rate as a proxy for animal use
A prediction model was created and used to estimate the number of procedures for 2015 for countries for which official statistics could not be found. Our previous paper demonstrated that there is a strong correlation between the annual numbers of published papers in each country and their total animal use the previous year. 1 Therefore, a similar regression model was created, based on the number of published research papers involving animals in 2016 and the official number of procedures conducted in the preceding year, with data from countries for which the figures could be obtained (i.e. those in the Collation of official national statistics section). This was then used to estimate the number of procedures for 2015 for all the remaining countries for which official statistics could not be found, but for which the publication rate in 2016 could be determined.
Once the official figures were finalised, as described in the Collation of official national statistics section, the number of publications in 2016 was sought for each country in the world with a population above 200,000 in 2015, according to Worldometers.info. A total of 179 countries were included in the model (i.e. 43 low population countries were excluded), the same number of countries as in our 2005 estimate. 1
To obtain the number of publications that featured the use of animals for each country, a PubMed search was performed by using the term: country name (to be found in the address of the author(s), by using ‘AD’) and limiting the result to ‘journal articles’ relating to ‘animals’, published between 1 January 2016 and 31 December 2016. The entire search was conducted on 14 March 2018, to control for daily updates to the database. Papers were briefly reviewed to ensure that there were no non-relevant uses of country names included in the search results (e.g. Panama City, the United States) and that exclusion terms were applied if this proved to be the case. Multiple terms were given for countries with known additional names or acronyms (e.g. the United Kingdom, Great Britain, England, Scotland, Wales and Northern Ireland). For countries included in the creation of the model where the most recent statistics were not from 2015, the publication search was set for the year following the statistics, that is, if the statistics related to 2014, the date used for the bibliographic search was 2015.
To develop the estimation model, the number of publications featuring the use of animals was plotted against the number of procedures involving animal use, for the countries that had available statistical reports. The data for both variables were normalised by log10 transformation, then a linear regression model was created with ‘number of procedures’ as the dependent variable and ‘number of publications’ as the independent variable. The regression model was then applied to calculate the estimated number of procedures by each country, with a population of over 200,000, for which official statistics were not available.
The total number of procedures for each country, as derived from the regression model, was then added to the actual figures (adjusted as described above) for the countries with published official reports. Therefore, this estimate approximated to the number of procedures conducted on animals for scientific purposes worldwide in 2015, according to EU definitions.
Extrapolation to cover the non-procedural uses of animals
The national reports were scrutinised for the reporting of additional animals used for scientific purposes but not used in procedures. We identified three main categories in some national reports: – animals killed for the purpose of supplying tissues for ex vivo or in vitro use; – non-GM or GM animals without a harmful mutation that are used to maintain established GM colonies; and – non-GM animals bred but not used.
For the countries that did not report these data, the proportion by which their estimated total figure increased when including these additional animals was based on the weighted average percentage of this type of animal use in those countries that did report the data.
The use of dogs and monkeys
The weighted average percentage of procedures involving monkeys and dogs used in those countries reporting their numbers (based on their official or adjusted total number of procedures) was used to estimate the level of monkey and dog use in the remaining countries for which data were unavailable.
Results
Collation of official national statistics
Annual statistics were obtained from 37 countries (30 from Europe, three from Asia, two from Oceania and two from North America). The total number of procedures involving the use of animals in these countries, according to their own national definitions, was 41.8 million. For EU reports, the number reported was the number of scientific procedures; for all other reports, the number of animals used in scientific procedures was reported. Table 1 provides the official (i.e. as reported in official reports), adjusted (based on the official report but adjusted as described in the Methods section) and estimated (based on the regression model) numbers for all world countries with evidence of significant animal research, including details of any adjustments made and references to the data source.
The number of procedures involving the use of animals in 2015 (or nearest year) by country, ranked by the number of animal study-based publications in PubMed in 2016.a
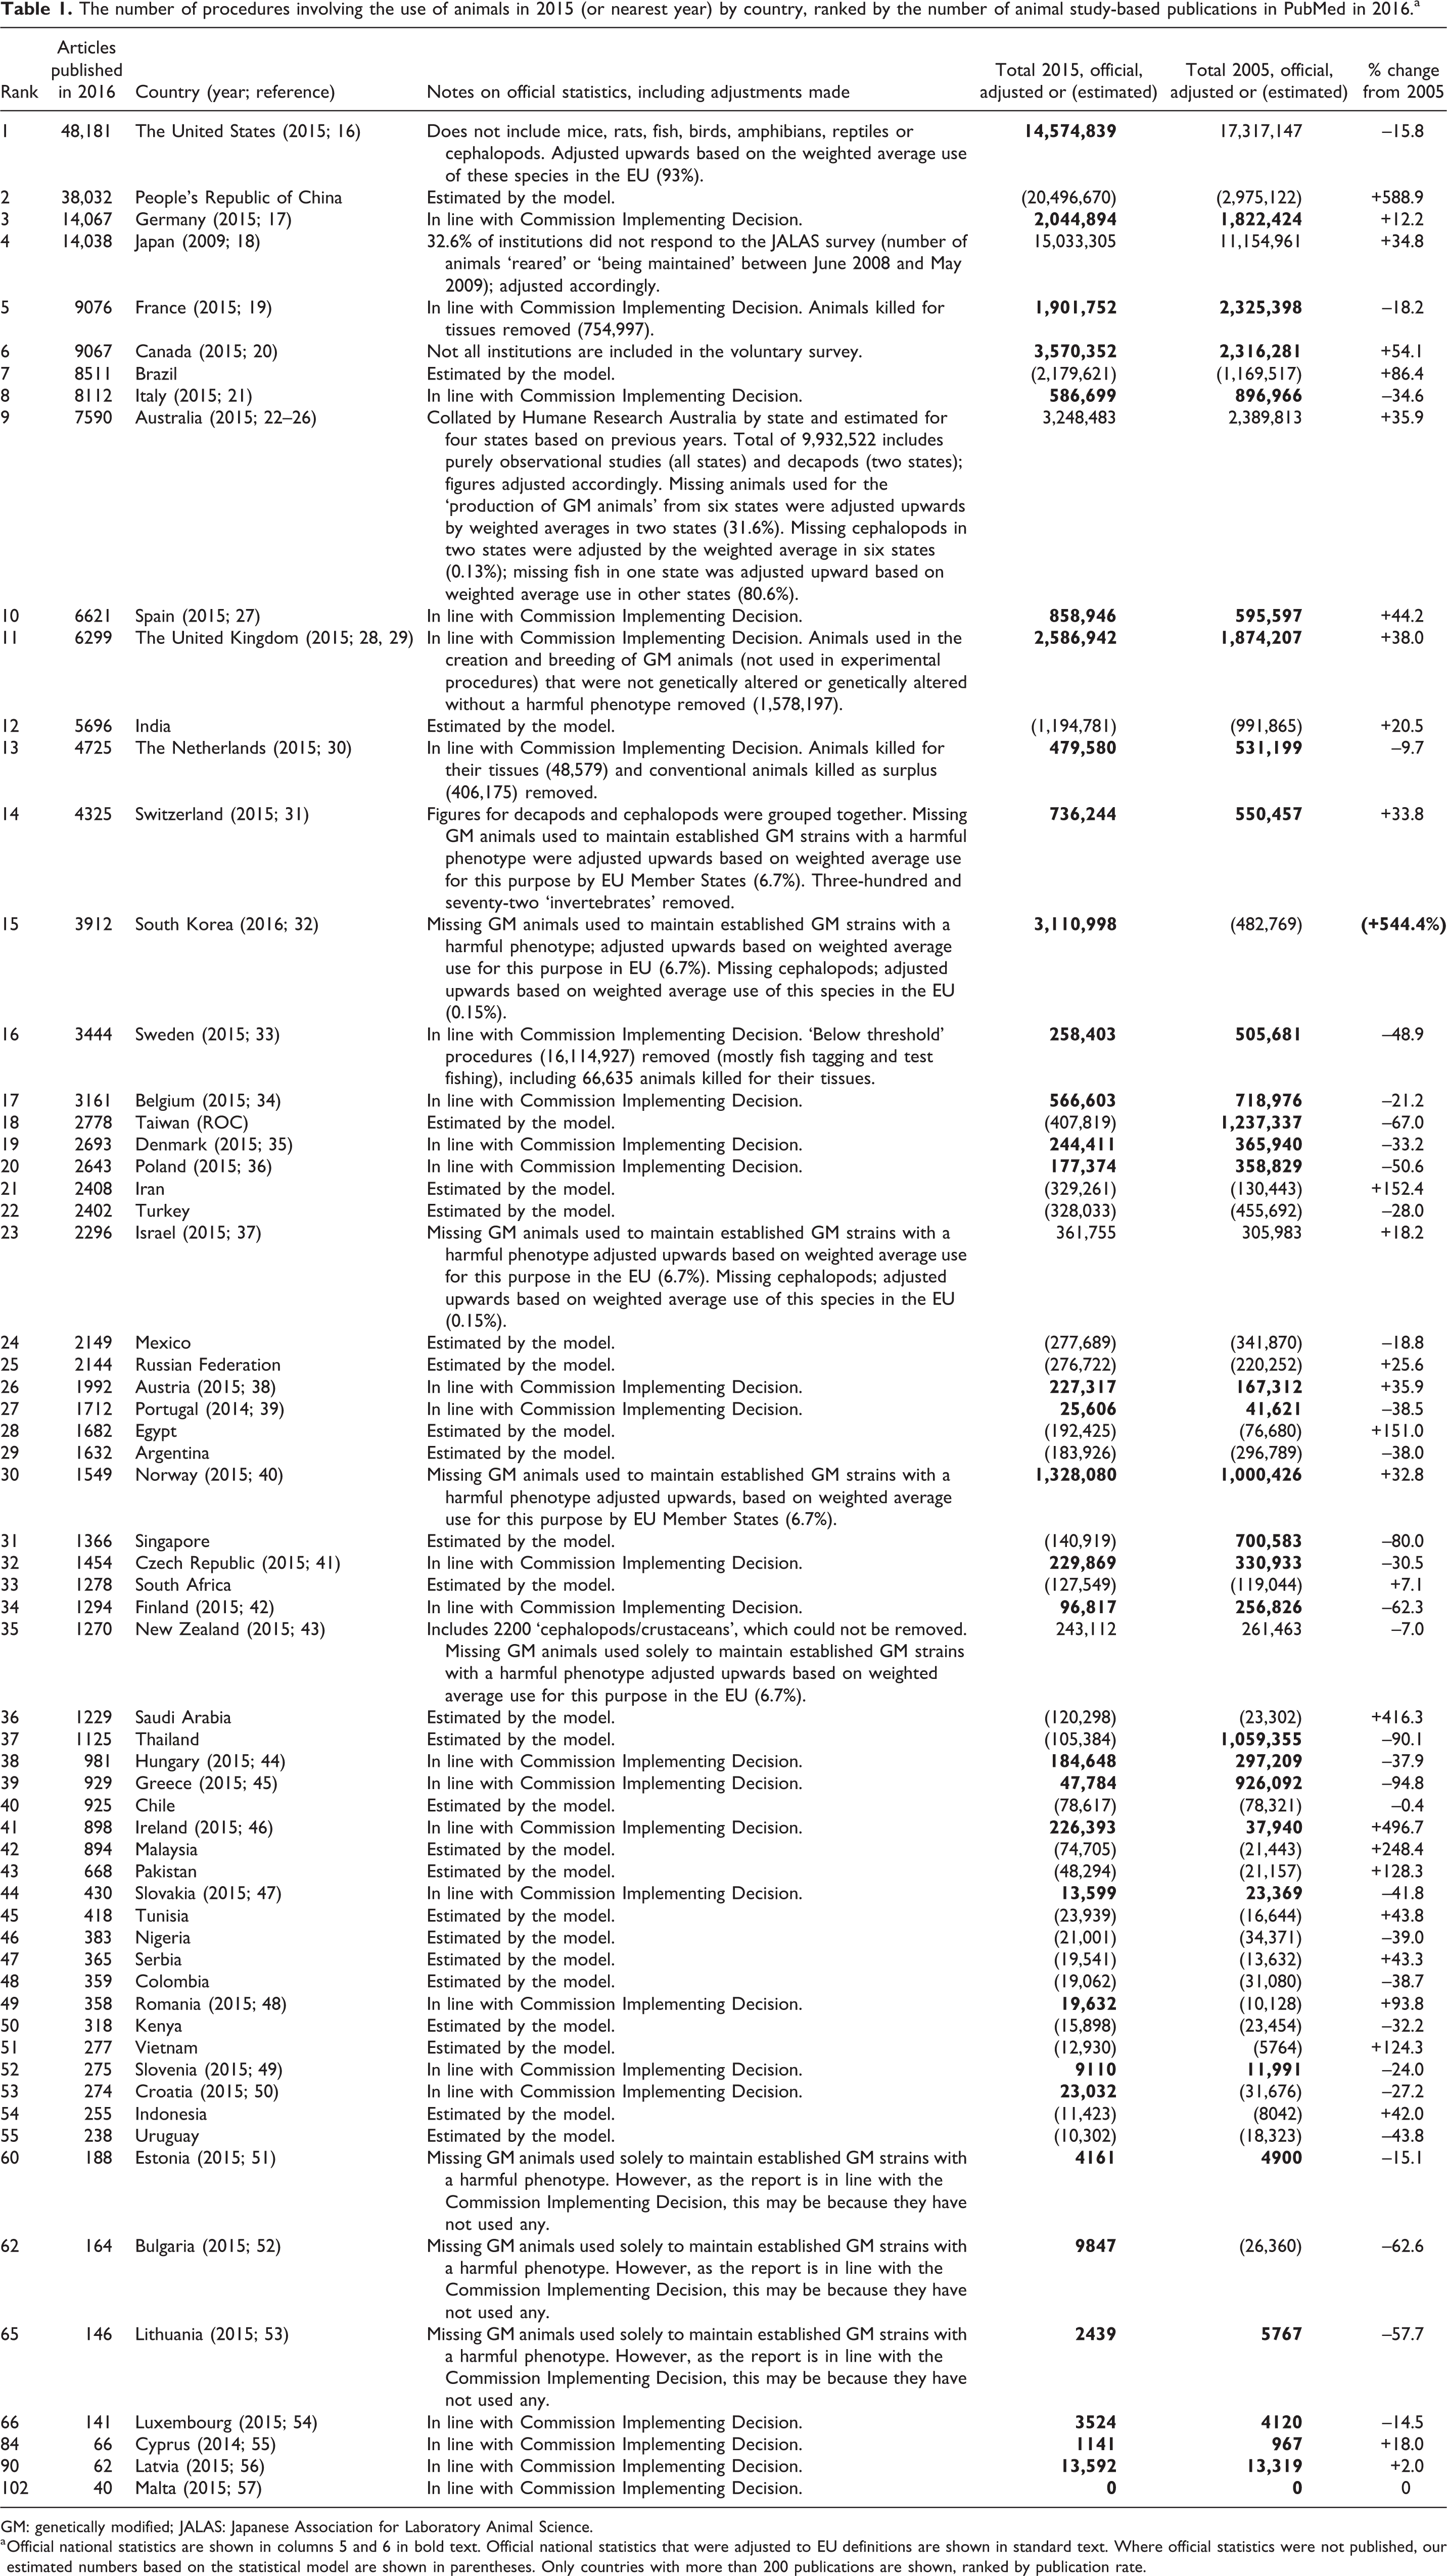
GM: genetically modified; JALAS: Japanese Association for Laboratory Animal Science.
a Official national statistics are shown in columns 5 and 6 in bold text. Official national statistics that were adjusted to EU definitions are shown in standard text. Where official statistics were not published, our estimated numbers based on the statistical model are shown in parentheses. Only countries with more than 200 publications are shown, ranked by publication rate.
No statistics were obtainable for African or South American countries. Although the following countries had evidence of significant animal research (i.e. more than 200 PubMed publications in 2016 that featured the use of animals), publicly accessible statistics were not available for: China; Brazil; India; Taiwan; Iran; Turkey; Mexico; Russia; Egypt; Argentina; Singapore; South Africa; Saudi Arabia; Thailand; Chile; Malaysia; Pakistan; Tunisia; Nigeria; Serbia; Colombia; Kenya; Vietnam; Indonesia and Uruguay.
Furthermore, the statistics available for the United States, Japan, Canada and Australia are also significantly incomplete, in view of them not including certain species of animals (the United States), being based on voluntary surveys (Japan and Canada) or being part-estimated based on previous years collated by a third party (Australia).
Liechtenstein and San Marino are the only countries known to have banned all animal experiments. In addition, no procedures were reported to have been carried out in Malta in 2015.
Adjustment for EU definitions of ‘animal’ and ‘procedure’
On the basis only of available national reports, and after adjustment in line with the EU definitions and criteria, the number of scientific procedures involving the use of animals in the 37 reporting countries in 2015 was 53.1 million. This is also presented in Table 1, with the value appearing in bold, if it was in line with the EU definition.
Definition of ‘animal’
Except for some countries with regard to the cephalopod category, the United States 16 was unique in being the only reporting country that did not include all of the animals covered by the EU definition. The United States does not report the number of mice, rats, birds, fish, reptiles, amphibians or cephalopods used, so the actual numbers had to be adjusted upward by the weighted average use of these species in the EU (93%).
The number of procedures on cephalopods was added to the data from the state of Western Australia, South Korea and Israel (none of which reported the use of these animals), by using the weighted average use of cephalopods in the EU (0.15%).
Decapod crustaceans (e.g. shrimp, crabs and lobsters) were the only additional animal reported by some countries that are not covered under the EU definition: certain states in Australia reported decapod use, and this was excluded from our analysis. However, in the data from New Zealand and Switzerland, decapods were grouped together with cephalopods and could not be excluded. Norway counted decapods, as well as cephalopods, in their 2016 statistical report, 58 but due to the lack of detail available in the 2015 report, we were unable to determine how many decapods were used and the figure could, therefore, not be adjusted.
The figures for Japan came from a survey conducted by the Japanese Association for Laboratory Animal Science, 18 as there were no official data available from government authorities. The survey, which asked for data on the number of animals ‘reared’ or being ‘maintained’ between June 2008 and May 2009, was sent to 1593 experimental facilities across Japan. According to the survey report, 32.6% of institutions failed to respond. Therefore, the total figure for Japan was increased by this proportion to account for the missing respondents.
The Canadian Council on Animal Care (CCAC) reported that a total of 3.6 million animals were used in Canada in 2015. 20 While most Canadian institutions are thought to hold CCAC accreditation and must, therefore, report their animal use numbers, not all institutions participate in this voluntary programme. However, since we were unable to determine the exact proportion of Canadian institutions that are not members of the CCAC, and because the report appeared to be in line with the definitions and criteria of the EU Directive, no adjustments to the final figure were made.
Finally, it should also be noted that for Australia, the data were obtained from Humane Research Australia, 26 which had already estimated the numbers for non-reporting states (Queensland, South Australia, Australian Capital Territory and Northern Territory), based on the data obtained in previous years.
Definition of ‘procedure’
The keeping of animals with a harmful genetic mutation, to maintain colonies of such animals (but which are not themselves used in another procedure), is defined as a procedure likely to cause harm, etc., and should be reported under the EU Implementing Decision.
Animals used in this type of procedure were not included in any of the available non-EU national reports (Switzerland, Norway, New Zealand, Israel and South Korea), although Canada did report the generation of GM animals. Therefore, the figures had to be adjusted upward based on the weighted average use of animals for this purpose in the EU (6.7%). Numbers of animals used in this type of procedure were also missing from the US statistics — however, we did not extrapolate in this case because the total number of the most common GM species (e.g. fish, mice and rats) had already been accounted for in the extrapolation described in the previous section.
The United Kingdom 28,29 additionally reports the number of procedures to create or maintain colonies that involve animals that were ‘not genetically altered’ (e.g. wild-type offspring of heterozygous parents) or ‘genetically altered without a harmful phenotype’ (see Extrapolation to cover the non-procedural uses of animals), so these values were removed from the reported total.
Two states in Australia (New South Wales and Western Australia) included a separate severity category for ‘ALL animals used in GM production other than the final progeny which are used in a different category of procedure’. 26 Based on this definition, it could be assumed that all animals used to create a new strain of GM animals, and those used to maintain established GM strains with or without a harmful mutation, would be included here. However, given the uncertainty, no adjustments were made to this figure, and the weighted average of the number of animals used under this category in these two states (31.6%) was used to extrapolate upward for the other Australian states.
According to the four reporting Australian states, animals in the lowest severity category — ‘observational studies involving minor interference’ — are “not interacted with or, where there is interaction, it would not be expected to compromise the animal’s welfare any more than normal handling, feeding, etc. There is no pain or suffering involved”. 26 None of these procedures would be counted in the EU, according to the EU definition, and were therefore excluded. The weighted average percentage increase for these states (413.7%) was used to reduce the estimate for the remaining states, under the assumption that they also recorded observational studies. This brought the total number for Australia down from a reported official 9,932,522 animals to 3,248,483 (after all the other adjustments described here).
The United Kingdom permits researchers to report the numbers of procedures for which they determine post hoc that the level of suffering had been in fact ‘sub-threshold’, that is, below the definition of a procedure according to the EU Directive. In 2015, this amounted to 1,395,019 procedures (1,126,544 of which were during the creation and maintenance of GM animal colonies, see above). However, we did not delete these procedures from the United Kingdom total, as the United Kingdom is currently unique in doing this and the criteria by which researchers classify that the animal has not suffered is limited. 59 Furthermore, these were procedures that were considered a priori to be above threshold. 28,29 Sweden separately records the number of procedures that researchers know a priori are ‘in addition to the EU definition’, that is, ‘below threshold’. This includes procedures such as fish tagging (16,114,927 procedures in 2015), 33 which are explicitly not included under the EU definition and were, therefore, not added to Sweden’s total.
Estimation of data for missing countries, by using animal study-based publication rate as a proxy for animal use
The data from 37 countries with official statistics were entered into the regression model against their publication rates in the following year. There was a highly significant, positive linear relationship between publication rate and animal use (log-transformed), as shown in Figure 1 (regression equation: log10[procedures] = 1.497 log10 [publications] + 0.4552; r 2 = 0.9188).
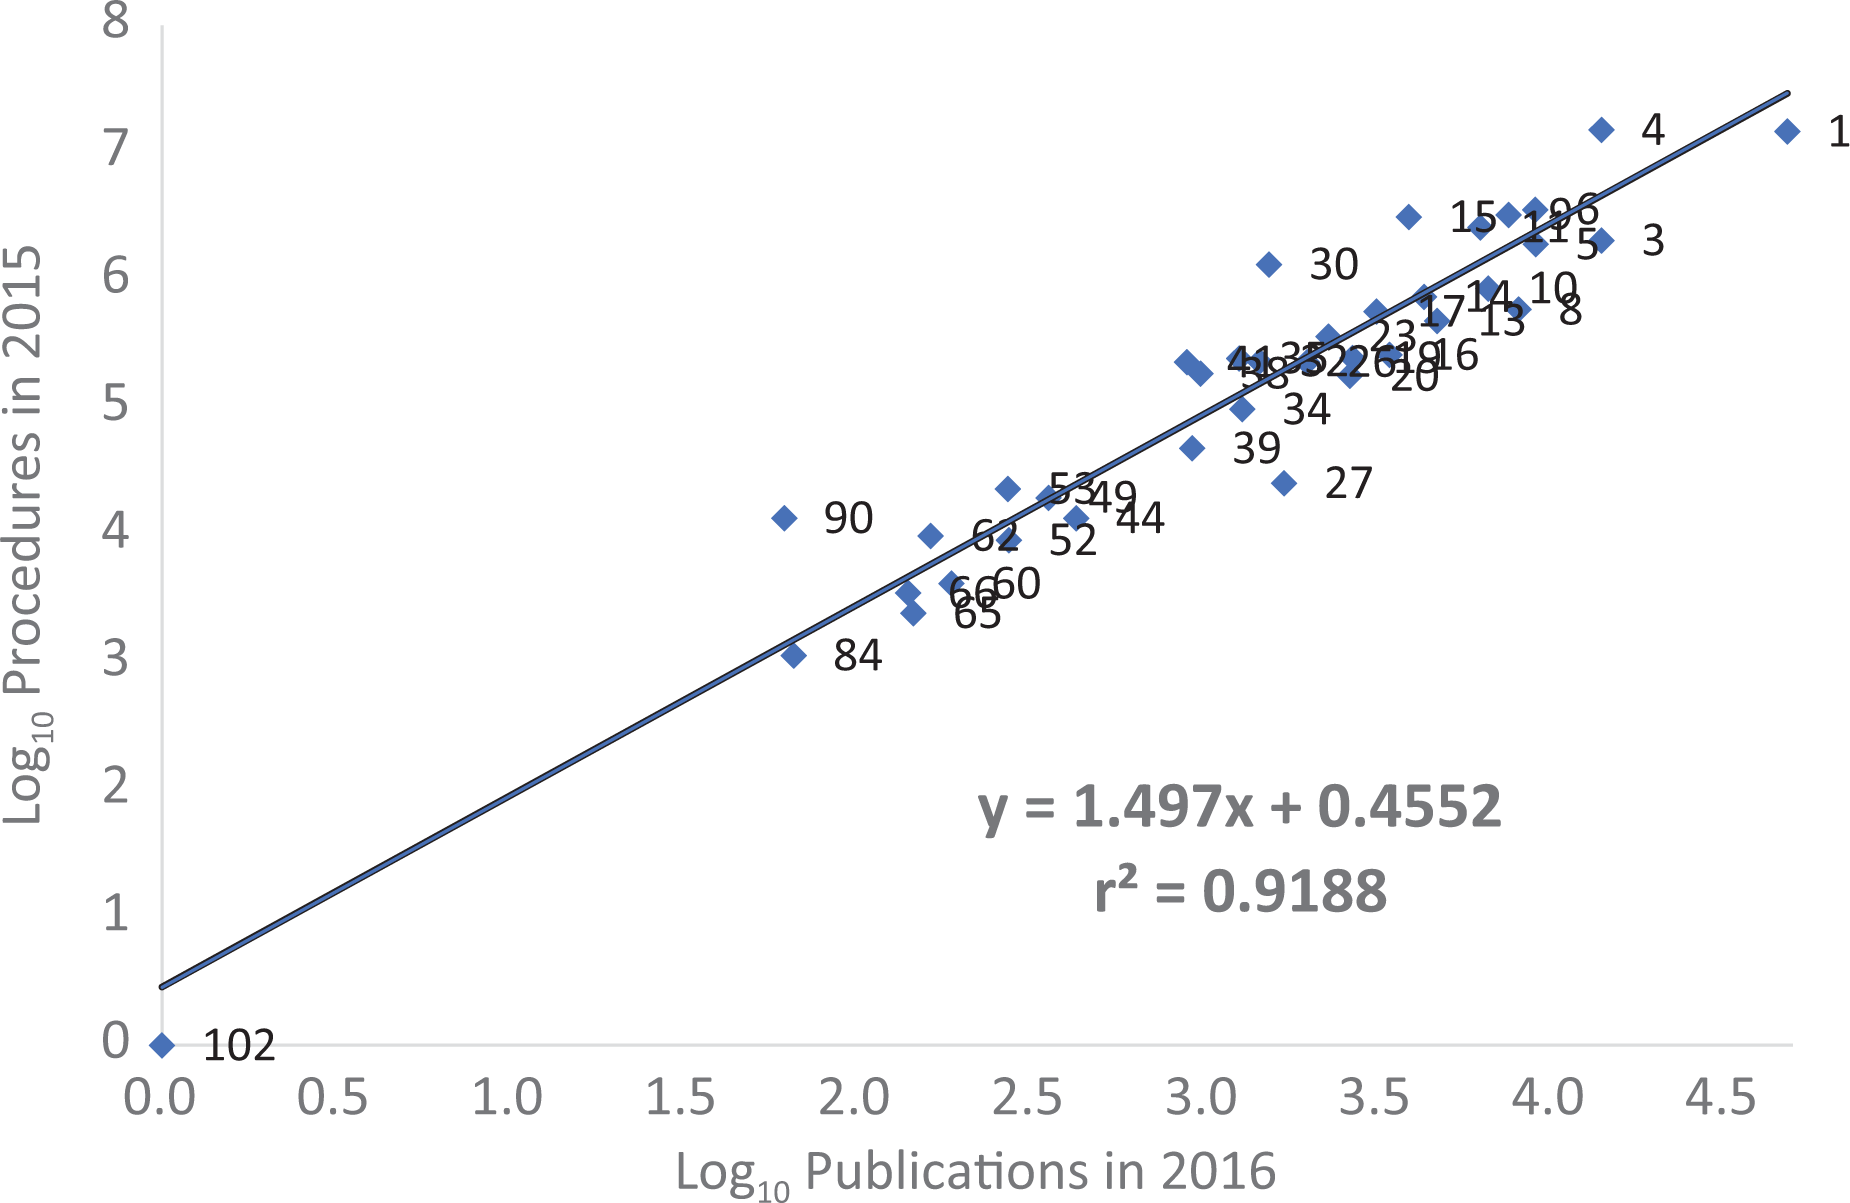
The linear regression of the number of animal study-based publications per country in 2016 (log10) and the number of procedures involving the use of animals in 2015 (log10). The numbers refer to the countries with official statistics, as ranked in Table 1; n = 37 countries. Malta (102nd) had 40 animal publications but no laboratory animal use recorded for the previous year. y = 1.497x + 0.4552; r 2 = 0.9188.
For the countries without official statistics (n = 142), animal use in 2015 was estimated by using the regression model. Of these countries, nine produced one or zero publications relating to animal use, and their estimates, therefore, represented the intercept in the regression model (i.e. three procedures). The model estimated the total number of procedures in these 142 countries as 26.8 million. The total for each country is presented in Table 1, with the values given in parentheses as they are estimates.
The total number of procedures involving the use of animals in 2015 by those 179 countries with a human population greater than 200,000 was 79.9 million.
The top 10 animal users, according to EU definitions, were: China (20,496,670 (estimated)); Japan (15,033,305 (adjusted)); the United States (14,574,839 (adjusted)); Canada (3,570,352 (official)); Australia (3,248,483 (adjusted)); South Korea (3,110,998 (adjusted)); Brazil (2,179,621 (estimated)); the United Kingdom (2,586,942 (official)); Germany (2,044,894 (official)) and France (1,901,752 (official); see Figure 2).
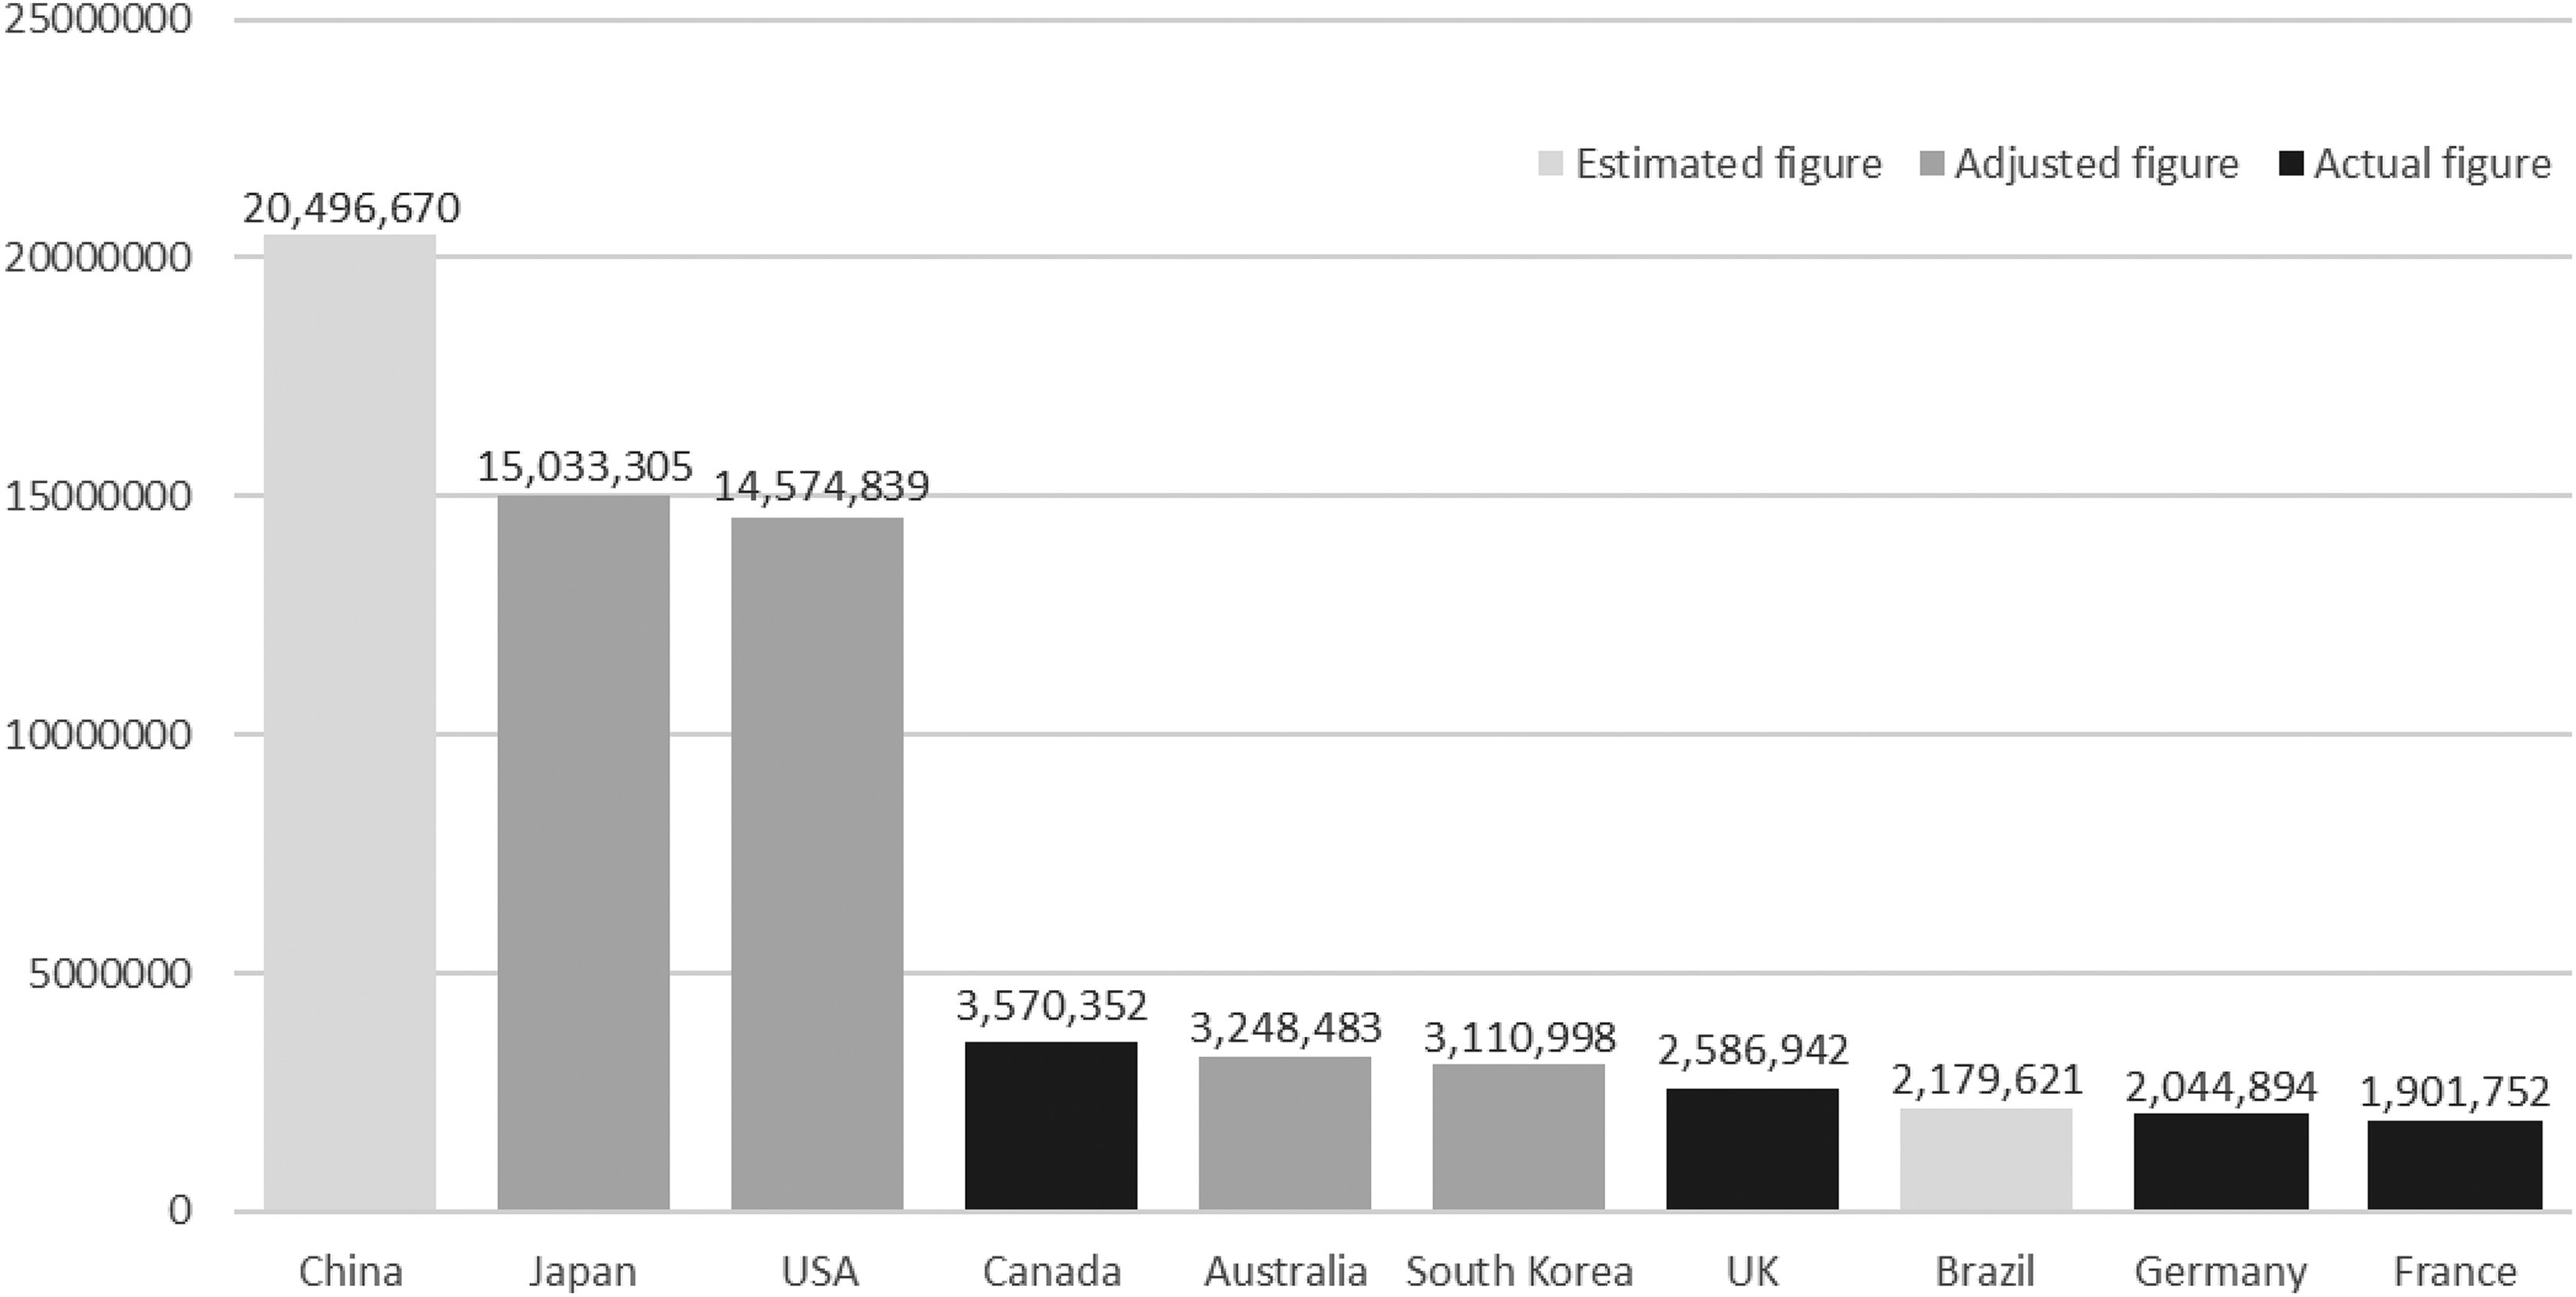
The top ten animal-using countries based on actual, adjusted and estimated figures. The figures represent the numbers of procedures. Figures were adjusted according to the EU definitions and estimated figures were derived from the statistical model.
Extrapolation to cover the non-procedural uses of animals
Animals used for tissue supply
Statistics were available from three countries that count the number of animals killed to provide tissues for ex vivo or in vitro scientific use: – Germany:
17
In 2015, 754,997 animals were killed for tissues for in vitro use, in addition to the total of 2,044,894 in line with the Commission Implementing Decision (an additional 37%). – The Netherlands:
30
In 2015, 48,579 animals were killed for tissues for in vitro use, in addition to the total of 479,580 in line with the Commission Implementing Decision (an additional 10.1%). – Sweden:
33
In 2015, 66,635 animals were killed for tissues for in vitro use, in addition to the total of 258,403 in line with the Commission Implementing Decision (an additional 25.8%).
For these three countries, the average weighted additional percentage of animals killed for their tissues was 32.1%.
Non-GM or GM animals without a harmful mutation that are used to maintain established GM colonies
The EU Implementing Decision only requires the reporting of GM animals with a harmful mutation that are used to maintain established GM colonies. However, the United Kingdom also reports the number of procedures to create or maintain colonies that involved animals that were ‘not genetically altered’ (e.g. wild-type offspring of heterozygous parents) or ‘genetically altered without a harmful phenotype’. 28,29 In 2015, 1,578,197 procedures were conducted for the creation of new lines and maintenance of established lines of GM animals involving non-GM or GM animals without a harmful mutation (an additional 61%). Therefore, the worldwide estimate was adjusted upward based on the UK’s use of animals for this purpose.
Non-GM animals bred but not used
Article 54(1) of the EU Directive requires member states to submit additional information on the operation of the EU Directive in their country on a five-year basis. 14 This includes the number of ‘animals bred, killed and not used in procedures including genetically altered animals not covered in the annual statistics, covering the calendar year prior to that in which the 5-year report is submitted’. The reports are not yet available. However, the United Kingdom has published its report for the year 2017. 60 In addition to 1.9 million animals ‘involved in creation or breeding of GA animals, not used in experimental procedures’, and 1.82 million animals ‘used in experimental procedures for the first time in 2017’ (both of which are reported in the UK annual report (see above), there were a further 1.81 million ‘non-GM animals bred for scientific procedures that were killed or died without being used in scientific procedures’. These are animals additional to those referred to in the above section (i.e. an additional 48.7%). This includes animals that are used in breeding, animals killed for tissue and animals that were bred, but subsequently considered unsuitable or surplus.
The Netherlands provides this information annually. According to their 2015 statistical report, 30 permit holders are required to report the number of ‘animals that were killed or killed after use in breeding (e.g. parent animals used for breeding)’ (90,688 animals) and ‘animals that died or were killed before use in breeding or an animal test (e.g. due to unsuitability for use in animal experiments)’ (315,487). Therefore, the total number of animals that were killed in 2015 without being used in a procedure was 406,175, in addition to the 479,580 procedures reported in line with the Commission Implementing Decision (an additional 84.7%).
The United States also provides data on the number of animals being held by facilities but not used in procedures that year. 16 This includes animals ‘held by a facility but not used in any research that year’, that is, the ‘number of animals being bred, conditioned, or held for use in teaching, testing, experiments, research, or surgery but not yet used for such purposes’. According to the 2015 statistical report, 61 this included 136,525 animals, in addition to the 767,622 reported as having undergone procedures (an additional 17.8%).
For these three countries, the average weighted percentage of non-GM animals bred and not used was 47.4%.
Adjusting for additional animal use due to estimates of the extra percentage of animals killed only for tissue supply (32.1%), non-GM and GM animals without a harmful mutation used for the breeding and maintenance of GM colonies (61%) and animals bred but not used (47.4%), yields an extrapolation of 140.5%. This increases the number of animals used for scientific purposes overall to a total of 192.1 million animals (summarised in Table 2).
Estimates for the worldwide number of procedures involving the use of animals in 2015.
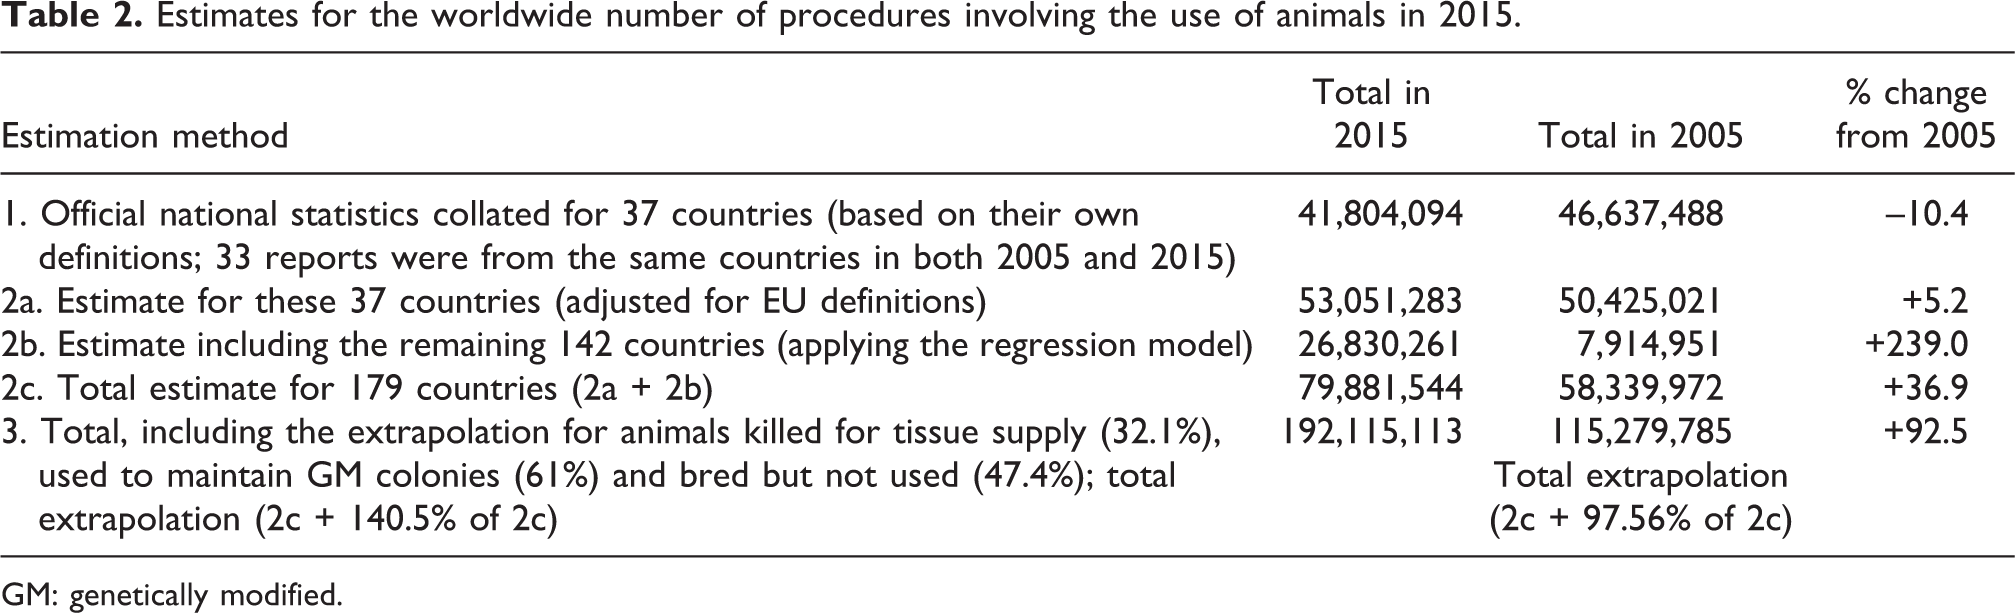
GM: genetically modified.
The use of dogs and monkeys
All 37 countries with official reports included information on the number of dogs used, except South Korea. A total of 112,265 dogs were used by 36 countries. The weighted average percentage use of dogs in these 36 countries was used to estimate the use of dogs in the remaining 173 countries (including South Korea; 0.33%, an additional 95,459 dogs). Therefore, an estimated total of 207,724 dogs were used in procedures in 2015. The top ten users of dogs (see Figure 3) were: China (65,546 (estimated)); the United States (61,101 (official)); Canada (9573 (official)); South Korea (9443 (estimated)); Japan (8995 (official)); Australia (7969 (official)); Brazil (7017 (estimated)); the United Kingdom (4753 (official)); Germany (4491 (official)) and India (3854 (estimated)).
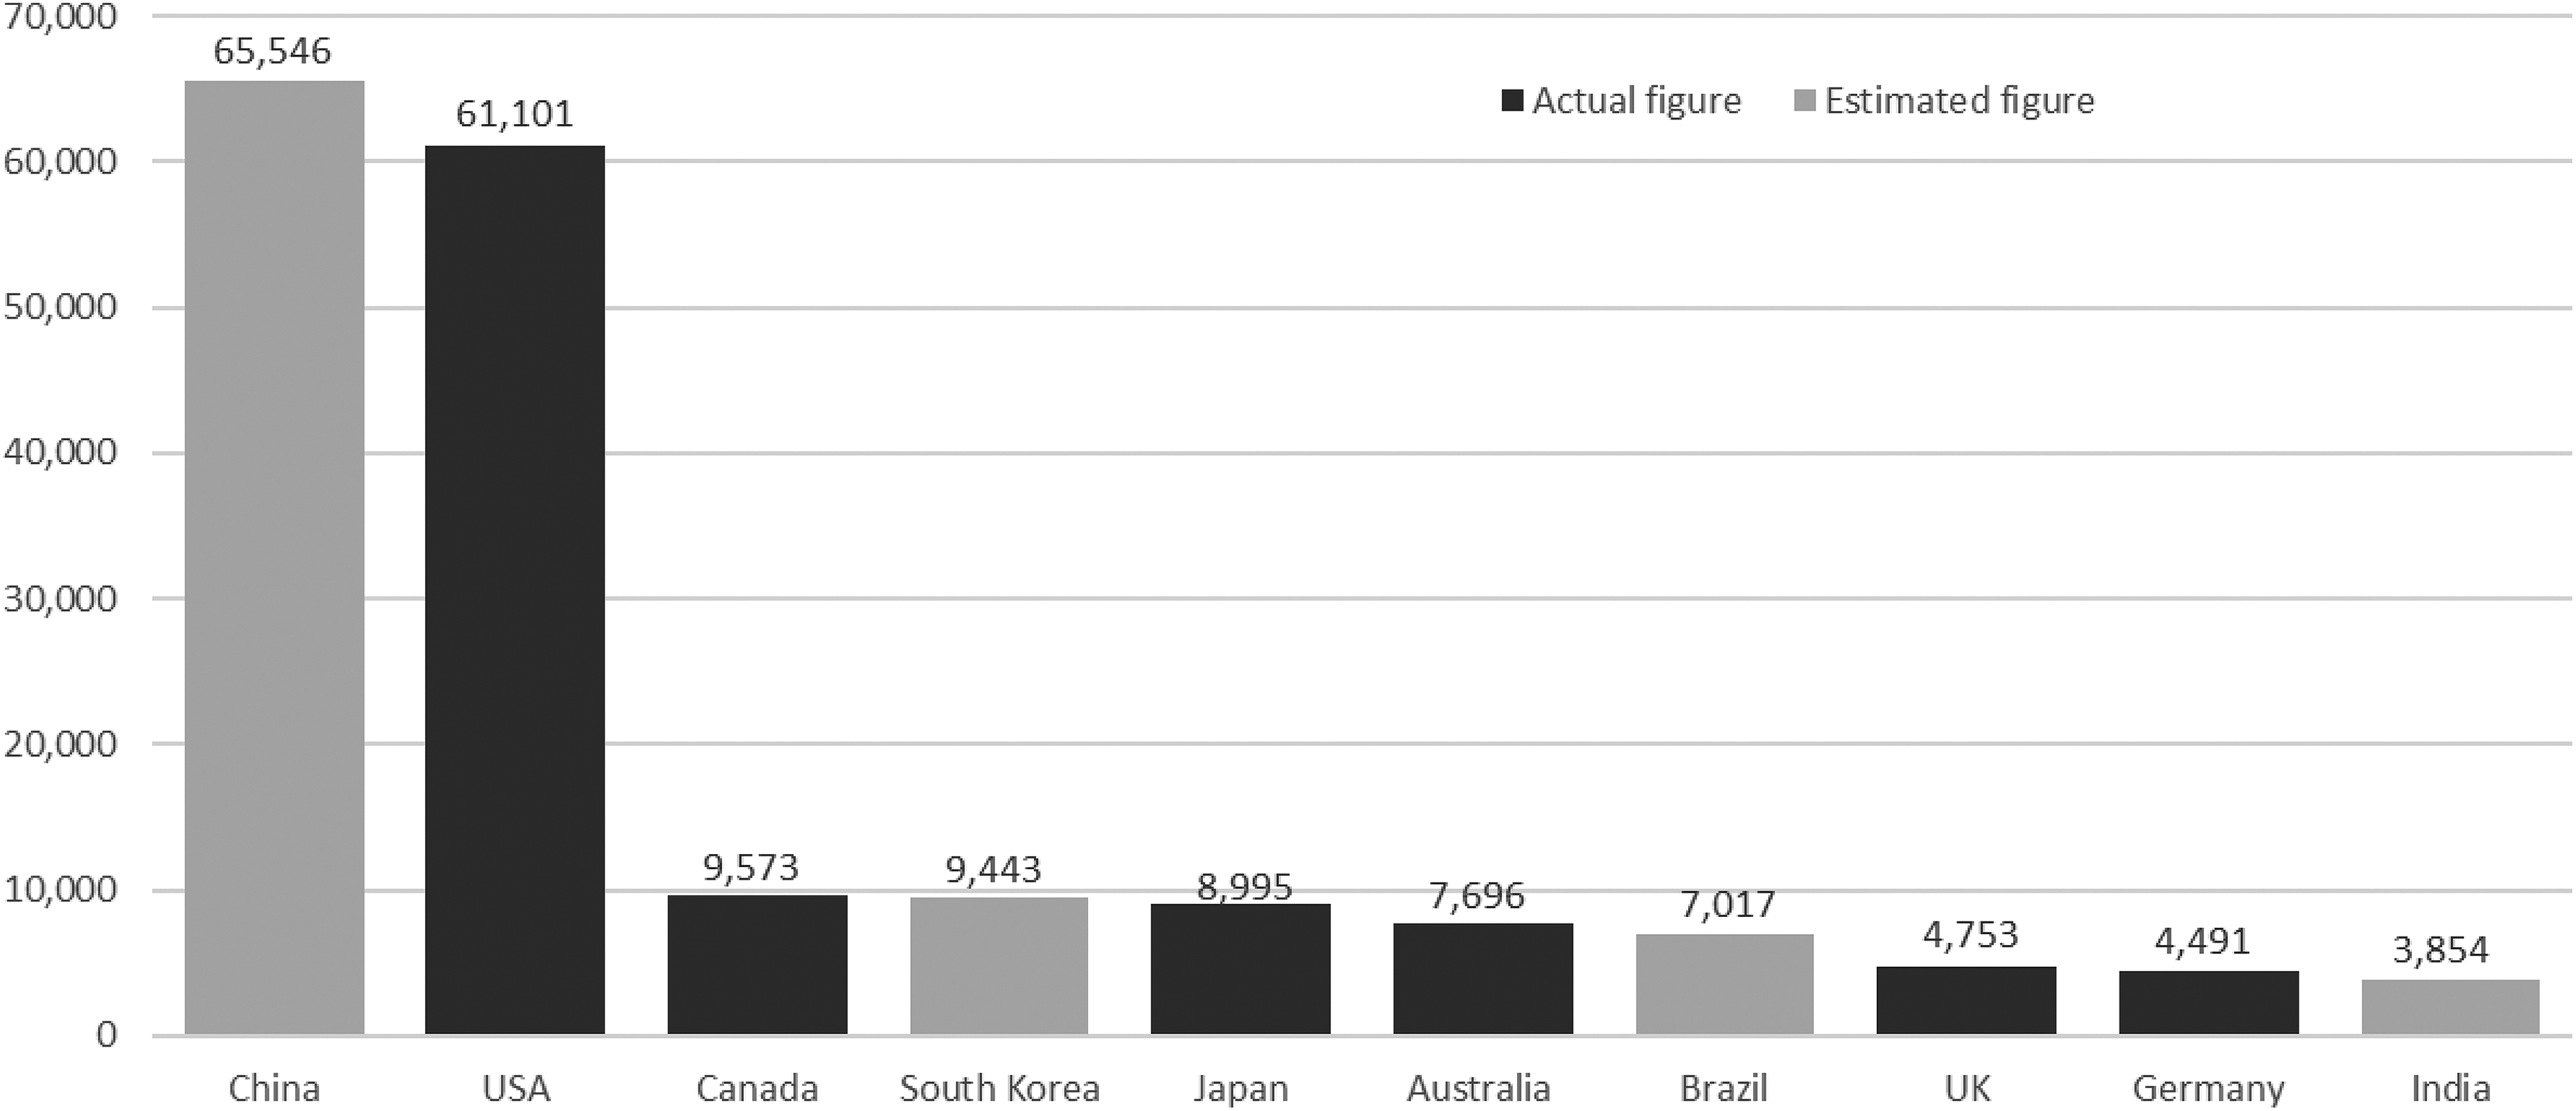
The top ten users of dogs in 2015, based on actual or estimated figures. The figures represent the numbers of procedures. Estimated figures were derived from the statistical model.
All 37 countries with statistical reports included information on the number of monkeys used. A total of 92,431 monkeys were reported to have been used by 37 countries. The weighted average use of monkeys in these 37 countries was then used to estimate the use of monkeys in the remaining 172 countries (0.25%, an additional 66,349 monkeys). Therefore, an estimated total of 158,780 monkeys were used in procedures in 2015. The top ten users of monkeys (see Figure 4) were: the United States (61,950 (official)); China (50,558 (estimated)); Japan (11,426 (official)); Brazil (5413 (estimated)); Canada (4942 (official)); the United Kingdom (3612 (official)); France (3162 (official)); Germany (3118 (official)); India (2972 (estimated)) and South Korea (2544 (official)).
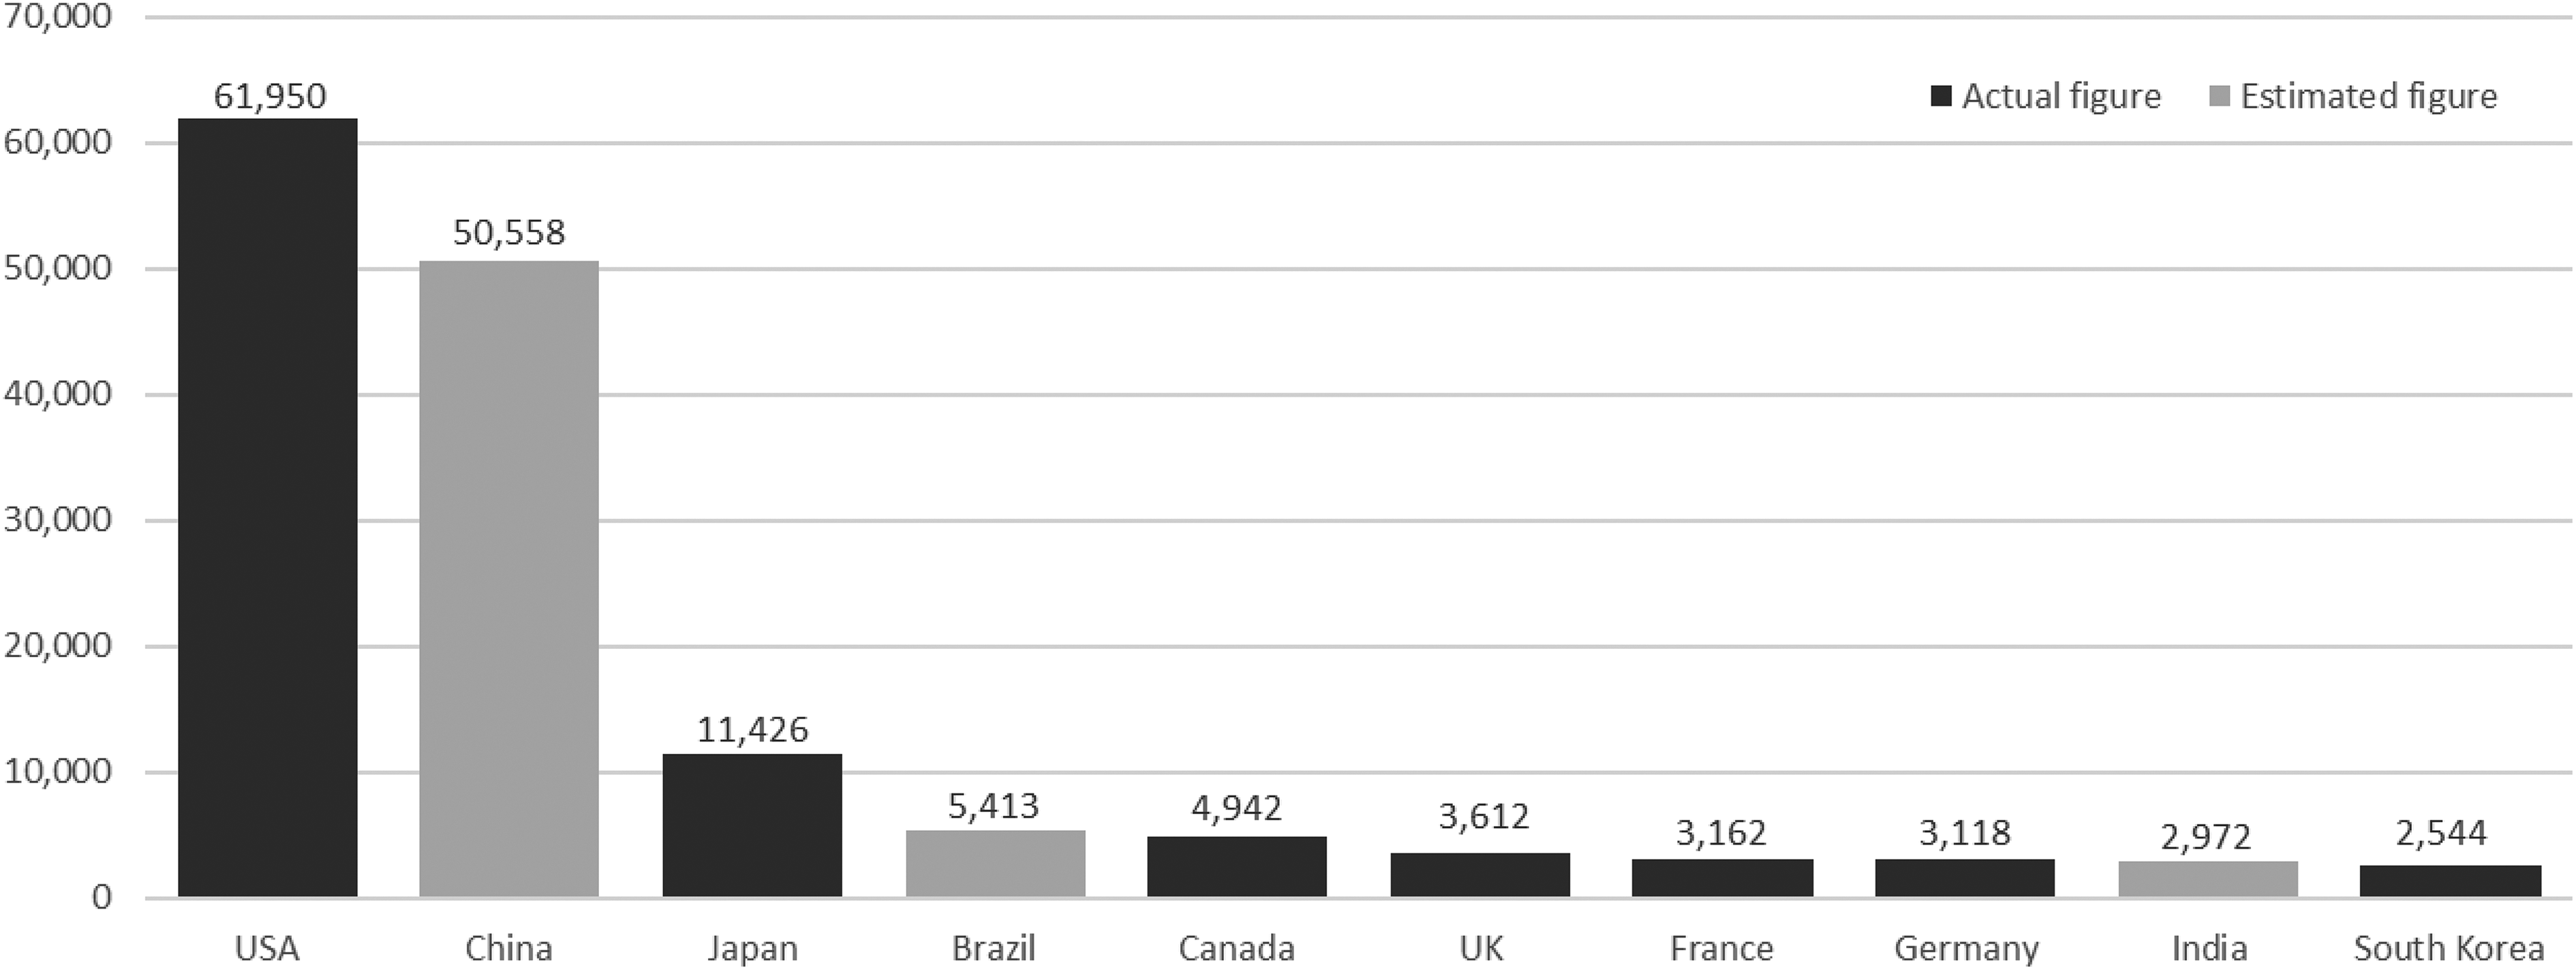
The top ten users of monkeys in 2015, based on actual or estimated figures. The figures represent the numbers of procedures. Estimated figures were derived from the statistical model.
Discussion
Updated estimate
Ten years after our previous estimate of the worldwide use of laboratory animals, 1 we have produced an updated range of estimates that we believe are more accurate and comprehensive than those obtained previously.
Following the same methodology, but according to the revised EU definitions, our estimates present a global figure for the number of animals used in scientific procedures across 179 countries in 2015 as 79.9 million. This constitutes a 36.9% increase in the 2005 estimate of 58.3 million and includes all mammals, birds, reptiles, amphibians, fish and cephalopods used in scientific procedures that are likely to cause them pain, suffering, distress or lasting harm.
The increase in the estimate is not likely to be explained by changes to the definition of ‘animal’ and ‘procedures’ in the revised EU Directive. In the EU, the use of cephalopods and animals for the maintenance of established GM animals with a harmful mutation accounts for a weighted average increase of only 0.15% and 6.7%, respectively. However, new EU reporting requirements also include the reporting of larval and fetal forms. Since these are not reported separately (but are reported within their species line), it is difficult to know whether these additional reporting requirements have led to the increase. At least in the United Kingdom, it led to a moderate increase in the number of amphibians reported in 2014 but that was all. 62 Furthermore, given that the total number of procedures from the 37 official country reports (adjusted; 33 reports were from the same countries in both 2005 and 2015) has increased only marginally (by 5.2% for all 37) between 2005 and 2015, this suggests that this reporting change has not had a significant impact on animal numbers.
A more likely explanation for the overall increase in numbers from 2005 is that the revised regression model, based on the number of animal study-based scientific publications in 2016, has led to an increase in the estimates from non-reporting countries. Indeed, this aspect of the total estimated figure has increased from 7.9 million to 26.8 million animals between 2005 and 2015. The size of the coefficient in the regression model has not changed significantly; from 1.120× to 1.497× in 2015) — however, the number of animal study-based publications retrieved per country has approximately doubled. A total of 246,973 such publications were retrieved in 2016, as compared with 147,606 publications in 2006 (a 67.3% increase). According to a recent article, the global scientific output, as measured by publication rate, is thought to double every nine years, 63 which is consistent with our findings. Whether this means that there is more animal-based research, that researchers are publishing more or that PubMed has become more populated with journals and papers is not known. However, it is interesting to note that the accuracy of our regression model has increased from an r 2 value of 0.75 in our previous work 1 to 0.92 in this current analysis. This means that the correlation between publication rate and animal use is very strong, and, therefore, our new estimates are likely to be more accurate.
In the 2005 estimate (adjusted to EU definitions), the top 10 animal users (in descending order) were: the United States; Japan; China; Australia; France; Canada; Great Britain; Germany; Taiwan and Brazil.
In 2015, China (with an increase from an estimated 3 million experiments to an estimated 20.5 million procedures) has replaced the United States as the top user. This probably reflects a more accurate estimate for China, as more scientific publications from China can now be found on PubMed, as compared with 2005. 64 There is also plenty of evidence that, in the last 10 years, China has increased its animal use. 65 Interestingly, in 2016, the Chinese Academy of Medical Science’s Institute of Laboratory Animal Sciences gave a journalist from Science an estimate of animal use in China of 20 million animals per year. 66 In 2010, a survey conducted in China found that more than 19 million animals were produced from 320 licensed production facilities and approximately 16 million were used in animal experiments, in 1530 facilities licensed for their use. 65
The United States has moved to third place, with a decrease from an adjusted 17.3 million to an adjusted 14.6 million procedures, which might reflect a genuine decrease in animal use in the United States. Japan has remained at number two, with 15 million procedures, an increase from 11.2 million in 2005. A more recent survey is available from Japan, which was conducted by the Japanese Society for Laboratory Animal Resources, on the total number of laboratory animals sold in April 2016 to March 2017. 67 However, it was only sent to 45 suppliers of laboratory animals (who declared a total of 4.2 million animals), and thus it is not a sufficient representation of total animal use in Japan.
Canada has moved from sixth to fourth place, with an increase to 3.6 million from 2.3 million in 2005 (both figures based on official reports). France has moved from 5th to 10th place; while the number of procedures by France has not changed very significantly, it has decreased from 2.3 million to 1.9 million in 2015. The estimates for Australia (3.2 million) and South Korea (3.1 million) are higher than their 2005 estimates (2.4 million and 0.5 million, respectively) and have moved them both up the rankings. The figure for South Korea in 2005 (a newcomer to the current top ten) was based on the prediction model, so actual animal use could have been underestimated, given that the first available official report for the year 2016 reported the use of 2.9 million animals (adjusted to 3.1 million).
The United Kingdom, Germany and Brazil are in similar relative positions to those in 2005. There has been an increase in the United Kingdom, from 1.9 million procedures in 2005 to 2.6 million in 2015. Technically, only the figures for Great Britain were included in 2005, but the increase in 2015 was not heavily influenced by the inclusion of Northern Ireland’s figures because these amounted to 17,510 procedures (as adjusted). Germany also appears to have increased its animal use, from 1.8 million to 2 million procedures. The estimate in 2005 for Brazil was much lower than the estimate in 2015 (from 1.2 million to 2.2 million, both based on the prediction model). Taiwan has dropped out of the top 10, to 18th place, with an estimated 0.4 million procedures. In 2005, an official report from Taiwan claimed that 1.2 million animals had been procured for testing.
Therefore, it seems that the regression model (in both 2005 and 2015) might have underpredicted animal use, particularly for Asian countries. It can be seen in Figure 1 that, of those countries with national reports, South Korea and Japan lie above the regression line, as they are reporting the use of disproportionally more animals than is evident from the number of animal study-based publications. In 2015, the actual figure for South Korea was far higher than the model predicted in 2005. In addition, for Singapore, Taiwan and Thailand, the model predicted far lower numbers in 2015 than were obtained from reports in 2005. This perhaps reflects the fact that the model is based largely on EU reports and publications, and PubMed disproportionately features western scientific journals, although articles from China are clearly on the increase. 64 Nonetheless, it does seem that the current model is more accurate than the version that we used in 2005. Other notable estimated increases in animal use, based on the current prediction model, were seen in India, Iran, Russia, Egypt, Saudi Arabia, Malaysia and Pakistan. It will be interesting to revisit the estimate again in another 10 years, to see if the model can be further improved to be even more representative.
Direct comparisons could be made for the 33 countries that produced statistical reports in both 2005 and 2015. Notable increases in animal use were seen in Germany, Canada, Australia, Spain, the United Kingdom, Switzerland, Israel and Austria. Notable decreases were seen in the United States, France, Italy, Sweden, Belgium, Denmark, Poland, Czech Republic, Finland, Hungary, Greece, Slovakia, Slovenia, Croatia and Lithuania.
Therefore, the picture of animal use seems quite mixed. Overall, there has been some increase in reported use, caused by a number of increases in some significant animal-using countries, but this has been tempered by some reduction in other countries. The current model also appears to be more accurate and thus has led to an overall increase in estimated animal use as a result — but it might still be generating underestimates, particularly for Asian countries.
The use of dogs and monkeys
For the first time, we have been able to estimate the total number of procedures involving monkeys and dogs worldwide. We have estimated that 207,724 procedures involving dogs and 158,780 procedures involving monkeys were conducted in 2015. In our opinion, this is a staggering amount and one that deserves urgent attention. Reflecting the users of these animals overall, the top ten users of dogs were: China; the United States; Canada; South Korea; Japan; Australia; Brazil; the United Kingdom; Germany and India (seven of which data points are based on official reports). The top ten users of monkeys were: the United States; China; Japan; Brazil; Canada; the United Kingdom; France; Germany; India and South Korea (seven of which data points are based on official reports).
Extrapolation to cover non-procedural uses of animals
It has been argued that all animals bred or obtained for scientific research and testing should be reported, whether or not they are actually used, on the grounds that such animals can still experience suffering and distress, 68 as a result of being housed and handled under laboratory conditions. 69 These animals will also be killed, which can cause additional distress as a result of the methods that are often used. 70 Therefore, in 2005, we sought to capture a broader description of animal use and were able to include estimates for those animals that had not actually been used in procedures but had nonetheless been bred for laboratory use, that is, those killed for the provision of tissues or that were surplus to requirements, and those used to maintain GM strains. It appears that these three categories remained the only ones for which we could find some statistical data for 2015. The Netherlands, Germany and Sweden reported the number of animals killed for the purpose of supplying tissues for ex vivo or in vitro use, thus providing a weighted average figure of an additional 32.1%. This represents an increase on the figure of 21.1% obtained in 2005, which was based on reports from the six countries that reported this use (France, Norway, Switzerland, the Netherlands, Germany and Sweden). Of those three countries for which there were reports in both years, Sweden appears to have used proportionately fewer animals for this purpose (down from 50.1% to 25.8%). The United Kingdom reported the use of non-GM or GM animals without a harmful mutation that are used to maintain established GM colonies, giving a weighted average figure of an additional 61.0%, an increase from the 17.2% figure obtained in 2005 by using data from Great Britain and the Netherlands. The United States, the United Kingdom and the Netherlands reported the numbers of non-GM animals bred and not used, giving a weighted average figure of an additional 47.4% (less than the 59.3% estimated from the United Kingdom and Norway data in 2005).
It is disappointing that there has been no improvement in the extent of reporting of these non-procedural uses of animals since 2005. Indeed, there is evidence that the change in harmonised reporting requirements in the EU has encouraged some countries to cease this additional reporting. There was no specific reporting of the number of animals killed for their tissues in France, Switzerland or Norway, and no report of the number of surplus animals in Norway, in 2015. However, with the new requirement to report the number of surplus animals (including animals killed for tissues) under the EU Implementing Decision every five years, we should see a much more comprehensive figure by the end of 2019 for all EU countries.
Furthermore, no additional categories of non-procedural animal use were obtainable in 2015. However, in 2015, the use of GM animals with a harmful mutation used for breeding was covered in the definition of a procedure and thus reported de facto by more countries.
Therefore, for 2015, we have estimated that additional 140.5% of animals might have been bred and ultimately killed for scientific purposes. This produces a revised estimate of the total number of animals used for scientific purposes (procedural and non-procedural) of 192.1 million per year worldwide.
One category of animal use that is not captured by the extrapolation is those animals that are currently being held in a laboratory and have not yet been used or killed, including those that are not intended to be used in a procedure but are being held for other purposes (such as breeding). The United States tries to include this in their reporting (see The limitations of the estimate); other surveys, such as those from China 65 and Japan, 67 have also attempted to include these animals in the data. Thus, our final estimate is not actually a complete snapshot of all of the animals held in laboratories worldwide, in any one year.
Furthermore, some countries report animals and procedures that are outside the definitions used in the EU. For example, Switzerland counted 372 ‘invertebrates’. 31 Sweden and Australia report procedures below the threshold of severity used in the EU (16.1 million and 6.7 million additional animals, respectively), greatly exaggerating their documented total numbers. In Sweden, this appears to be mostly fish tagging and test fishing. 33 It is possible that similar uses of fish explain the disproportionately high animal use (compared to publication rate) by Norway (1.3 million animals, mostly fish). 40 It should be noted that the EU definition of a procedure — wrongly in our opinion — does not include invasive marking procedures like inserting a microchip, metal tag, clipping parts of the body or tattooing. 71 However, most of these animals should be included in the five-year reports required in the EU. 14 Australia counts animals marked invasively 26 and also counts ‘observational studies involving minor interference’ which include observational studies of wildlife in their natural habitat, feeding trials, behavioural studies with minor environmental manipulation or teaching of normal, non-invasive husbandry (such as handling or grooming). 22,23 The inclusion of feeding trials is also an explanation for some of the post hoc below threshold procedures reported in the United Kingdom. 62
Some may argue that these animals should be included in the estimate — for example, any animal that is being held in a laboratory or in similarly confined environment is at risk of suffering and distress, even if the experiment itself is not expected to be harmful. Some behavioural studies that are considered below threshold may nonetheless cause some distress, especially those such as the open field test 72 that are designed to assess anxiety. Thus, it is arguable that the threshold for a procedure should be lowered so that all animals are protected and counted. However, we do find it hard to justify the public interest in reporting those experiments that are conducted non-invasively in the wild.
The limitations of the estimate
With the exception of the United States, cephalopods and categories of GM animals, there is surprising consistency in the species and purposes for which animals used in harmful scientific procedures are counted among all the reporting countries. However, there is now inconsistency between EU and non-EU countries in the reporting of animals or procedures, as the new EU Implementing Decision requires procedures rather than animals to be counted. However, since most animals are used only once in a procedure and then killed, and most experiments last less than one year, this is unlikely to significantly change the overall number. 62 In the United Kingdom, which between 1987 and 2013 reported both animals and procedures, the two total figures only differed by about 2%. However, it does make the assessment of any final estimate difficult, especially since some countries that are meant to be reporting ‘procedures’ often describe the numbers in terms of ‘animals’.
The official figures for two of the heaviest animal-using countries — the United States and Japan — are not complete and had to be adjusted, introducing some uncertainty to the final estimates. The United States excludes rodents, birds, reptiles, amphibians, fish and cephalopods, while the figures for Japan are based on a 2009 survey conducted by an academic committee. Furthermore, we were unable to account for fetal and embryonic forms of EU-included animals in non-EU reports by extrapolation, as their proportions are not clearly specified in the EU reports. Our total figure was based on estimates of animal numbers for 142 of the 179 world countries with significant human populations, rather than on collected statistics. However, this amounts to only about 34% of our total (26.8 million out of a total of 79.9 million animals).
The prediction model used was a regression model based on the number of publications involving animals listed in PubMed, as a proxy for total animal use in that country the previous year. It must be appreciated that this is only a model and publication rate is not a direct measure of animal use, although the correlation was very strong (r 2 = 0.92). There will be a proportion of animal use that will not be reflected in publication rate — for example, toxicology testing, as this type of work is rarely reported in scientific research papers. Furthermore, it is well known that there is ‘publication bias’ in the scientific literature, as a whole, in which it is less likely that experiments that ‘fail’ or that generate ‘negative’ results will be published. This is because journals prefer to publish key breakthroughs, that is, ‘positive’ findings. A large proportion of research that is conducted will, naturally, produce negative results and will, therefore, not be published and this includes animal research. 73 As the current model has not been internally validated, we do not know whether its prediction will hold true, particularly for non-EU countries whose proportion of reported and non-reported animal use may be different to the (mostly EU) countries that were used to create the model. We strongly suspect that the model may be under-predictive, particularly for Asian countries whose research outputs may not yet fully feature in Western bibliometric databases such as PubMed. These countries might also conduct proportionally more non-reported animal use, such as for GM breeding and for educational and training purposes.
The extrapolations to include non-procedural uses of animals must also be treated with some caution, as they are based on only a few countries that report these types of animal use — and, even then, there is wide variation in the proportions reported between the countries. There is also some overlap in the categories, for example, the ‘bred but not used’ figure from the United Kingdom (48.7%) includes animals killed for their tissues, whereas the ‘bred but not used’ figure from the United States includes animals that have not yet been used. Thus, it is possible that a proportion of these animals would go on to be used in procedures the following year. However, the proportion of these animals in the United States (17.8%) is likely to be an underestimate, since the United States does not count rodents and fish, which make up the majority of the animals used in experiments and of those species that are disproportionally likely to be bred and rendered surplus to requirements.
According to the EU Implementing Decision: “if the welfare assessment concludes that the line is not expected to have a harmful phenotype, its breeding falls outside the scope of a procedure and no longer needs to be reported”. 15 So, while there has been some improvement in the reporting requirements since our previous estimate — where no animals used to breed GM colonies were counted in the EU statistics — a large proportion of animal use to breed GM animals remains unreported. Only one country — the United Kingdom — also counts the use of normal and GM animals without a harmful mutation in the creation and breeding of established GM strains, although they are not obligated to.
Finally, the estimate does not include animals being held inside facilities, including those that have been marked invasively for identification purposes, whose fate is not yet known. For example: those that have not yet started a procedure; those that have, but where the experiment has not ended that year (under the EU definition they will get counted when the procedure ends); and those that are used for breeding and are still alive. This could represent quite a significant figure.
Level of reporting
Over a 10-year period, there has been no change in the number of countries that produce publicly available statistics on animal use. Reports from 37 countries were collected in both 2005 and 2015. We have lost the availability of information on the use of animals from four countries (Singapore, Taiwan, Thailand and Montenegro) but gained information from four other countries (South Korea, Bulgaria, Croatia and Romania; the latter three having since joined the EU).
Eight of the top ten laboratory animal-using countries produced statistics in 2015, which is the same proportion as in our previous estimate. Of the 55 countries with evidence of considerable animal use (i.e. more than 200 animal publications in 2016), annual statistics could not be found for 25 of them (45%). Thus, while the use of animals in scientific procedures appears to have increased over the last 10 years, the standard of reporting has unfortunately not improved. This is of concern for at least three reasons.
Firstly, reliable figures are necessary to enhance transparency and to enable an informed debate about animal experiments involving the public as well as politicians, scientists and regulators. It is important that the statistics should be as extensive as possible to facilitate this process, including variables such as the use of different species and the purposes and severities of the procedures applied to them. In addition, knowledge of relative numbers and trends in different user countries will inform discussion on various issues — such as whether strong regulation in one country results in researchers shifting experimentation to countries with weaker regulation — and will help facilitate discussions about the challenges and benefits of global harmonisation.
Secondly, without regular and accurate statistics, including information on trends in animal use, many of the efforts to reduce and replace animal use cannot be effectively assessed. Trends in key categories of procedures on different species also need to be visible, so that the effects of regulation, or the outcome of policy changes, can be monitored. Specifically, they can also indicate areas where Three Rs efforts are being effective and where they need to be focused.
Thirdly, it could be assumed that there is a strong correlation between the strength of reporting requirements and the degree of regulation of animal experiments. Those countries with no reporting requirements may also be those without specific legislation protecting animals used for scientific purposes. This is undoubtedly a cause for concern.
If animals continue to be used for scientific purposes, it should be expected that, as a minimum, their use is regulated by law to protect their welfare as much as possible. Furthermore, for the reasons given above, it is also important that all user countries produce annual statistics that record the types of species and numbers used for various purposes, including the number of all animals that are: used for the breeding of GM animals; killed for tissue supply; produced but are surplus to requirements; and being held inside facilities but not (yet) used or killed. As a first important step, countries such as the United States and Japan, which conduct a significant number of animal experiments, should make it a priority to improve the completeness of their reports in line with other user countries. In addition, countries with experience of regulating and recording animal use should encourage and assist those that currently do neither.
Conclusion
Ten years after our previous estimate of the worldwide use of laboratory animals, we have produced a more up-to-date range of estimates that we consider to be more accurate and comprehensive than those previously obtained.
Our current estimates suggest that there has been a significant increase in the worldwide use of laboratory animals over a period of 10 years, from 58.3 to 79.9 procedures and from 115.2 animals used for procedural and non-procedural purposes to 192.1 million. Some of the increase can be explained by greater confidence in the prediction model with respect to the estimates for non-reporting Asian countries, but there has also been an increase in animal use in reporting countries. The fact that the overall figure is approaching 200 million animals per year should be a cause for concern, particularly with respect to the impact of the development of alternative methods. For the first time, we have also been able to estimate the numbers of dogs (207,724) and monkeys (158,780) used worldwide — both truly staggering, unsustainable figures that deserve urgent attention.
While there is great consistency, with the exception of the United States, in which species and purposes are recorded, there has been no improvement in the number of countries (only 37) producing statistical reports on the numbers of animals they use. Furthermore, there has been no improvement in the number of countries reporting the extent of animals killed for their tissues, non-GM and GM animals with a non-harmful defect that are bred to produce GM strains, and animals bred but not used (i.e. surplus or not yet used). If we are to understand the scale of animal use, and be able to measure our progress in bringing the number of experiments on animals down, then we need accurate statistics.
Footnotes
Acknowledgements
We would like to thank Cruelty Free International Trust for funding the authors during this project. We would also like to thank those individuals and organisations who assisted us by providing contact details and/or official statistics for their countries. These were: Helen Marston (Humane Research Australia); Anton Krag (Norwegian Animal Protection Alliance); David Neale (Animals Asia); Tuan Bendixsen (Animals Asia); Nick Marx (Wildlife Alliance); Paul Littlefair (the Royal Society for the Prevention of Cruelty to Animals); Japan Anti-Vivisection Association; Frank Alarcon; Amina Abaza (Spare Lives); Smaragda Louw (Ban Animal Trading); Jehan Zaib (Voice of Animals Foundation); Milica Rankov (Udruženje Feniks); Dr. Angela Maldonado (Fundacion Entropika); Douglas Hendrie (Education for Nature Vietnam); Jakarta Animal Aid; Yana Spasova (Four Paws Bulgaria); Manoj Gautam; Sarah Brook (Wildlife Conservation Society Cambodia); Yana Renk (For Life Animal Protection Society); Faheem Jehan Zaib (Voice of Animals Foundation) and Rabi Sharma (Jane Goodall Institute Nepal).
Declaration of conflicting interests
The author(s) declared no potential conflicts of interest with respect to the research, authorship, and/or publication of this article.
Funding
The author(s) received no financial support for the research, authorship, and/or publication of this article.