
Abstract
Despite the growing attention to the impact of culture on socio-economic indicators, there is a lack of causality evidence. Scholars have noted that cultural values or norms, as well as, a vibrant cultural environment can have a positive impact on GDP growth, labour productivity, the attraction of human capital and the improvement of human well-being. However, the issue of endogeneity is not thoroughly debated. Not only can culture impact economic development, but socio-economic environment also affects the cultural indicators. Therefore, it is essential to identify the causal effects of culture. This article aims to assess whether culture has a causal impact on socio-economic variables. The Granger procedure is utilised to evaluate causal relationships, describing the cultural environment with a comprehensive set of 45 cultural indicators across 30 European countries. This enables the comparison of the relationship between culture and socio-economic variables using the same method across different countries. Additionally, cultural indices are constructed. The research is extended by employing a panel vector autoregression (VAR) model. The key finding of this article demonstrates a causal impact of culture on socio-economic indicators, confirmed by both the Granger procedure and panel VAR estimations.
Keywords
Introduction
The notion of culture is expansive and challenging to define or confine. Additionally, there exists a scarcity of quantitative, longitudinal data on cultural variables. Consequently, scholars have often regarded culture as a subject more fitting for philosophers or anthropologists rather than economists. Until recently, economists have generally been hesitant to consider culture as a potential determinant of economic phenomena (Guiso et al., 2006).
On the other hand, there is a growing interest in the role of culture in analysing the outcomes of social and economic phenomena. Scholars provide evidence suggesting that economic development can be influenced by cultural capital (Tabellini, 2010; Tubadji, 2014). Furthermore, cultural variables can offer explanations for why certain countries or regions face challenges in achieving rapid economic growth or remain less developed (Ferragina, 2009), as certain cultural norms can propagate within a population regardless of their economic efficiency (Guiso et al., 2006). Additionally, culture can impact not only the outcomes of the economy (e.g., GDP growth or labour productivity), but also human and social capital, or individual well-being (Anheier et al., 2017; Laužikas et al., 2020). By incorporating cultural indicators, we can enhance our comprehension of contemporary socio-economic development and build a more precise model of interactions within our society.
When confronted with the subject of culture and its influence on social and economic outcomes, we have to determine how to quantitatively define culture and address the issue of endogeneity. In other words, we need to determine if culture can have a causal impact on socio-economic development. It’s apparent that cultural achievements are contingent on economic outcomes; individuals are more inclined to participate in cultural events when they enjoy higher incomes (Ambrazevičienė & Matulaitienė, 2021). A society displays more trust in others (possesses greater cultural capital) when the government strategically invests in social capital (Guiso et al., 2006). These queries and assumptions motivate the quest to substantiate the causal influence of culture on socio-economic variables.
The goal of this article is to evaluate whether cultural variables have a causal effect on socio-economic variables and to examine how this varies across European countries.
After conducting a comprehensive literature analysis, this article presents the main definitions and potential variables of culture. Most scholars utilise the notion of cultural capital (Guiso et al., 2006; Tubadji, 2014; Zak & Knack, 2001). Through this concept, they introduce a model of culture-based economic development.
To broaden the theoretical analysis and provide a response to the primary question of this article, Granger causality tests are employed. Granger’s procedure assists in determining whether there exists a causal impact of culture on socio-economic variables. The analysis also enables comparisons among selected European countries. Additionally, a panel vector autoregression (VAR) model is constructed to validate the results of the Granger procedure and assess whether the impact of culture on economics persists. To capture a broad representation of the cultural environment, cultural indices are constructed using principal component analysis (PCA).
The subsequent section of this article provides a literature review. It offers the definition of culture and also encompasses an analysis of scholars’ discoveries in their attempts to assess the relationship between culture and socio-economic outcomes. The following section introduces the data and methodology. Subsequently, the results are examined and discussed. The evidence demonstrating the potential causal impact of cultural indicators on socio-economic variables is presented. Variations among European countries are also explored. The final section concludes the article.
Literature Review
The literature review aims to identify suitable methodological strategies for measuring the impact of culture on socio-economic domains and indicators representing culture. After analysing the studies, three primary strategies for assessing the impact of culture emerge: examining culture’s influence on economic growth (using culture-augmented economic growth models), exploring the effects of cultural and creative industries (CCIs), and investigating culture’s impact on individual well-being. Each strategy entails a distinct selection of cultural variables (see Table 1).
Assessing the Impact of Culture: Insights from Literature Review.
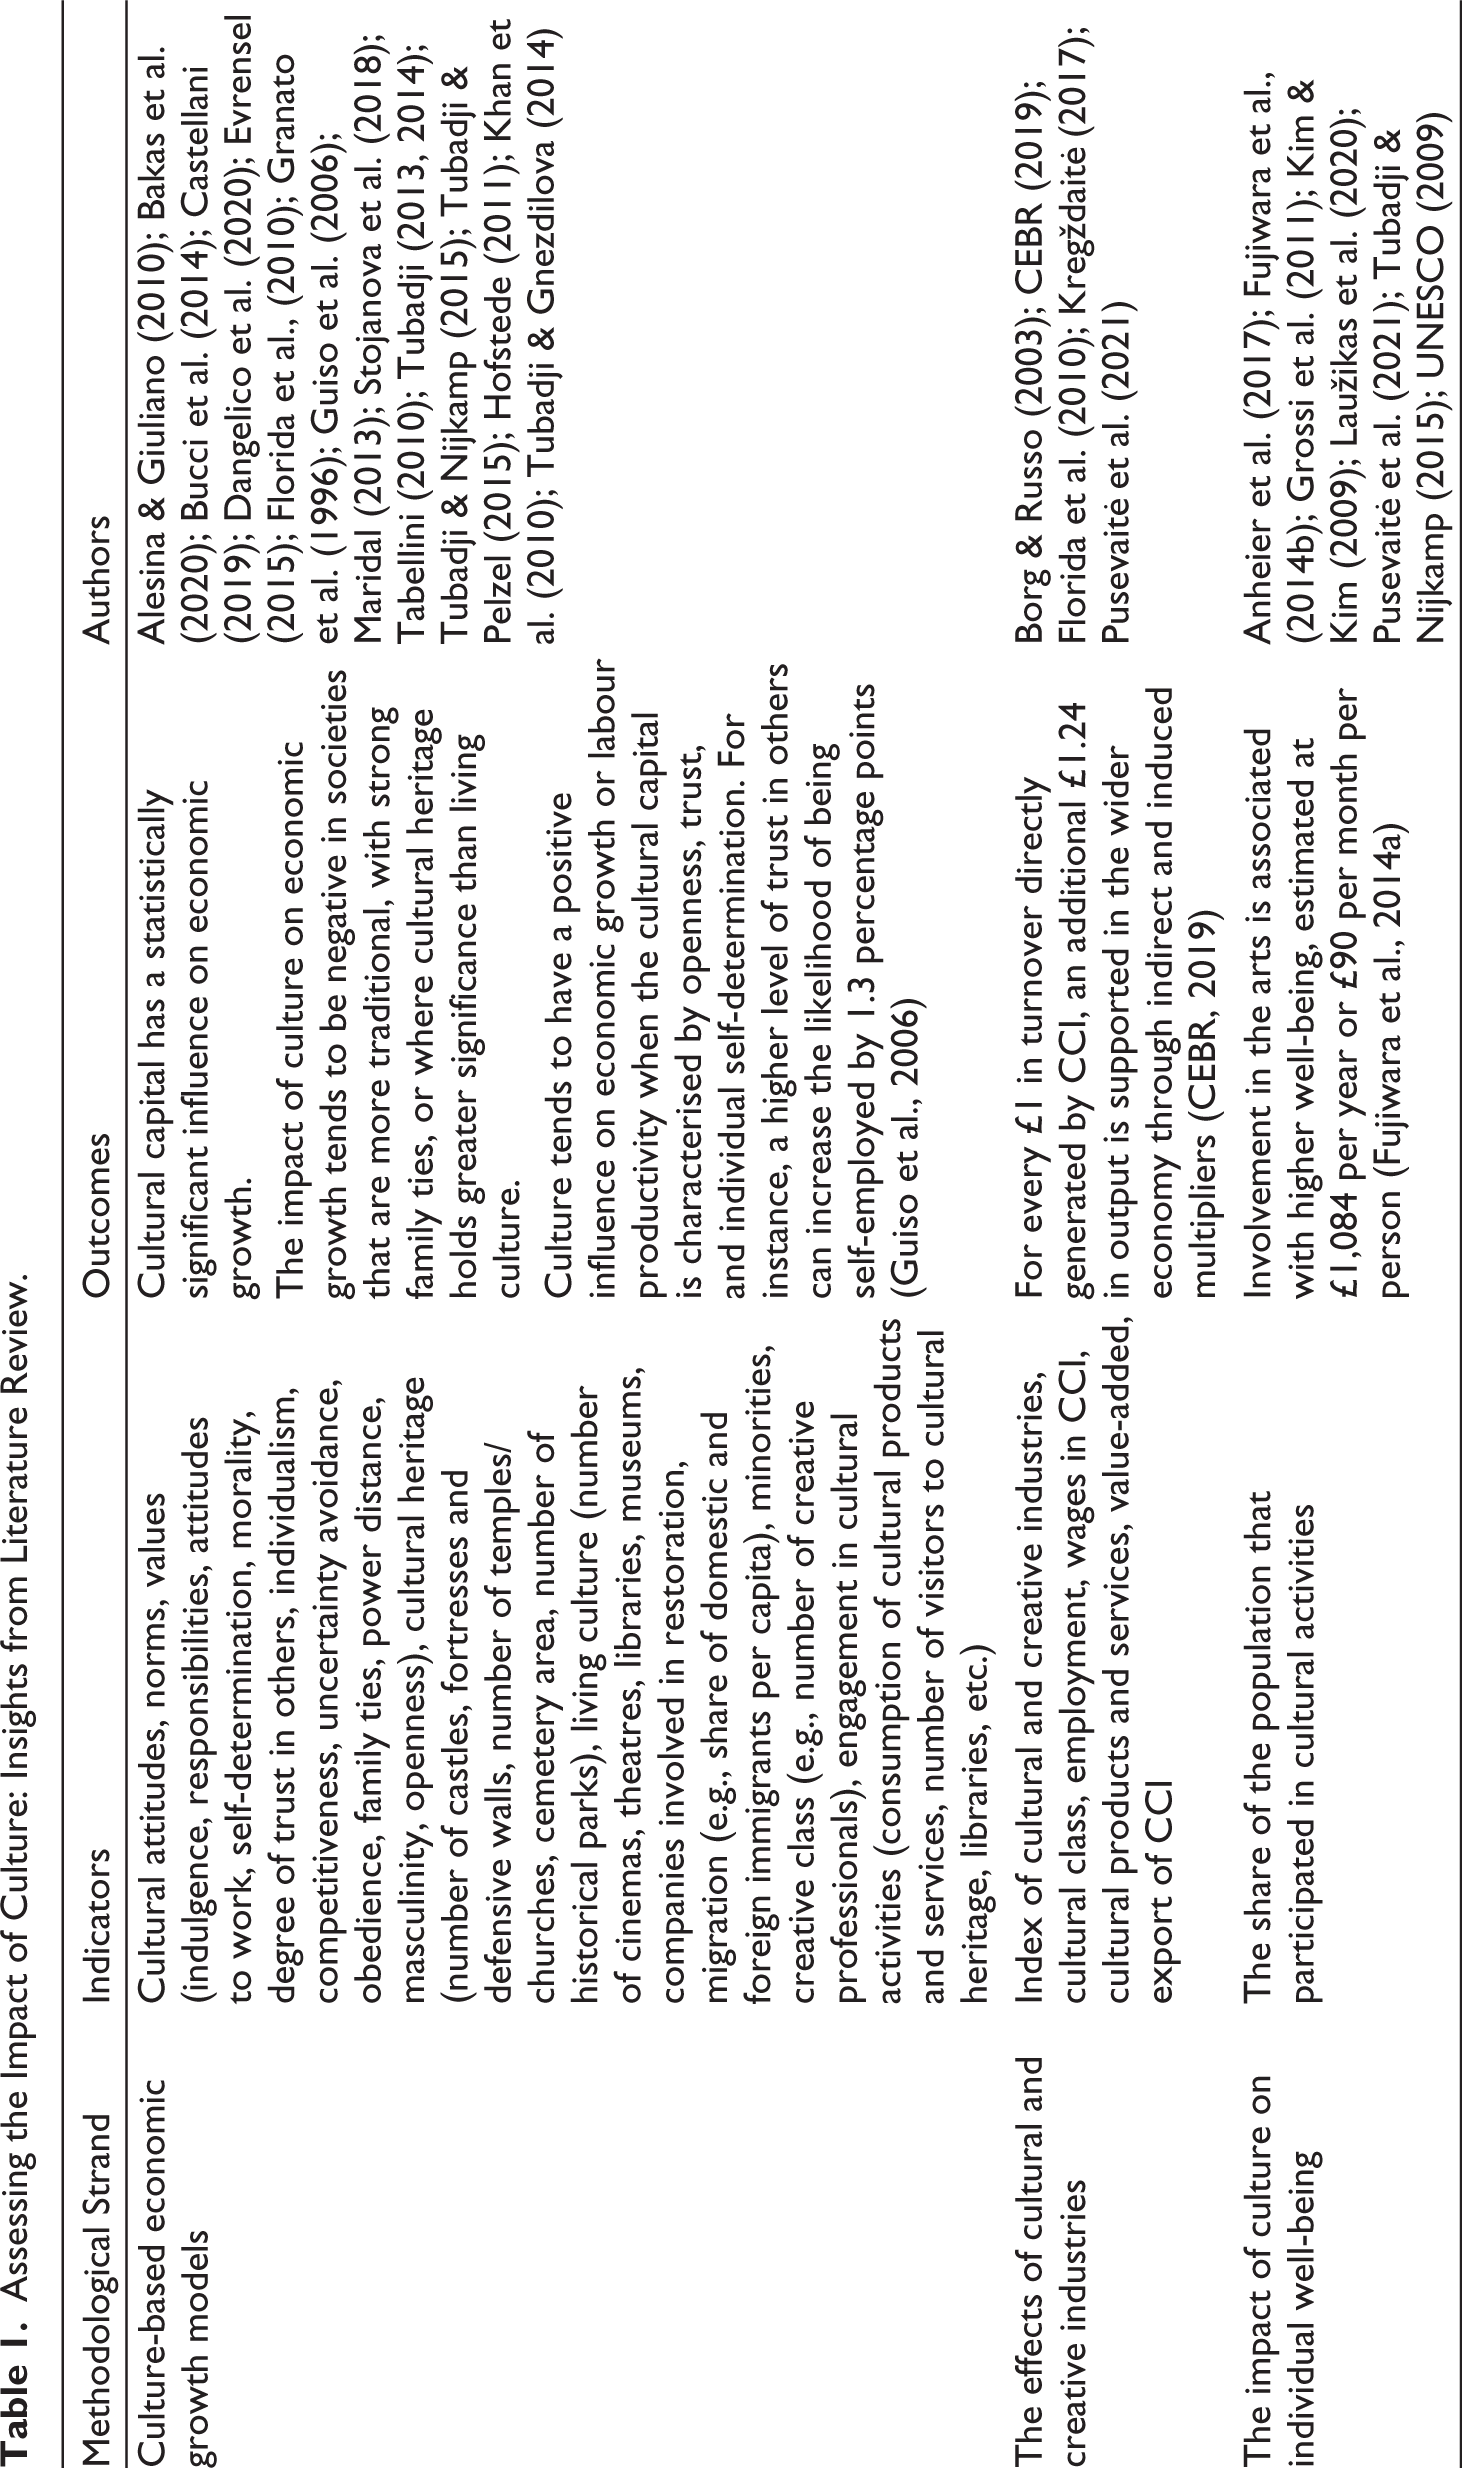
Culture-Based Economic Development
Scholars argue that socio-economic development involves more parameters than classical growth models propose. In addition to capital, labour, human capital, and technology, a cultural component should be included (Bucci et al., 2014). For example, Tubadji builds upon Max Weber’s analysis of the link between religion and economics, proposing to replace the variable of religion, seen as a representation of culture, with a more comprehensive set of cultural variables representing the contemporary cultural environment (Tubadji, 2014).
In these analyses, authors typically include cultural variables related to attitudes or values (e.g., indulgence, individualism, openness), cultural heritage (e.g., the number of churches or castles), and living culture (e.g., cultural diversity in society and contemporary cultural infrastructure). Scholars aim to amalgamate diverse indicators into a culture approximation through indices or latent variables, usually described as cultural capital. Cultural capital encompasses both tangible elements (outcomes of a person’s cultural activity, such as works of art, architecture, and cultural heritage) and intangible elements (norms, beliefs, and values passed down and learned from one generation to another) (Evrensel, 2015).
Authors also note that cultural capital exerts an indirect influence on economic development, with human capital serving as the intermediary through which culture affects the economy (Tubadji, 2014; Tubadji & Nijkamp, 2015). The cultural capital is considered one of the factors that enable countries to attract or retain highly skilled human capital. Additionally, scholars recognise culture’s impact on not only economic outcomes (such as labour productivity or GDP growth) but also the overall quality of life, decreasing crime rates and strengthening social capital (Laužikas et al., 2020; Tubadji & Nijkamp, 2015).
The Impact of CCIs
Another perspective on culture is presented through the concept of CCIs. Typically, authors aim to establish a consensus regarding the range of economic activities that can be classified as CCIs. Once these economic activities are identified, it becomes feasible to quantify value-added, employment, wages, and other economic outcomes (see Table 1). Additionally, scholars typically calculate both the direct and indirect effects of CCIs on the economy, with indirect impacts assessed using multipliers (CEBR, 2019; Pusevaitė et al., 2021). However, accurately measuring the actual impact of CCIs spill-overs remains a challenge (CEBR, 2019; Pusevaitė et al., 2021). Results are difficult to compare between countries because of differences in agreement on what counts as a CCI activity and what does not. Moreover, when assessing the indirect impact of CCIs, the assumptions used to decide on the size of the multipliers vary depending on the significance of the CCI sector in each country.
The Impact of Culture on Individual Well-Being
Another approach to analysing culture involves assessing the impact of cultural consumption or participation in culture on individual well-being. Authors typically rely on survey data concerning participation in cultural activities, along with the frequency and level of engagement (Anheier et al., 2017; Fujiwara et al., 2014a; Kim & Kim, 2009; Laužikas et al., 2020).
However, in evaluating the impact of culture on socio-economic development or individual well-being, the predominant approach taken by scholars involves constructing a linear regression model (typically ordinary least squares – OLS) or implementing correlation analysis (Alesina & Giuliano, 2010; Anheier et al., 2017; Bakas et al., 2020; Tubadji, 2014). In such cases, the issue of endogeneity remains unresolved. It is possible that not only does culture impact socio-economic development, but the reverse may also hold true. The question of endogeneity arises not only from the limitations of econometric models but also intuitively: even cultural capital variables such as trust or openness can be influenced by a well-developed economic environment. The issue prompts the exploration of additional methods to address whether culture causally influences socio-economic indicators.
Moreover, data concerning cultural attitudes or values are typically derived from surveys, such as The World Values Survey or Eurobarometer. However, survey data can be subject to limitations that result in measurement inaccuracies. These limitations encompass translation challenges, respondents’ environmental and situational influences on their answers, and the inclination of respondents to provide socially desirable responses (Castellani, 2019), particularly with regard to values. It is also worth noting that analyses based on survey data can capture correlation but not necessarily causality.
These circumstances drive the exploration for supplementary quantitative indicators that can effectively characterise the cultural environment and help to evaluate causal interactions. Finally, researchers often concentrate on individual country cases. It allows to involve more specific, detailed cultural variables, but restricts comparisons between countries. There is a scarcity of studies that encompass a broader range of countries, such as cross-country comparisons involving European nations.
Methodology
The research unfolds in several stages. Initially, a country-level analysis is conducted using the Granger procedure. This procedure focuses on evaluating causal relationships between variable pairs. The second stage involves the application of a panel VAR model, aiming to assess the potential statistically significant impact of culture on economics. Within this stage, a set of cultural indicators is approximated using PCA, creating a representative model of culture. Furthermore, for robustness checks, alternative models are formulated, introducing an exogenous variable of culture (cultural attitudes).
First of all, it is necessary to restrict the definition of culture. Given that different scholars have proposed from one to five hundred distinct definitions of culture (Castellani, 2019; Kroeber & Kluckhohn, 1952; Taras et al., 2012), the manner in which culture is approximated can yield divergent analytical outcomes. The objective of this study is to utilise a comprehensive quantitative dataset comprising cultural variables across European countries.
The evaluation of the available data on culture at the country level in Europe (drawn from the Eurostat database) resulted in the selection of 45 variables that could be categorised into five thematic groups: creators/artists, cultural enterprises, employment in the cultural sector, public expenditure on culture, and household expenditure on culture (a detailed list of cultural variables is provided in Table 2). This dataset facilitates comparisons among 30 European countries, underscores cultural capital (highlighting living culture, but also indicating a greater number of cultural enterprises or artists that can underscore long-standing cultural traditions and a supportive cultural environment in a specific country), and circumvents the measurement inaccuracies inherent in survey-based approaches.
Number of Countries with Granger Causality Between a Cultural Variable and an Economic or Social Variable (Regardless of Lag).
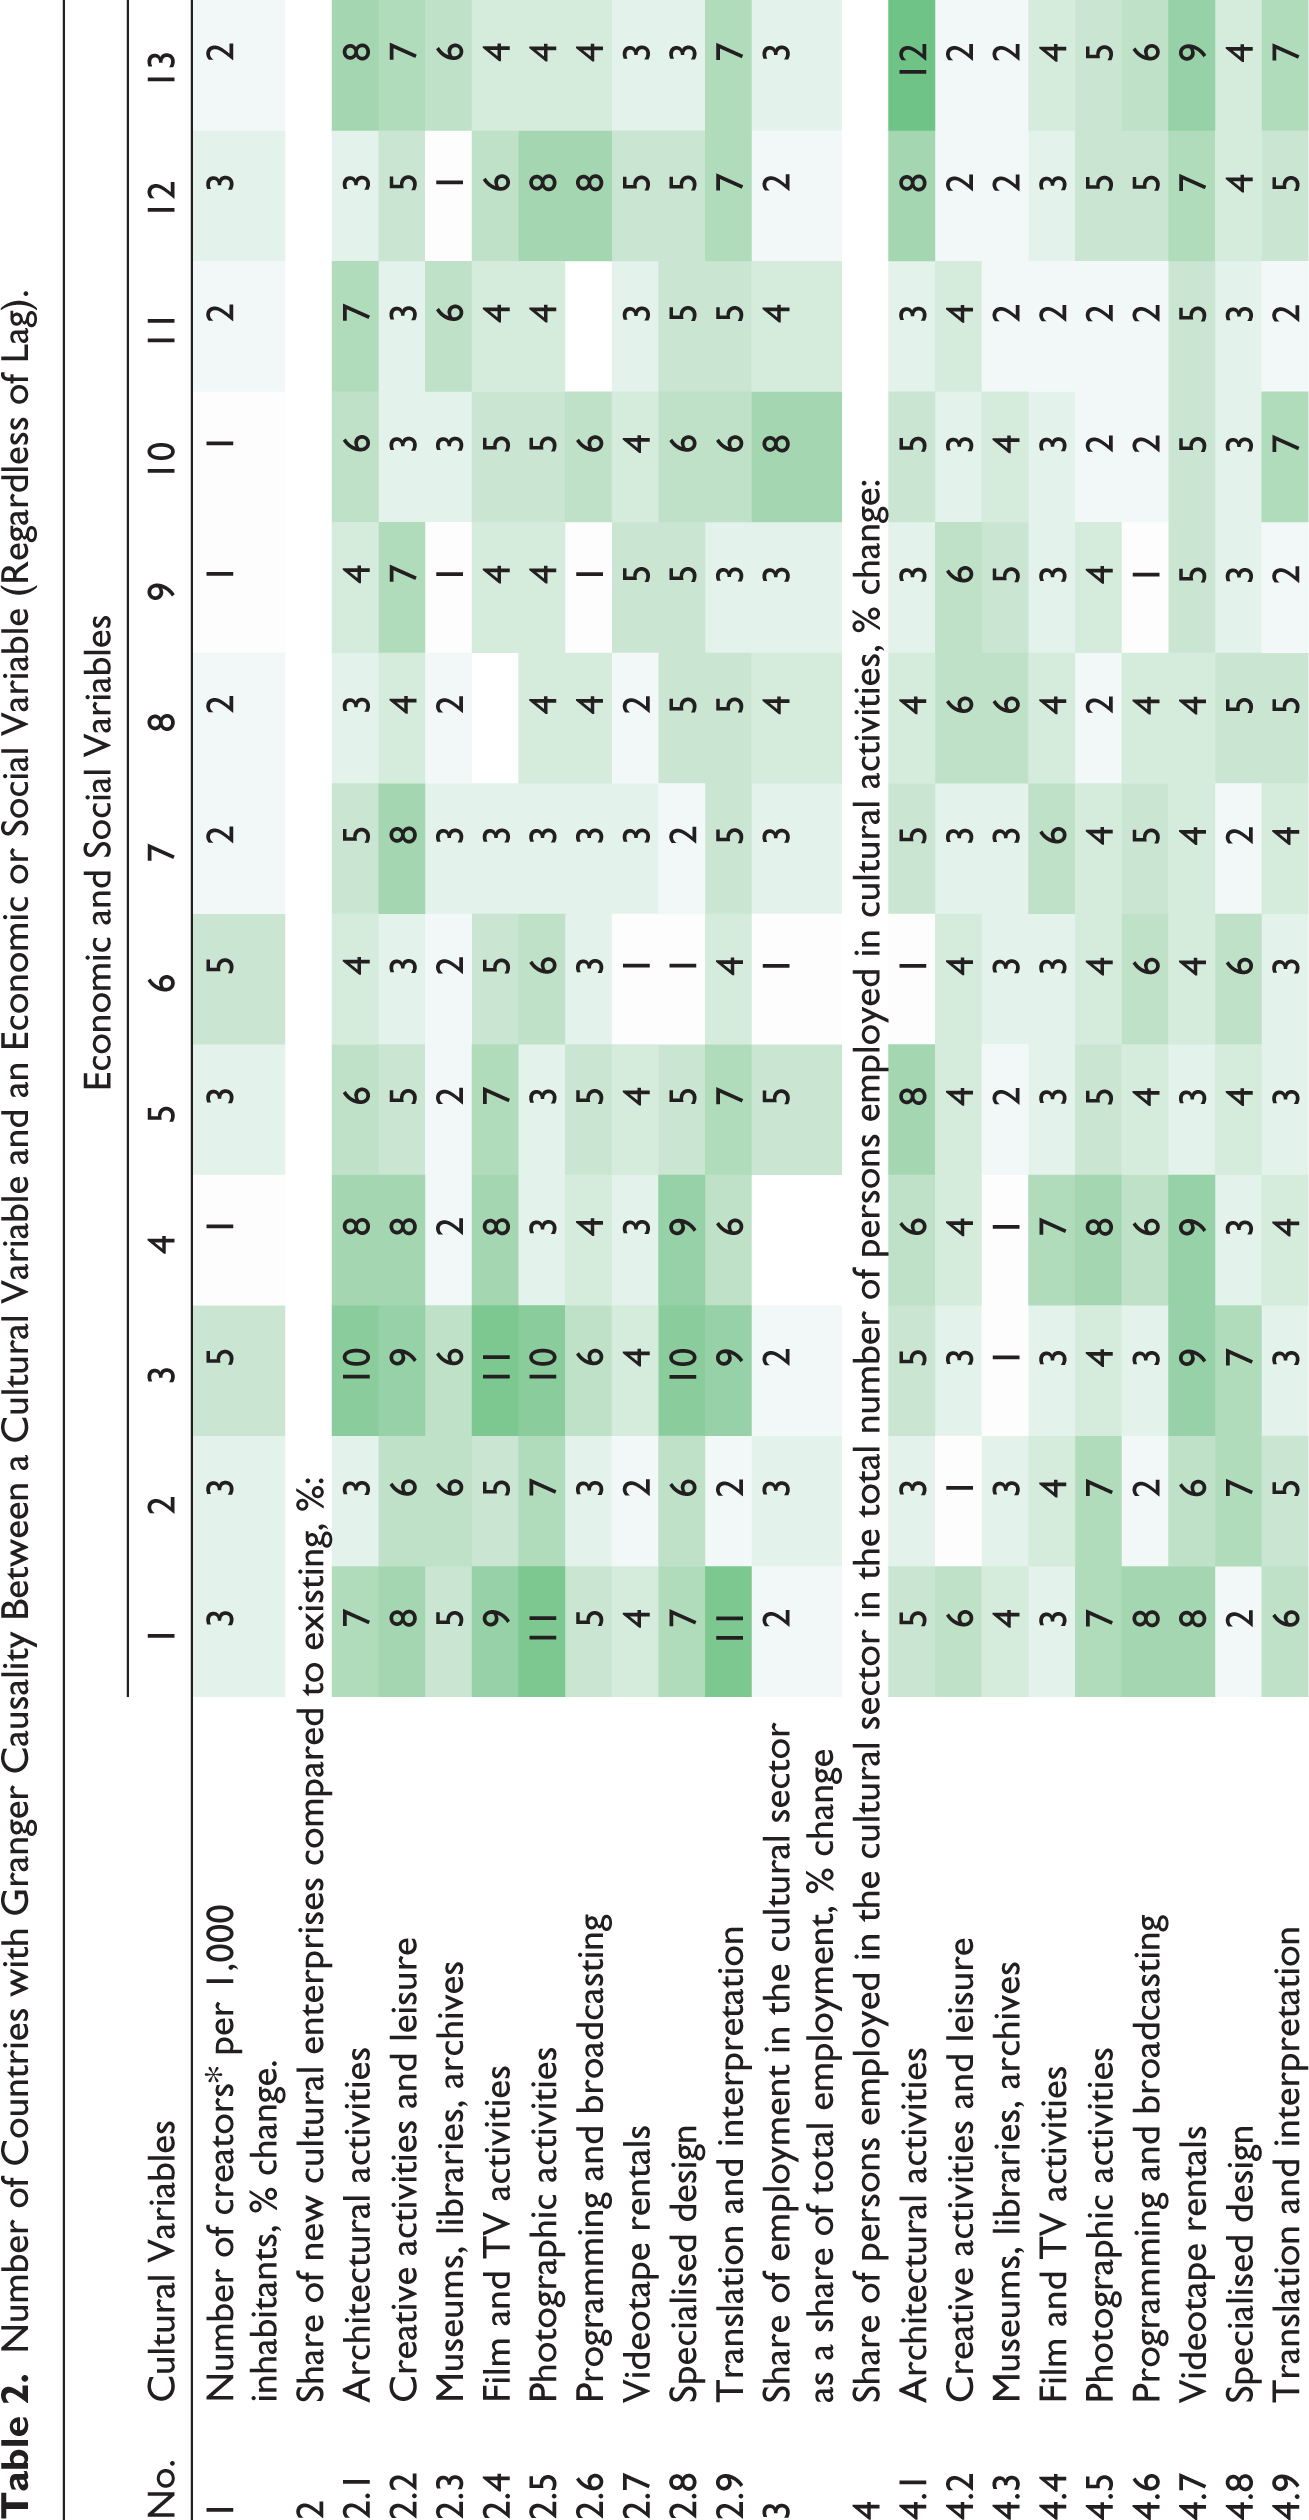
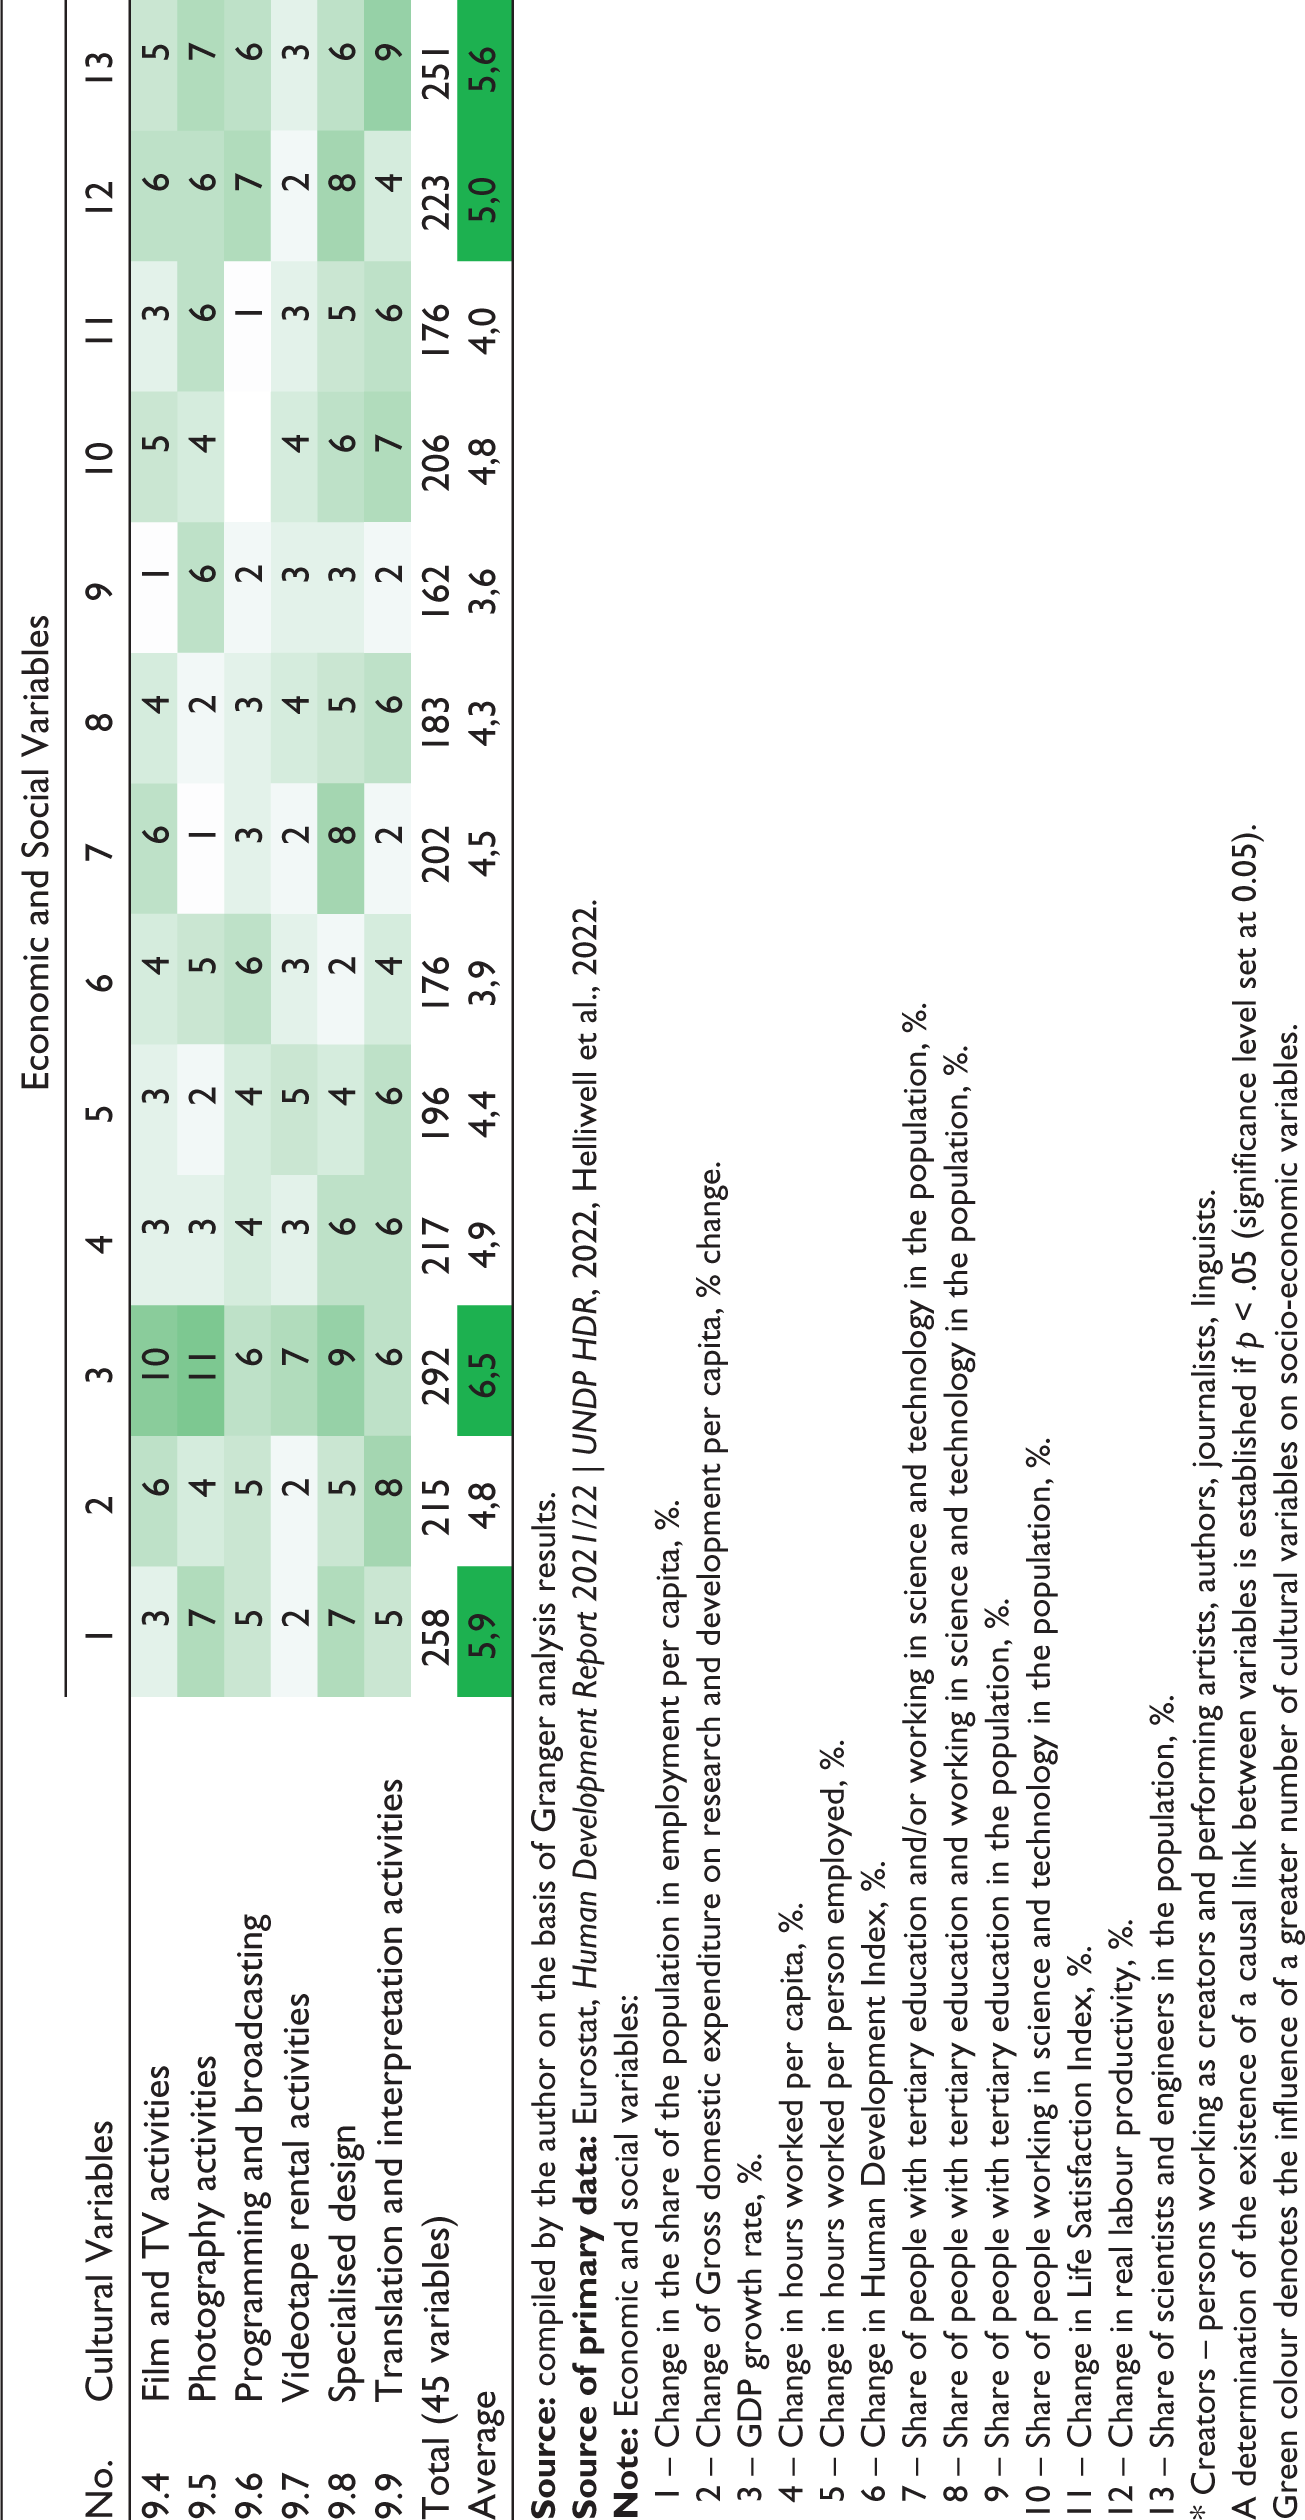
1 – Change in the share of the population in employment per capita, %. 2 – Change of Gross domestic expenditure on research and development per capita, % change. 3 – GDP growth rate, %. 4 – Change in hours worked per capita, %. 5 – Change in hours worked per person employed, %. 6 – Change in Human Development Index, %. 7 – Share of people with tertiary education and/or working in science and technology in the population, %. 8 – Share of people with tertiary education and working in science and technology in the population, %. 9 – Share of people with tertiary education in the population, %. 10 – Share of people working in science and technology in the population, %. 11 – Change in Life Satisfaction Index, %. 12 – Change in real labour productivity, %. 13 – Share of scientists and engineers in the population, %.
* Creators – persons working as creators and performing artists, authors, journalists, linguists.
A determination of the existence of a causal link between variables is established if p < .05 (significance level set at 0.05).
Green colour denotes the influence of a greater number of cultural variables on socio-economic variables.
The selection of socio-economic variables (a total of 13 variables) was based on an extensive literature review (Alesina & Giuliano, 2010; Anheier et al., 2017; Bakas et al., 2020; Evrensel, 2015; Fujiwara et al., 2014; Laužikas & Dailydaitė, 2015; Tubadji, 2012, 2013, 2020; Tubadji & Gnezdilova, 2014; Tubadji & Nijkamp, 2015; Tubadji & Pelzel, 2015). Researchers investigate the impact of cultural variables on various aspects of the economy, such as GDP (the variable included in further analysis is the GDP growth rate), employment (the variable included is the percentage change in the share of the population employed per capita), labour productivity (the variables included are the percentage change in hours worked per capita, the percentage change in hours worked per person employed, and the percentage change in the real productivity of labour per person), human capital (measured through the percentage share of people with tertiary education and/or working in science and technology in the population, the percentage share of persons with tertiary education and working in science and technology in the population, the percentage share of persons with tertiary education in the population, the percentage share of persons employed in science and technology in the population, the percentage share of scientists and engineers in the population, and the percentage change of gross domestic expenditure on research and development per capita), as well as on human well-being defined in a broader sense (measured through the percentage change in the Human Development Index (Human Development Report 2021/22 | UNDP HDR, 2022), and the percentage change in the Life Satisfaction Index (Helliwell et al., 2022).
The Granger procedure is employed to evaluate whether there exists a causal relationship between cultural variables and socio-economic variables and how this relationship varies across European countries. In other words, the Granger causality of cultural variables is assessed. The Granger procedure is executed for all selected pairs of cultural and economic-social variables for each of the 30 European countries (a complete list of countries can be found in Table 3). The procedure is also repeated using different lags for the cultural variables, encompassing up to eight lags for individual variables (e.g., for cultural expenditure). This results in the generation of a total of 62,964 equations.
Number of Cultural Variables Demonstrating Granger Causal Effects on Individual Dependent Variables, Organised by Country.
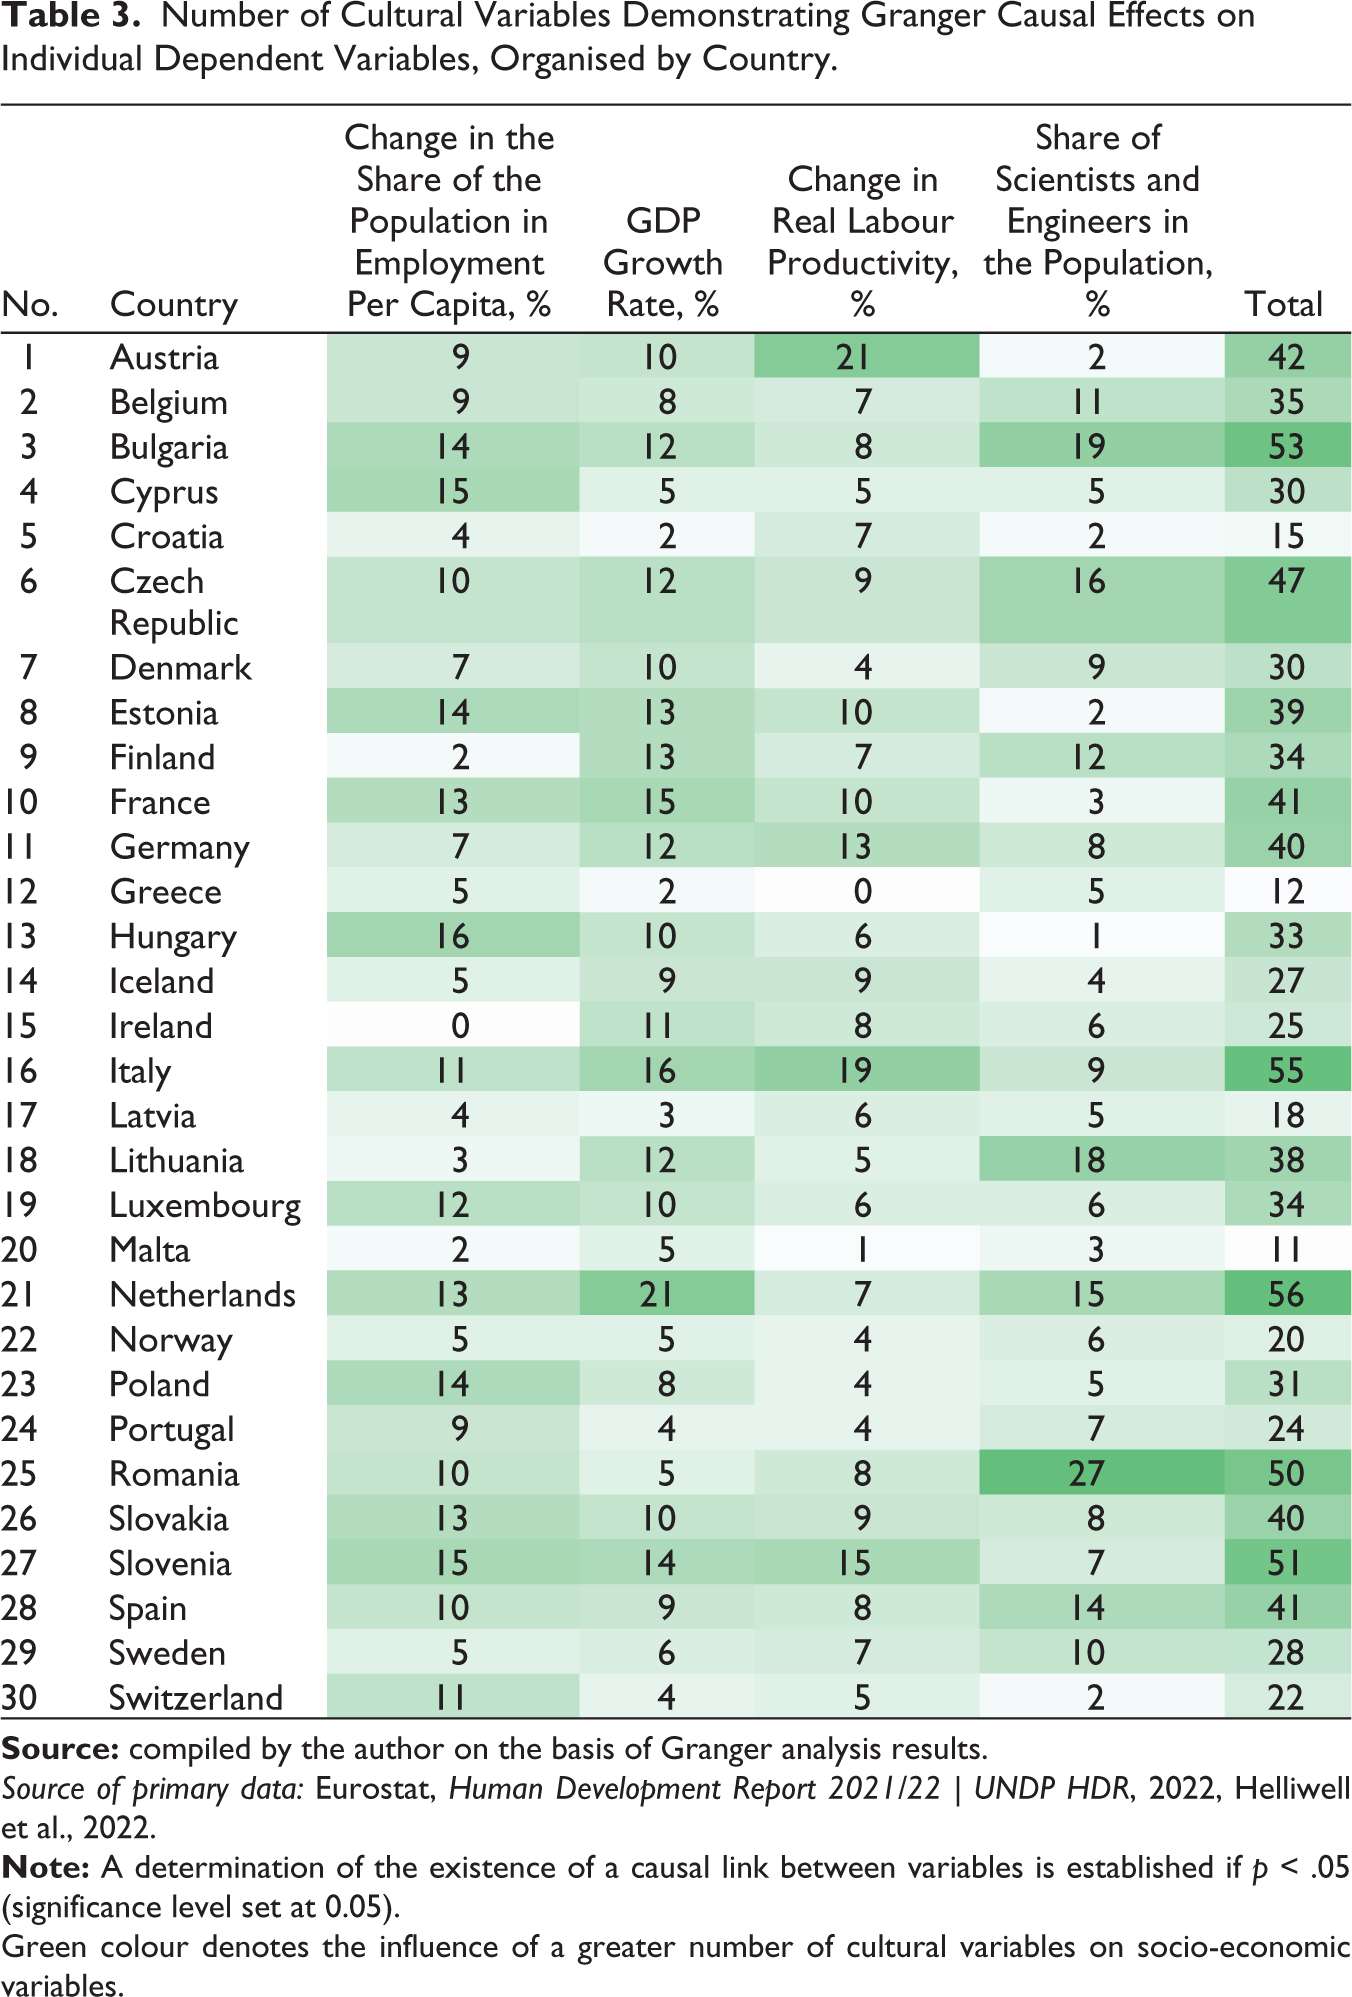
Green colour denotes the influence of a greater number of cultural variables on socio-economic variables.
The process involves formulating hypotheses:
H0: The relevant cultural variable does not have a causal influence on the corresponding economic and social variables. H1: The relevant cultural variable has a causal influence on the corresponding economic and social variables.
When making decisions, the p statistic is examined. If the p value is less than a predefined level of confidence (with a selected α = 0.05), H0 can be rejected. Consequently, it is deduced that the pertinent cultural variable causally impacts the corresponding economic or social variable based on the Granger criterion.
To thoroughly examine the issue of endogeneity, the Granger procedure is repeated in the opposite direction as well, investigating causation from socio-economic variables to culture.
To construct the regression model, it is necessary to approximate a set of cultural indicators. On the one hand, it is impossible to include a wide range of cultural indicators in any model, as it would lead to overloading. On the other hand, the cultural environment should be represented by some approximation that includes a broad set of cultural indicators, providing a diverse representation of culture. In this case, PCA is applied to the same dataset of cultural variables from Eurostat to compose a cultural index. PCA helps combine data with numerous variables, offering a comprehensive view of the entire dataset. Similar to the Granger procedure, PCA is performed for each country in the dataset.
The results of PCA reveal that each country can be effectively approximated by a different number of principal components (PC), ranging from 4 to 15. Notably, the first PC typically represents between 1/2 to 2/3 of the dataset’s variation, with an average exceeding 50%. The second PC contributes approximately 20% of the variation. Consequently, the first two PCs collectively represent over 70% of the data variation, making them the selected components for further analysis.
The final stage involves running a panel vector autoregressive (VAR) model estimated using the Generalised Method of Moments. This model combines elements of a single-equation dynamic panel model and a VAR model (Sigmund & Ferstl, 2021). The conventional ordinary least square equation-by-equation estimation approach for VAR models is not applicable for providing unbiased estimates in the context of panel VAR models (Sigmund & Ferstl, 2021). Furthermore, the panel VAR model enables the examination of links between all model indicators and their lags. Notably, the influence of culture is expected to arise with a delay and become evident over time lags.
After formulating the panel VAR model, its stability is assessed through various diagnostic measures, including evaluating the eigenvalue of the estimated model, inspecting the plot of roots, applying the Andrews-Lu model selection procedure, and conducting the Hansen overidentification test. Subsequently, to enhance the model’s comprehensiveness, an additional exogenous variable for culture is introduced. This variable extends the concept of culture in the model. The selection of indicator is guided by Hofstede’s data, focusing on representing societies’ attitudes regarding indulgence. This augmentation of the model with a supplementary indicator serves to verify its robustness.
It’s important to note that the variables included in the analysis adhere to stationarity requirements. Non-stationary variables exhibit evident trends in their time series data, which can lead to unstable parameter estimates. To ensure stationarity, percentage changes or growth rates are incorporated in the analysis, rather than absolute values of variables.
Empirical Results and Discussion
Granger Causal Effects
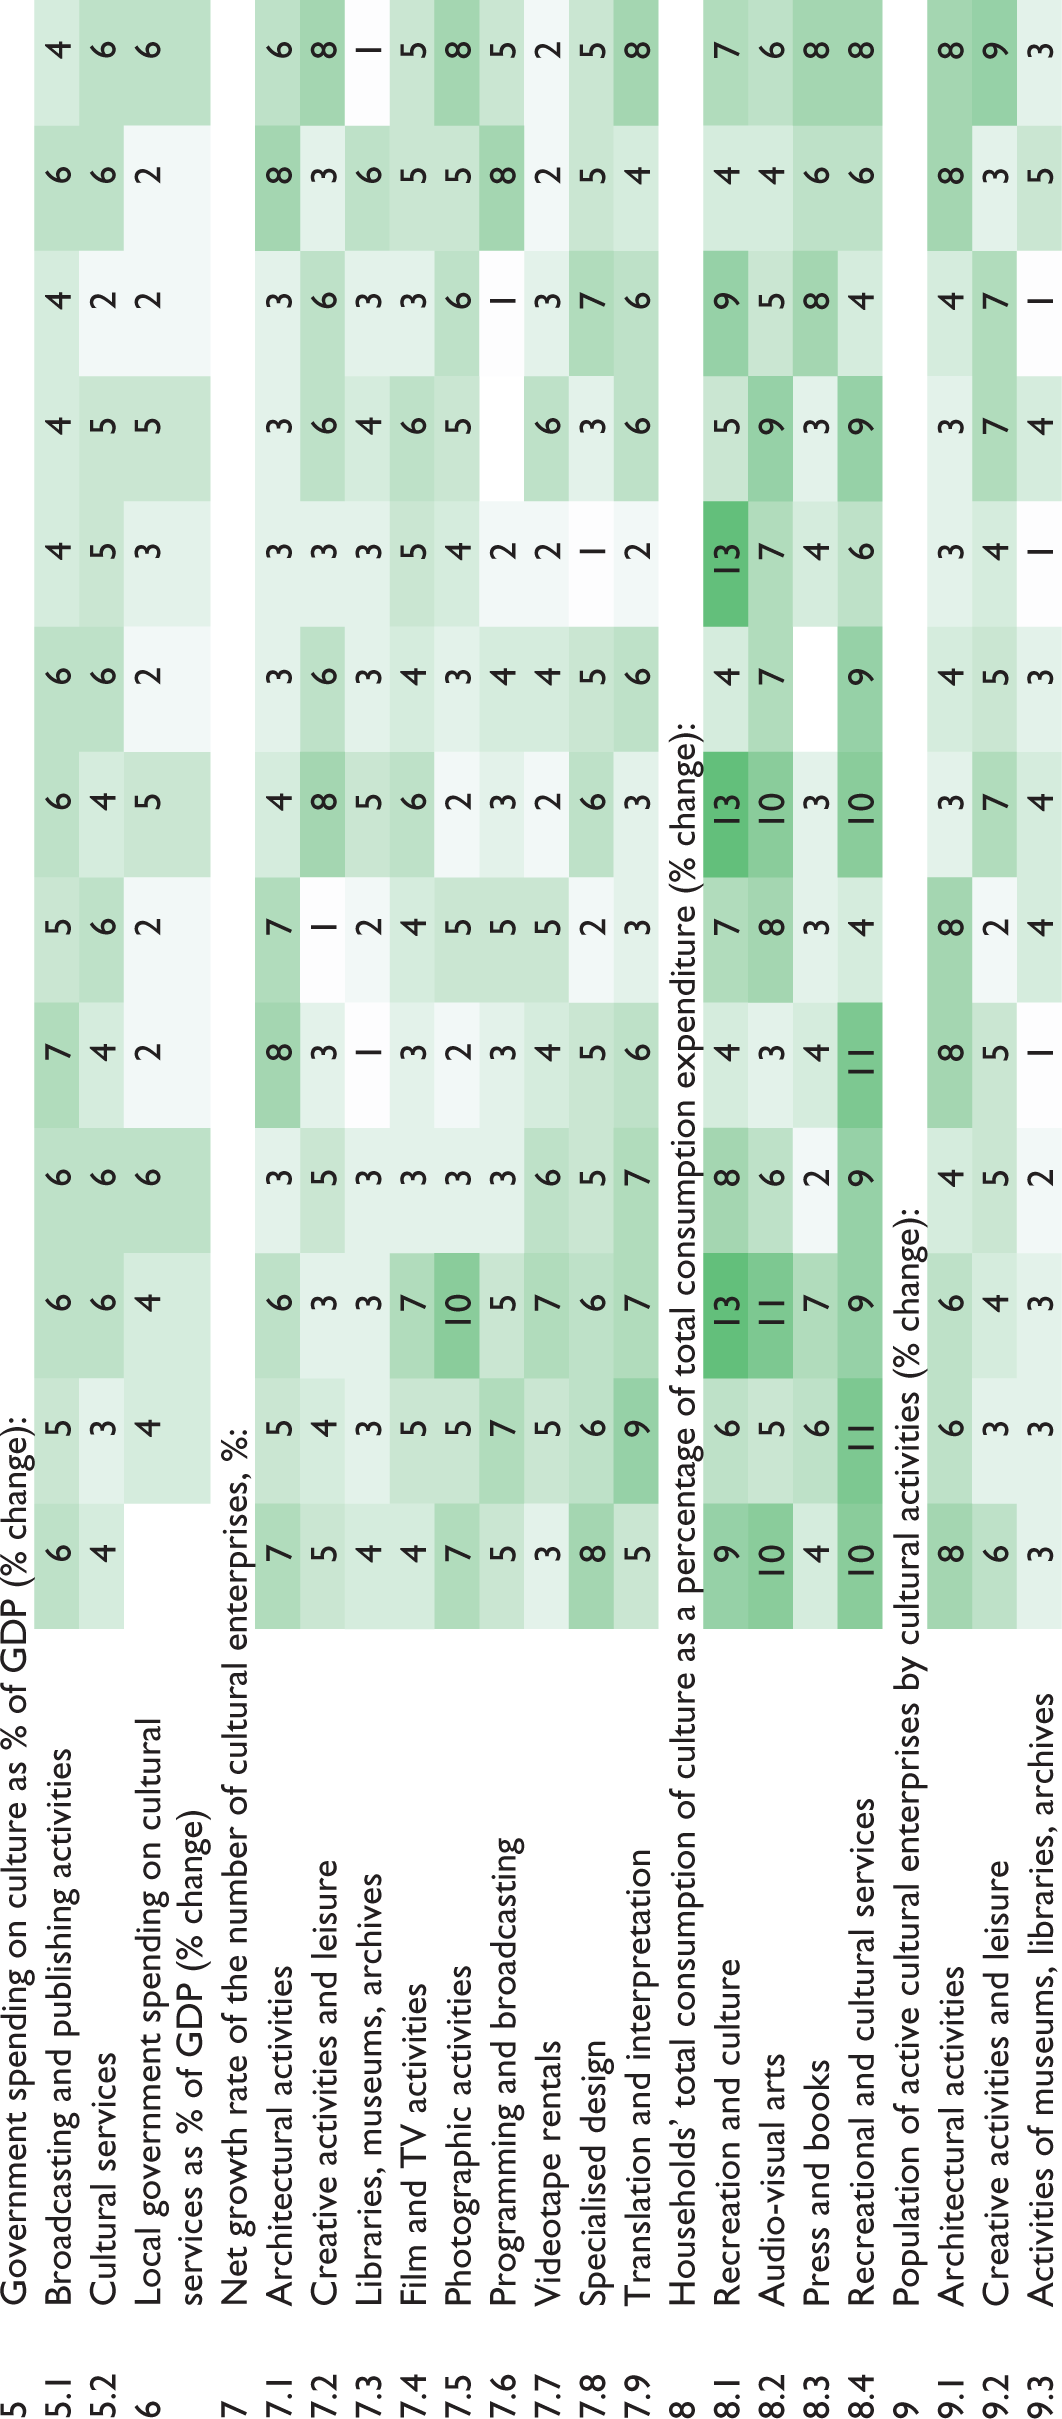
The aforementioned set of variables undergoes estimation using the Granger procedure. The outcomes of Granger’s procedure reveal that cultural variables exhibit an impact on socio-economic variables in only a portion of the European countries analysed (generally up to a third of the examined countries, see Table 2). The prevalent impact of cultural variables is frequently observed through household consumption of cultural services. Specifically, the variable representing the proportion of households’ total recreational and cultural consumption relative to total expenditures was identified to possess a Granger causal effect on the GDP growth rate (in 13 countries), as well as on human capital indicators such as the share of individuals with tertiary education and/or engaged in science and technology within the population, and the share of individuals with tertiary education within the overall population (also in 13 countries). It’s worth noting that variables related to public expenditure on culture or the number of creators infrequently exhibited a Granger causal effect on the dependent variables.
On the other hand, there are several cultural variables that do not exhibit a Granger causal effect on socio-economic variables:
Local government spending on cultural services showed no linkage to the employment variable across any European country. The proportion of employment in the cultural sector relative to total employment was not associated with labour productivity, as measured by the percentage change in hours worked per capita. The proportion of new films and TV enterprises compared to existing ones, along with household consumption of press and books as a percentage of total consumption expenditure, did not causally influence the human capital variable, characterised by individuals with tertiary education employed in science and technology. The net growth rate of the number of cultural enterprises (in programming and broadcasting) and the population of active cultural enterprises engaged in specific activities (like photographic) exhibited no causal impact on the variable representing the share of individuals employed in science and technology within the population. The proportion of new programming and broadcasting enterprises in relation to existing ones did not exert a causal impact on the Life Satisfaction Index.
However, in other instances, the influence of cultural variables on relevant economic and social variables has been identified in at least one country.
Nonetheless, the Granger causality analysis for each individual cultural variable reveals that, in the majority of cases, cultural variables do not exert a discernible effect on economic or social variables across most countries. It’s important to acknowledge that the time series data for a substantial portion of the cultural variables spans approximately 10–15 years, thus imposing limitations on conducting a more intricate country-specific analysis. Within the Granger procedure, four lags demonstrated significance (except for household consumption expenditure, which encompassed a time series from 1995 to 2021, where eight lags proved significant). It’s plausible that an effect originating from cultural components might extend to even longer lags; however, this potential impact cannot be currently captured due to existing data gaps.
The selection of dependent variables encompasses a range of related variables, such as human capital represented through six distinct variables. The Granger causality analysis reveals which dependent variables are impacted by cultural variables across a larger number of countries. Notably, the largest number of countries showcase the influence of cultural variables on the GDP growth rate. Within the context of labour productivity variables, the percentage change in real labour productivity per capita emerges as the most frequently affected. In the domain of human capital, the variable highlighting the proportion of scientists and engineers within the population stands out. Furthermore, the employment variable is notably among the most frequently affected by cultural variables, in comparison to the other chosen dependent variables.
Conversely, the Human Development Index and the Life Satisfaction Index exhibit comparatively infrequent susceptibility to the influence of cultural variables across any country (with an average of around four countries affected by cultural variables on average).
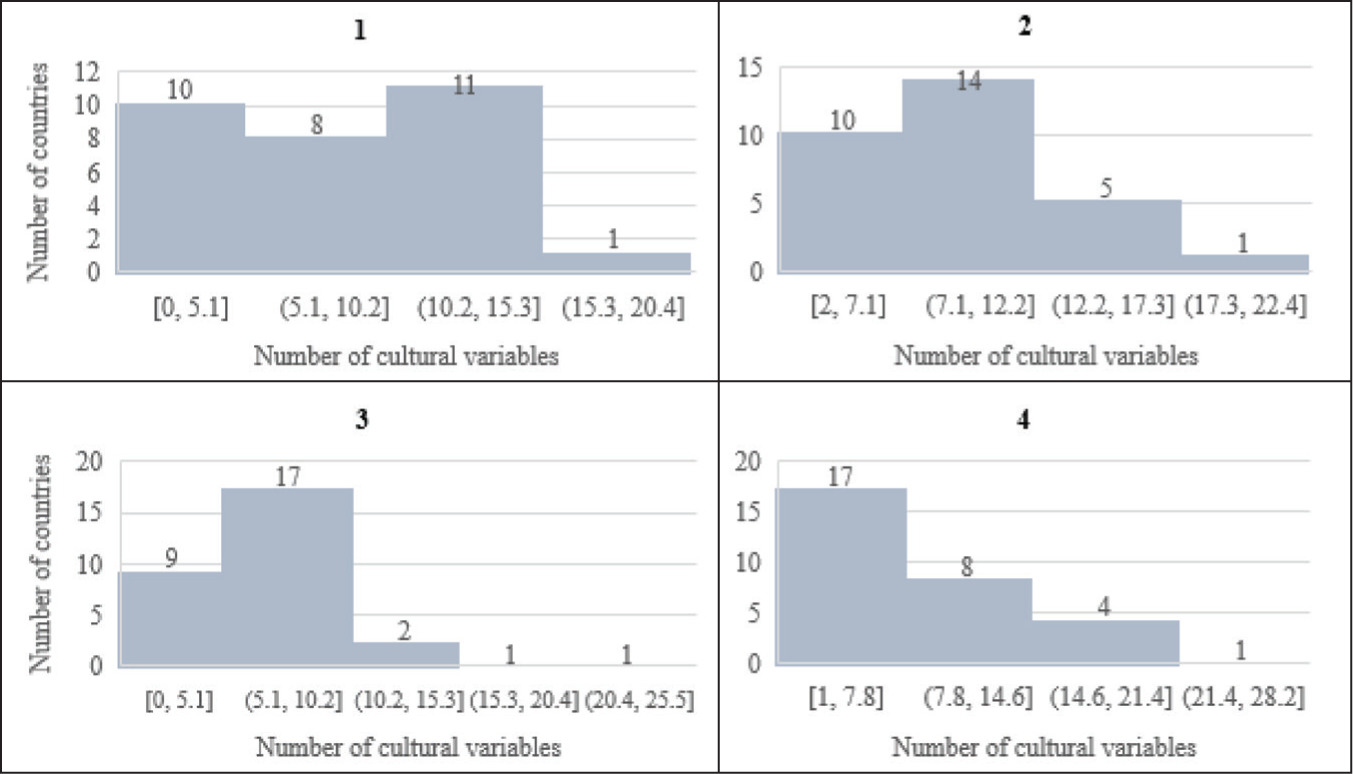
Examining the degree to which cultural variables impact the selected dependent variables, the number of cultural variables per country varies from 2 to 16 for the employment variable, 2 to 21 for the GDP growth rate, 1 to 21 for the labour productivity variable, and 1 to 27 for human capital represented by the proportion of scientists and engineers in the population. More comprehensive findings are depicted in the histograms within Figure 1.
Upon individual examination of each country (as presented in Table 3), it is observed that Granger analysis identifies at least one cultural variable as exerting an impact on the specific dependent variables, with the exception of Ireland and Greece in isolated instances. Malta demonstrates a notably lower impact of cultural indicators too. Conversely, countries such as Italy and the Netherlands exhibit a more pronounced role for cultural indicators.
Upon examining Granger causality from socio-economic variables to culture, it is evident that the findings closely parallel those obtained from the reverse analysis, which investigated the causal impact of culture on socio-economic variables. The outcomes (Appendix 1) indicate that, in a subset of European countries, economic and social variables tend to have a Granger causal influence on cultural variables. Notably, the economic indicator, GDP growth rate, stands out as the most frequently observed factor affecting cultural variables. The causal impact of GDP growth rate on different cultural variables was identified in 1 to 16 countries, with an average impact observed in approximately seven countries. Labour productivity indicators were also frequently identified as having a Granger causal impact on cultural indicators.
The reverse Granger procedure repeats certain trends observed in the previous analysis (Appendix 2), particularly in countries such as Malta and Greece, where Granger causal links between cultural and socio-economic indicators are not apparent. The discrepancy could be attributed to the method of approximating culture. The dataset of cultural indicators more precisely captures contemporary (living) culture, suggesting that cultural heritage might play a more significant role in these countries than current cultural dynamics.
This analysis emphasises the challenge of endogeneity. A comparison of both Granger procedures—assessing the impact on culture and on socio-economic indicators—reveals that, on average, socio-economic indicators more frequently exhibit Granger causality on cultural indicators (Appendix 3). Socio-economic indicators notably influence employment in the cultural sector, the dynamics of cultural organisations, and government spending on cultural services.
It is important to highlight several limitations of the Granger procedure, extensively discussed by Shojaie and Fox (2021). Despite its widespread application in scholarly research, the primary focus of the Granger procedure lies in assessing how well past values of one variable’s time series can predict another’s (Shojaie & Fox, 2021). In other words, it suggests that one variable is considered causal to another if past values of the first variable enhance the prediction of the second. As noted by Shojaie and Fox (2021), this characterisation is based on predictability and does not directly imply a causal effect; improving prediction does not necessarily indicate causality.
Another limitation stems from the bivariate setting. Granger causality assessment is grounded in the connection between two variables. However, real-world systems involve more intricate links, and relying solely on the relationship between a pair of series can lead to confounded inferences (Shojaie & Fox, 2021). In other words, Granger causality may result from an omitted variable, and conversely, non-causality in a bivariate system may theoretically be due to neglected variables (Lütkepohl, 1982).
To tackle the challenges of endogeneity and address shortcomings linked to the Granger procedure, a panel VAR model is developed. Instead of relying on individual cultural indicators susceptible to endogeneity issues, cultural indexes (from PCA) are introduced.
Panel VAR Estimations
Data limitations impose constraints on extending the analysis to a finer country level. Consequently, the focus shifts to estimating a panel VAR model, specifically examining whether the constructed cultural variables (PCs) exhibit a statistically significant impact on the economy. For this analysis, the chosen economic indicator is the GDP growth rate, as cultural indicators, according to Granger causality tests, predominantly influence GDP growth rate and vice versa. In addition, control variables: employment (measured as the change in the share of the population in employment per capita, %, sourced from Eurostat) and inflation rate (consumer prices, annual %, sourced from The World Bank), were incorporated into the analysis. Specifying the model PCA instruments were included (Culture 1 and Culture 2).
A model with five lags was selected (see Appendix 4) as it satisfied the stability condition. The standard stability condition for the panel VAR coefficients relies on the modulus of each eigenvalue of the estimated model (Murakami, 1994; Sigmund & Ferstl, 2021). The constructed panel VAR model is found to meet this condition, as evidenced in Appendix 5, which displays the roots of the companion matrix. Moreover, this model also cannot reject the null hypothesis of the Sargan-Hansen J-test for overidentification (Bowsher, 2002), supporting the reliability of the model. When comparing information criterion values for models with different lags (ranging from 1 to 5), it was observed that, for instance, Bayesian or Hannan-Quinn information criteria were lower for models with fewer lags. However, only the model with five lags satisfied stability conditions. On the other hand, increasing the number of lags, such as adding six lags, resulted in higher values for information criteria.
Moreover, additional models that include only GDP growth rate and the cultural indices were constructed. When comparing these reduced models with the final model, a significant difference in information criteria was observed, favouring the final model. This suggests that constructed model (Appendix 4) offers a more accurate representation of the analysed situation, indicating that culture may not be the sole and primary driver of economic growth.
As seen from the model results, cultural variables have a significant impact on GDP growth rate. Furthermore, the impact with a delay is statistically significant. These results align with those from the Granger procedure, indicating that the cultural environment can be one of the factors influencing economic indicators.
Robustness Check
Many authors analyse culture through indicators like indulgence, individualism, trust, and uncertainty tolerance (Alesina & Giuliano, 2010; Bakas et al., 2020; Tubadji, 2014; Tubadji & Nijkamp, 2015). Following this approach, the panel VAR model is extended with exogenous variable of indulgence. Hofstede’s data is used to include an additional variable reflecting cultural attitudes. The Hofstede model presents six dimensions of national cultures: power distance, uncertainty avoidance, individualism, masculinity, long-term orientation, and indulgence (Hofstede, 2011). Due to the higher volatility of the indulgence variable compared to other dimensions, it is incorporated into the panel VAR model. Its integration maintains the statistical significance of cultural indices at lags 3, 4, and 5. Indulgence also proves statistically significant, impacting GDP growth rate, with a 1-point increase leading to a 0.13% growth rate rise (Appendix 6).
Conclusion
Incorporating a cultural dimension into models of socio-economic development can enrich economic discourse (Guiso et al., 2006). However, the outcomes of such analyses are contingent on the conceptualisation of culture. Predominantly, scholars investigate the impact of cultural capital, which encompasses common attitudes, values, and the inherited or established cultural environment within a given location (including cultural heritage and present cultural infrastructure). Scholars concur that culture can exert an influence on socio-economic indicators, exhibiting both positive and negative effects. Yet, it’s crucial to acknowledge that economic development can also influence cultural variables, blurring the distinction between the causal impact of culture.
Granger causality tests indicate that cultural variables do possess a causal impact on socio-economic variables, but this impact is not widespread and is evident in only a portion of European countries, typically in less than one-third of them. Cultural variables related to cultural enterprises and household consumption expenditure on culture are the most frequently observed influencers of socio-economic variables. Comparisons across countries highlight a more significant role for cultural indicators in countries like Italy and the Netherlands, while their impact is lower in Malta and Greece. The approach to approximating culture in this research relies more on the contemporary (living) cultural environment and places less emphasis on cultural heritage. This might explain why countries with rich cultural heritage, such as Greece or Malta, do not exhibit Granger causality.
One of the main questions addressed in this research was the endogeneity of culture: not only does culture impact socio-economic variables, but vice versa as well. After employing the Granger procedure in the reverse direction and analysing whether socio-economic variables have Granger causality on cultural variables, a causal link is established.
While the Granger procedure assesses causal relationships, it does not provide insights into the direction of the effect and considers only bivariate links. However, links and causality can vary depending on the number of indicators included in the model. To gain a fuller understanding of the connection between culture and economics, a panel VAR model with control variables is constructed. To represent the cultural environment, PCA is performed, and culture indices are constructed. Additionally, the model is extended with a variable representing cultural attitudes (indulgence). Results from panel VAR models affirm that culture impacts economics, capturing a delayed impact, as five lags of cultural indices are statistically significant. These results align with those obtained through the Granger procedure, providing further confirmation that culture can be one of the factors influencing economic indicators.
Footnotes
Declaration of Conflicting Interests
The author declared no potential conflicts of interest with respect to the research, authorship and/or publication of this article.
Funding
The author received no financial support for the research, authorship and/or publication of this article.