
Abstract
The study examines the impact of the misery index on corruption in Nigeria over the period 1980–2018 using the autoregressive distributed lag model. The results confirm the long-run relationship between the misery index and corruption. Misery index increases corruption in both the short and long term, while economic growth reduces corruption in the long but not in the short-run period. The results show that the level of corruption is closely related to the country’s dire economic conditions. These findings suggest that inflation and unemployment rates need to be reduced in the country using the appropriate monetary and fiscal policies. Moreover, government efforts at increasing economic activity in the country will reduce the level of corruption, especially in the long run.
Introduction
According to the Transparency International Corruption Perception Index, the level of corruption, particularly in the developing countries, has increased over the years. Several cases of monumental corruption scandals have been reported in both developed and developing countries (Ades & Di Tella, 1997; Aidt, 2003). In Nigeria, corruption is deep-rooted and widespread. In 2012, it was reported that the country lost over US$400 billion to corruption since independence. Indeed, in 2018, Nigeria occupied 144th position out of the 180 countries ranked by the Transparency Corruption index (180th position being the most corrupt nation) (ICRG, 2019).
Although the debate on the economic effect of corruption is yet unsettled, many studies have shown that it hurts economic efficiency, economic growth and development working through various channels (Barreto & Alm, 2003; Mauro, 1995, 1998; Mydral, 1968, 1989; Rose-Ackerman, 1996; Shleifer & Vishny, 1993). Given, the detrimental effect of corruption on growth and development, several studies have investigated the main determinants of corruption worldwide. This is to find the appropriate policy actions that could be adopted to address the problem of corruption. From these previous studies, many drivers of corruption have been identified in the literature. These include democracy (see Billiger & Goel, 2009; Iwasaki & Suzuki, 2012; Kolstad & Wiig, 2015); income (Kolstad & Wiig, 2015; Nur-Tegin & Czap, 2012); oil rents (Ades & Di Tella, 1997; Arezki & Bruckner, 2011); openness (Gokcekus & Knorich, 2006); and high inflation (Evrensel, 2010). Other established determinants of corruption are government size (Kotera et al., 2012), the export of natural resources (Busse & Groning, 2013), high military expenditure (Abu & Staniewski, 2019) and level of education (Evrensel, 2010).
Thus far, no known study has investigated the effect of the misery index (the joint effect unemployment and inflation) on corruption. Few studies have investigated the impact of inflation separately on corruption, and the general finding is that a high inflation rate leads to high levels of corruption (Evrensel, 2010). However, in the literature, the impact of unemployment on corruption has not been explored. Lack of studies might be due to the argument that unemployment might not directly affect corruption. However, when critically analysed, unemployment will no doubt have serious impact on corruption, particularly in the developing countries. Unemployment working through income inequality can cause revenue loss, change the share of factor revenue and increase poverty. Given the positive relationship between poverty and corruption, it follows that unemployment is likely to affect corruption positively.
Regarding the effect of the combination of inflation and unemployment on corruption, no known study has been reported in developing countries. The conjecture is that the combination of inflation and unemployment (that is, the misery index) will likely affect corruption through income and poverty. Hence, the main argument in this article is that drivers of corruption are incomplete without considering the misery index. 1 Consequently, the misery index–corruption nexus is chosen for analysis in this work.
The misery index is an economic concept popularised by Arthur Okun. 2 It is the sum of inflation and unemployment rates, and measures the performance of the economy. In practice, a higher value of the misery index is perceived as a reflection of depressed economic conditions. Moreover, the misery index is a critical mirror of the quality of life (Akcay, 2017). Theoretically, the expectation is that the misery index will lead to an increase in corruption. This assertion is anchored on the argument that a low quality of life as measured by a high level of misery index will likely make individuals in the society engage in corrupt practices to better their lots and wellbeing.
The remainder of the article is structured as follows: the next section gives an overview of the misery index and corruption in Nigeria. The third section provides a summary of the theoretical and empirical literature. The section after that describes the data and methodology. The fifth section provides the discussion of results and the robustness checks. The sixth section contains the conclusion.
Overview of Misery Index and Corruption in Nigeria
The paths of misery index and corruption index 3 and corruption index over the study period are shown in Figure 1. The misery index measured as the sum of inflation rate (end of period consumer prices index) and unemployment rate (percentage of total labour force) increased marginally from 1981 to 1984. The increase in the misery index during this period was only marginal because the rates of inflation and unemployment were relatively low; mostly single digit. Indeed, the misery index decelerated slightly between 1982 and 1985 following the demand management policies introduced by the government. However, the value of misery index increased marginally in 1987. The development was as a result of the structural adjustment programme introduced in mid-1986, which triggered a sharp increase in the rate of inflation. Although the misery index showed a slight deceleration between 1988 and 1990, it was short-lived as the index assumed a significant upward trend from 1991 to 2018. The sharp increase of the misery index from 1991 could be attributed to many factors. First, the implementation of the structural adjustment programme led to massive depreciation of local currency. This development precipitated high rate of inflation as the country depended largely on imported finished goods and raw materials for production. Second, the high exchange rate coupled with high lending rate squeezed the small and medium scale enterprises, which led mass retrenchment of workers. Finally, the instability of international oil price adversely affected government aggregate revenue, which precipitated massive retrenchment in the public sector. 4
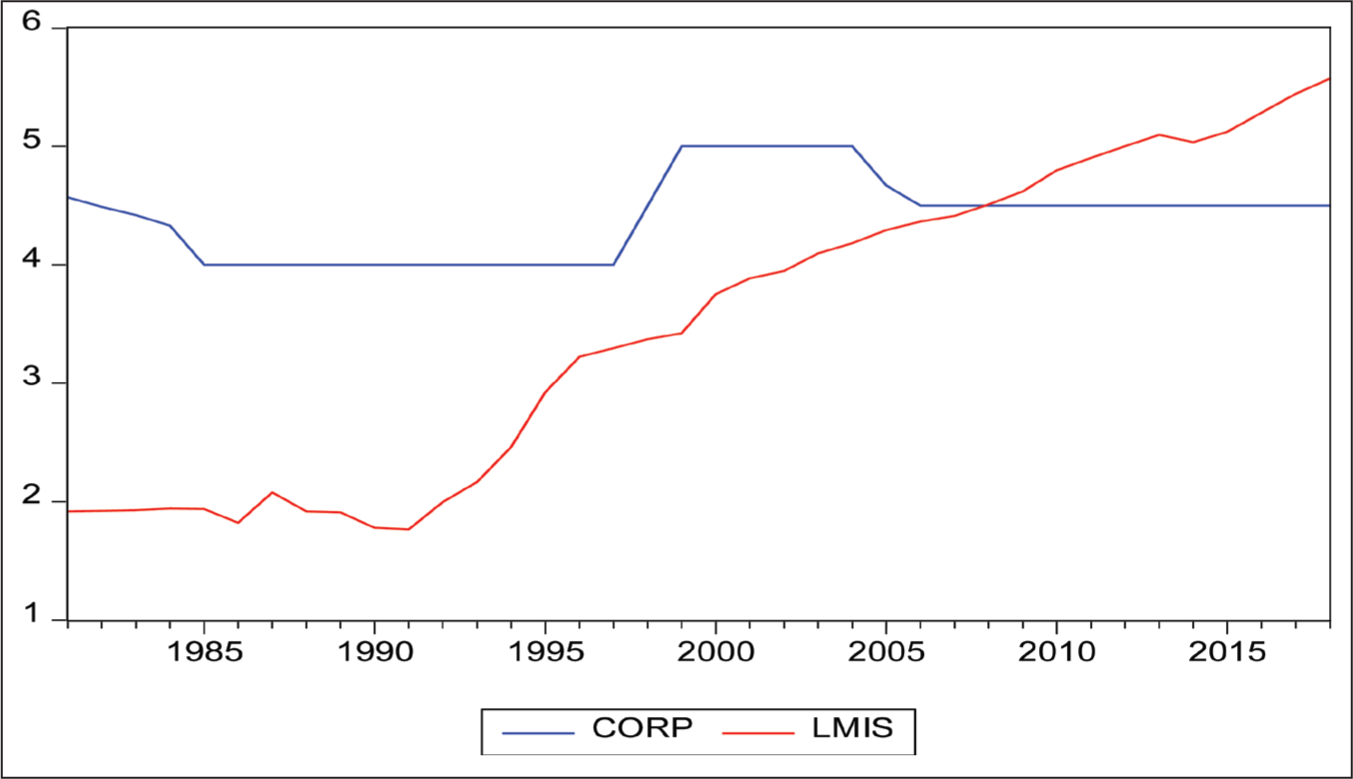
In the same way, the rate of corruption remained consistently high over the period 1981–2018. Over the entire period of study, the corruption index remained 4 points and above. This value of corruption index is very high because the maximum value is 6 based on our redefinition of corruption index in this article. The corruption index dropped slightly between 1982–1985 as a result of the government’s war against indiscipline and corruption. The government enacted a stringent decree against indiscipline and corruption, which to an extent impacted positively on corruption. However, the decrease in corruption index was short-lived following the change of government in 1985. The new government that came to power cancelled the decree. Consequently, the level of corruption assumed a slightly upward trend from 1986–1996. However, the corruption assumed a significant upward trend from 1996 to 1999. The index remained relatively constant at 4.8 point over the period 1999–2004, decreased to 4.5 points in 2005 and remained at that level till 2018. The occasional downward movement of the corruption index could be attributed to the activities of the Economic and Financial Crime Control (EFCC) and other agencies established by the government to tackle the menace of corruption in the country. Generally, both misery index and corruption index maintained upward trends over the study period.
Given the high level of corruption as well as the high and increasing rates of both unemployment and inflation over the study period, Nigeria provides good conditions to test the corruption–misery index nexus.
Theoretical and Empirical Issues
In the literature, there are many theories of corruption. Some of these theories include: the principal-agent theory (Klitgaard, 1988; Shleifer & Vishny, 1993), the collective action theory (Persson et al., 2013), the tax compliance theory (Mookherjee & Png, 1989), the compensation theory (Becker & Stigler, 1974), the institutional theory (Lessig, 2013; Thompson, 1995, 2018) and the social support theory (Cullen, 1994). Essentially, these theories attempt to explain the various drivers of corruption, and thus help to formulate appropriate actions to address the menace of corruption. However, no known theory has linked the misery index with corruption. At best, existing studies have only examined the effects of inflation and unemployment on corruption separately. Essentially, examining the relationship between corruption and misery index is a relatively new area in the literature.
Theoretically, inflation working through various channels can lead to increased corruption. First, by decreasing the purchasing power of the people, it may cause individuals in society to engage in corrupt activities to meet their basic needs. Moreover, by affecting the sources of income labour and capital inclusive, it can lead to high income inequality and increased corruption. For example, inflation can cause wages to fall behind prices, which may lead to income transfer from wage-earners to profit and thus increase corruption. Also, inflation working through economic growth can lead to high income inequality, thereby leading to a high level of corruption. Furthermore inflation as an indicator of macroeconomic instability, high risks and uncertainty can propel increased corruption. The reason is based on the fact that in the face of risks and uncertainty, individuals may be forced to engage in shady and corrupt activities to secure their future. Empirically, few studies have investigated the relationship between inflation and corruption. The main finding is that inflation and corruption are negatively related (Abu & Staniewski, 2019; Evrensel, 2010). In the same way, Unver and Koyuncu (2016) find that inflation is positively associated with corruption.
The literature is sparse on the impact of unemployment on corruption. Most studies have looked at the effect of corruption on unemployment. Undoubtedly, unemployment will have an impact on corruption. For one, unemployment is a significant driver of inequality, which in turn affects corruption, then unemployment is linked with corruption. Moreover, individuals are more likely to engage in corrupt and sharp practices in an economy characterised by a high level of poverty, high unemployment rate and high youth dependency ratio. This argument is premised on the fact that few people that are employed in such an economy will need additional resources to meet their needs and those of their dependants. The finding by Enofe et al. (2016) confirms the insignificant positive effect of unemployment on corruption in Nigeria.
As regards misery index, that is, inflation and unemployment, no study has examined its link with corruption. However, there are few reasons to believe that the misery index will adversely affect corruption. First, inflation is a component of the misery index. The second component, namely unemployment, is usually driven by a high increase in prices. Given the finding that corrupt countries tend to have higher inflation, it simply means that there is a link between the level of corruption in a country and the misery index. Besides, misery index (the sum of inflation and unemployment rates) is an indicator of the economic condition of a nation. It follows that increasing unemployment and inflation rates (higher index value) simply show a depressed economic state for the country. The depressed economic climate will rob off on poverty and the quality of life of the people, which may lead to a high level of corruption in the country. It is argued that when compared with wealthier nations, government officials in depressed and poor countries show the potential to claim more bribes. In contrast, people in the poor countries are more likely to give bribes for getting private profit from government officials (Justesen & Bjornskov, 2014). Empirically, some studies have confirmed that poverty is positively and significantly related to corruption. For example, the empirical study by Negin et al. (2010) for 97 market economies shows that poverty is positively associated with corruption. Similarly, Unver and Koyuncu (2016) find that poverty has significant positive effect on corruption.
Data and Methodology
The article utilised annual data series on GDP per capita growth rate (gdpr), misery index (mis), trade openness (ope), and corruption (corp) from 1981 to 2018 in Nigeria. The data on corruption was obtained from the index generated by the International Country Risk Guide (ICRG). Corruption index comes on a scale of 0 to 6. However, as explained in Endnote 1, 0 is the lowest level of corruption, while 6 is the highest. The data of the GDP per capita growth rate was obtained from the World Development indicator. Trade openness was calculated as total trade (Export + Import) to GDP ratio. The data series on export and import were obtained from the World Development Indicator. Misery index series is the sum of the unemployment rate and inflation rate. The inflation rate is the end of the period consumer prices index, while the unemployment is in percentage of total labour force. Unemployment rate data was obtained from the National Bureau of Statistics, while inflation data came from the Central Bank of Nigeria, Statistical Bulletin. The misery index, openness, and GDP per capita growth series are transformed into a natural logarithm scale before analysis.
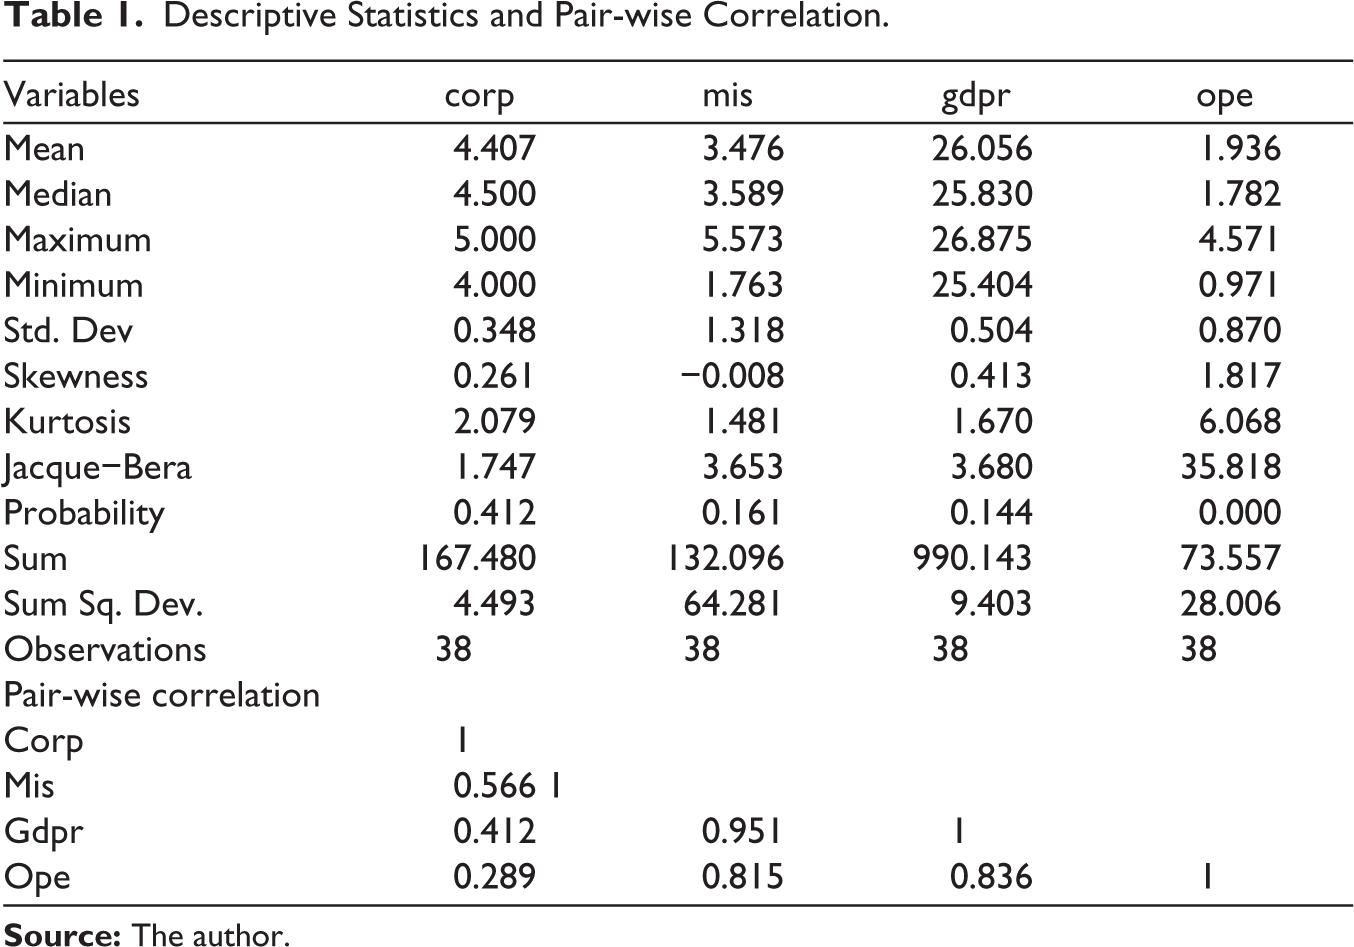
The descriptive statistics and the pair-wise correlation for the four variables used in the analysis are presented in Table 1. The statistics in Table 1 show that the series is platykurtic as their kurtosis is less than 3 except openness. Also, the probability of the Jacque−Bera statistic accepts the hypothesis of normal distribution at a 5% level except for openness. The misery index is positively correlated with corruption and other variables in the model.
Descriptive Statistics and Pair-wise Correlation.
The Model
The purpose of this study is to examine the impact of the misery index on corruption. To examine the relationship between the misery index and corruption, the study adopts a linear model stated as Equation 1
5
:
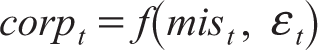
Here corp is the corruption measure, mis is misery index, εt is the error term, and t is the time dimension. It is believed that other variables could impact on corruption. The omission of these variables could affect the relationship between the misery index and corruption. Therefore, we incorporated two control variables, namely economic growth rate (gdpr) and openness (ope), to avoid simultaneous bias (Gujarati, 1995) in our regression.
6
Equation 1 then becomes:

Hence our basic equation for assessing the impact of misery index on corruption when stated explicitly is given as:

We expect that the coefficient of misery index λ1will be positive. An increase in misery index, as an indicator of depressed economic state, is expected to lead to an increase in corruption as discussed under the review of literature. The coefficient of GDP per capita growth (λ2) is expected to be negative. An increase in economic growth rate if allows to trickle-down is an indicator of improved welfare. We expect that improved welfare will reduce corruption. Asides, an increase in GDP per capita growth will likely provide more financial resources to tackle the problem of corruption. Finally, the coefficient of openness (λ3) is expected to be negative. If a more corrupt country trade with a less corrupt country, the highly corrupt will be encouraged to reduce its level of corruption. According to Ades and Di Tella (1999); and Abu and Staniewski (2019), with trade, domestic firms face competitions with foreign trading partners, which may compel them to reduce rent-seeking behaviour and other sharp practices.
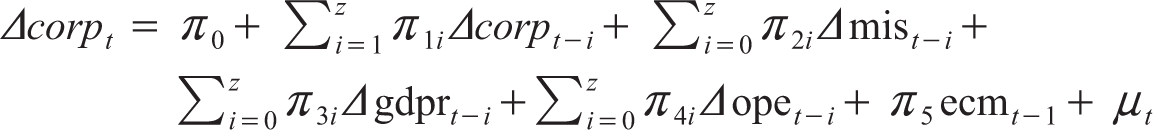
Following Pesaran et al. (2001) bounds testing, the autoregressive distributed lag (ARDL) model for Equation 3 is stated as follows
7
:
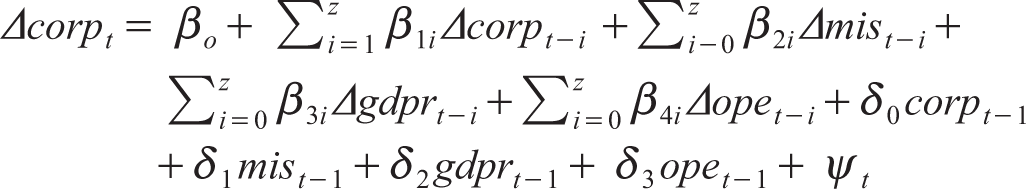
where Δ stands for first difference operator, β0 is the drift component, z represents the maximum lag length, and ψt is the residual. The hypothesis for testing the existence of long-run cointegration is stated as follows:
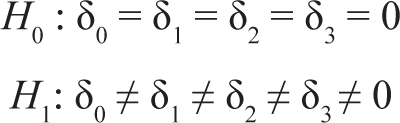
Equation 5 merely states the joint null hypothesis of no cointegration against the existence of a valid relationship between corruption and the other variables in the model. To decide the presence of cointegration, the computed F-statistic is compared with the upper critical bounds value or the lower critical bounds value. If the computed F-statistic is above the upper critical value, the null hypothesis is rejected, meaning there is cointegration. The reverse is the case if the computed F-statistic is below the lower critical value. If the F-statistic falls within the upper and lower critical values, then it is inconclusive. If the variables are cointegrated, the error correction model given as Equation 6 can be estimated.
Results
To avoid spurious results, we perform unit root tests to ensure that no I(2) variable is used. The results of ADF and PP unit root tests are reported in Table 2. The results show that the corruption index, misery index and openness are I(1) while GDP per capita growth rate is I(0). As no variable is I(2), we test for the long-run relationships among the variables using the ARDL bounds test. The bounds F-test is applied to Equation 4. Table 3 shows the results obtained. The results of the bounds test for cointegration show that the F-statistic (5.381) exceeds the upper critical values at the 1% level of significance. This finding means that there is long-run cointegration among the variables.
Results of Unit Root Tests.
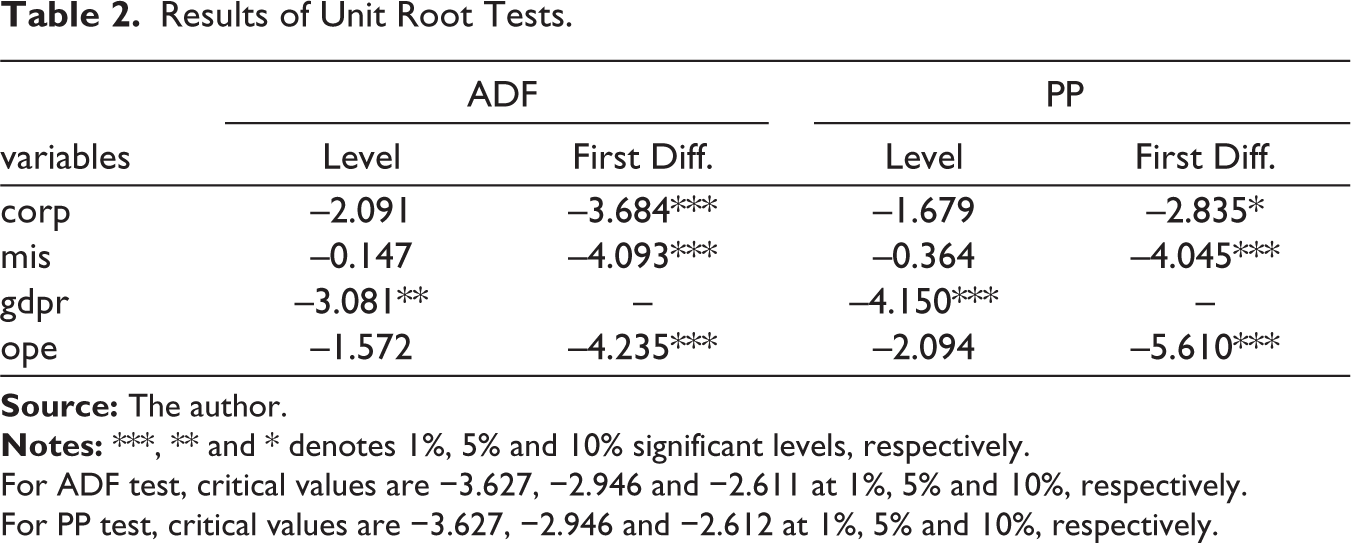
For ADF test, critical values are −3.627, −2.946 and −2.611 at 1%, 5% and 10%, respectively.
For PP test, critical values are −3.627, −2.946 and −2.612 at 1%, 5% and 10%, respectively.
Bounds F-test for Cointegration.
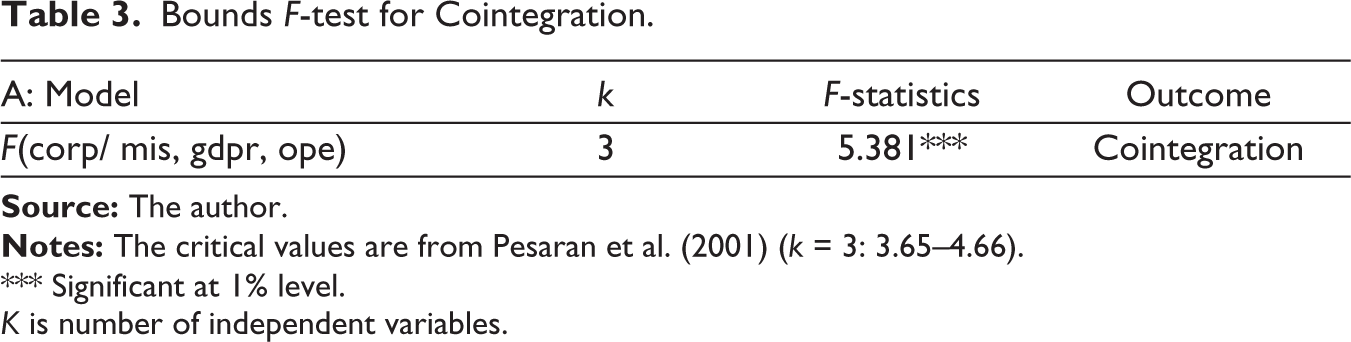
*** Significant at 1% level.
K is number of independent variables.
To estimate the coefficients of the equation, we estimate the ARDL model with the optimal lag length (1, 2, 3, 3), as suggested by the Akaike Information Criteria (AIC). The results of the long-run, short-run and diagnostic tests are shown in Table 4. The results demonstrate that the misery index has a positive and significant effect on the corruption index at the 5% level in the long- run. A 1% increase in the misery index increases corruption by 0.539% in the long-run. This finding conforms to a priori expectation that a high misery index would increase corruption in Nigeria. The depressed economic condition in Nigeria over the study period as reflected in high and increasing level of poverty led to increased corruption.
ARDL Model: Long-run and Short-run.
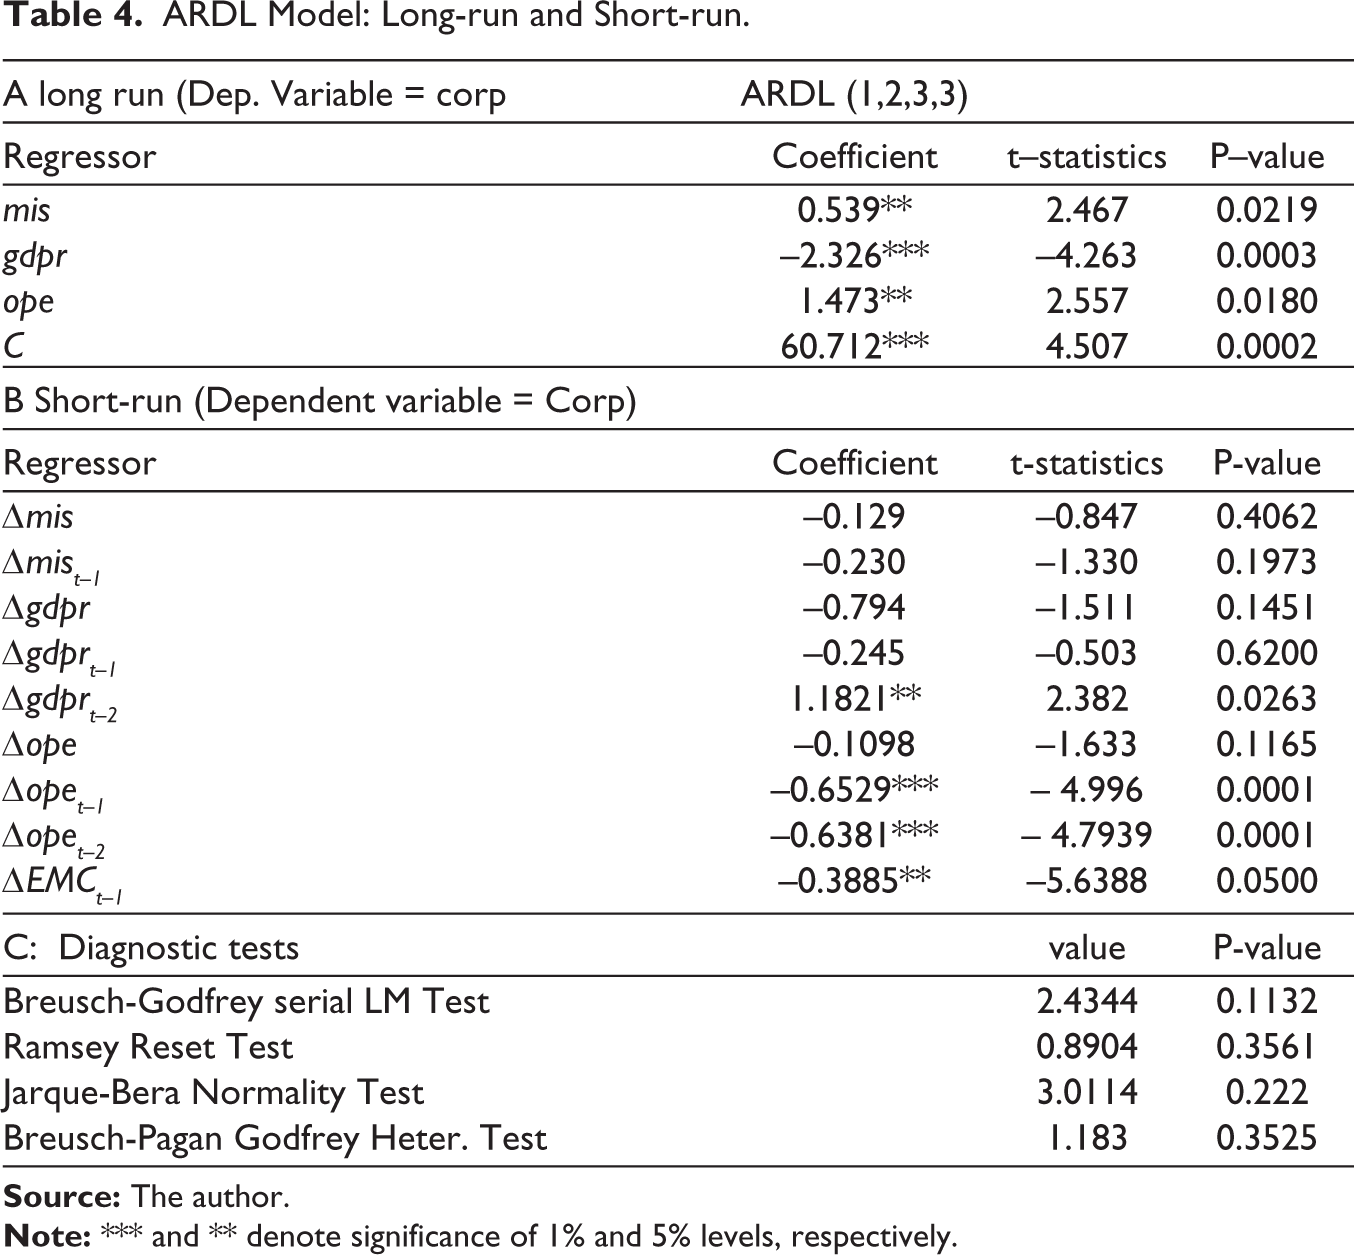
In the short-run, the misery index has a negative but insignificant effects on corruption. However, as the coefficient is not significant, a conclusive inference cannot be drawn from the result. The results show corruption is closely related to the country’s dire economic condition. This result is consistent with the result of Akcay (2017) for Turkey. The coefficient of GDP per capita growth rate is negative in the long-run. For example, a 1% increase in GDP per capita growth reduces corruption by 2.326%. This result suggests that improved economic development will lead to a reduction in corruption in the long-run. Likewise, in the short-run, GDP per capita growth rate has an insignificant negative effect in the first and second lags but positive and significant in the third lag. This result is in line with our a priori expectation. The increased in GDP per capita growth is an indicator of an improved welfare might have led to a reduction in the level of poverty with positive effect on corruption. The finding of the moderating effect of economic growth on corruption is consistent with the studies of Abu and Staniewski (2019), Busse and Groning (2013), Elbahnasawy and Revier (2012), Goel and Nelson (2010) and Kolstad and Wiig (2015).
Openness has a positive and significant effect on corruption in the long run. A 1% increase in openness leads to a 1.473% increase in corruption. However, the reverse is the case in the short- run. For example, a 1% increase in openness leads to 0.6529% and 0.6381% reduction in the level of corruption in the first and second years, respectively. This finding on openness–corruption nexus in the short-run is consistent with the works of Abu and Staniewski (2019), Gocekus and Knorich (2006) and Triesman (2007). The finding that openness increases corruption in the long run in Nigeria should not come as a surprise. More often than government policies aimed at addressing economic malaise such as corruption tend to work better in the short-run. In the long-run, the reverse is always the case because individuals would have perfected side-tracking or circumventing the policies/laws set by the authority.
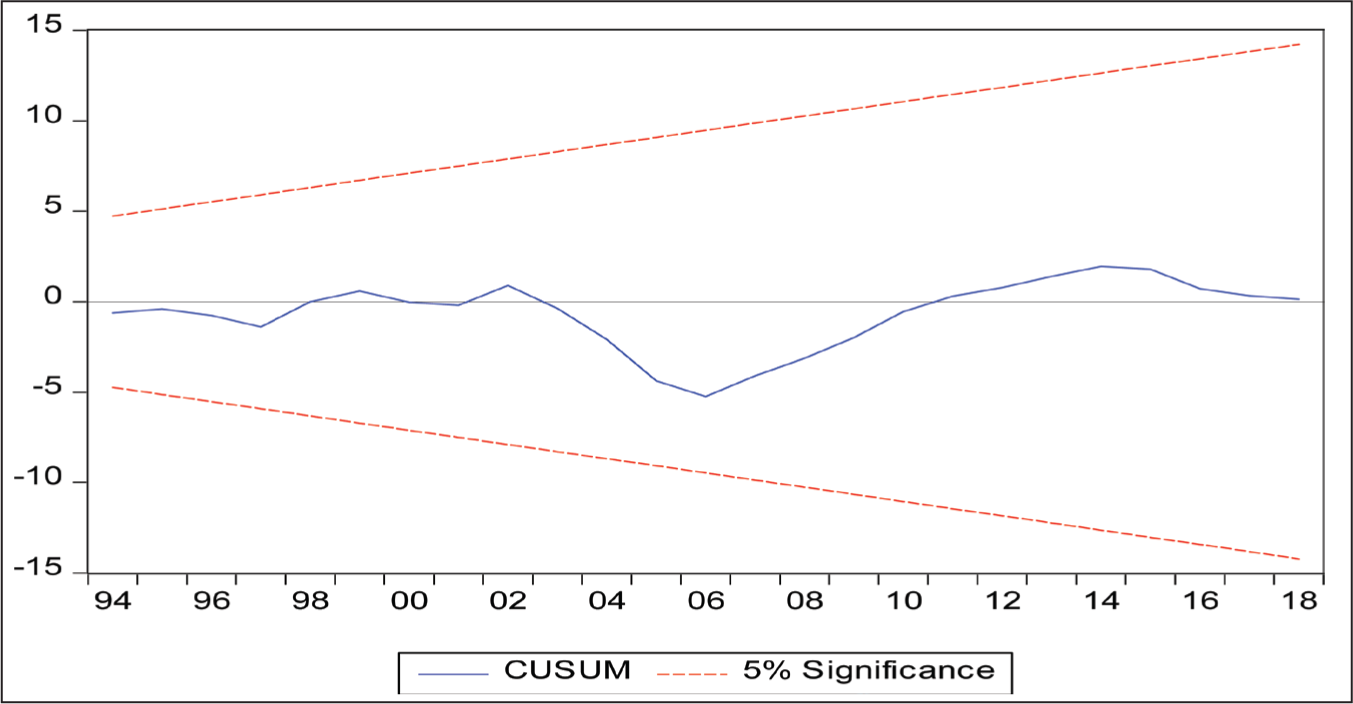
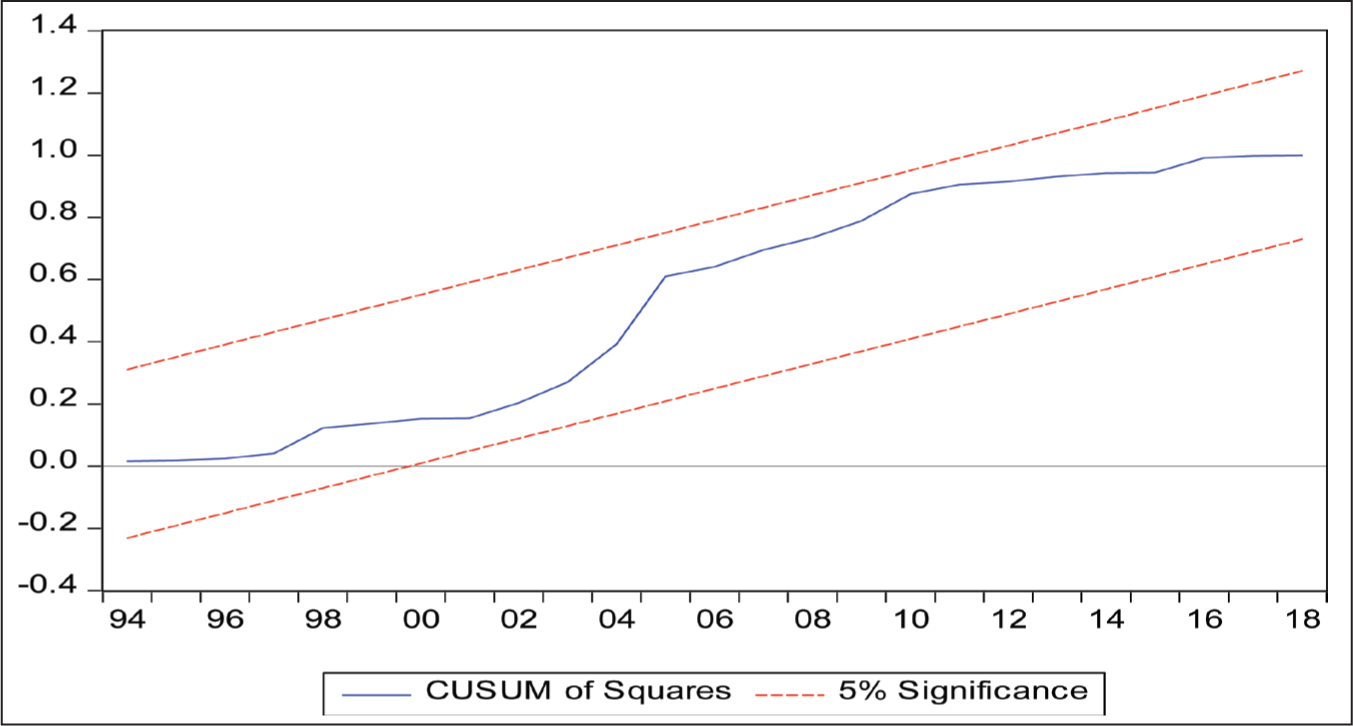
The estimated error-correction term has the correct sign and statistically significant, which provides further support for the long-run relationships among misery index, corruption, GDP per capita growth rate and openness. The error-correction shows that a deviation from long-run equilibrium this period is corrected by about 39% in the next year. The results of the diagnostic tests, as reported in Panel C of Table 4, show that the estimated model passes the tests, namely serial correlation, functional form, heteroscedasticity and normality. Besides, the tests for structural stability conducted using cumulative sum (CUSUM) and cumulative sum of squares (CUSUMQ) show that the estimated coefficients in the error correction model are stable for the period of analysis. As shown in Figures 2 and 3, the plots of CUSUM and CUSUMQ fall within the lower and upper bounds.
Robustness Checks
To further validate the findings from ARDL, we estimate the equation using Fully Modified Ordinary Least Squares (FMOLS) of Hansen and Phillips (1990) and Canonical Cointegration Regression (CRR) of Park (1992). The results are presented in Table 5. The results obtained are similar to those obtained from ARDL except in the case of openness in the long run. Both FMOLS and CCR results show that an increase in the misery index leads to an increase in corruption in the long-run, while an increase in GDP per capita growth rate leads to a decrease in the level of corruption. However, an increase in openness leads to a reduction in corruption for both FMOLS and CCR estimations, though the coefficient is not significant.
Results of FMOLS and CCR Models.
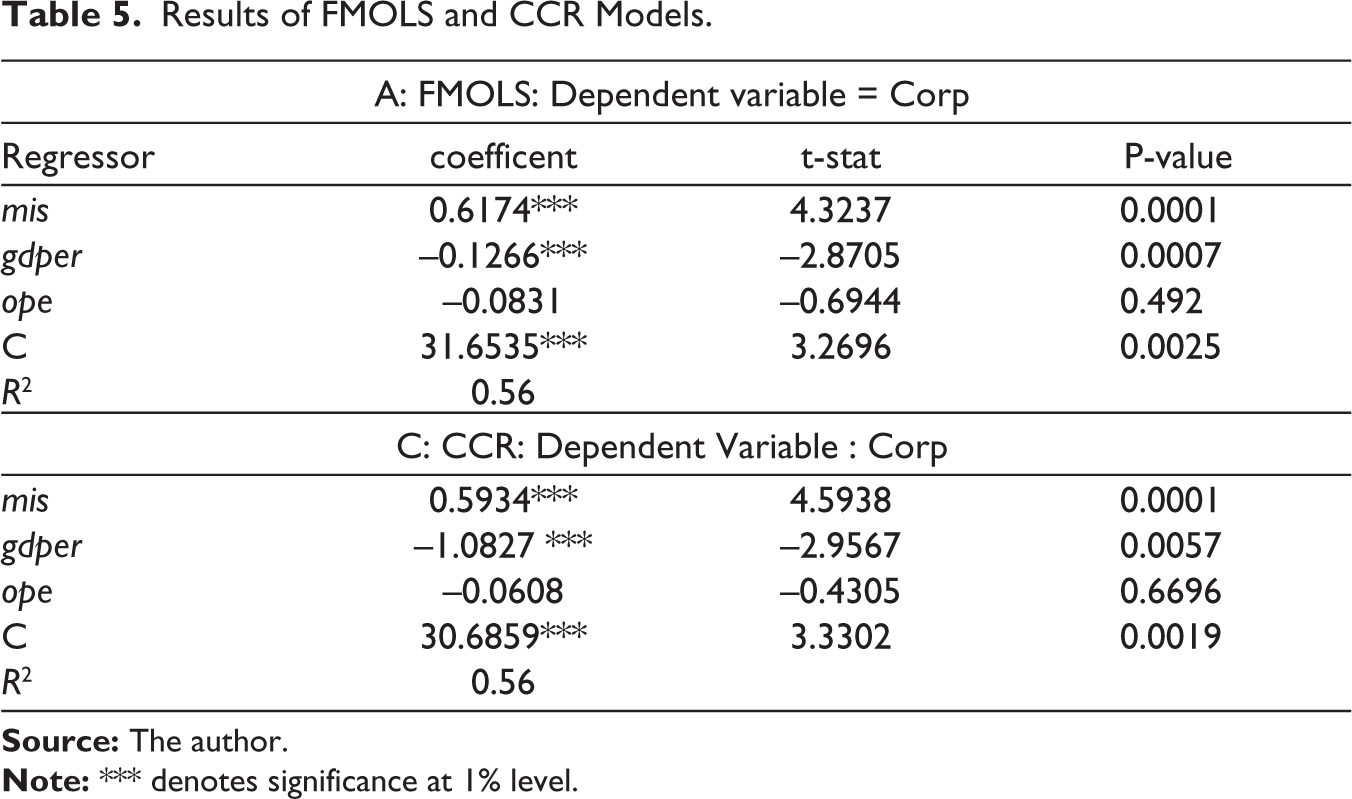
In general, the estimations from the ADRL, FMOLS and CCR are quite similar, which then increase our confidence that the estimates obtained are constituent and robust.
Conclusion
This study has examined the link between misery index and corruption in Nigeria for the period 1980–2018. The ARDL cointegration test confirms the long-run relationship among the variables used in the model, namely misery index, corruption, GDP per capita growth rate and openness. The results of the ARDL show that the misery index tends to increase the level of corruption, while an increase in economic growth rate tends to reduce the level of corruption. This finding indicates that the economic condition has a significant effect on the level of corruption. Openness, on the other hand, tends to increase corruption in the long-run. The reverse is the case in the short-run. Arising from these findings, the government and policymakers in Nigeria should implement policies that aimed at achieving macroeconomic stability. Moreover, the government must put in place policies to ensure an increase in economic growth. Finally, the economic policy of opening up the economy must be monitored, to ensure individuals do not pervert it the country for their selfish interest in the long-run.
Footnotes
Declaration of Conflicting Interests
The author declared no potential conflicts of interest with respect to the research, authorship and/or publication of this article.
Funding
The author received no financial support for the research, authorship and/or publication of this article