
Abstract
The concepts of cultural relativism (introduced by Franz Boas) and hedonic relativism (introduced by Richard Easterlin) are reference points of a theory that addresses international differences in per capita incomes and variations in the contribution of income to happiness. The pivotal concept in this study is diligence. Painstaking effort, that is, diligence, is needed to produce high quality goods and services. The downside of such efforts lies in the psychological burden that comes with the necessary high level of self-control of the individual worker and the required organisational feedback mechanisms in firms. We present two competing views concerning the determination of diligence. The first, anthropologically inspired, hypothesis states that a society’s cultural forces such as cognitive styles, organisational traditions and religion determine the level of diligence. One implication of this perspective is that societies can have income levels that are either too high or too low relative to the welfare optimum. The second view holds that diligence is determined in a maximising way, balancing the gains and pains of diligence in the economic realm. Cross-country data are studied in order to assess the two competing views. The econometric evidence indicates that it is the maximising view that can explain key aspects of the data.
Introduction
This study suggests a new way of looking at the connection between economic performance and well-being. Two key concepts of relativism help to locate this endeavour. The first form of relativism on which we draw is ‘hedonic relativism’ as argued by Easterlin (1974). Grounded in empirical analysis of income and survey-based happiness data from 19 countries, he reported what has become known as the Easterlin paradox: more income does not necessarily lead to more happiness. This finding has led to a lively exchange in the literature. While Easterlin stands by his position, others have made the point that income does systematically and positively affect happiness. 1 Easterlin’s explanation of this finding turns around the concept of an aspiration income that differs from country to country, and people feeling happier (less happy) if they make more (less) than the aspiration level.
The second pertinent relativism is ‘cultural relativism’. The notion of relativism in studies of cultures and people was emphasised by anthropologist Franz Boas (1887) and his students. It means that cultures can only be judged on their own terms, and that there is no objective standard of a good life. Cultures differ widely regarding how much time people spend producing the commodities for their daily needs as opposed to, for example, performing ritual dances, engaging in potlatch exchanges or magic rituals. 2 Taking the position of cultural relativism closer to the world of economics means that people in different societies vary in what they value and how they value it. Cultural traits and norms are primarily geared to sustaining a society’s practices. Whether these cultural specifications are supportive of an economy that focuses on the division of labour and market exchange is quite another matter. 3
The Outline of the Argument
The study developed here takes cultural variety as the starting point to explain international differences in per capita income and differences in the contribution of income to happiness. Our approach differs from studies that focus on productive versus counterproductive elements in cultures to explain the success of different countries or regions. 4 Instead, we build on the idea that producing goods, particularly highly valued goods, requires diligence. Painstaking effort, carefulness and perfectionism are needed to turn out high-quality goods and services. The downside of perfectionism and diligence is its psychological burden. On the level of the individual, the careful production of goods and services necessitates a high level of self-control and a willingness to spot and eradicate errors. On the level of the collective, the burden of producing with little error comes in various forms of organisational controls and feedbacks. I argue that the burden (disutility) from diligence and the utility from income are valued differently across cultures and countries. As will be shown, this notion has the potential to explain both differences in incomes across the world and differences in peoples’ valuation of additional income. Note that we will not trace aspects (or levels) of diligence as they relate to the production of marketable goods in different cultures. Rather, diligence is used as an umbrella term for cultural and organisational features of a society that help the production of high-quality goods at a cost of psychological burden.
Diligence has been identified as a key determinant for economic performance and economic development before (Heckman, 2000; Rindermann & Thompson, 2011; Weber, 1905[1958]). More specific descriptions of mechanisms that relate diligence to product quality and quality management can be found in a variety of sources: Summers’ (2014) study is a general reference giving a very detailed description of modern quality management. An example of a study of a specific region comes from Wacker and Sheu (1994) who point to the relevance of diligence in the Pacific Rim, a region that has lately experienced major advances in quality. For a study covering a particular industry, namely luxury hotels, see Sila and Ebrahimpour (2003). Examples of comparative studies of quality differences regarding the same output are Mason et al. (1994) on biscuits in various European countries, and Shemwell and Yavas (1999) on different hospitals. On the level of mechanisms, Borghans et al. (2008) focus on the notion that diligent workers need less supervision. Finally, diligence is omnipresent in the form of ‘due diligence’. This term refers to an operational (and actionable) level of thoroughness initially applied to financial services but currently much more widely used (Flyvbjerg, 2013; Manning et al., 2006). When turning to modelling in the third section, we will link diligence directly to quality. Thus, we treat this link as a one-to-one relationship, and we will sometimes use the term diligence/quality.
So much for the gains from diligence, and now we turn our attention to its burdens. Here, we have reports from many settings, concerning the pressures and hazards of performing on a high level: Holst et al. (2012) describe the pressures and stress symptoms among professional orchestra musicians. Mesagno et al. (2012) similarly describe the strain and anxiety of professional athletes. Smith and Witt (1993) compare occupational stress among university faculty members, while Delbridge et al. (1992) detail how modern management practices like total management control increase stress.
The key to making the described approach intellectually fruitful is to explore two competing hypotheses. The central question is whether or not the level of diligence in a society is set in a way to balance its benefits against its costs. One position would be that the level of diligence is a culturally determined variable with differences in cognitive styles, organisational traditions and religion as important determinants. According to this notion, these cultural forces have a life of their own and are not aimed at balancing positive output effects against the negative burden of the associated stress. This view is termed the hypothesis of exogenous diligence. The contrasting view holds that cultural practices have evolved to support (or be in agreement with) society’s preferences regarding the pros and cons of diligence. 5 According to this view, a society’s cultural practices are influenced by peoples’ preferences over the gains and pains of diligence. We call this the hypothesis of endogenous diligence.
It is obvious that the perspective developed here has links to the debate on modernism versus traditionalism. The debates between conflicting positions, either economic development bringing cultural change (Marx, 1867) or cultural values having an autonomous and enduring force affecting society in general and the economy in particular (Weber, 1905[1958]), make up an important strand in sociological thinking (Inglehart & Baker, 2000). This dualism also marks important lines of conflict in development studies, development policies and in the discussion of globalisation (Arnett, 2002; Nandy, 1981; Watts, 1993). If the approach developed here is to be judged on the background of the traditionalism– modernism debate, then it should be noted that it does not treat historical processes as being central. Rather, and in the tradition of economic theory, we focus on technology and preferences as the key elements.
The article is organised as follows: the third section outlines the model that will be used for the further analysis and as a guide for the empirical investigation. A neoclassical growth model illustrates how diligence affects the steady-state per capita income. A lack of diligence lowers effective output and thereby reduces consumption and investment. Defective goods are simply of no use in consumption and do not increase production capacity. A further element of the model is a preference function relating utility to income and diligence. This utility function helps to document key characteristics of the competing views regarding the determination of diligence. When diligence is endogenous (i.e., optimally chosen), a marginal increase in income leaves utility unchanged since the income increment necessitates a higher level of diligence. In the case of exogenous diligence, a country’s output level is typically either above or below that country’s optimum, which leads to the situation where an increase in income can either lower well-being or, alternatively, raise well-being.
In the fourth section, a stochastic version of the theoretical model is developed that can be used for working out the implications of the two competing hypotheses regarding the determination of diligence. In the fifth section, we stochastically simulate 10,000 economies in two versions according to the two hypotheses regarding diligence. These simulations provide the statistical implications that can inform the empirical investigation in the sixth section. In the sixth section, we study international cross-section data regarding per capita income and data from the World Happiness Report as a measure of utility or well-being. This section also draws on a measure of output quality from the research literature in order to assess the hypotheses put forward in this article. The findings suggest that cultural forces are, in fact, in tune with societies’ preferences regarding the benefits and the burdens of producing high-quality goods and services. However, we cannot rule out an element of exogeneity of culture with respect to the valuation of the gains and pains of diligence. The seventh section turns to international time series data on incomes and happiness to sharpen the conclusion regarding the two competing hypotheses. Based on time series estimates, we can make a stronger case for the maximisation hypothesis on the determination of diligence. The eight section concludes this article.
A Theoretical Model
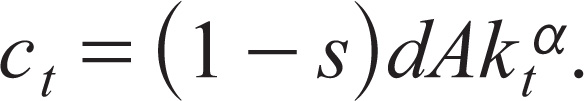
Here, we develop a model in order to clarify the points introduced before. The model is a variant of the neoclassical growth model. We have the standard production function that, for simplicity, comes in a Cobb–Douglas version. The variable y denotes the per capita output of goods, and k is the input of capital per worker:

Here, A stands for the state of available technology, and α is a constant. The only novel element is that only a fraction of output is usable. Given that we assume a one-to-one link between diligence (d, where 0 < d ≤ 1) and quality, the fraction of usable goods is d. That is, a fraction of 1 – d of all goods is defective and therefore is of no use. These faulty goods when directed towards consumption are equally useless as when, in the form of capital goods, channelled towards production.
6
Hence, the accumulation of workable capital goods is ruled by

Since only a fraction of goods produced is usable, the quantity of effective consumer goods is
The second element affecting well-being is disutility as a result of applying a high level of diligence. When taking these two determinants of utility into account, this can be specified as

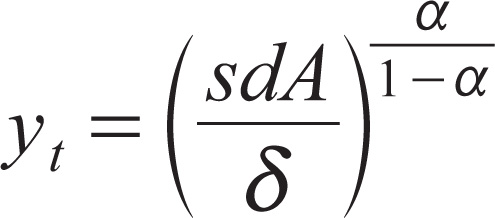
Utility is higher with a relative absence of the strain from producing at a high level of quality. Here, the parameter β captures the relative importance of consumption over the disutility of diligence. For our purposes, we will focus on the steady-state outcome, which for income is
Utility in the steady state is
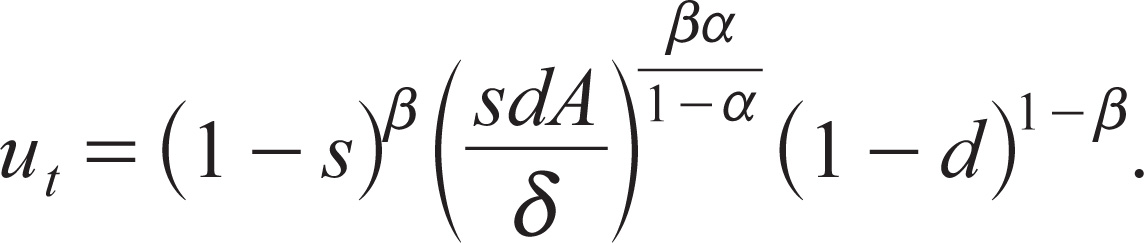
Figure 1 shows the utility maximum for two parametrisations, representing two different countries. We assume that both countries operate with the same technology. The display exemplifies outcomes consistent with endogenous diligence. The outcome A marks the optimal choice for a country where the burden of diligence is felt as a lesser burden than in country B. The β of country A is higher than the β of country B. This shows up in the indifference curves of country A (exemplified by the graph UA) as being flatter than the ones of country B (UB). With a view to the computations of the next section, the optimal level of diligence (denoted by d*) is
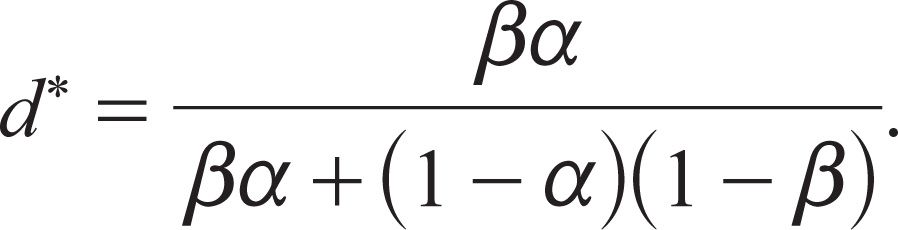
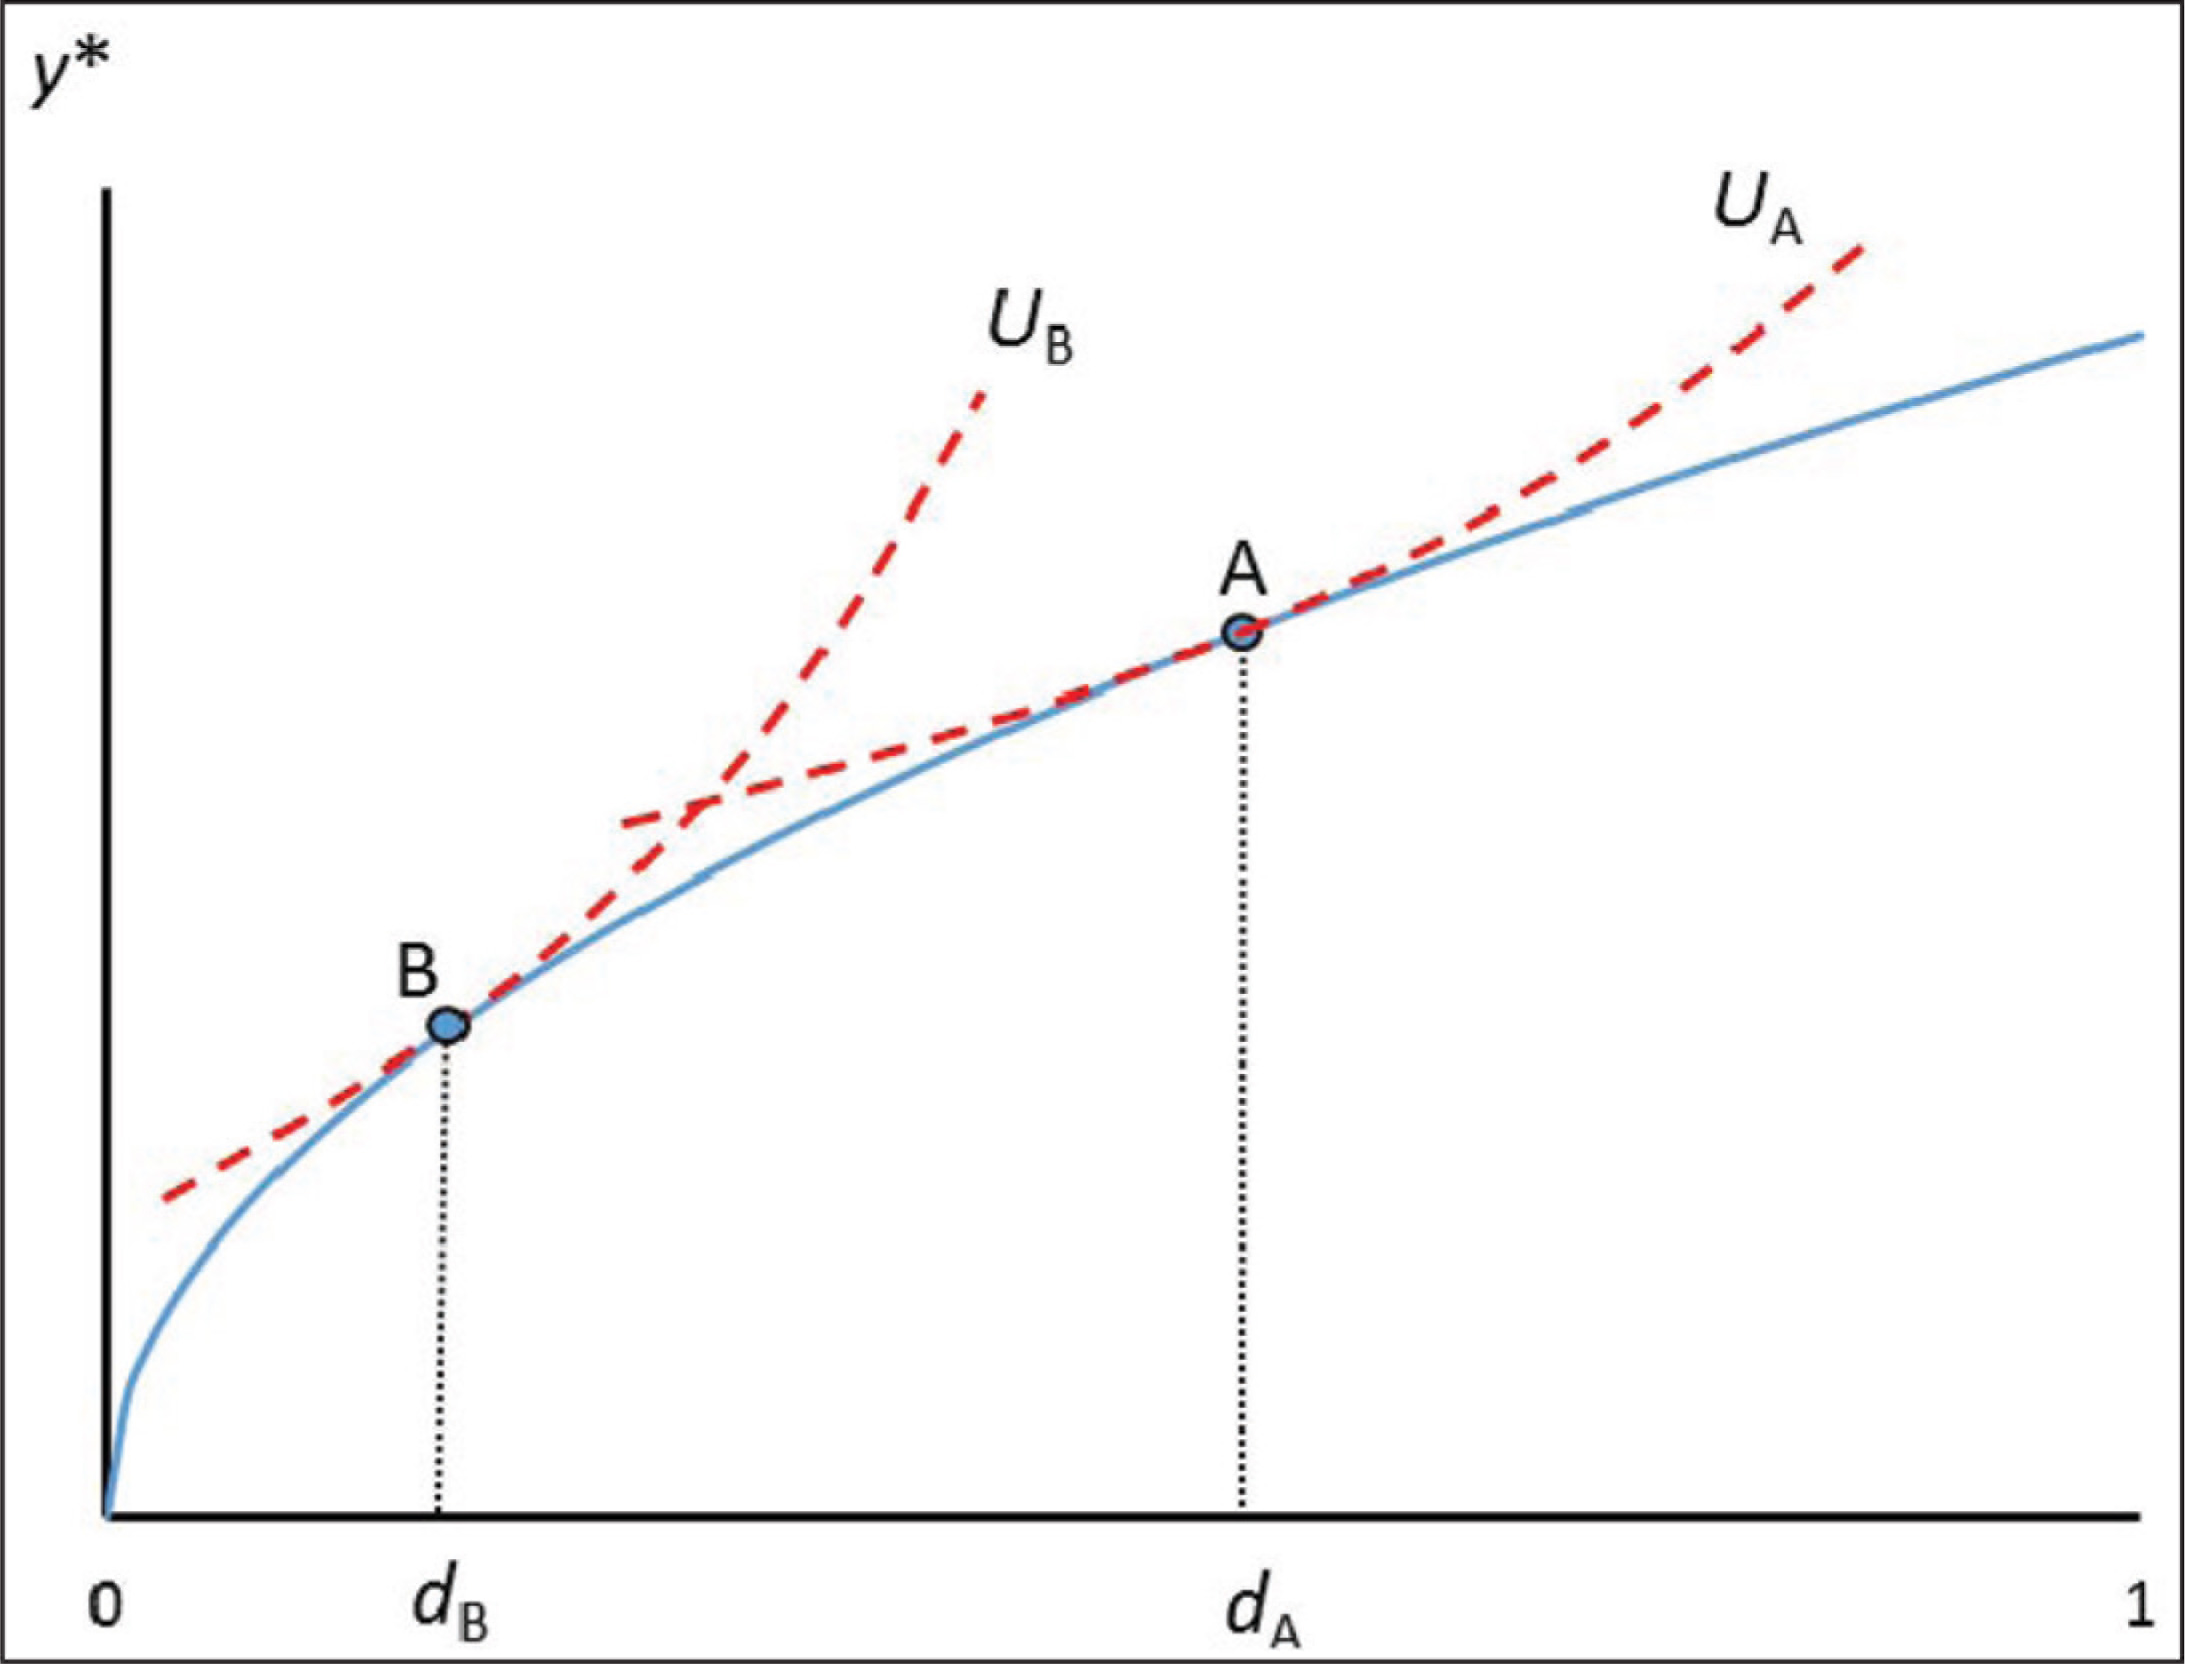
Clearly, country A generates a higher per capita income than country B as a result of its higher d. The derivative of d* with respect to β is positive, and Figure 1 illustrates this point. Societies where the burden of perfectionism is borne more easily tend to have (ceteris paribus) higher income levels. However, nothing warrants an ordering of the outcomes of these two countries since the preferences leading to A and B are not cardinal and not comparable. From this perspective, the income difference is the result of the described preferences. This is a first form of relativity: no judgement can a priori be made from different per capita incomes to happiness in different countries.
As discussed before, it is conceivable that the level of diligence is not at the level that maximises the utility of a country. Cultural forces, including some coming from abroad, may induce d to deviate from d*. Figure 2 displays such a situation. Here, country C operates at a level of d that is not chosen optimally. In this case, the level of diligence has been pushed beyond the utility maximum with a choice at C instead of C*. Utility at C (i.e., U) is lower than at C* (U*). Likewise, one can think of cases where culture ‘locks in’ a level of diligence below the value that optimally balances its benefits and costs. Figure 3 shows such a case denoted by D. Figures 2 and 3 give the essence of the exogeneity hypothesis regarding the determination of diligence.
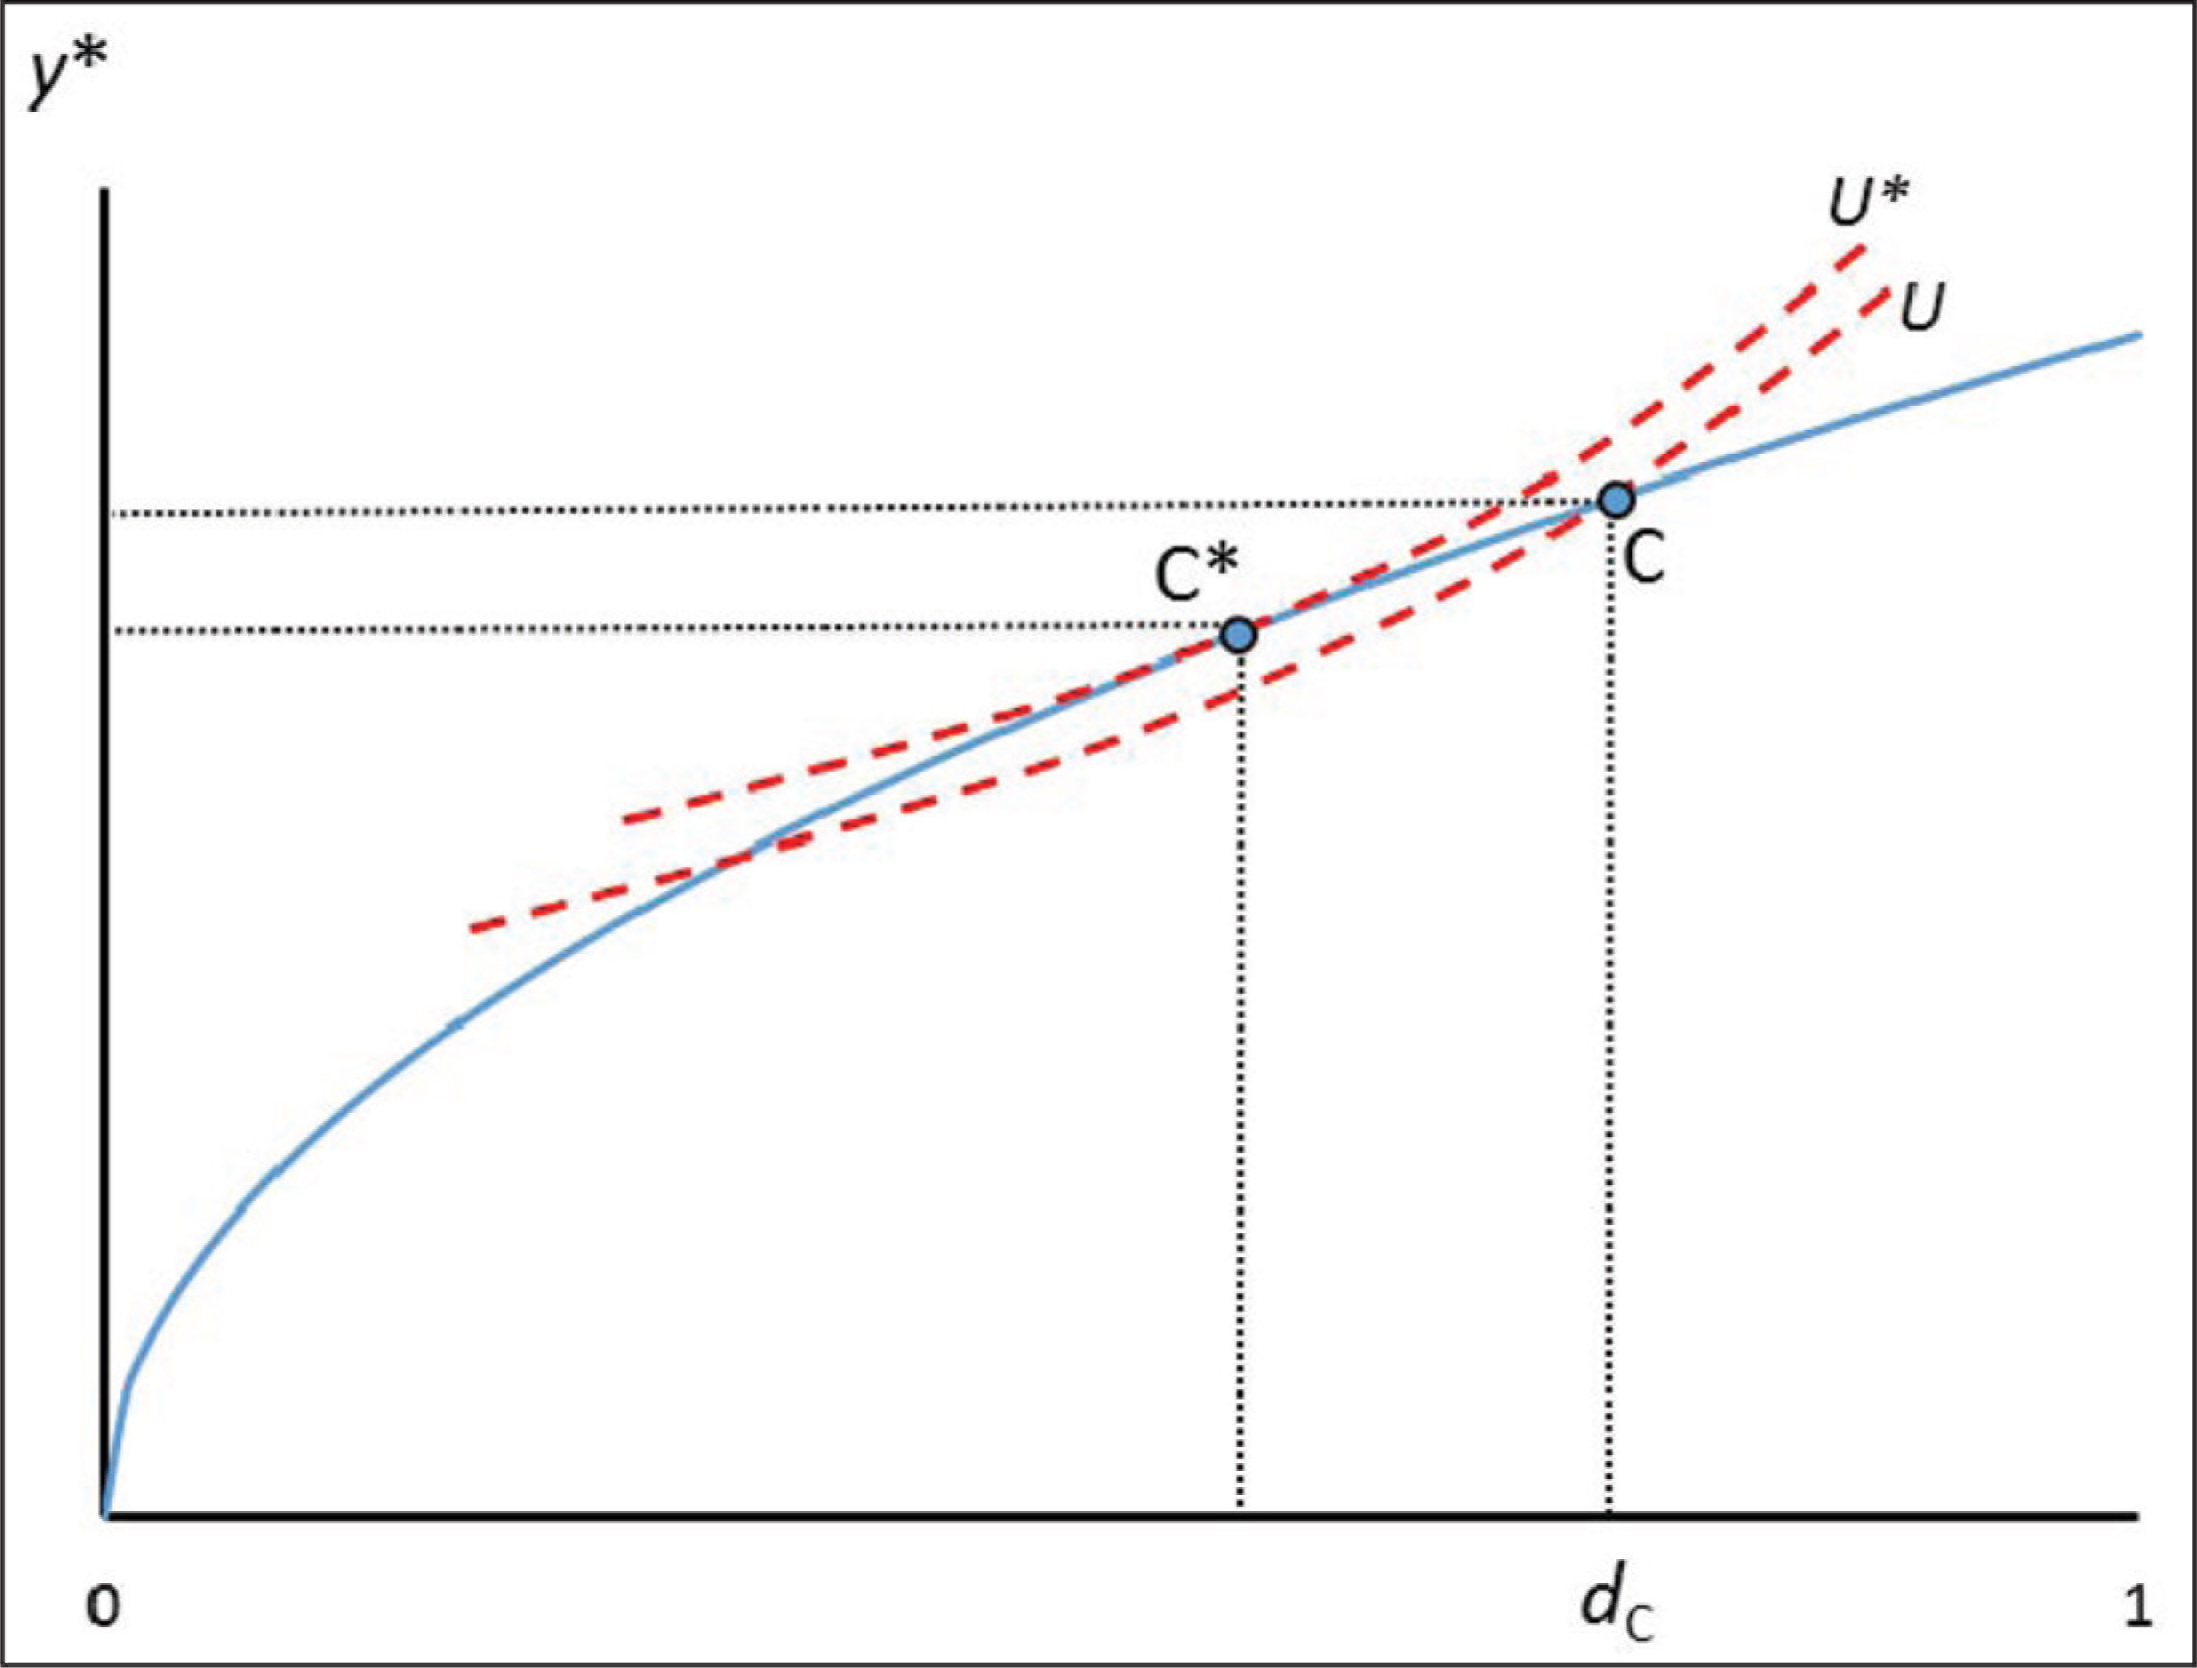
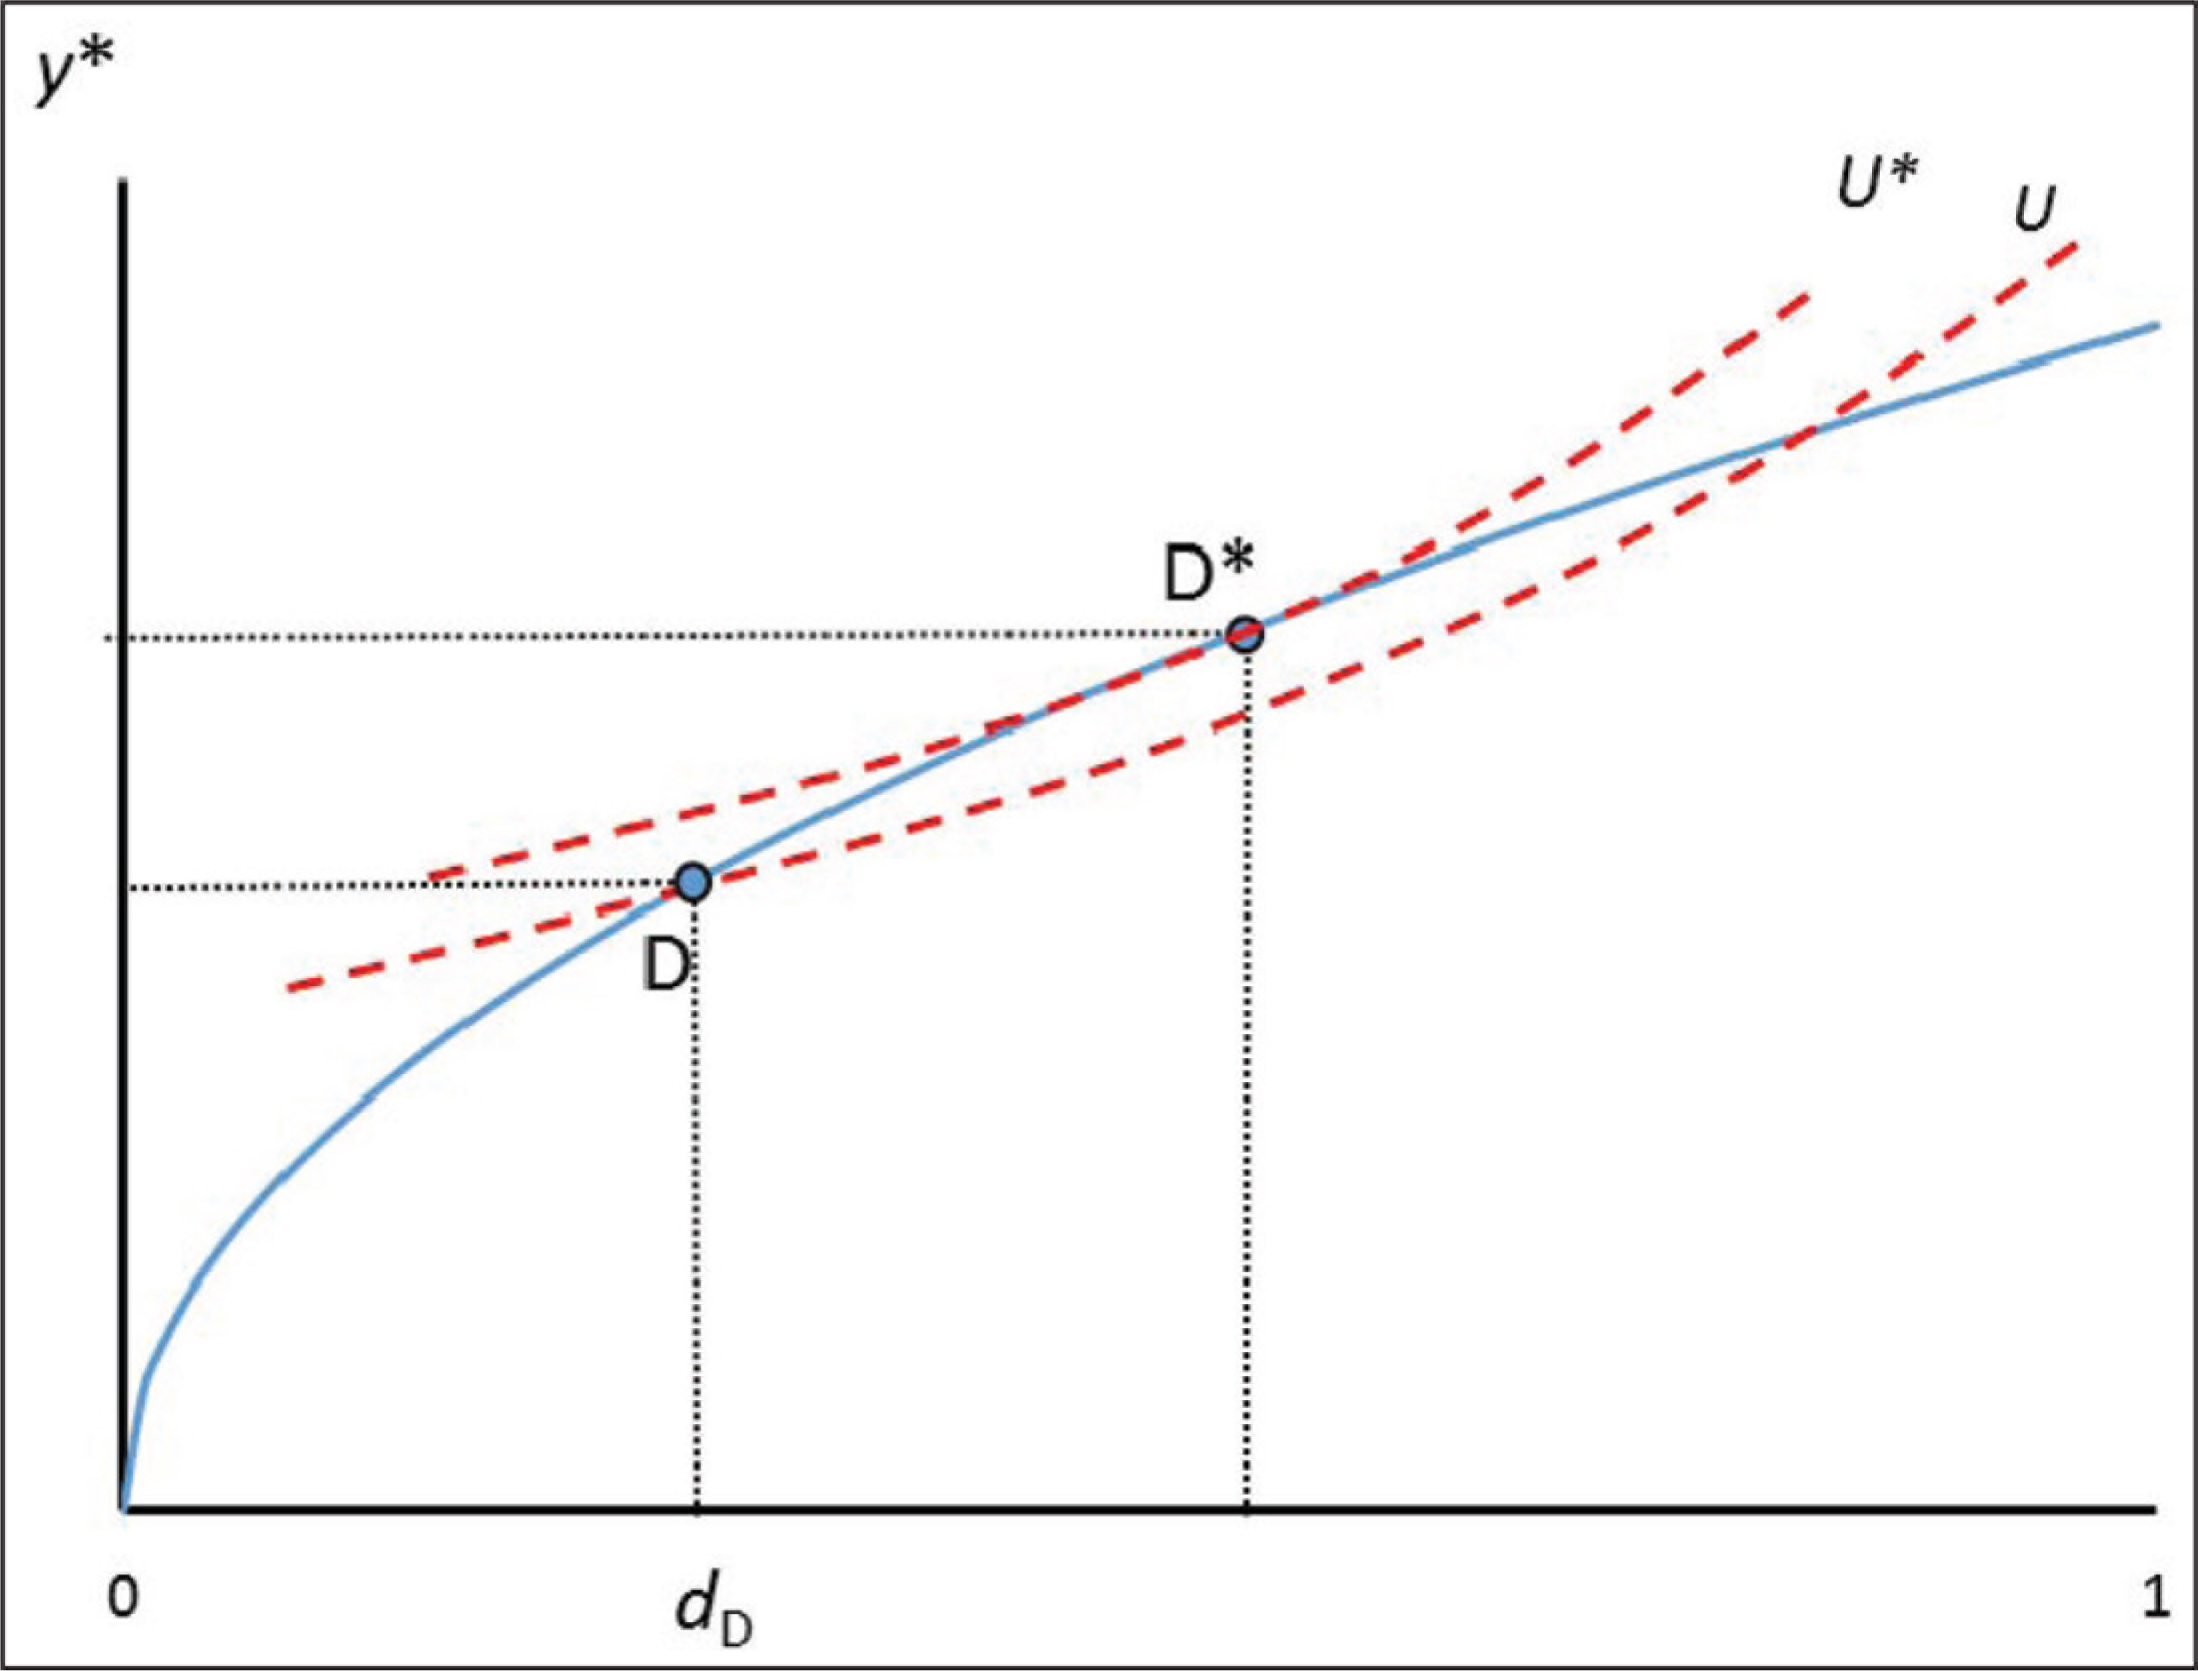
Summing up, if countries’ levels of diligence are chosen so as to reflect the preferences over the effort to produce quality and output, then we should see the situation displayed in Figure 1. By contrast, if the choice of d is independent of the described preferences, then Figures 2 and 3 capture typical situations. 7 The next section describes the probabilistic version of our model that draws out the implications for the joint distribution of diligence/quality, income and utility.
Competing Views on the Determination of Diligence
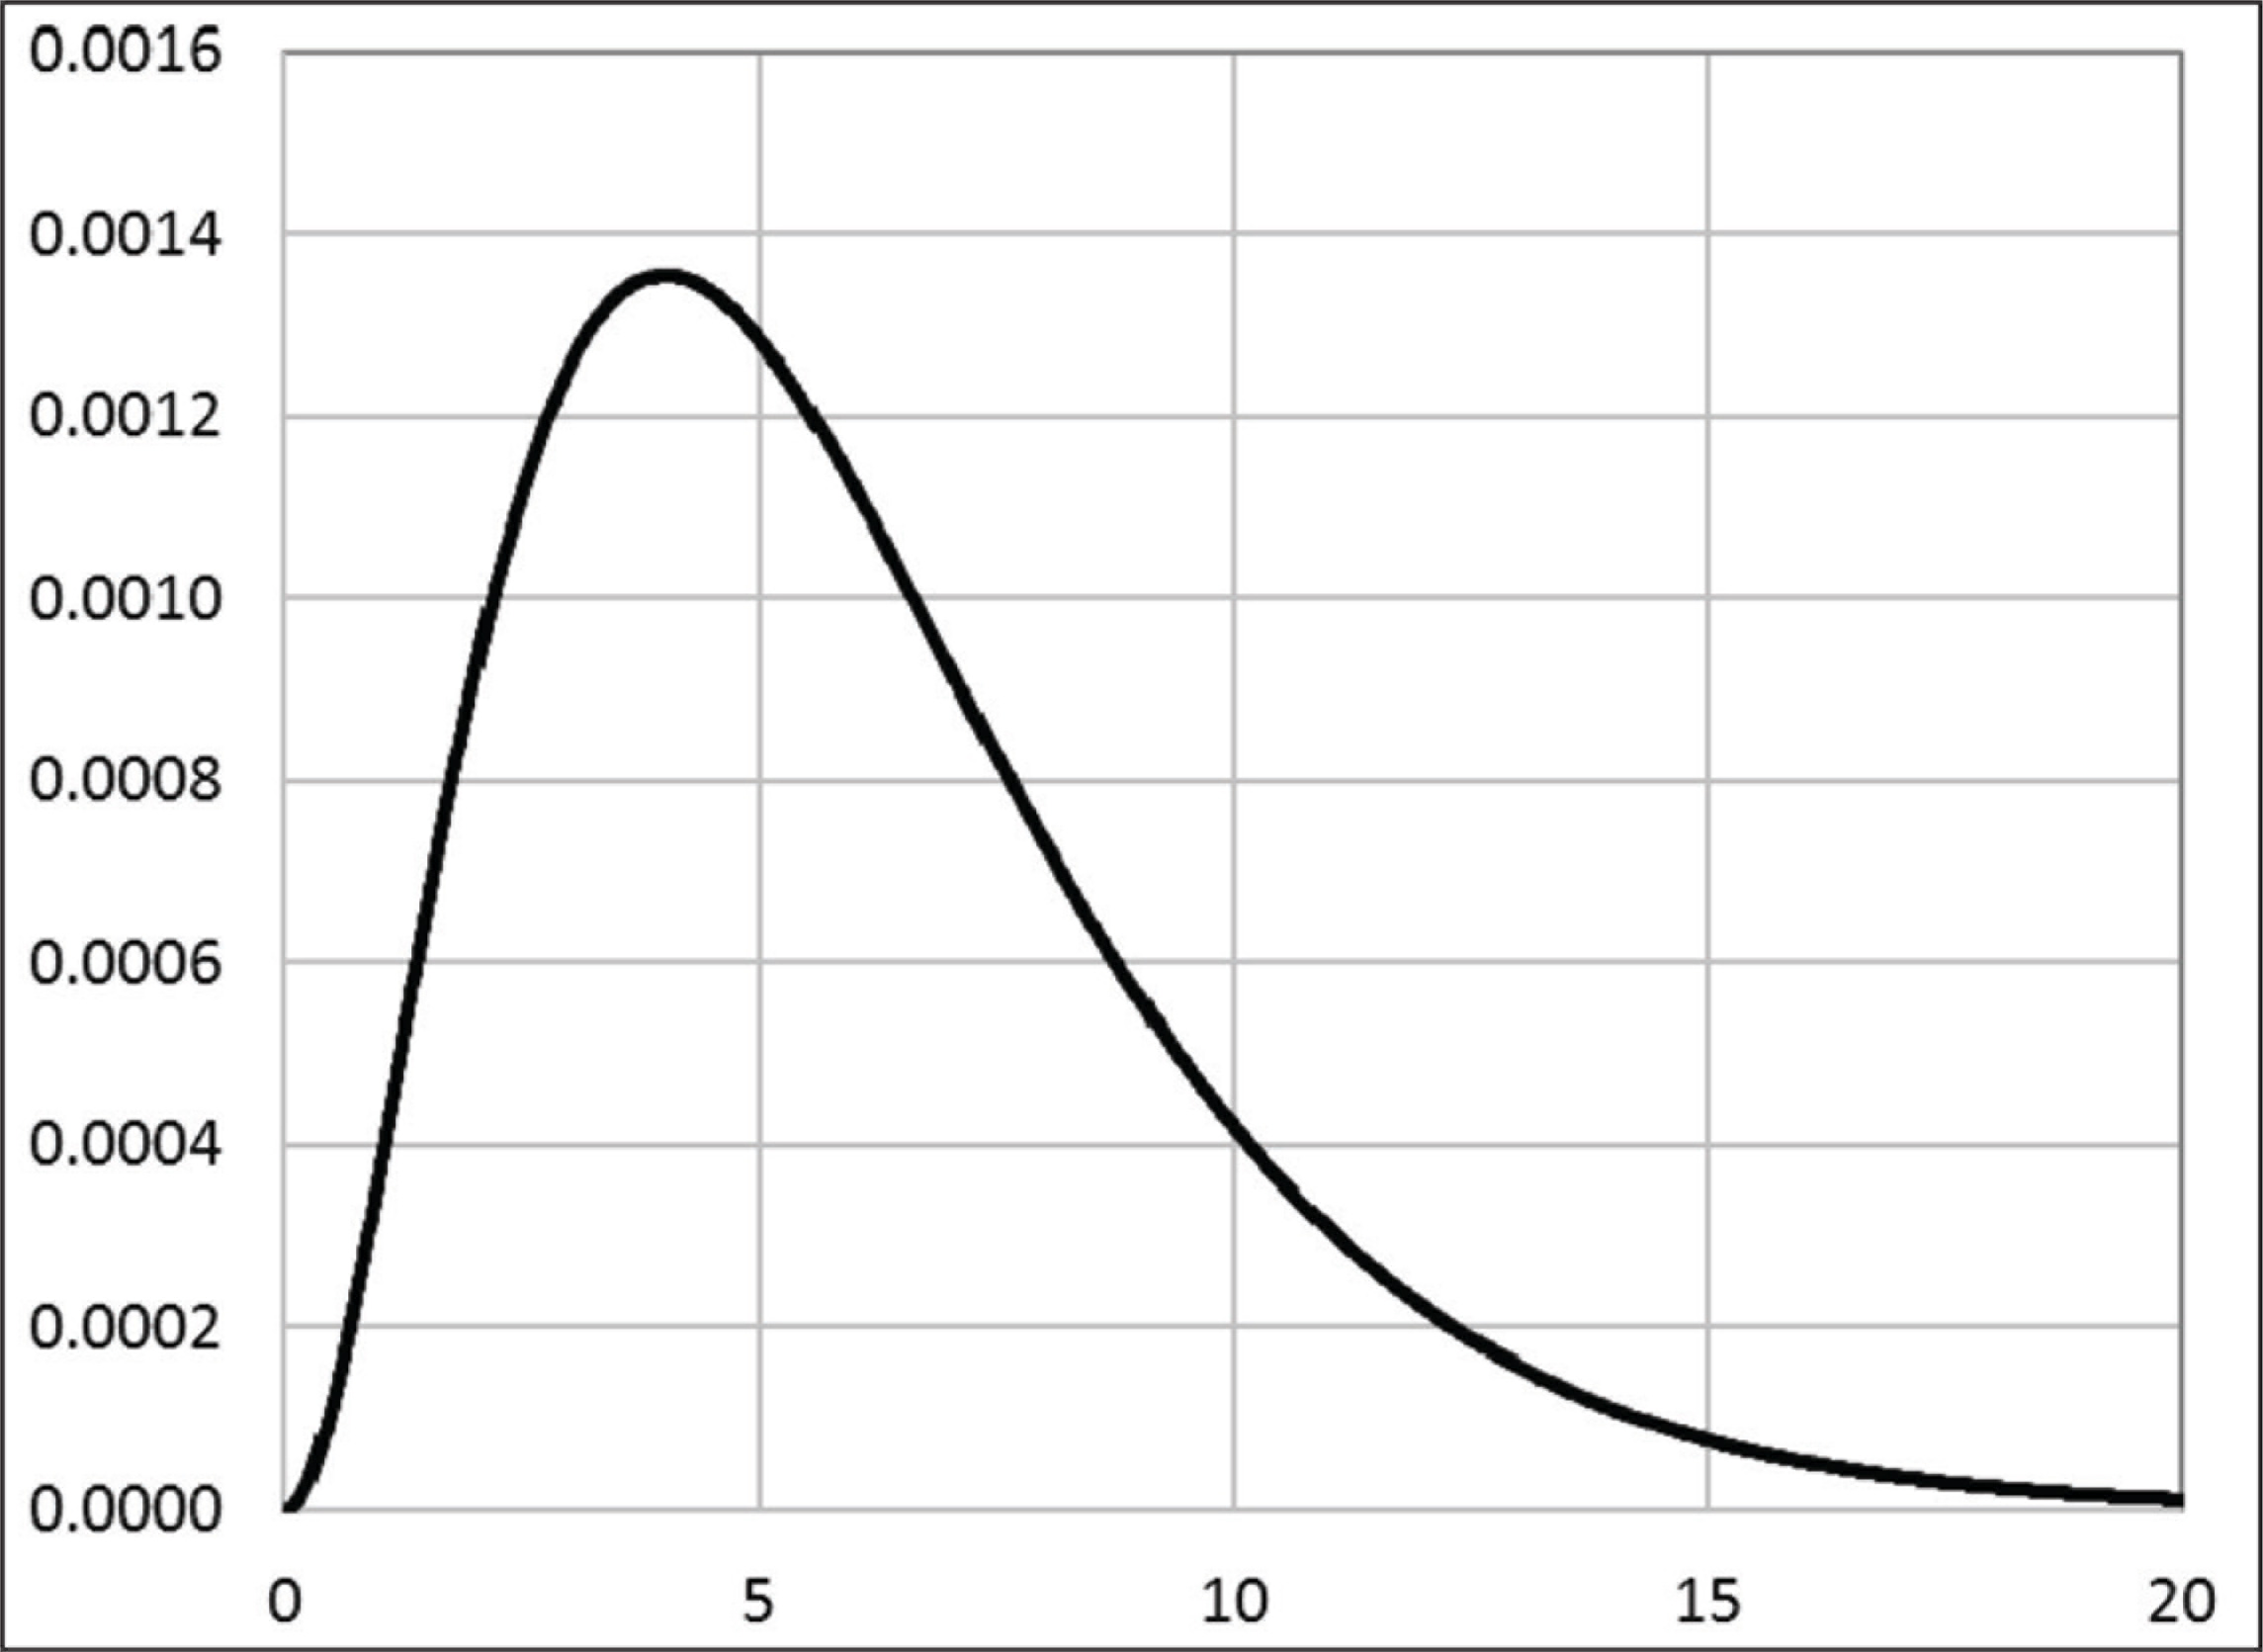
In order to assess the possible co-movements among d, y and u, we need to extend the theoretical framework into a model that can be used for stochastic simulations. For this purpose, we make explicit several further elements. The new elements are required to generate a set of artificial economies with different preferences and different levels of diligence and output. One new element used for simulating a diversity of economies is the assumption that the production function differs across countries. This is captured by the technology factor A. In order to generate data of simulated economies, this factor A will be sampled from a Gamma distribution. The Gamma distribution is a two-parameter probability distribution over the interval of 0 to infinity with a positive skew. The second element concerns the level of diligence d. Note that the two hypotheses described have differing implications: If (according to the exogeneity hypothesis) the level of diligence is independent from the preferences over consumption and diligence, we let d be chosen randomly from a Beta function to be detailed later. The Beta distribution is a two-parameter probability distribution over the interval of 0 to 1. It can have a positive or a negative skew, or it can be symmetrical. By contrast, if (according to the endogeneity hypothesis) the level of diligence is the outcome of an optimisation process concerning the trade-off captured in Equation (6), then d is not a parameter. Instead, it is the optimised level of diligence as expressed by Equation (7).
Stochastic Simulations
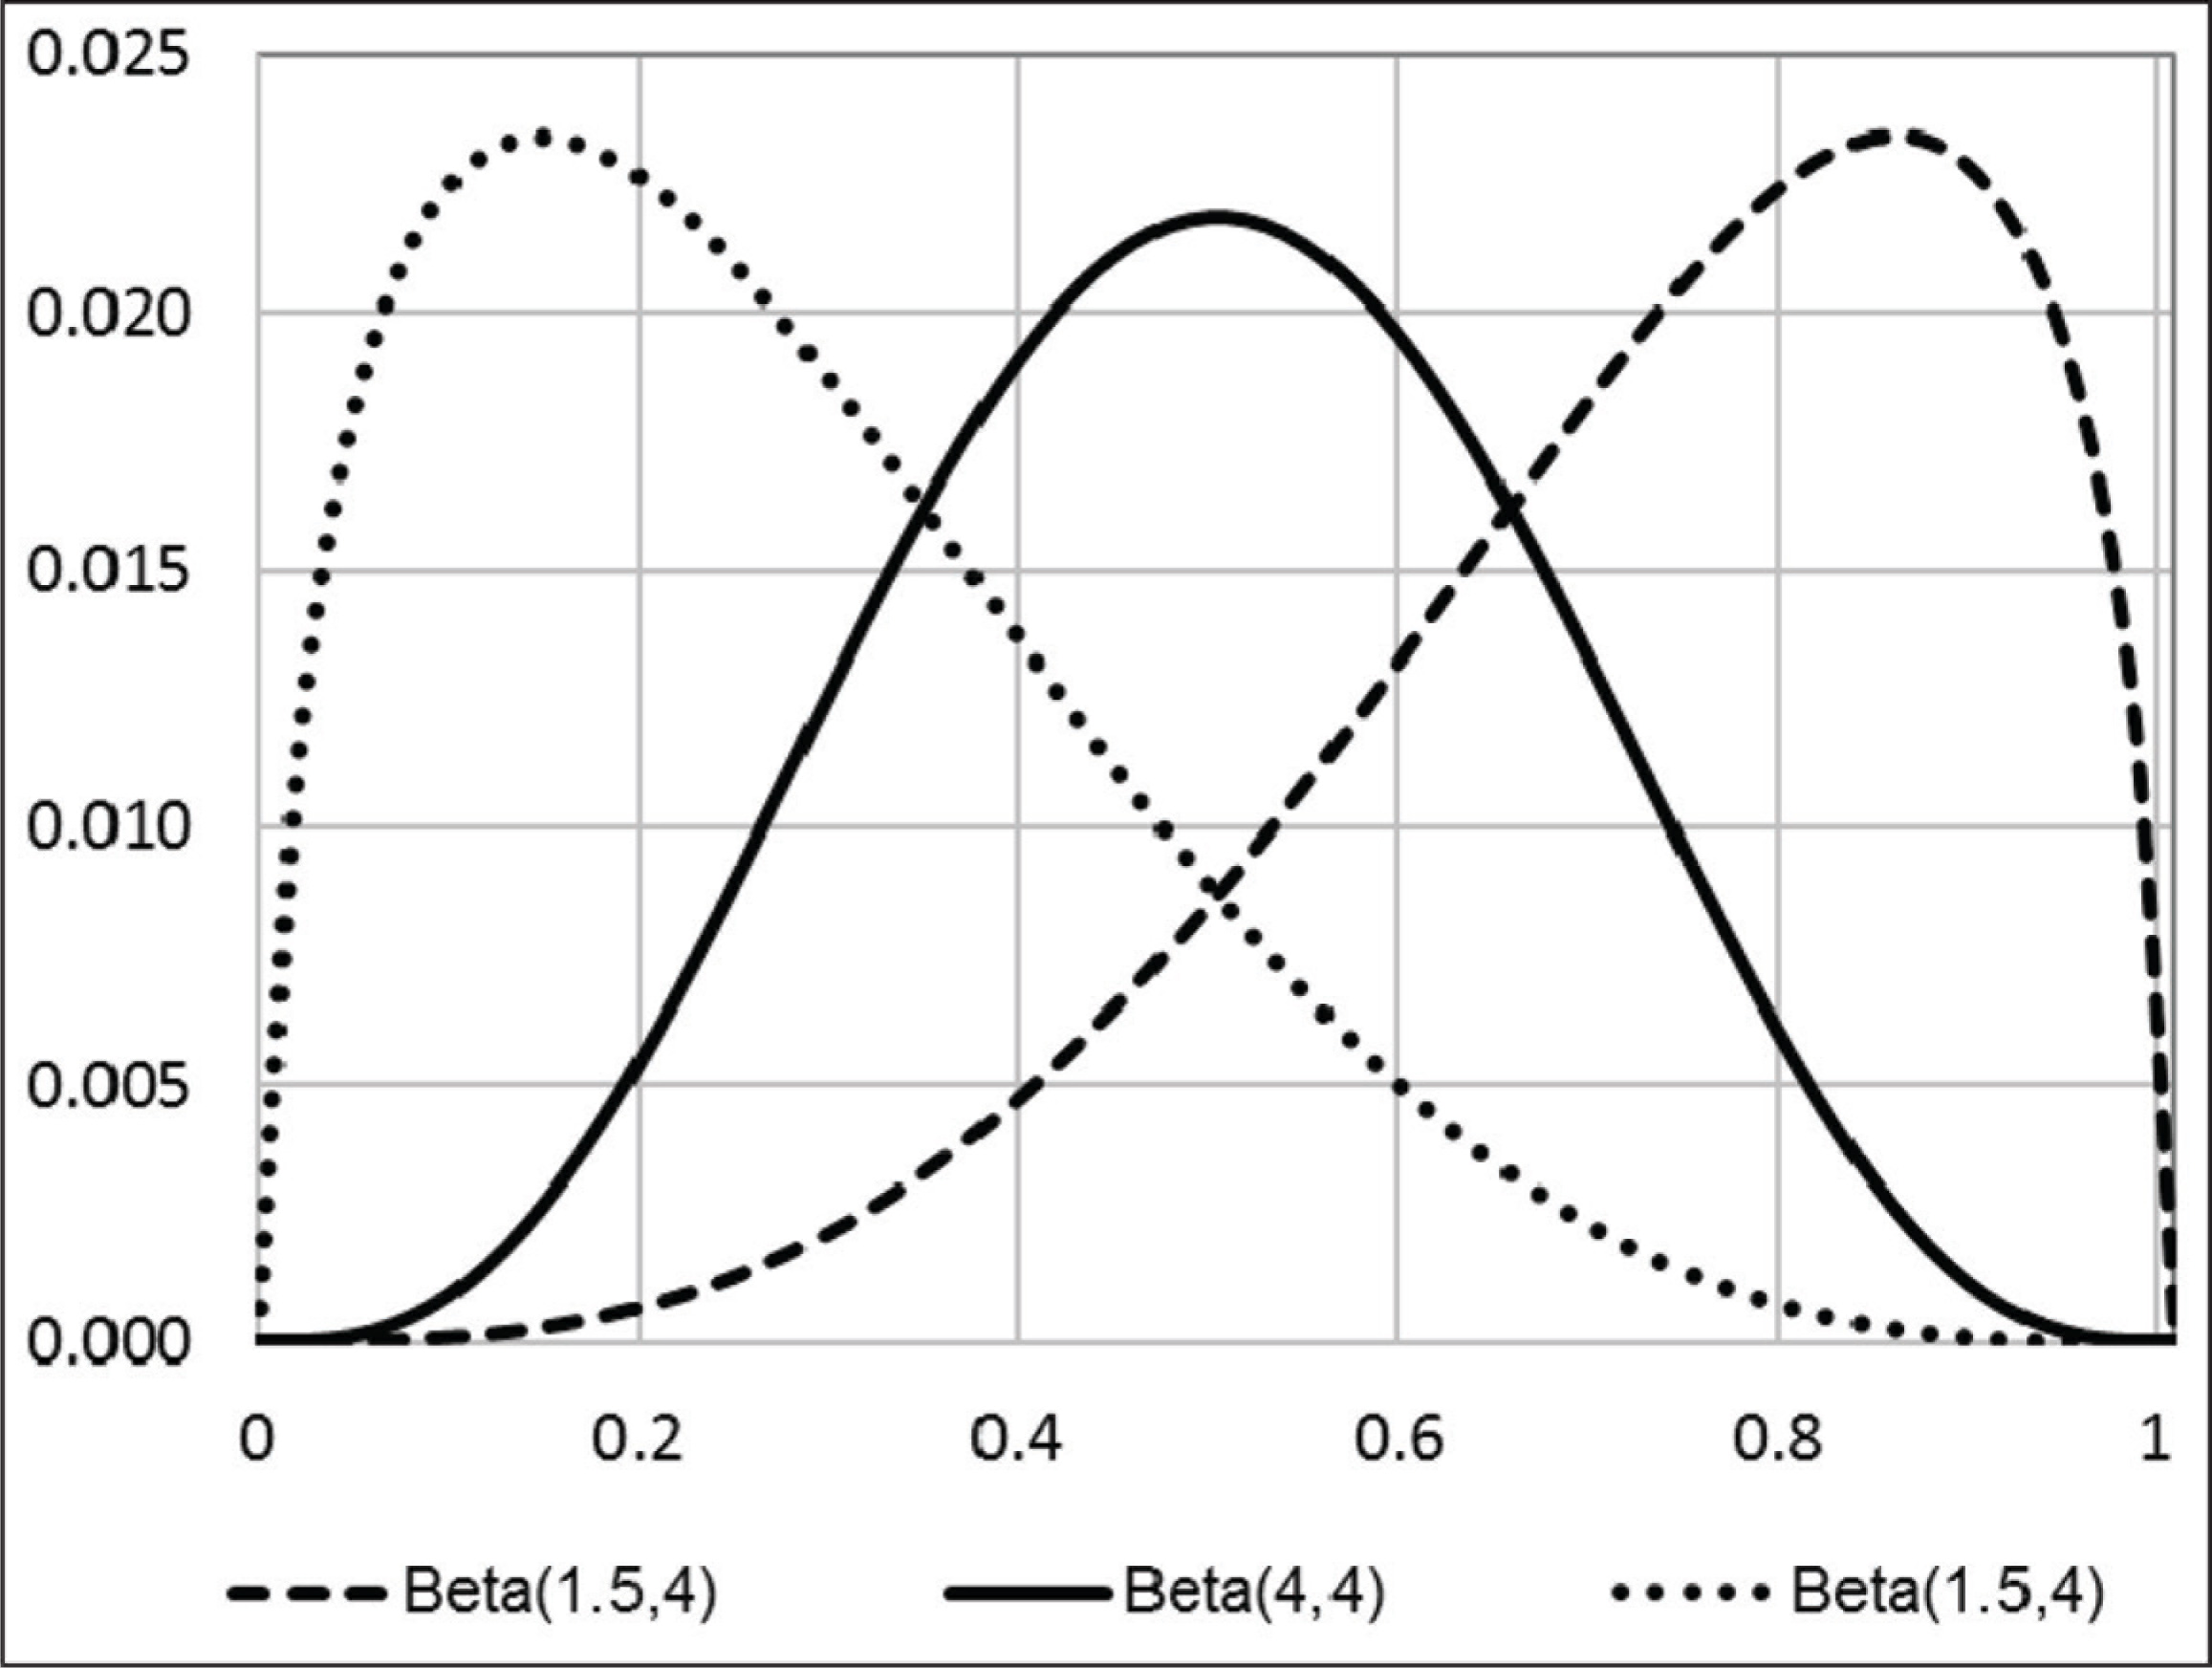
The following reports the results from simulations under the two competing scenarios concerning the determination of d. In each case, we draw 10,000 sets of parameters and compute the associated outcomes. With such a large number of draws, the outcomes to be presented in the form of regression coefficients are largely independent of randomness. Consider in detail the various distributional assumptions used in the simulations. Take, first, the distribution of the technology parameter A. The function chosen to generate the distribution of the A term comes in just one parametrisation, that is, Gamma (3.2), and it is displayed in Figure 4. 8 Turning to the distributions of β and for d (in the case where diligence is exogenous): for each of these two probability distributions, we present three different parametrisations of the Beta function. One distribution is left-skewed, one is symmetrical and one is right-skewed. Figure 5 shows the different versions of the Beta probability distribution. 9 Summing up, we generate 10,000 artificial economies, each of them in two versions. The elements in common to the two versions are the technology parameter and the preference function. The difference between two versions of the same economy only concerns the determination of d. In one version, the endogeneity case, d is chosen optimally, and in the other variant, it is chosen exogenously, that is, randomly.
The resulting data are now analysed by way of regressions that link the log of utility of each simulated country to the log of income and to the log of the level of diligence. It is obvious that endogeneity issues have affected this sort of estimate. However, identification of parameters is not the purpose of our estimates. Rather, we intend to work out key qualitative aspects of the relationship between utility, income and diligence. In the simulated data, this relationship is analysed by way of the following regression equation

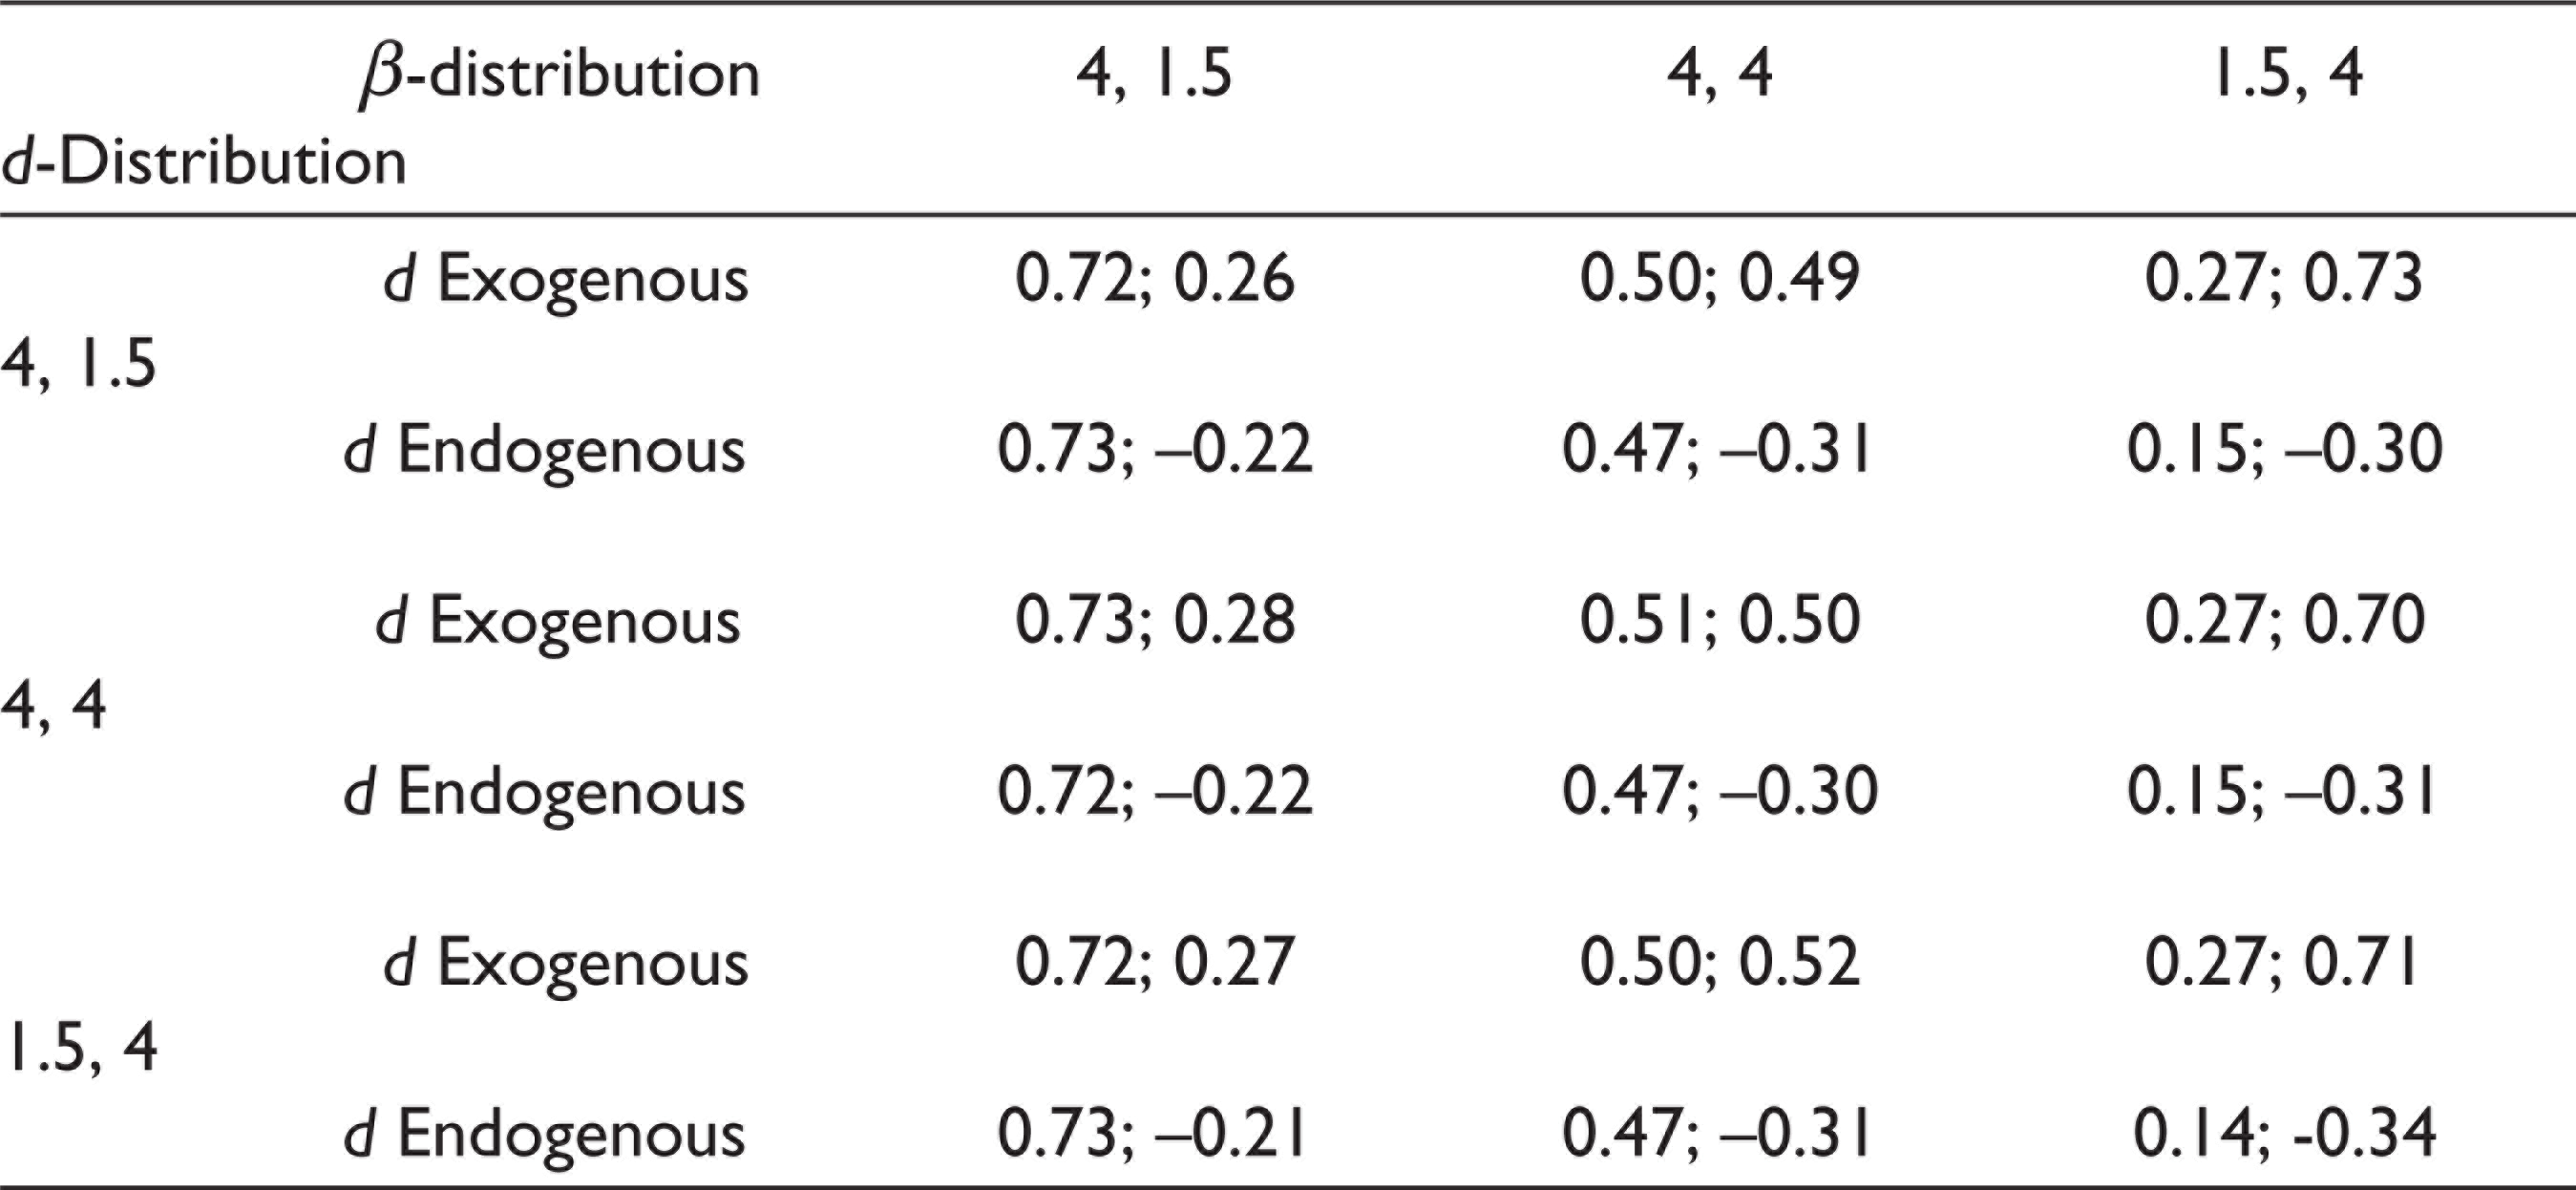
Table 1 shows regression results in the form of the estimated coefficient for ln(y) and for ln(1 – d) in the nine combinations of the two probability distributions for β and d. The first insight is that with an exogenous d, both estimated coefficients are always positive. 10 By contrast, with an endogenous d, the estimated coefficient for ln(1 – d) is always negative. This latter point is important for the empirical analysis in the next section. It basically states that with an optimally chosen level of diligence, the estimated effect seems to be paradoxical: an increase in diligence appears to increase utility. Yet, before turning to empirical data, this finding has to be scrutinised further.
It would be premature to take this finding to be the basis for a test between the two competing hypotheses. So far, we have merely worked with two polar views about the determination of diligence. Under the endogeneity hypothesis, diligence is optimally chosen, while, under the exogeneity hypothesis, it is randomly chosen. Suppose now that the truth lies between these polar cases. What results, by contrast, when d tends to its utility optimal value yet still deviates from it? Consider the outcome when, indeed, forces exist that push diligence in the direction of d*, but there are also counteracting forces that induce a divergence (positive or negative) between d and d*. This extension can be built into the simulations by having d be a linear combination of its optimal value and a randomly chosen value. More specifically, we introduce the parameter θ (ranging between 0 and 1) as a measure of the relative importance of the endogenous (maximising forces) over the exogenous, random elements determining d.
Regression Coefficients (γ1; γ2 ) for Simulated Data for Various Parametrisations for β and d
Regression Coefficients for Simulated Data for Different Values of θ
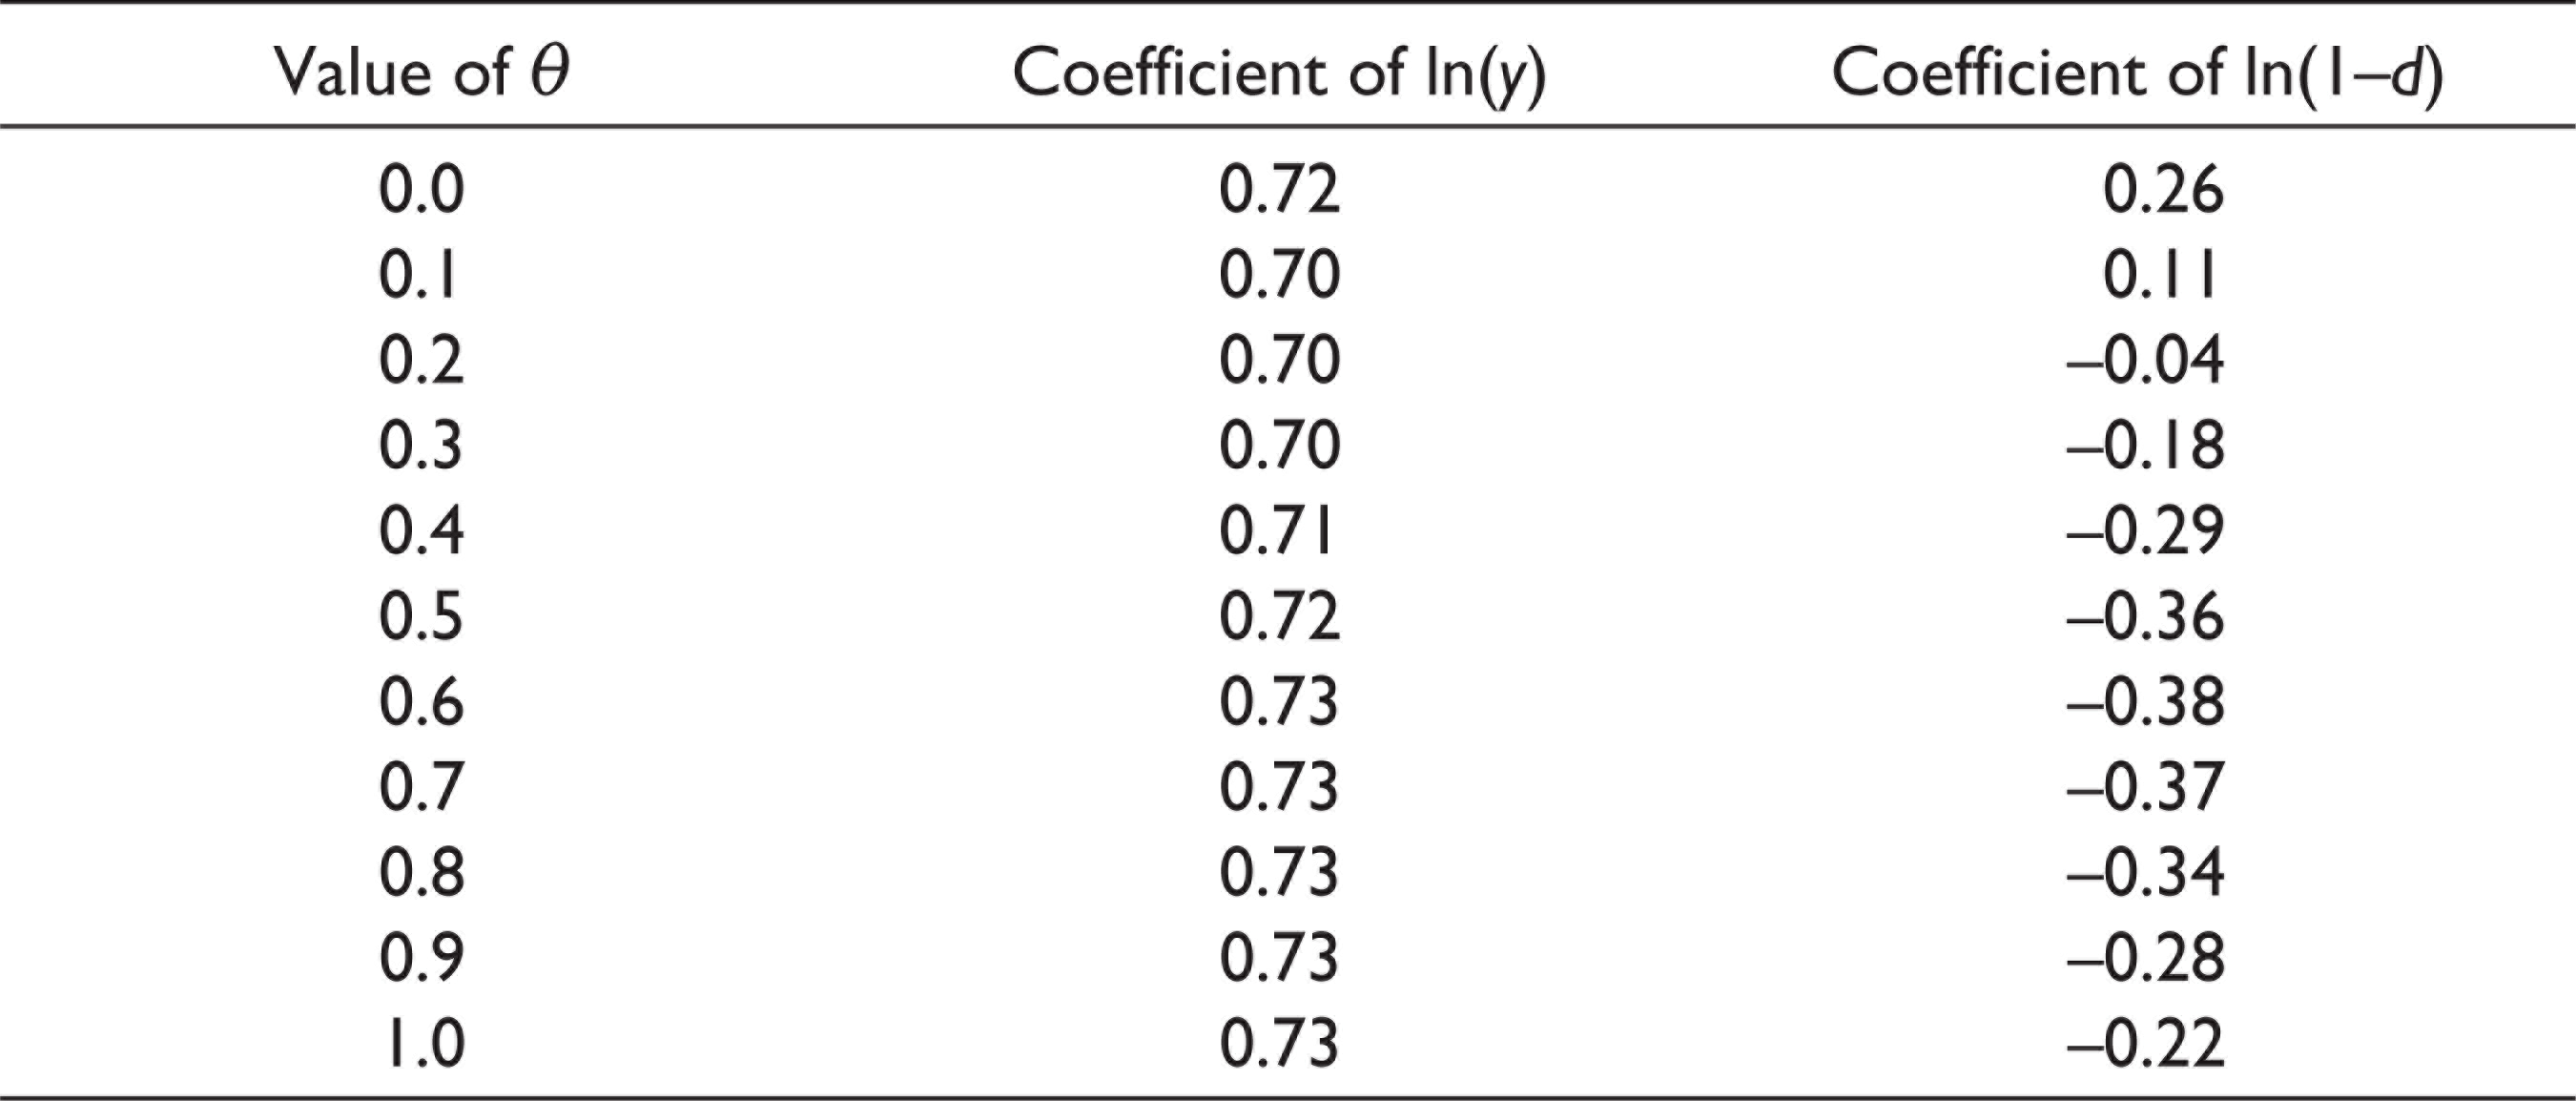
In order to illustrate the effects of these intermediate cases regarding the determination of d, we take one particular combination (both left-skewed) of distributions for β and d. This combination fits well with the empirical distribution of d, more specifically its counterpart quality, to be discussed in the sixth section. Table 2 documents how the estimated coefficients of ln(y) and ln(1 – d) vary as the value of θ is increased in steps of 0.1 from 0 to 1. These results indicate that a positive correlation of utility and d does not require diligence to be fully determined in a maximising fashion. In fact, it takes a relative low level of θ to make the estimated coefficient turn negative. The value 0.13 marks this threshold for the particular parametrisation of the model used here. Hence, a negative regression coefficient will result even when d is markedly less affected by forces working towards maximisation than by random (cultural) forces. Further, the numbers in Table 2 show that the highest effect is not generated with an θ = 1, but, instead, with a value of θ = 0.62. These insights will be relevant when assessing the regression estimates in the next section.
Analysis of International Cross-section Data
This section assesses empirically the two hypotheses on the determination of the level of diligence. For this empirical investigation, we use international data to investigate the relationships developed. As stated before, we do not study the link between diligence and quality. Instead, we assume a direct link and, thus, when working empirically, draw on data of quality in manufacturing from a cross section of countries. For the empirical study, we use data on international quality levels in manufacturing that have been estimated and compiled by Hallak (2003). His data on product quality cover 52 countries. Hallak’s measure is derived in an indirect way, based on differences in international prices for comparable goods. Although this approach may have its shortcomings, it appears to be the only relevant data set available.
11
For the measure of utility, we rely on data from the World Happiness Report of the United Nations (Helliwell et al., 2017). Further, real per capital GDP (purchasing power parity adjusted, also from the World Happiness Report) is used as the income measure. So, what could be done with these data? I first propose to estimate a relationship between quality and output. The following presents the regression result for this relationship:
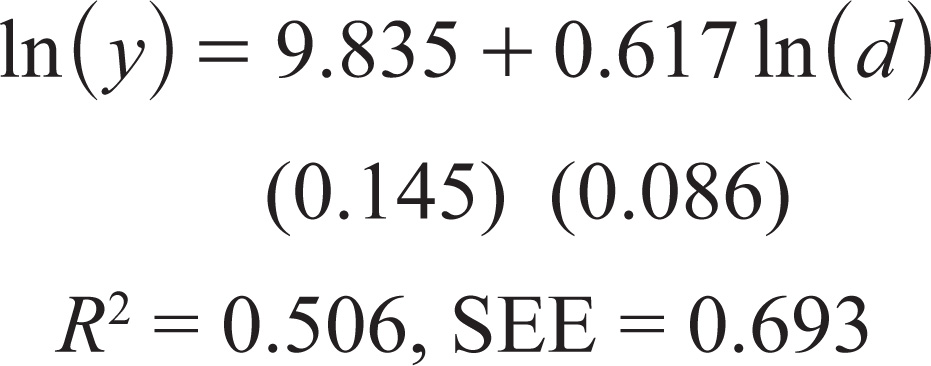
As it turns out, the estimated parameter for the quality variable is, indeed, smaller than one and not significantly (p-value 0.18) different from 0.5, which is the value predicted by Equation (5) and based on the α value of a third typically used in the literature.
Next, we address the links between countries’ levels of happiness, their per capita income and the level of output quality. For this purpose, we specify four different specifications. The general form of this relationship is
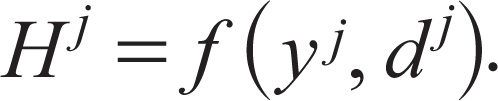
We do not want to make the assumption that the happiness measure (the so-called life ladder measure) has all the common characteristics of utility. Hence, we leave open whether the estimated relationship should have the log of happiness indicator, or happiness as such, as the left-hand variable. Moreover, we offer different specifications with respect to the d variable. In one set of estimates, this variable is 1 – d. This specification conforms to the utility function (6). That is, less diligence should, ceteris paribus, lead to a higher level of happiness. In the other version, allowing for a non-linear effect, the term log(d) is introduced. Clearly, in this configuration, the utility function would suggest a negative coefficient. In any case, the coefficients of 1 – d and log(d) in two otherwise identical specifications will have the opposite sign. Note, that this variable has been standardised here to be one for the country (Switzerland) with the highest level.
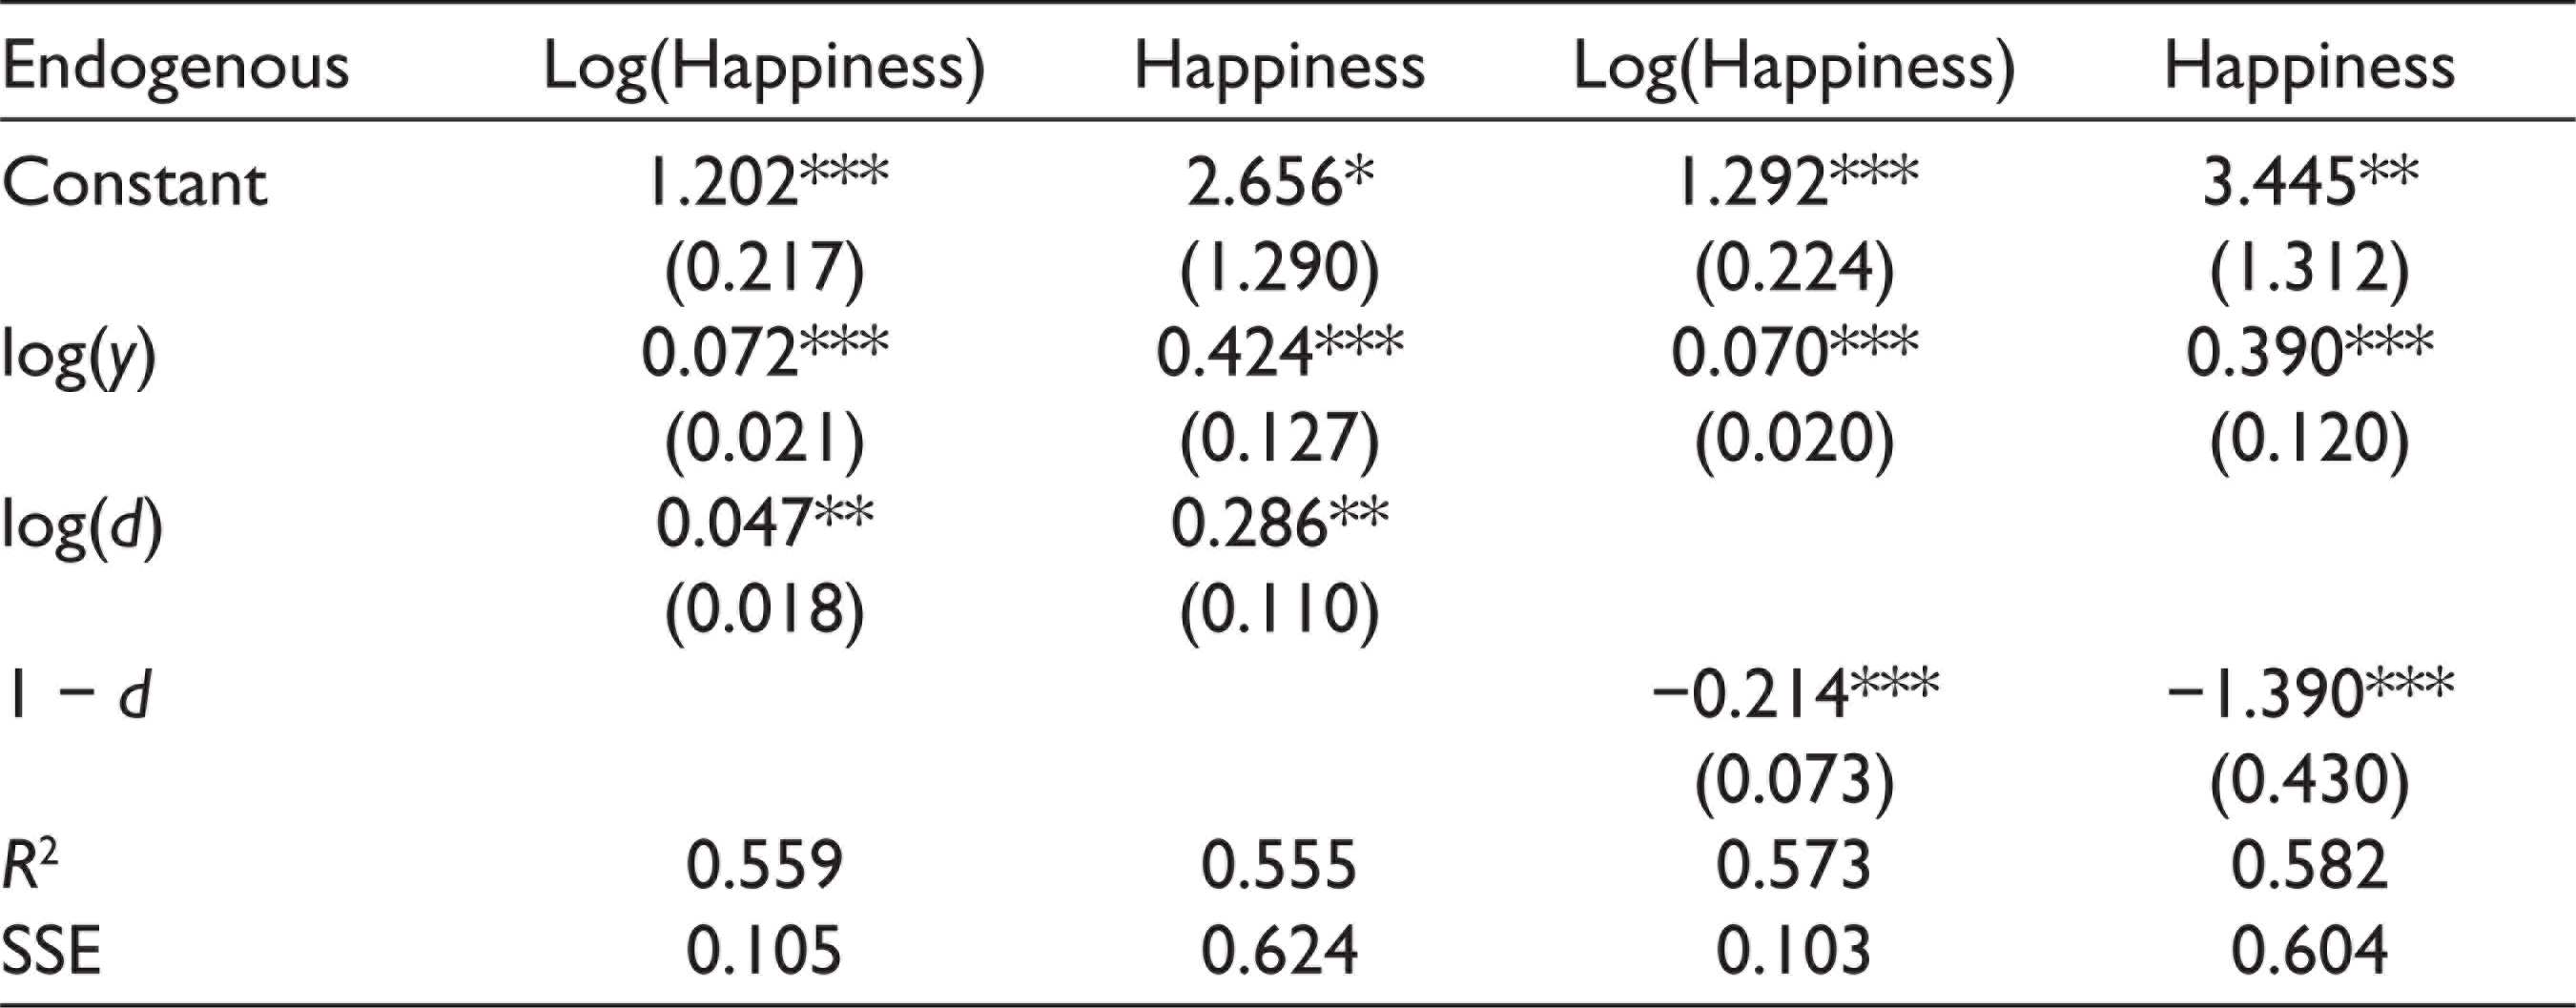
Table 3 documents the regression results. All relevant coefficients are significantly different from 0 at the 5% level of significance and in most cases even at the 1% level. The two first columns of Table 3 report the results with the log of per capita income and the log of quality as explanatory variables. The first column shows the case with ln(y) as endogenous variables, and the second column presents the case with the measure y. The third and the fourth column have ln(d) instead of 1 – d. In all our specifications, the general results are the same. Income has a clear positive effect on happiness. The estimated coefficient of the ln(y) variable indicates in all cases that higher income leads to positive but declining increases in happiness.
For both the specification with ln(d) as well as the one with 1 – d, the estimated effect of d on happiness is positive. This finding is in line with the endogeneity hypothesis, suggesting that there are forces that drive d in the direction of its utility-maximising level. As indicated in the sixth section, we cannot assess whether the forces of maximisation dominate the exogenous forces. Recall from the sensitivity analysis of Table 2 that even a modest influence of maximising forces generates the empirically documented effect. In this situation, the next section presents an additional empirical approach for assessing the exogeneity and endogeneity hypotheses.
Regression Results Relating Happiness to Per Capita Income and the Measure of Quality
Evidence from Individual Country Estimates
This section takes the empirical analysis to time series of data of individual countries. More concretely, we look at the connection between changes in income and happiness across countries in the data set of the World Happiness Report. The econometric analysis is conducted with all countries for which at least 8 years of data for real income and for the happiness measure are available. The following regression is estimated:
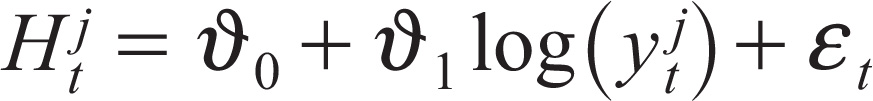
The term
Country List with Different Effects of Income on Happiness
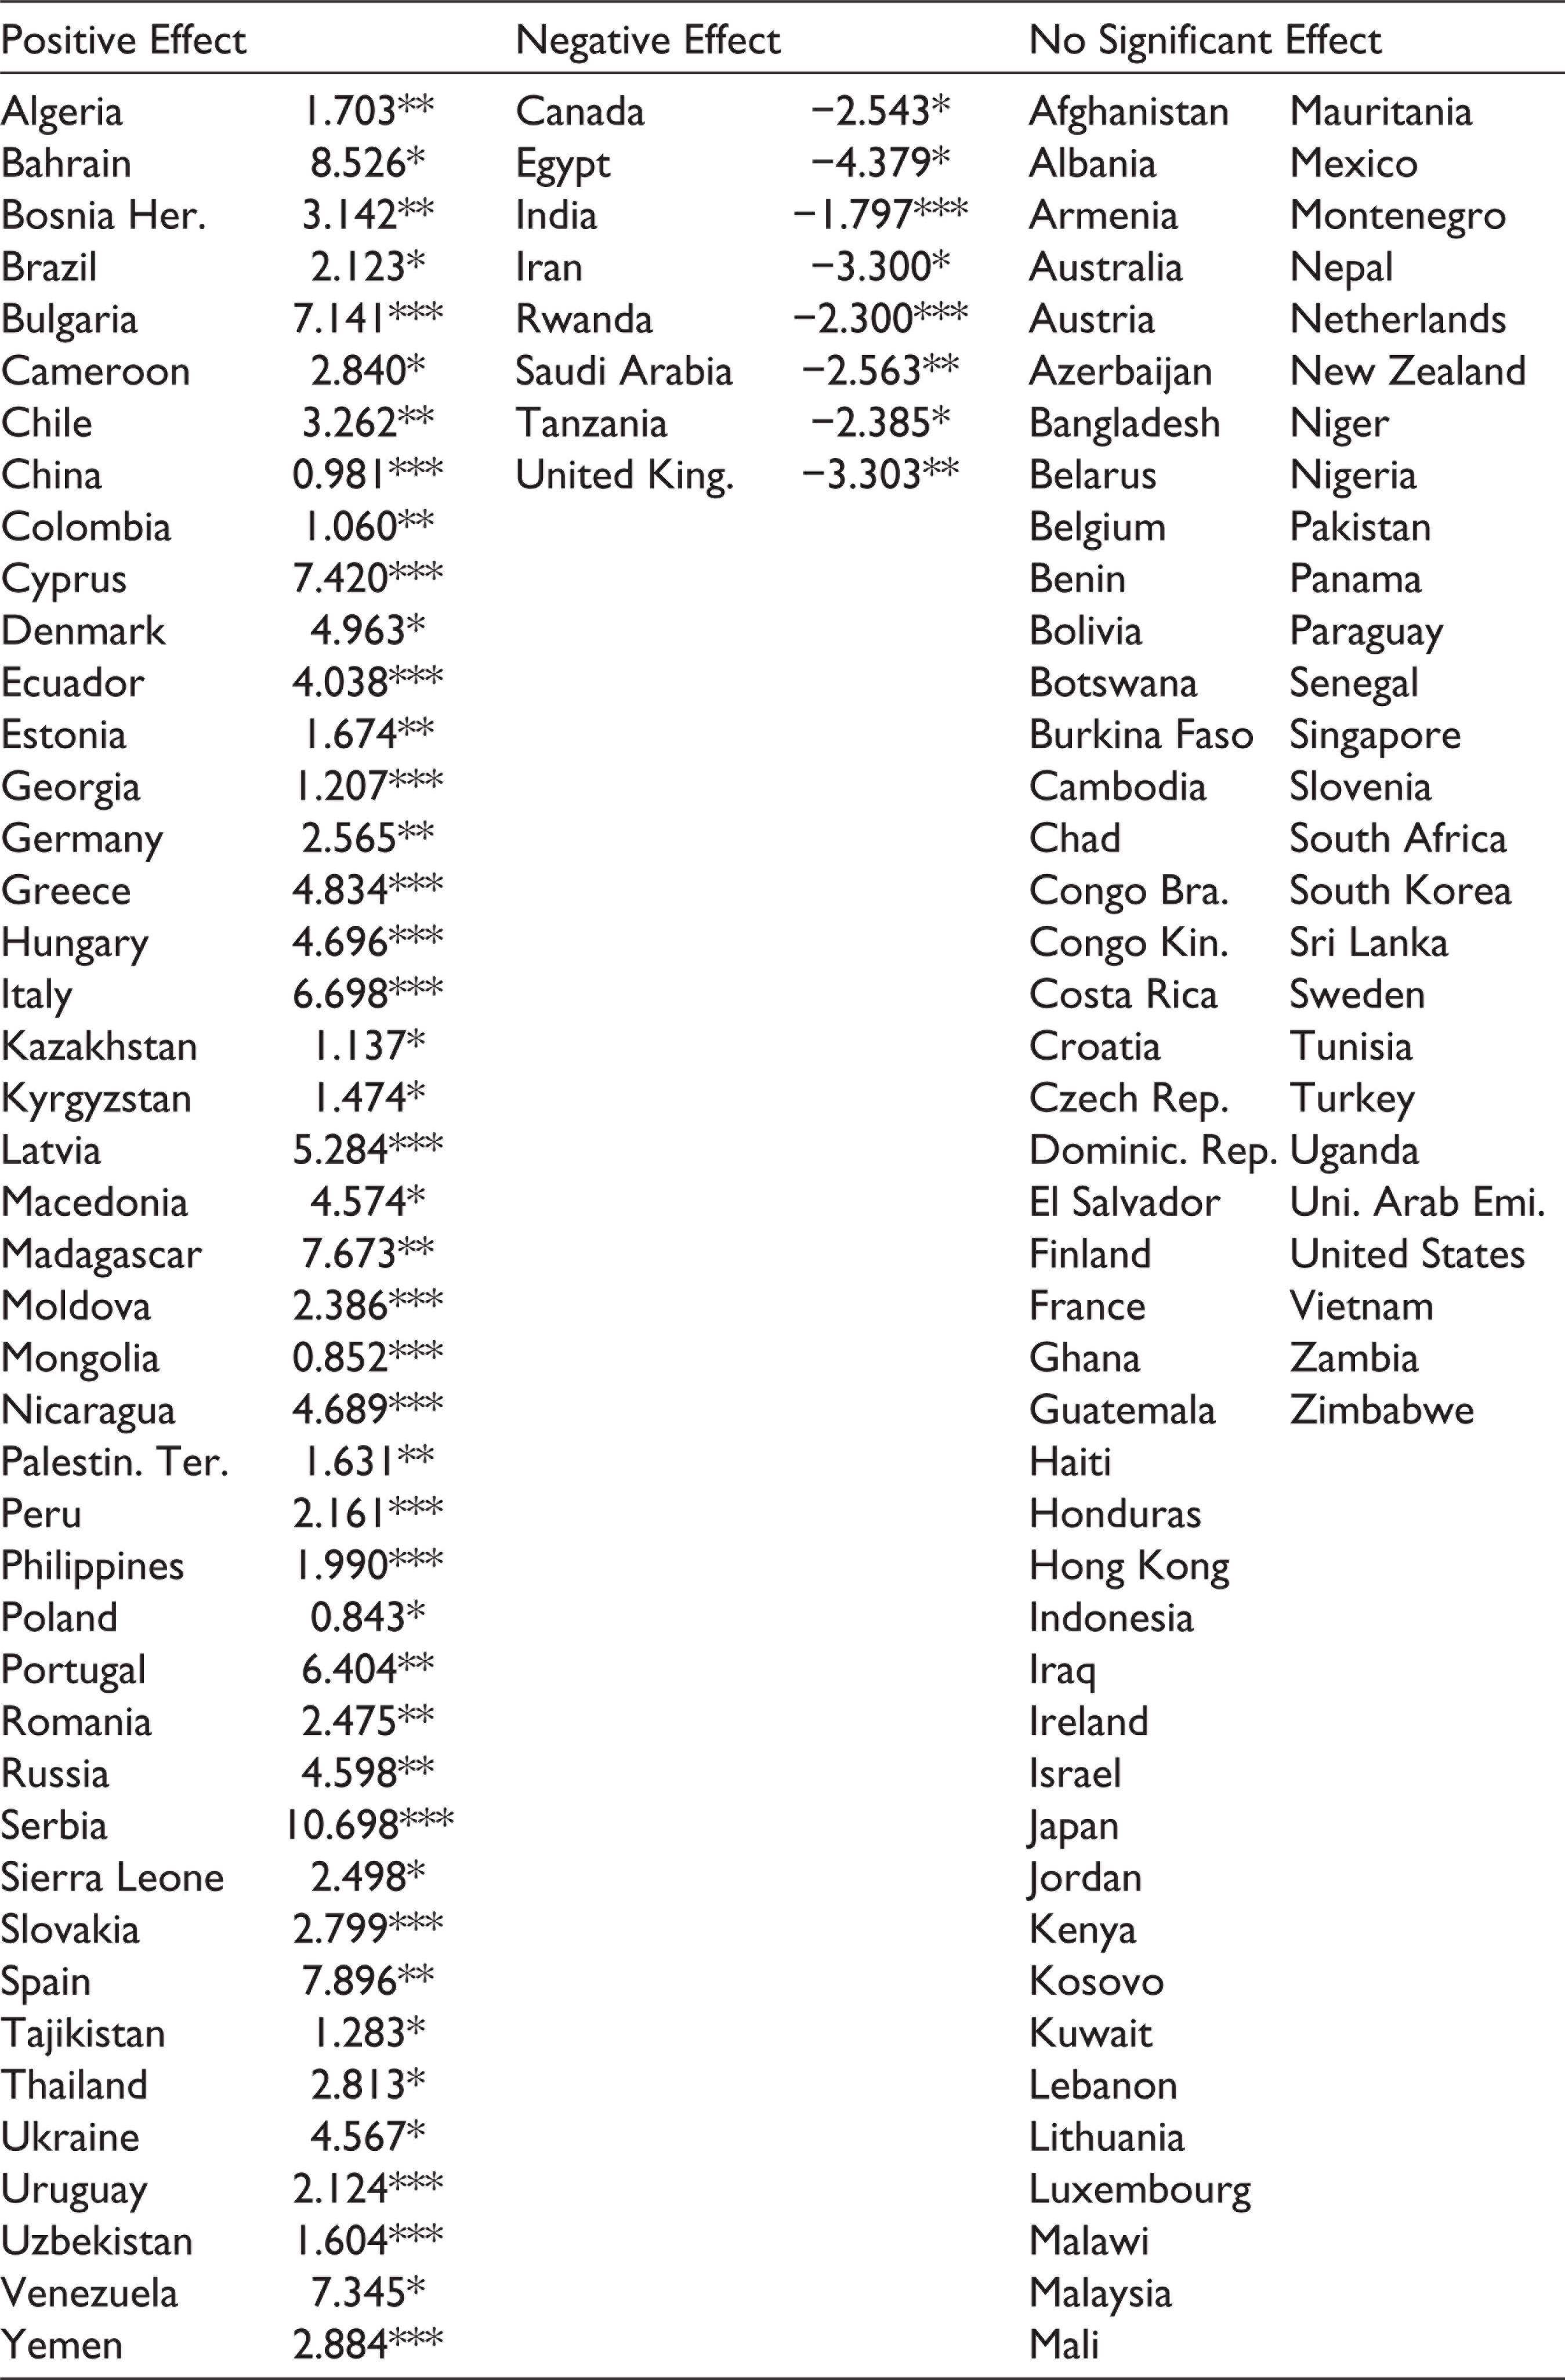
There are several interesting findings: first, the largest group is made up of countries with no significant effect of income on happiness. In this category, we have a total of 70 countries. We take this finding as supportive of the hypothesis that countries tend to adopt the level of diligence (and hence the associated level of income) that maximises their utility. Figure 6 illustrates the argument. For countries that have achieved the optimal level of y (and d), a variation in income will not lead to a noticeable change in happiness. Second, there is a larger group of countries (44) where the effect of income on happiness is positive and a smaller group (8) of countries with the reverse effect. These two groups indicate that there are, indeed, forces that allow for diligence not to be set purely so as to maximise happiness. Some, but not all, of the countries with a positive regression coefficient will be societies whose d falls short of their d*. Again, Figure 6 makes the point. Societies with an income short of the utility-maximising level (i.e., on the left of the utility peak) are characterised by a positive correlation between income and happiness as indicated by the arrow with a positive ascent. The reverse holds for societies with an excessively high level of diligence judged through the lens of their preferences. They are located on the right of the peak and show a negative correlation between income and happiness.
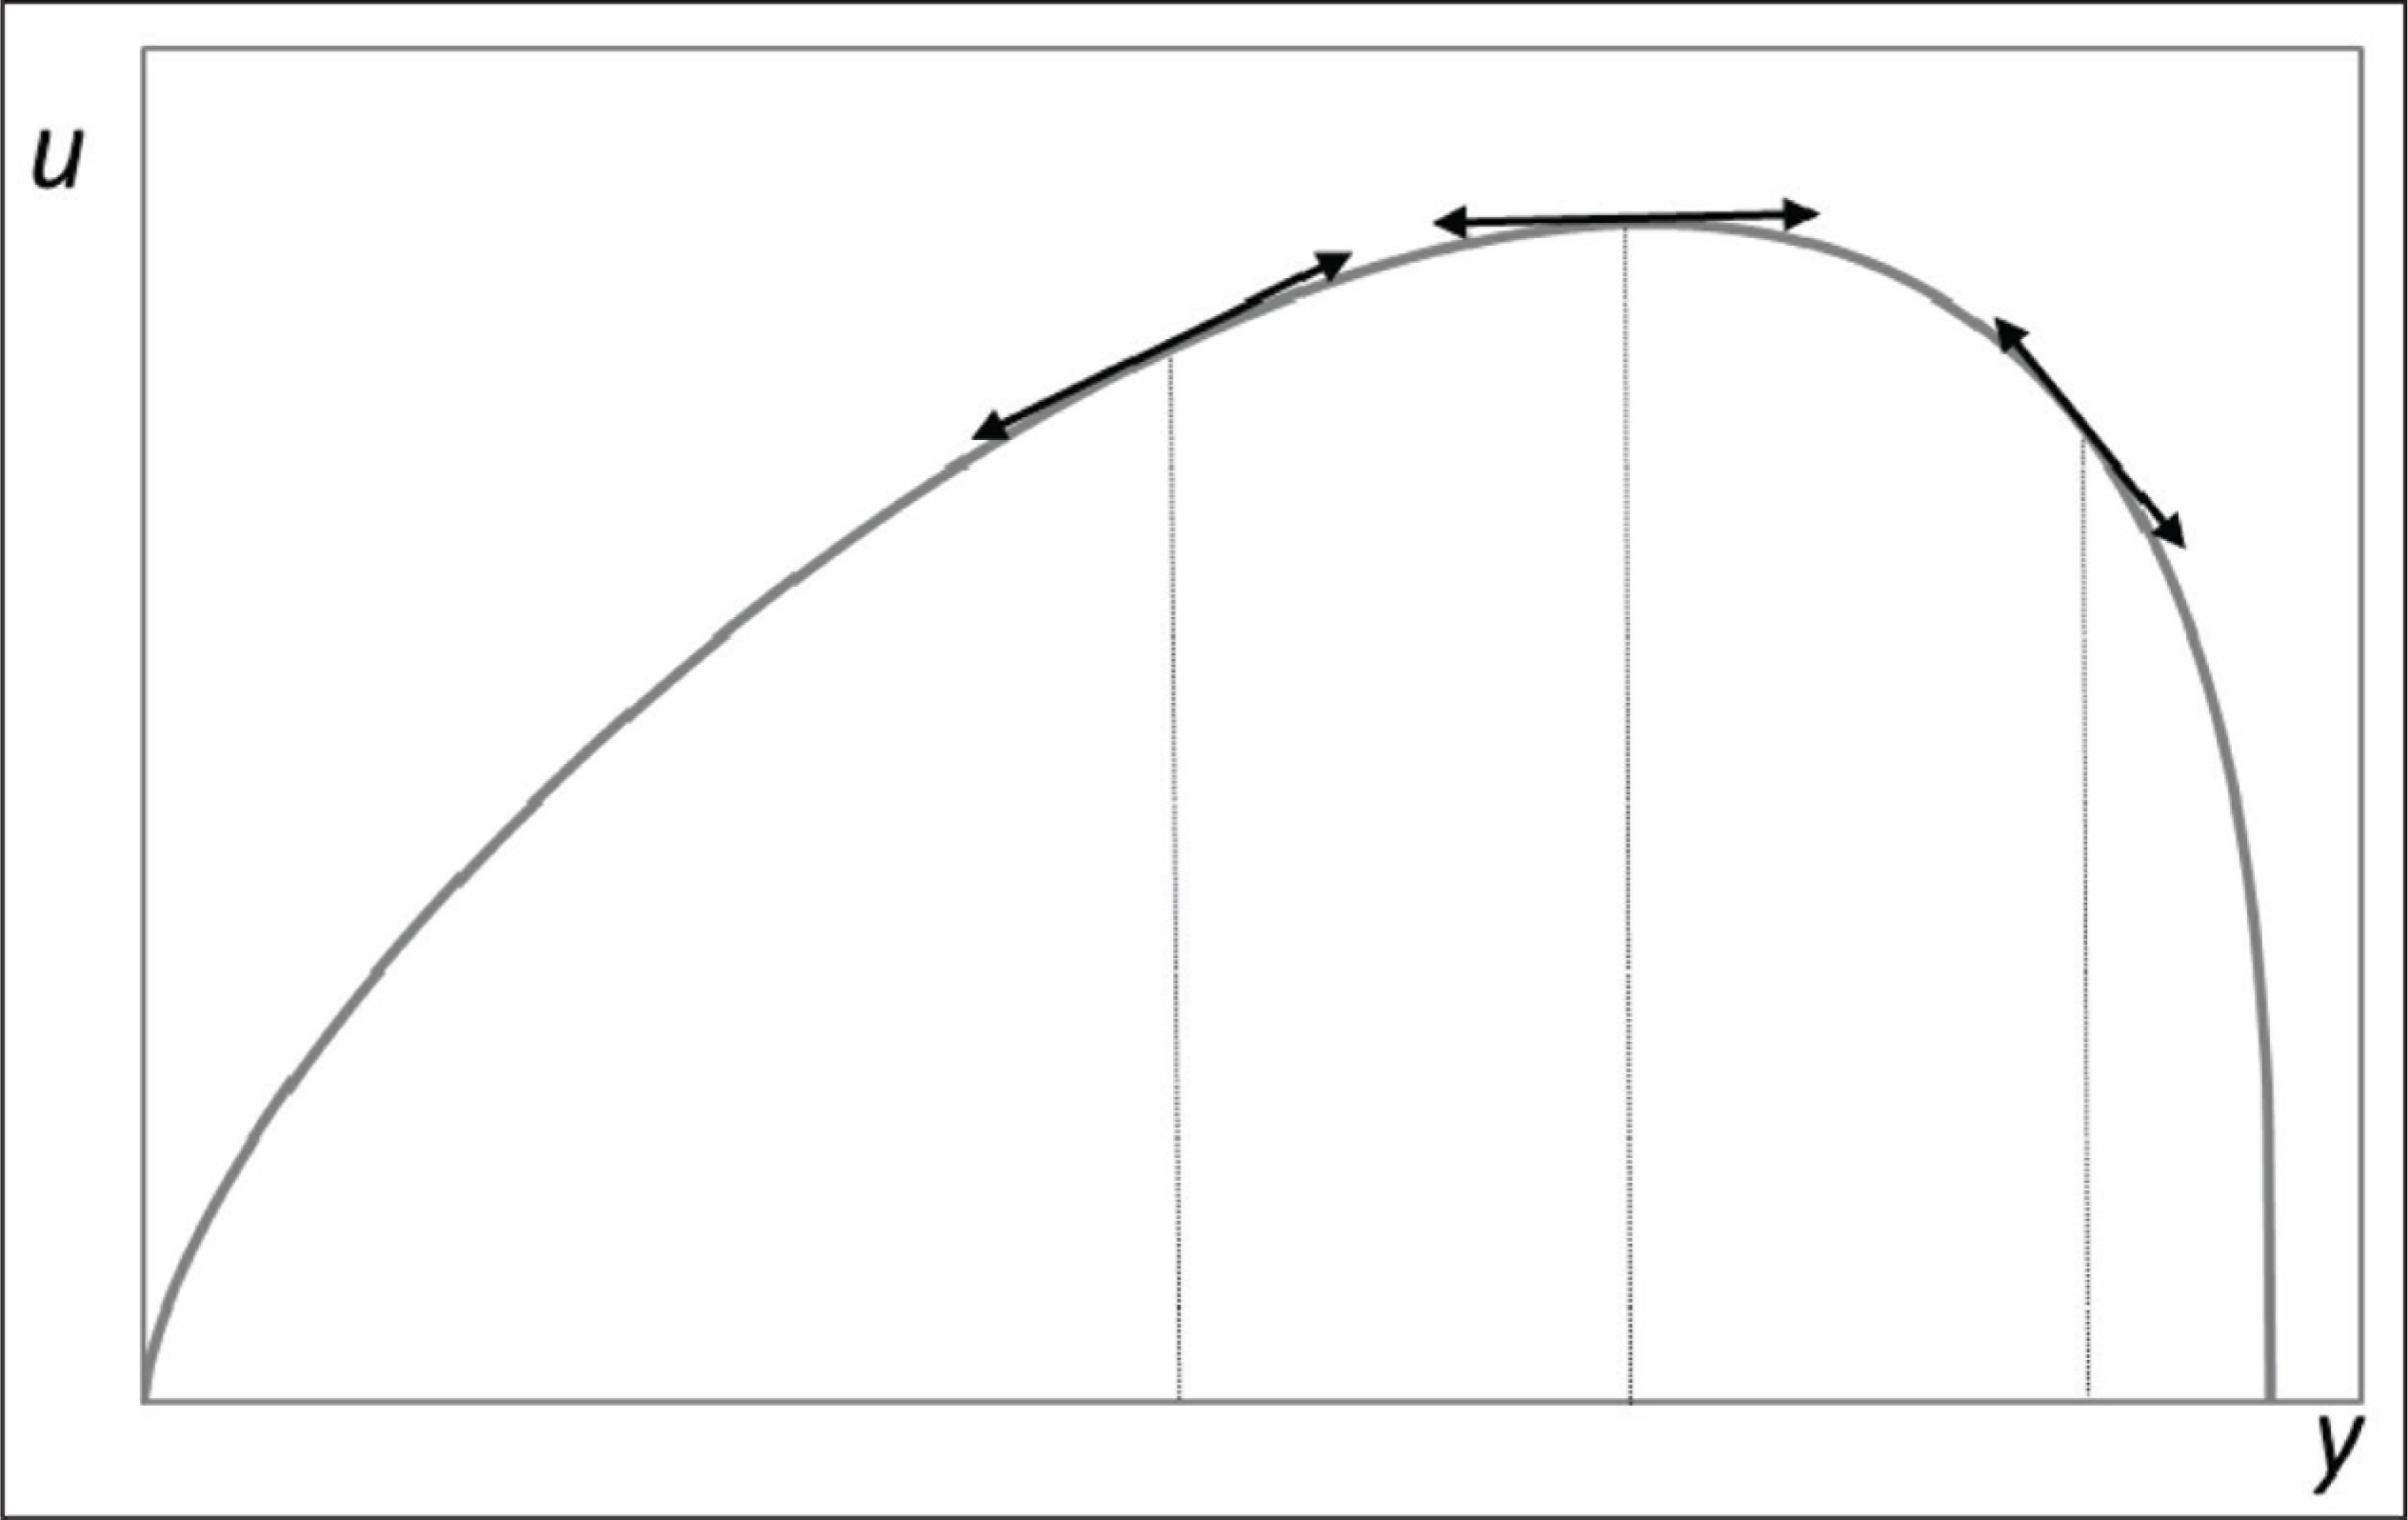
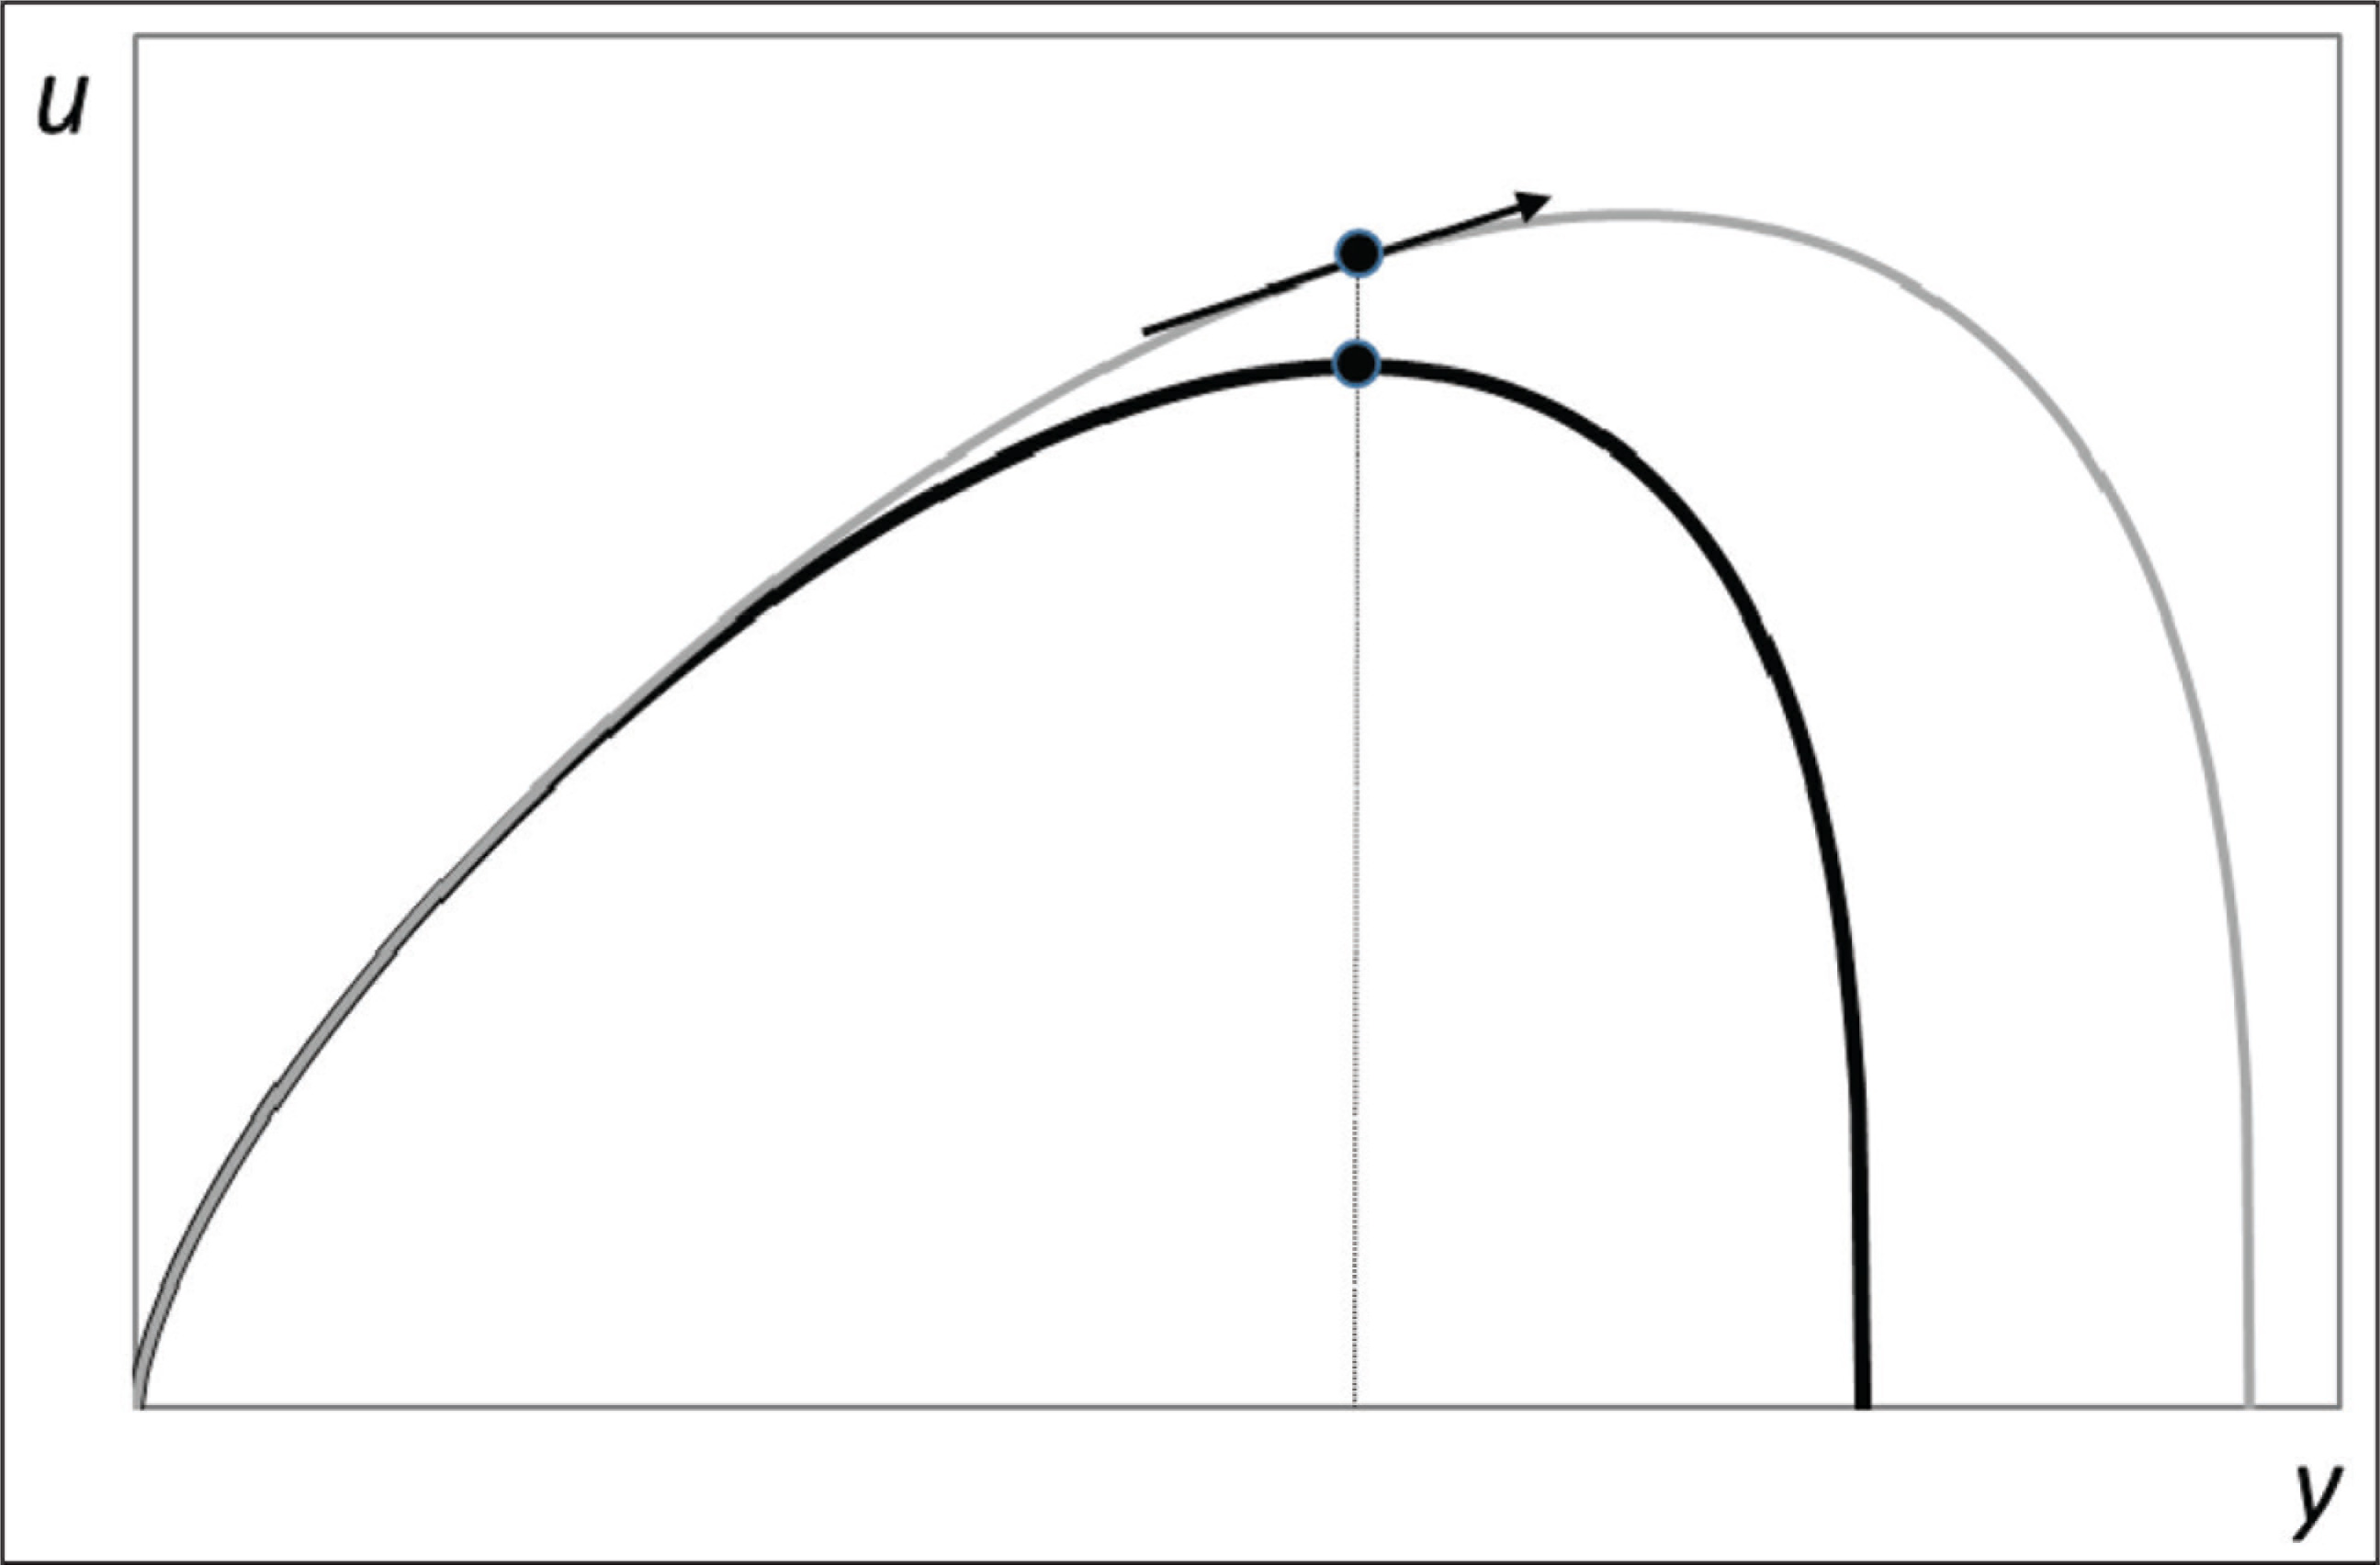
Still, the list of countries with an income below the optimum (i.e., with d < d*) should arguably be shorter. If d is at least partially determined exogenously, then we would expect similar numbers of countries above and below the optimum. Yet, on closer inspection, the fact that there are more countries to the left than to the right of the income optimum is exactly what we should expect if maximisation (or at least a noticeable element of endogeneity) with respect to d occurs. Consider what happens to a country that is at the utility maximum but experiences an improvement in the available state of technology. This is illustrated in Figure 7 where a country is initially located on the top of the dark utility curve. An increase in A means that the utility curve changes to the grey line. Utility in this country increases as an initial result of this technological innovation. Its immediate position after the innovation is vertically higher up on the new utility surface. Yet, given the new technological conditions, the economy will accumulate capital and grow towards a new and higher steady-state income level. During this transition period, the country will experience a positive association between increases in income and in happiness as indicated by the arrow in Figure 7. 12
Thus, from the perspective of single-country time series regressions, the evidence strongly suggests the presence of forces driving diligence in the direction of the utility maximum. Still, there is also evidence—notably in the set of countries with a negative income-to-happiness coefficient—of powerful societal forces that keep d away from d*. 13
Summary and Conclusions
So, where does this study leave us with respect to relativism and economic relativity? Clearly, this investigation does not offer evidence on the concept of cultural relativism. Rather, as a starting point, it takes the notion that different cultures value things differently. Yet, this relativism, in the form of a trade-off concerning diligence in the production of marketable goods, leads to a call for caution with respect to development policies. The evidence presented here suggests that cultural differences across countries regarding the willingness to produce high-quality goods conform to peoples’ preferences regarding the gains and pains of diligence. On this background, it becomes difficult to argue for the typical policies geared at increasing per capita output. Consider modern forms of agriculture or industry: they will likely increase incomes; however, they also have the potential to force forms of work and ways of living that people do not like. 14 Arguably, there are countries where such effects are already present. Strictly welfare-increasing development policies would need to be in line with preferences. Furthermore, the effectiveness of policies should not be measured by advances to per capita output but rather by its addition to measures of happiness. Finally, our study leads to a new appraisal of the Easterlin paradox. Indeed, higher income cannot be expected to generally make people happier when the pains of earning more are taken into consideration.
Footnotes
Acknowledgements
I would like to thank participants of the 2018 SABE conference in London and participants at research seminars at the San Diego University School of Business and Loyola University Andalusia for comments. In particular, comments by Robert Bowen, Susan Jollineau and Pedro Caldentey del Pozo are greatly appreciated.
The author declared no potential conflicts of interest with respect to the research, authorship and/or publication of this article.
Funding
The author received no financial support for the research, authorship and/or publication of this article.