
Abstract
Using data on 150 countries, this article studies if and how the largest world religions have affected the extent of primary education at the national level over the period 1972–2010. Although primary education has been compulsory in most countries for at least several decades, the regression results suggest that these religions have indeed still been able to exert an influence on this type of education. Specifically, whereas Protestantism and Catholicism had a positive effect on the male primary enrolment rate, Hinduism and Buddhism had a negative effect on the female primary enrolment rate. Islam had a negative effect on both. While the magnitude of the estimated effects is small for boys, it is more substantial for girls, particularly the negative effect of Islam. The estimates are robust to endogeneity of all five religion adherence variables. They are also robust to numerous controls and variations in specification.
Introduction
Using data on 150 countries, this article studies if and how the largest world religions have affected the extent of primary education at the national level in the recent past—specifically, over the period from 1972 to 2010. World religions have shaped education since ancient times. Before the nineteenth century, religious organizations were the major and often even the sole providers of education in most countries. Since then, the formal role of religion in education has been strongly diminished, especially in the West. Education was almost completely secularized and the school systems were taken over by the state, either entirely or for the most part (Boyd & King, 1975).
However, there are four reasons as to why some world religions are likely to have continued to influence education even in the recent past, at least to some degree. First, most people still identify with a religious group. In 2010, no less than 84 per cent of the global population were affiliated with a religion (Pew Research Center, 2012). If their religion places a high emphasis on education, parents are likely to have sent their children to school and requested policymakers to provide adequate educational facilities. Conversely, if their religion places a low emphasis on education—for example, on that of girls—parents are likely to have acted accordingly as well. Second, religious authorities, too, may have influenced governments’ educational policies. Third, policymakers’ religious beliefs may have partly shaped governments’ supply of education. Fourth, even in secularized societies, the formerly dominant religions may have still exerted a major, albeit largely indirect, impact in the recent past. Indeed, using data from the World Values Surveys from the 1980s and the 1990s on 65 countries, Inglehart and Baker (2000) find that religious traditions have historically shaped the national culture of given societies, with enduring effects on a wide range of contemporary values and beliefs among the population—even in countries where nowadays most people have little or no contact with religious institutions. Although Inglehart and Baker (2000) do not study the effects of religious traditions on education, they hypothesize that the impact of these traditions on contemporary values and beliefs is transmitted partly by educational institutions.
Ex ante it is unclear which world religions have recently influenced education at the national level, primarily because different religions have different views on education and because the influence of religions has varied both by country and by religion—not least because other players who are not or little motivated by religion, such as teachers unions, have influenced educational provision as well. 1 Therefore, it is impossible to make specific theoretical predictions. Rather, the question of which world religions have influenced the extent of primary education at the national level in the recent past needs to be resolved empirically.
Our article focuses on primary rather than higher levels of education for two reasons. First, as primary education is the most basic form of education, it is of key importance for economic and social development—especially in developing countries, where many children do not attain higher levels of education. 2 Indeed, it probably is the most fundamental form of human capital investment. Second, as primary education has been compulsory in most countries for at least several decades, it is of particular interest to see whether and which religions have nonetheless been able to affect the extent of education at this level. 3
So far, there are only few multi-country studies analysing the effects of world religions on education. Their results, as well as those from single-country studies, can be summarized as follows. The most unambiguous results are those for Islam: almost all previous studies find this religion to adversely affect female education (e.g., Feldmann, 2016a; Norton & Tomal, 2009). By contrast, the results for Protestantism are mixed. Whereas Feldmann’s (2018) multi-country study finds positive effects on both male’s and female’s secondary schooling, papers focusing on the USA report that, in this country, fundamentalist and conservative Protestants have low levels of educational attainment (e.g., Darnell & Sherkat, 1997; Lehrer, 1999). For Roman Catholicism, the results from previous studies are mixed as well. While some papers report either a positive or a negative effect, most papers, especially those covering large samples of countries, find no statistically significant effect (e.g., Bessey, 2013; Feldmann, 2016a; Norton & Tomal, 2009). Hinduism and Buddhism have been covered by a few studies only, with inconclusive results (e.g., Bessey, 2013; Feldmann, 2016a; Norton & Tomal, 2009).
Our article makes several contributions to this literature. First, whereas almost all previous papers study the effect of a few religions only, our article covers the five largest world religions: Protestantism, Roman Catholicism, Islam, Hinduism and Buddhism. 4 Second, in contrast to most previous studies, we instrument our religion adherence variables. Third, whereas most previous papers use individual-level data, we use country-level data, which enable us to estimate the effect of these religions on national rates of education. Such rates are important for economic and social development. Fourth, our sample of countries is exceptionally large. By contrast, most previous studies use data from a single country only, and almost all of the few multi-country studies use data from far fewer countries than we do. Fifth, our sample period is much longer than those of almost all previous studies, most of which use data from a few years only. The larger country sample combined with the longer sample period leads to more general results. Finally, unlike most previous papers using country-level data, we include a large number of controls and perform several robustness checks.
The rest of the article is organized as follows. The next section describes our variables and methodology. The third section reports and discusses our regression results. The final section concludes.
Data and Methodology
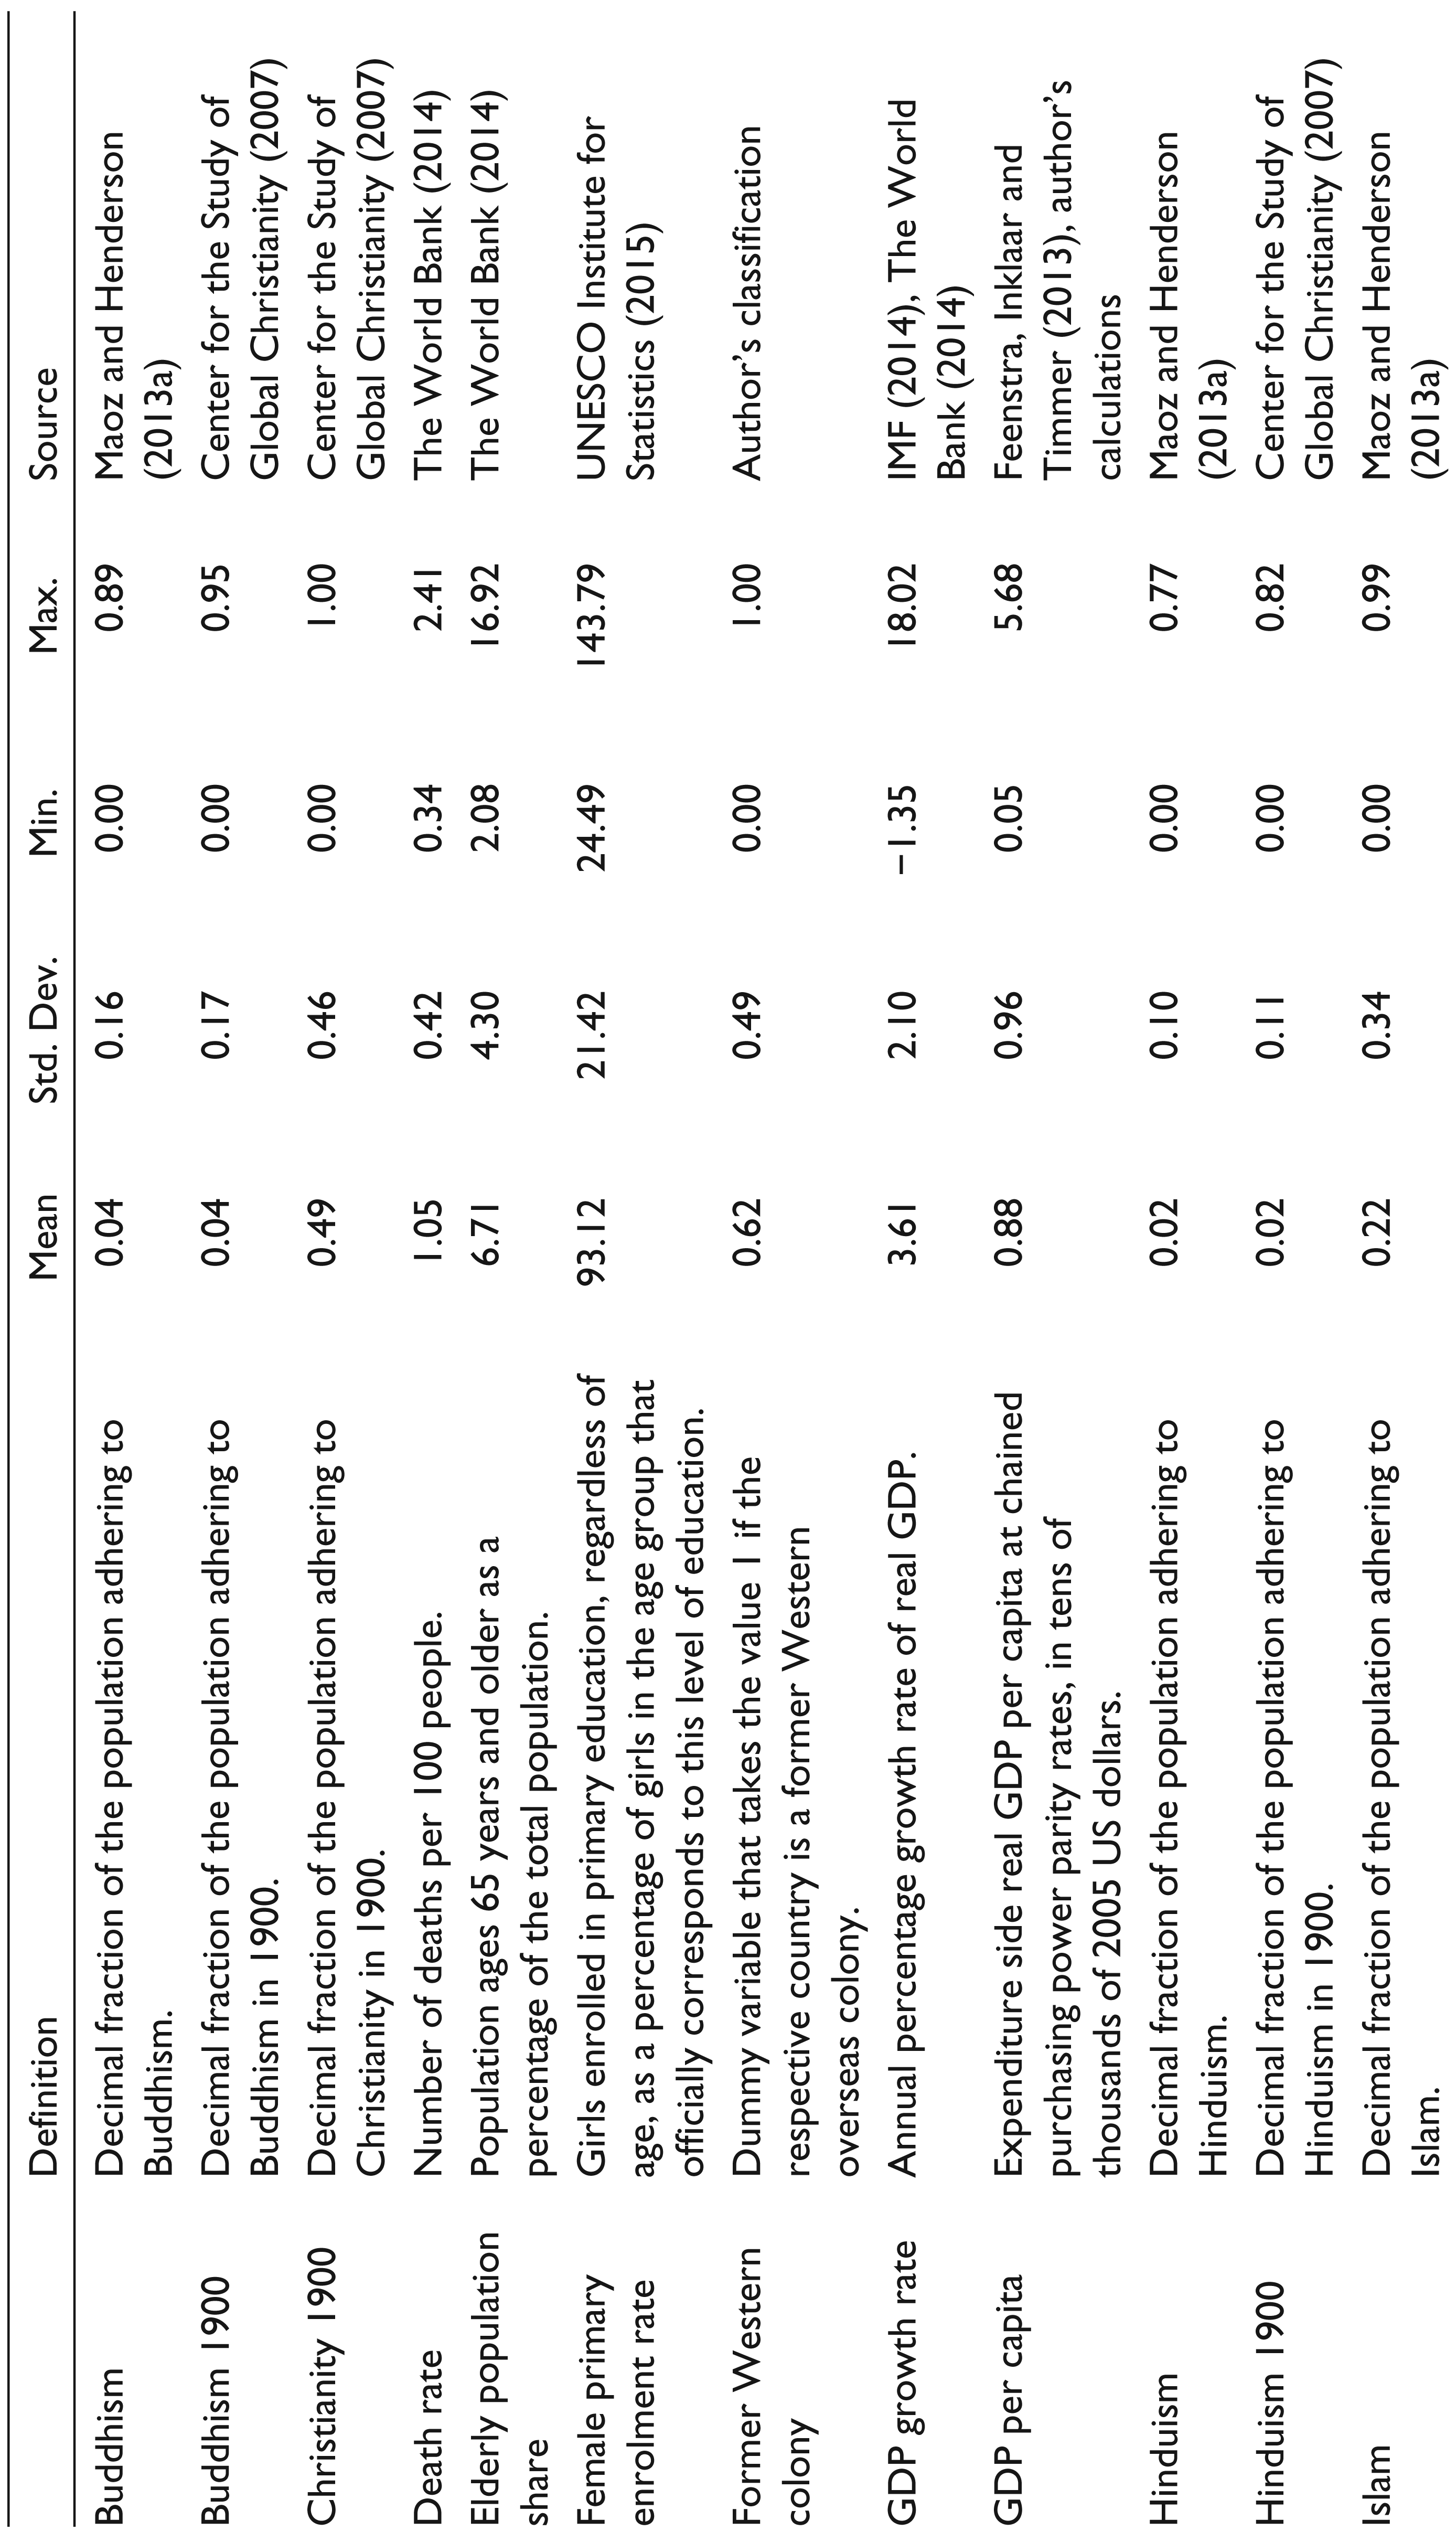
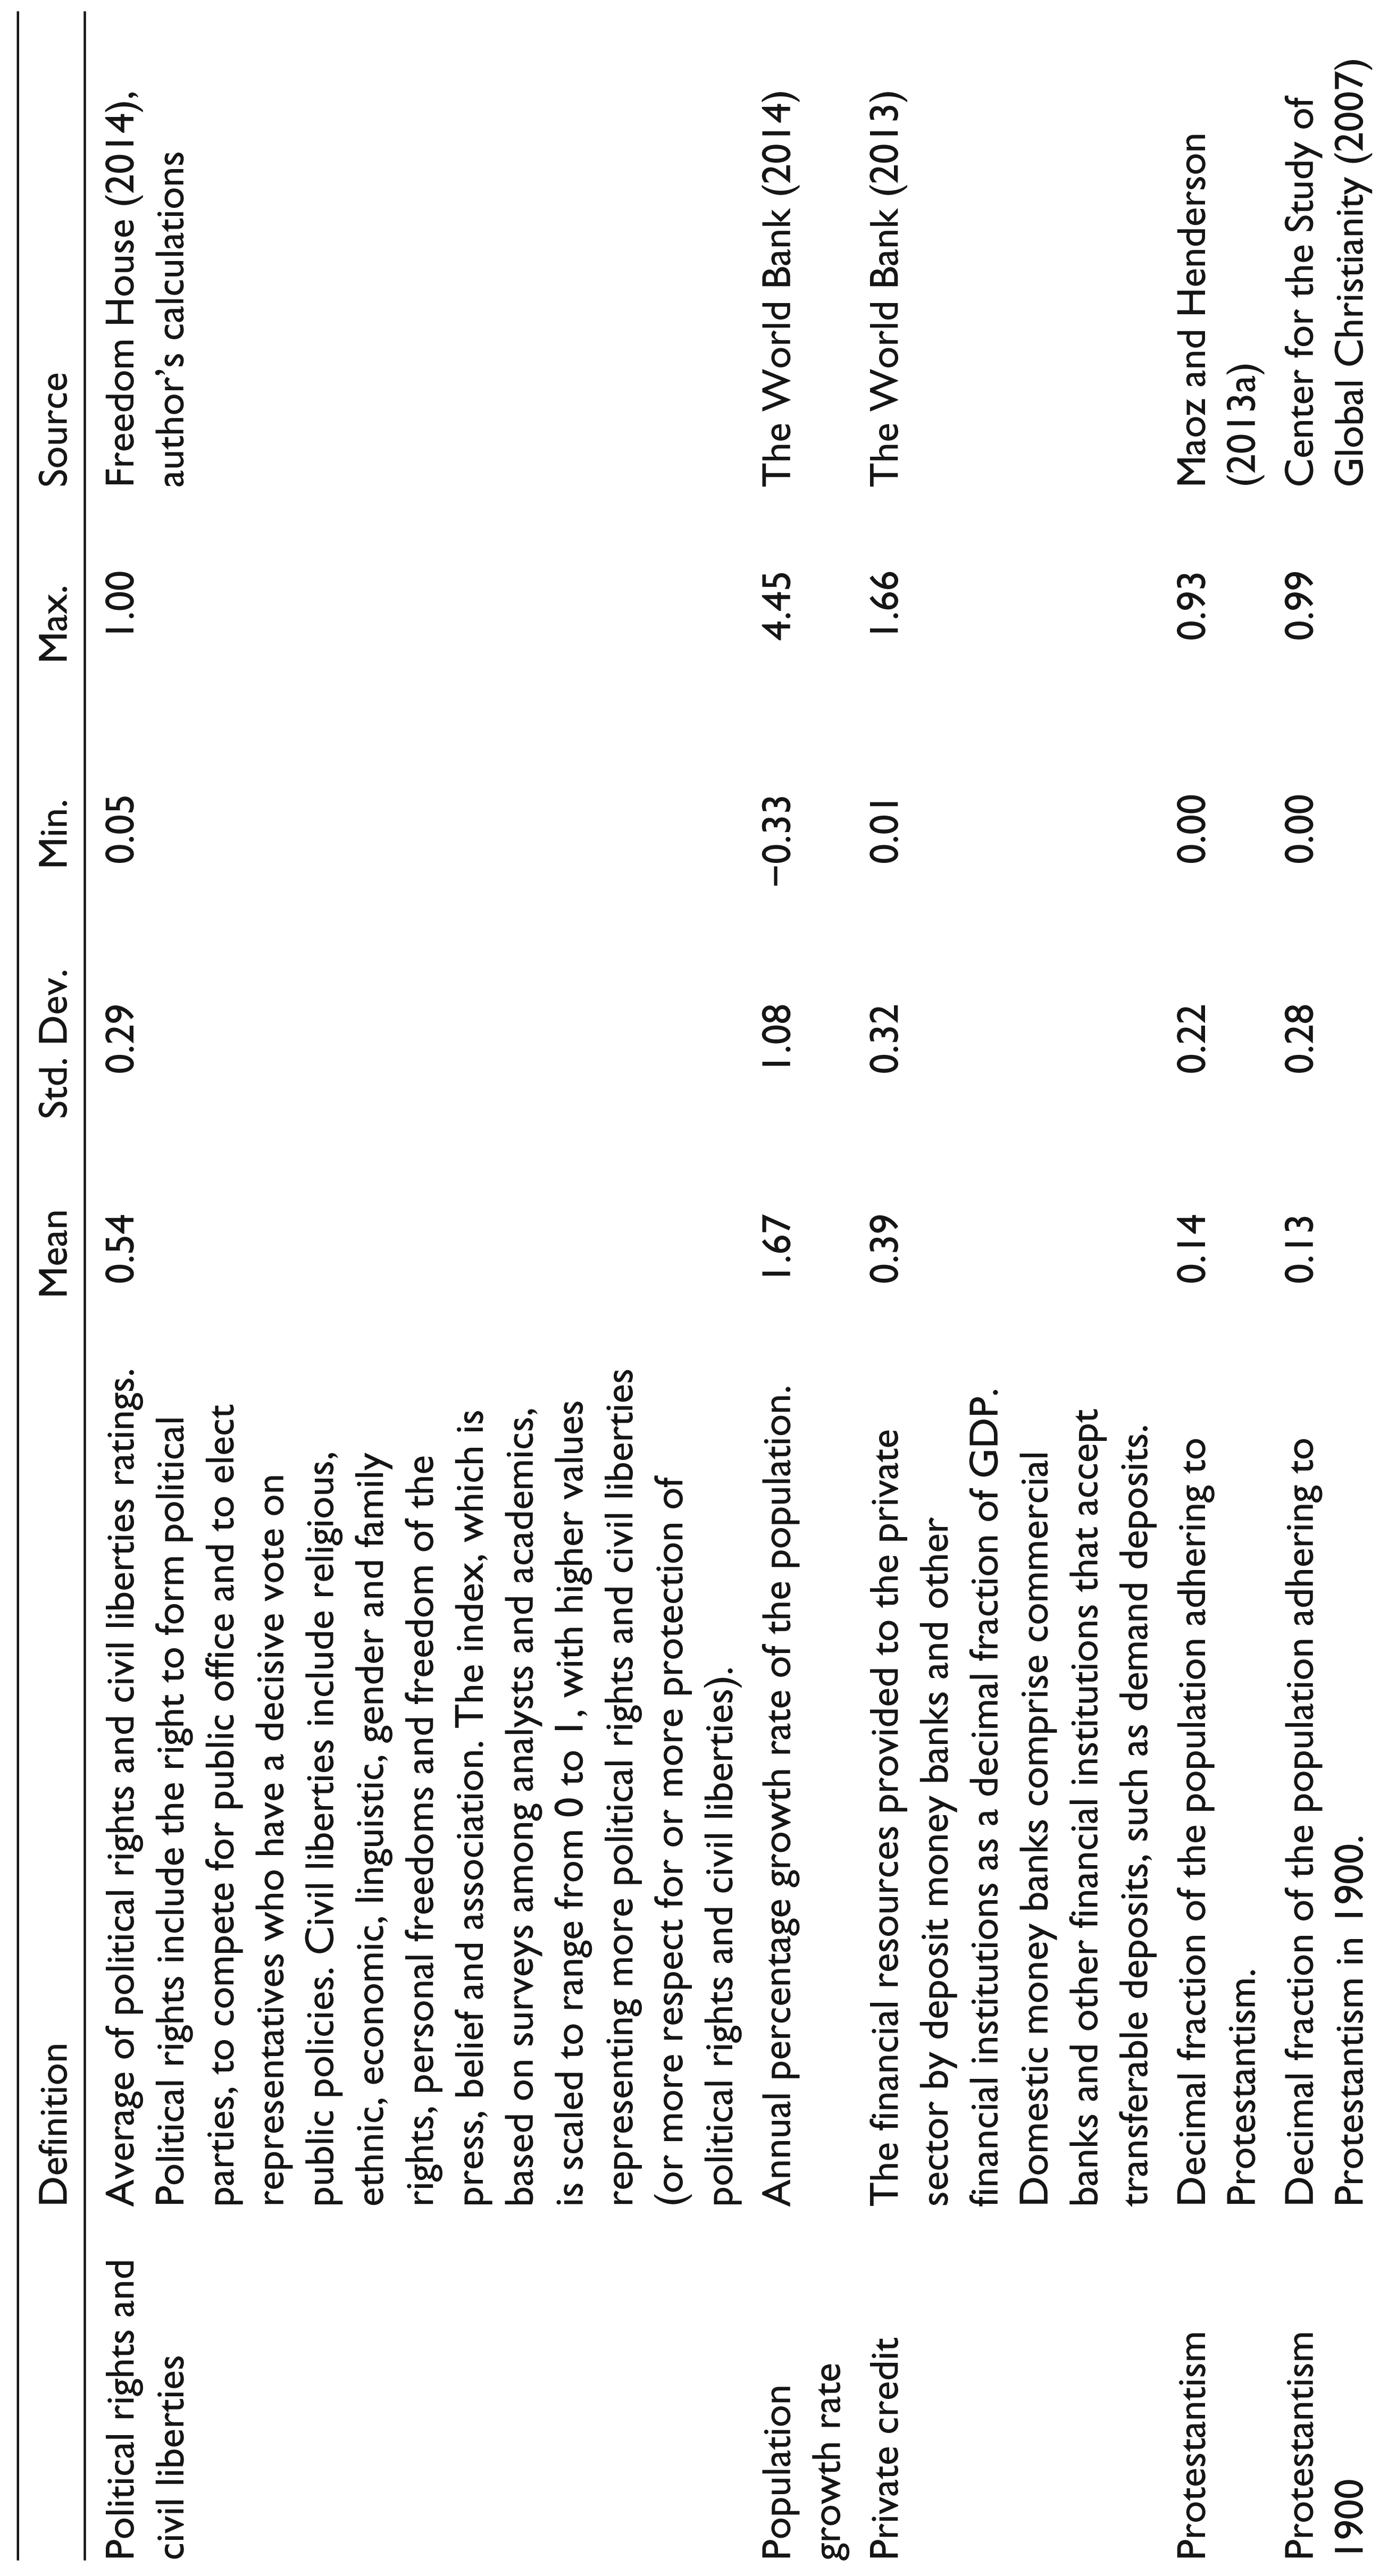
Our variables of interest are Protestantism, Roman Catholicism, Islam, Hinduism and Buddhism. Each of them measures the share of the population adhering to the respective religion (for definitions, descriptive statistics and sources of all variables, see Appendix A). 5 The data are from Maoz and Henderson’s (2013a) World Religion Dataset. Drawing on multiple sources, Maoz and Henderson (2013b) have taken great care to use the most reliable sources, reconcile conflicting data, adequately deal with missing data and produce series that are consistent both through time and across countries. Their dataset is probably the best country-level dataset on religion adherence currently available.
For the reasons given in the Introduction, our dependent variables focus on primary school enrolment. Specifically, we use the primary enrolment rate among boys and, alternatively, among girls. This is because Catholicism, Islam and Hinduism have long neglected the education of girls, whereas Protestantism and Buddhism from their beginnings have aimed to treat both genders equally (Foster Carroll, 1983). By using the female rate as an alternative to the male rate, we intend to find out whether and to what extent some religions have affected the education of boys and girls differently even in the recent past.
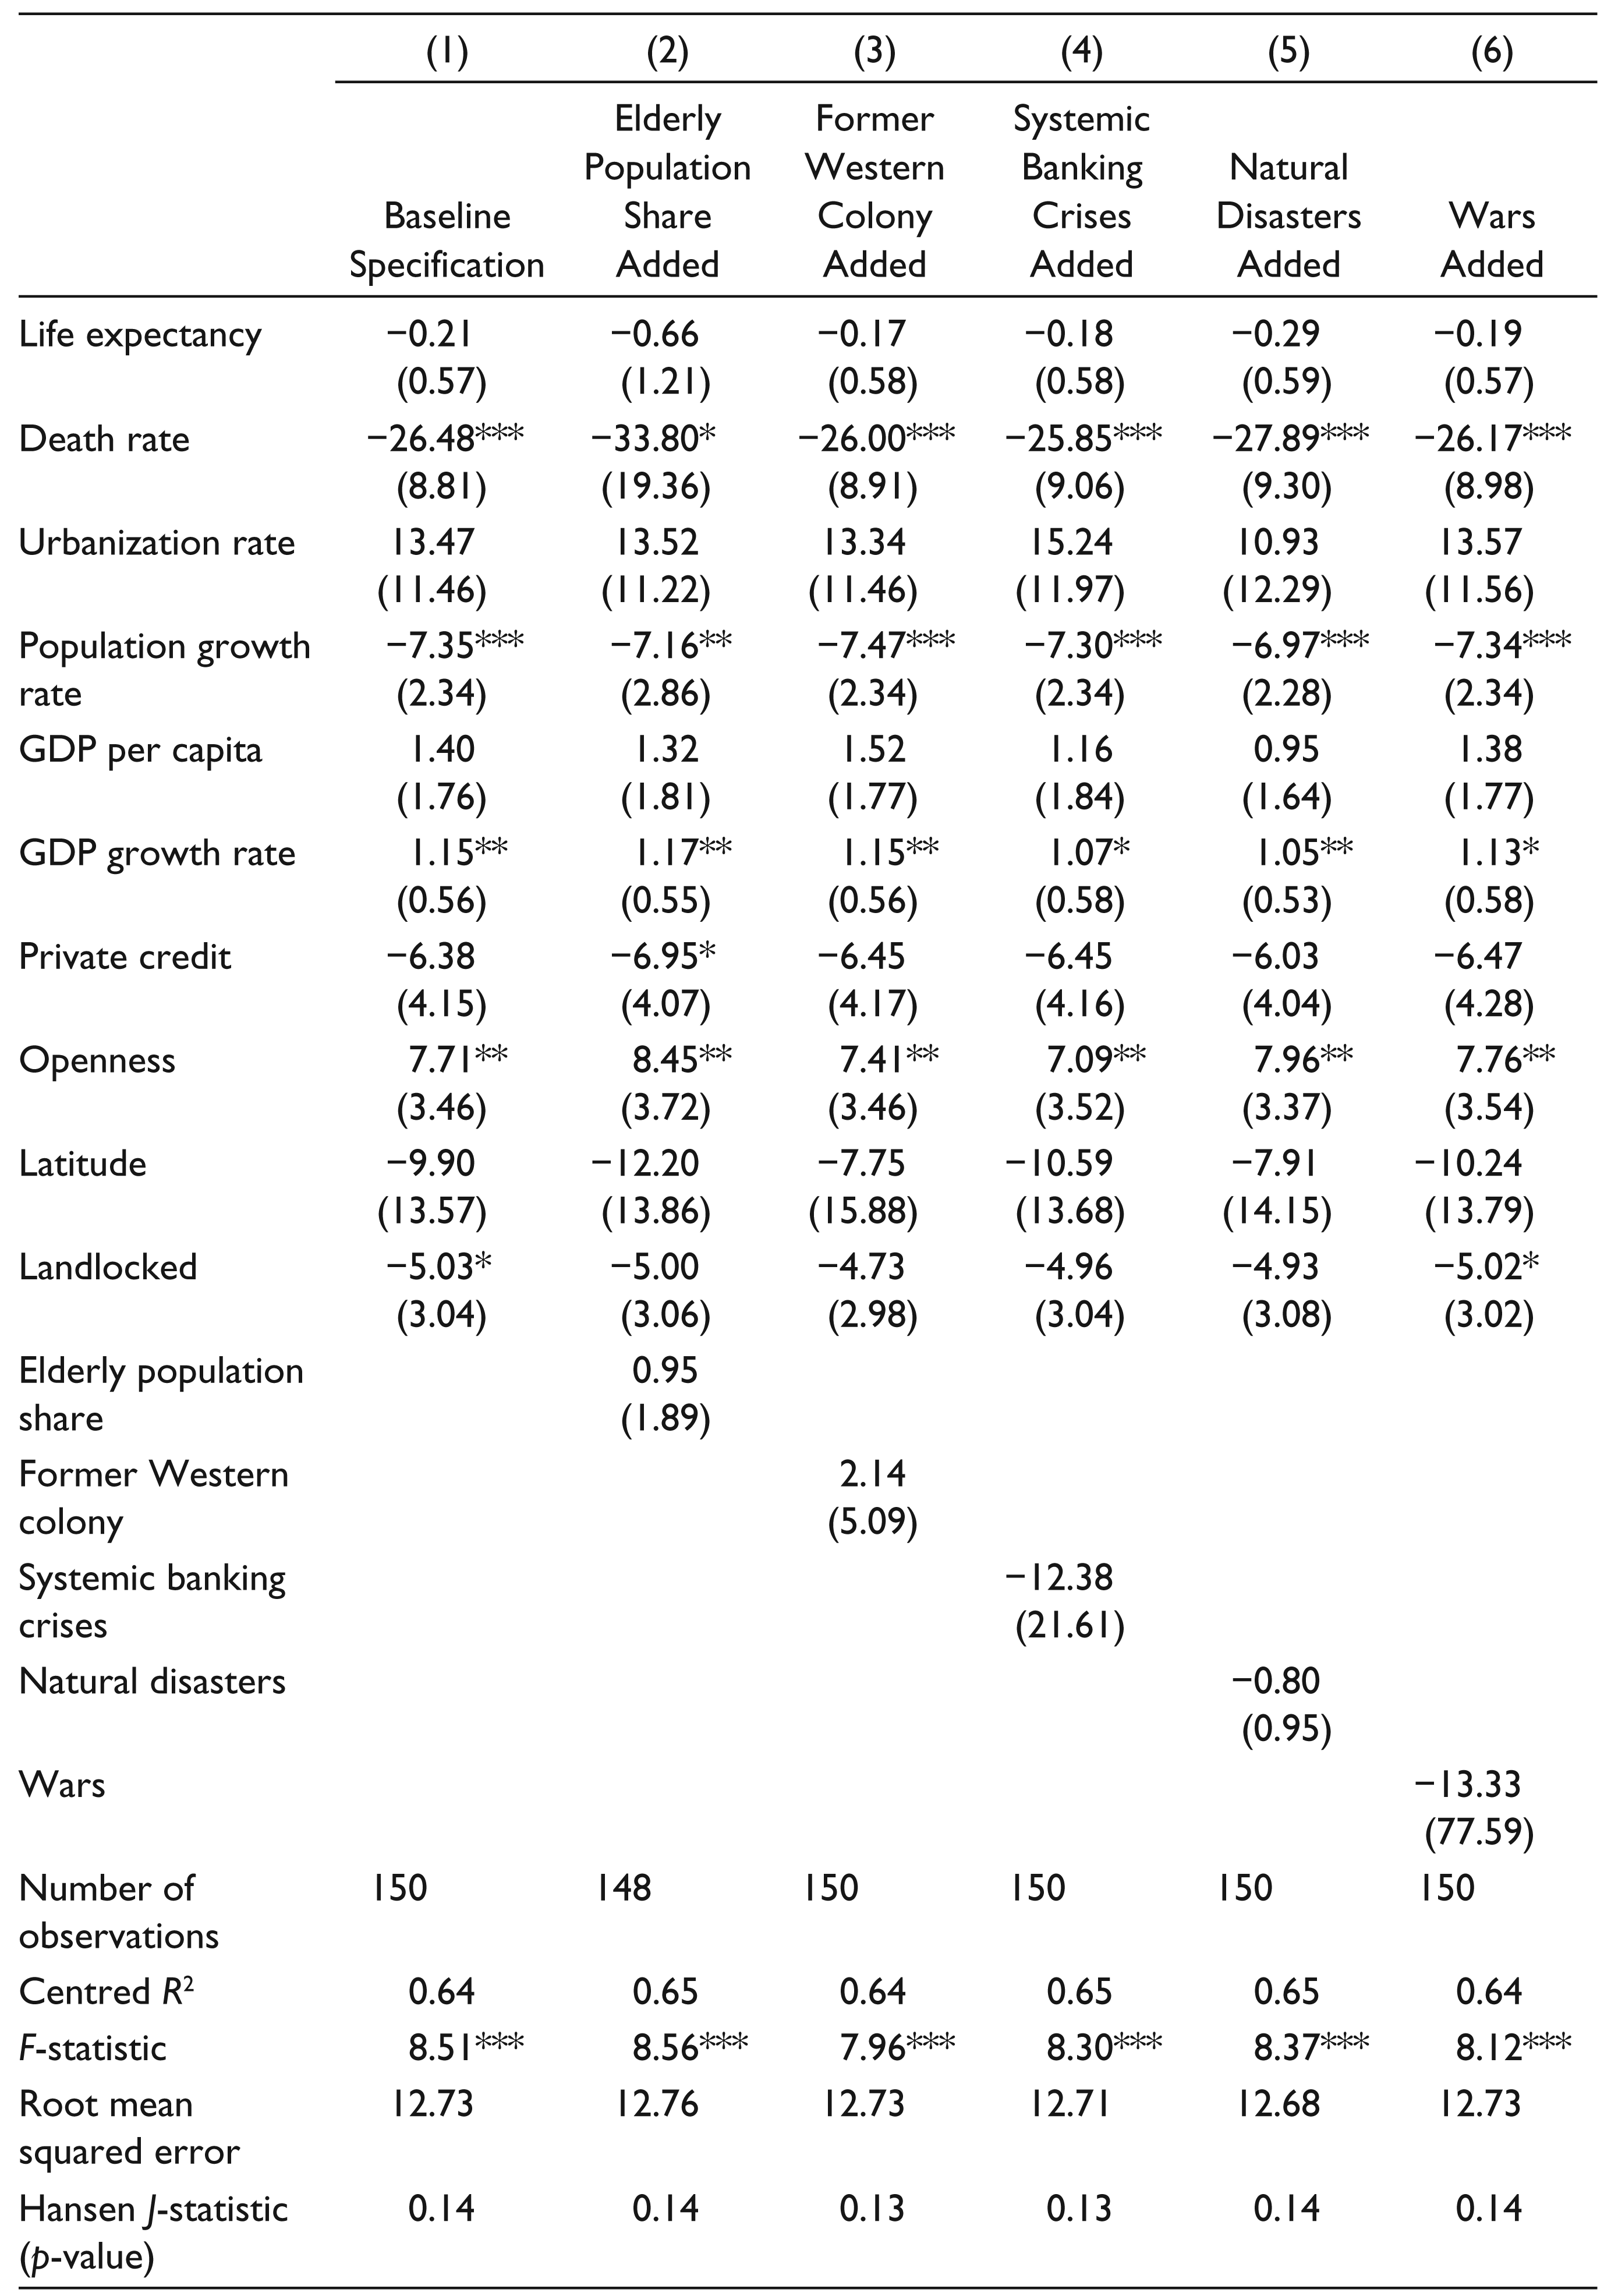
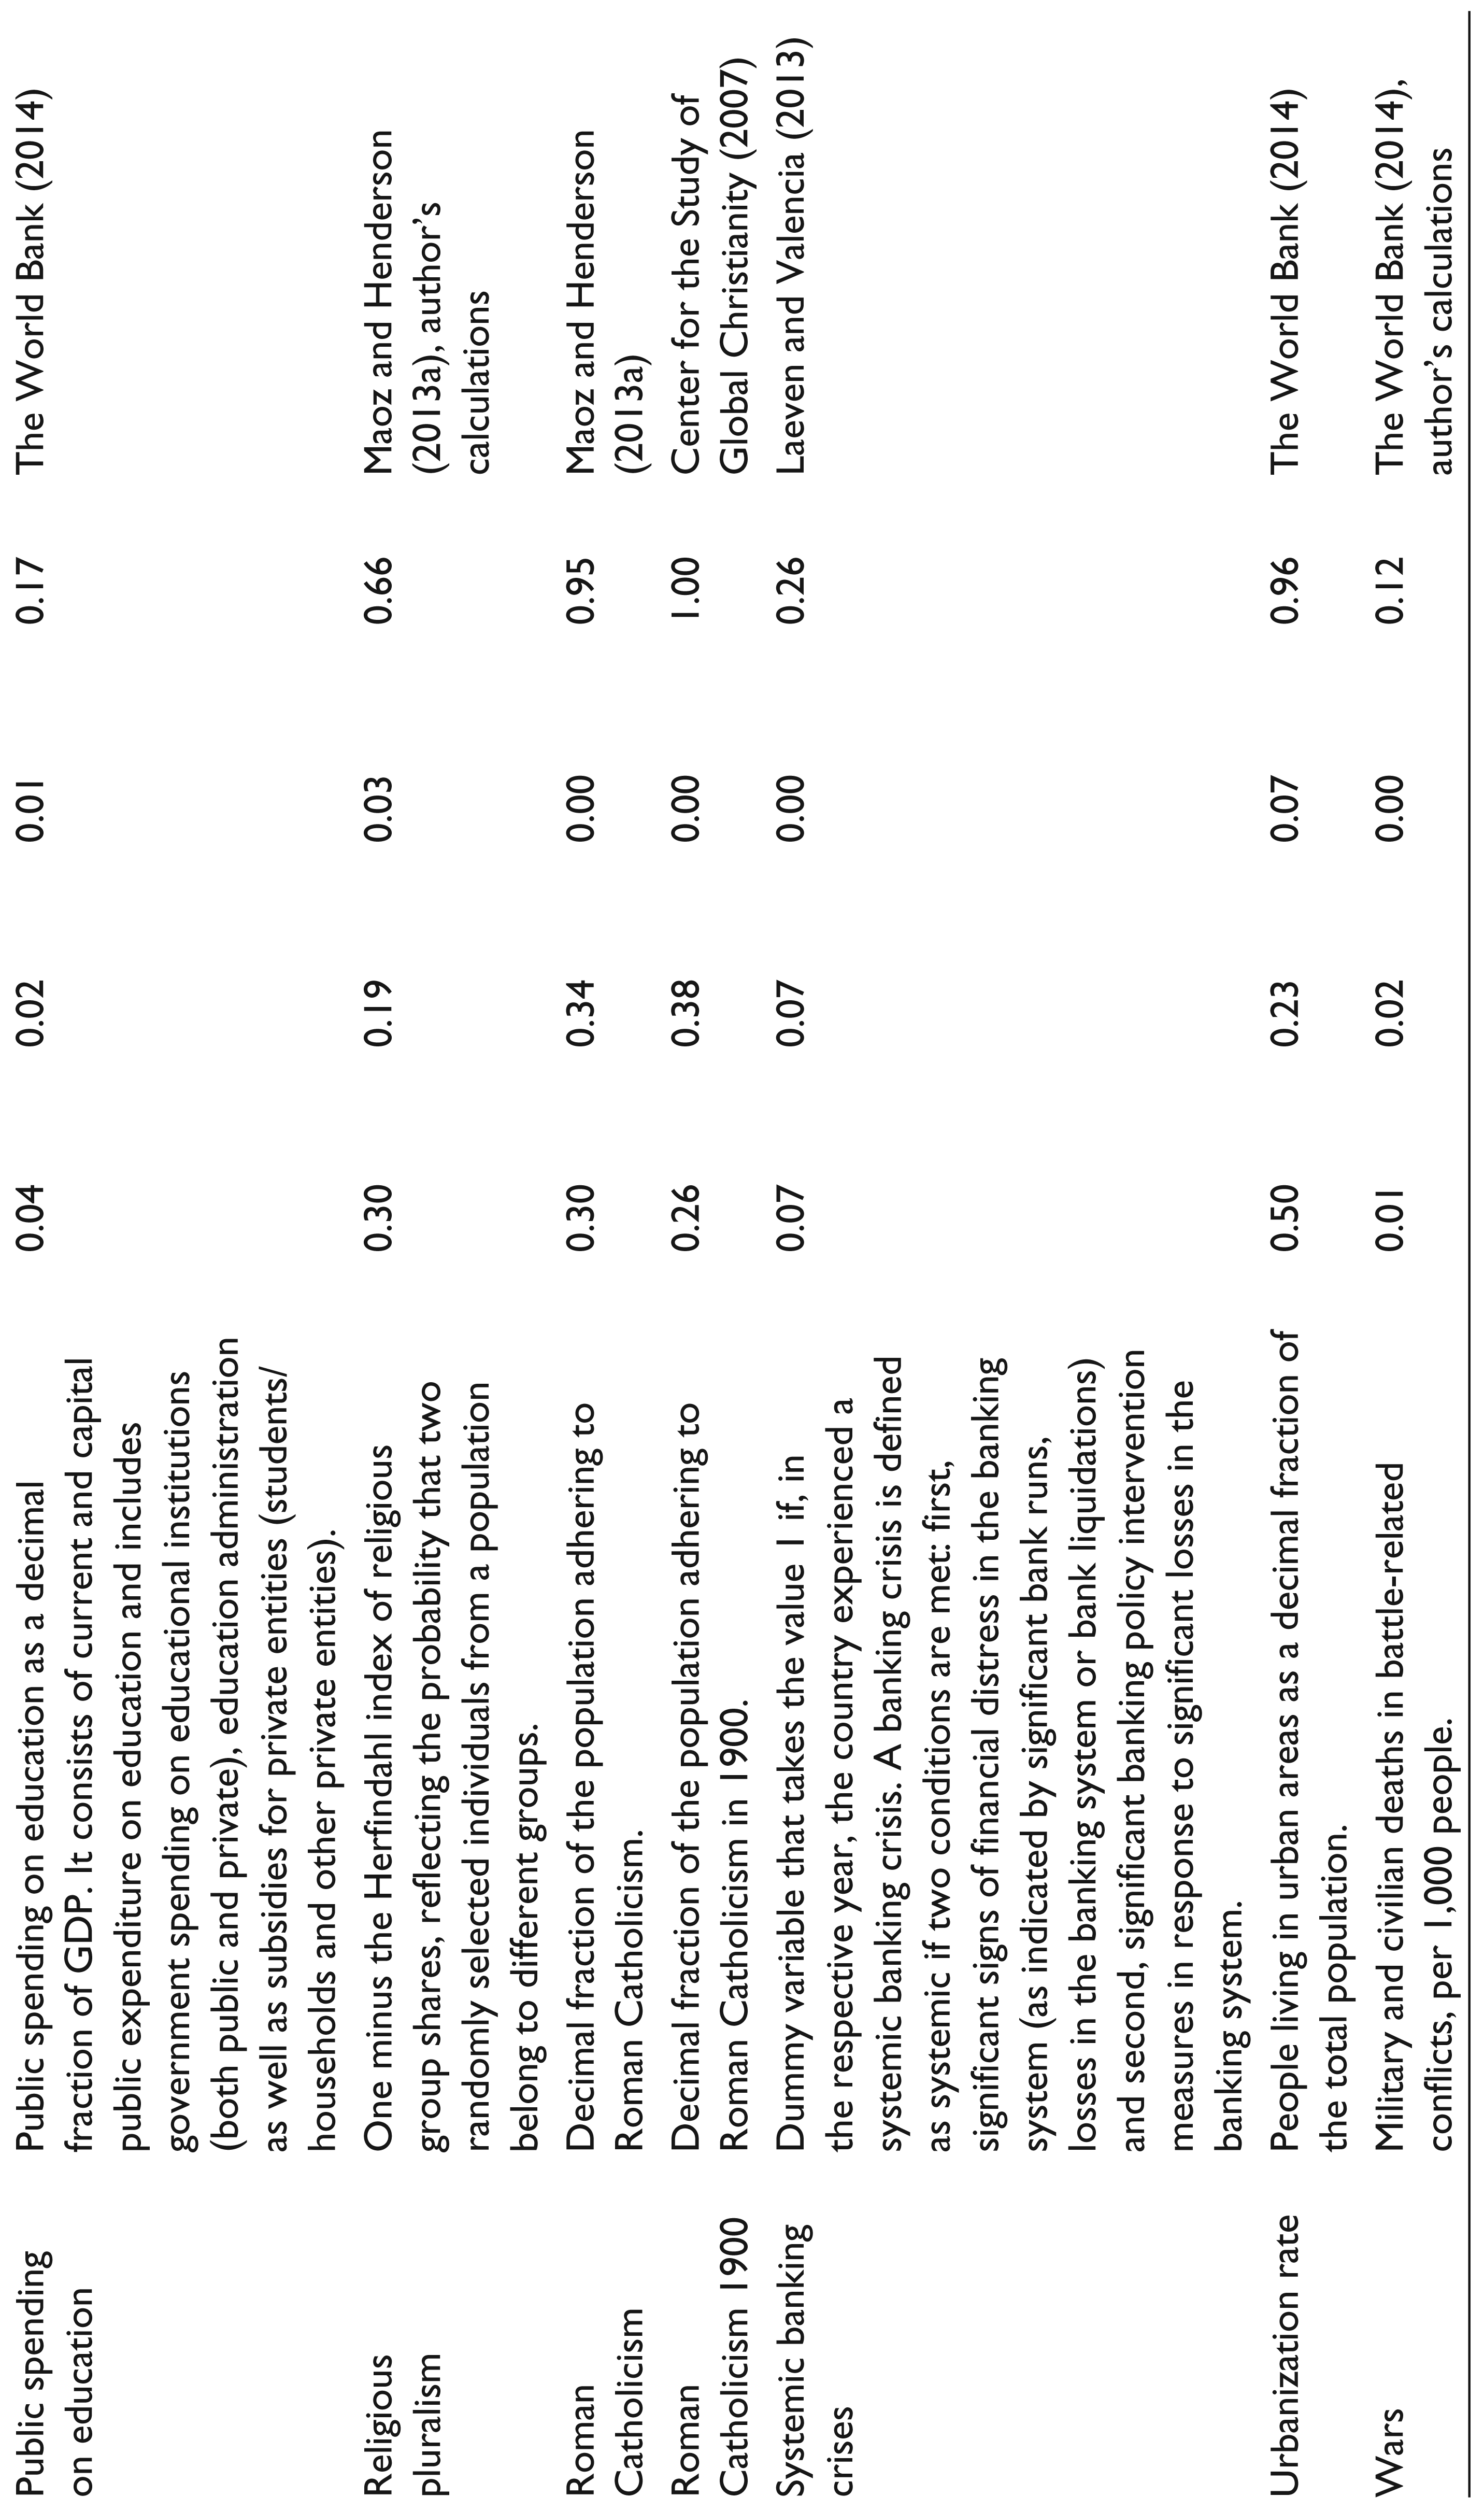
We use a large number of variables to control for the impact of other potential determinants of education. 6 The control variables we employ have been selected on the basis of the relevant theoretical and empirical literature. For brevity, instead of surveying this literature in detail, let us just list the variables and cite some of the papers that have found the respective variable to be potentially important. To start with, we control for religious pluralism (e.g., Alesina, Devleeschauwer, Easterly, Kurlat, & Wacziarg, 2003). We also control for public spending on education (e.g., Trostel, 2002) as well as for political rights and civil liberties (e.g., Gallego, 2010). We employ several demographic variables: life expectancy (e.g., Cervellati & Sunde, 2005), death rate (e.g., Kalemli-Ozcan, 2008), urbanization rate (e.g., Bertinelli & Zou, 2008), population growth rate (e.g., Becker & Lewis, 1973) and, in one robustness check, the share of the elderly in the population (e.g., Poterba, 1997). Moreover, we control for relevant economic characteristics. Specifically, we use GDP per capita (e.g., Mincer, 1996), GDP growth rate as a proxy for business cycle fluctuations (e.g., Méndez & Sepúlveda, 2012), private credit as a proxy for credit constraints (e.g., De Gregorio, 1996) and openness (e.g., Ranjan, 2001). Furthermore, we control for geographic conditions using both latitude and landlocked (e.g., Gallup, Sachs, & Mellinger, 1999). In one robustness check, we additionally control for colonial history (e.g., Feldmann, 2016b). Moreover, in all regressions, we include four regional dummies: Africa and the Middle East, America, Asia, and Europe. In our final three main robustness checks, we additionally control for economic instability and different types of crises (e.g., Heylen & Pozzi, 2007).
As our excluded instruments refer to a single year only (see below), we use cross-country rather than panel data. The data for the time-variant variables are averaged over the period 1972–2010. While 1972 is the first year for which data for all variables mentioned above are available, 2010 is the most recent year covered by the World Religion Dataset. With respect to both countries and time period, the size of our sample is determined by data availability only.
We run two-stage least squares regressions of the following form:
Second stage:

The first stage of R1,i:

Pi is a primary enrolment rate variable of country i, covering either boys or girls. Rj,i is a vector of our five religion adherence variables and Xk,i represents a vector of q control variables. The constant terms in the second- and first-stage regressions are α and λ, respectively, while the error terms are εi and μi, respectively. In their respective first stages, religion adherence variables R2 to R5 are regressed on the same set of excluded instruments, Zl,i, and control variables as noted for R1 in Equation (2).
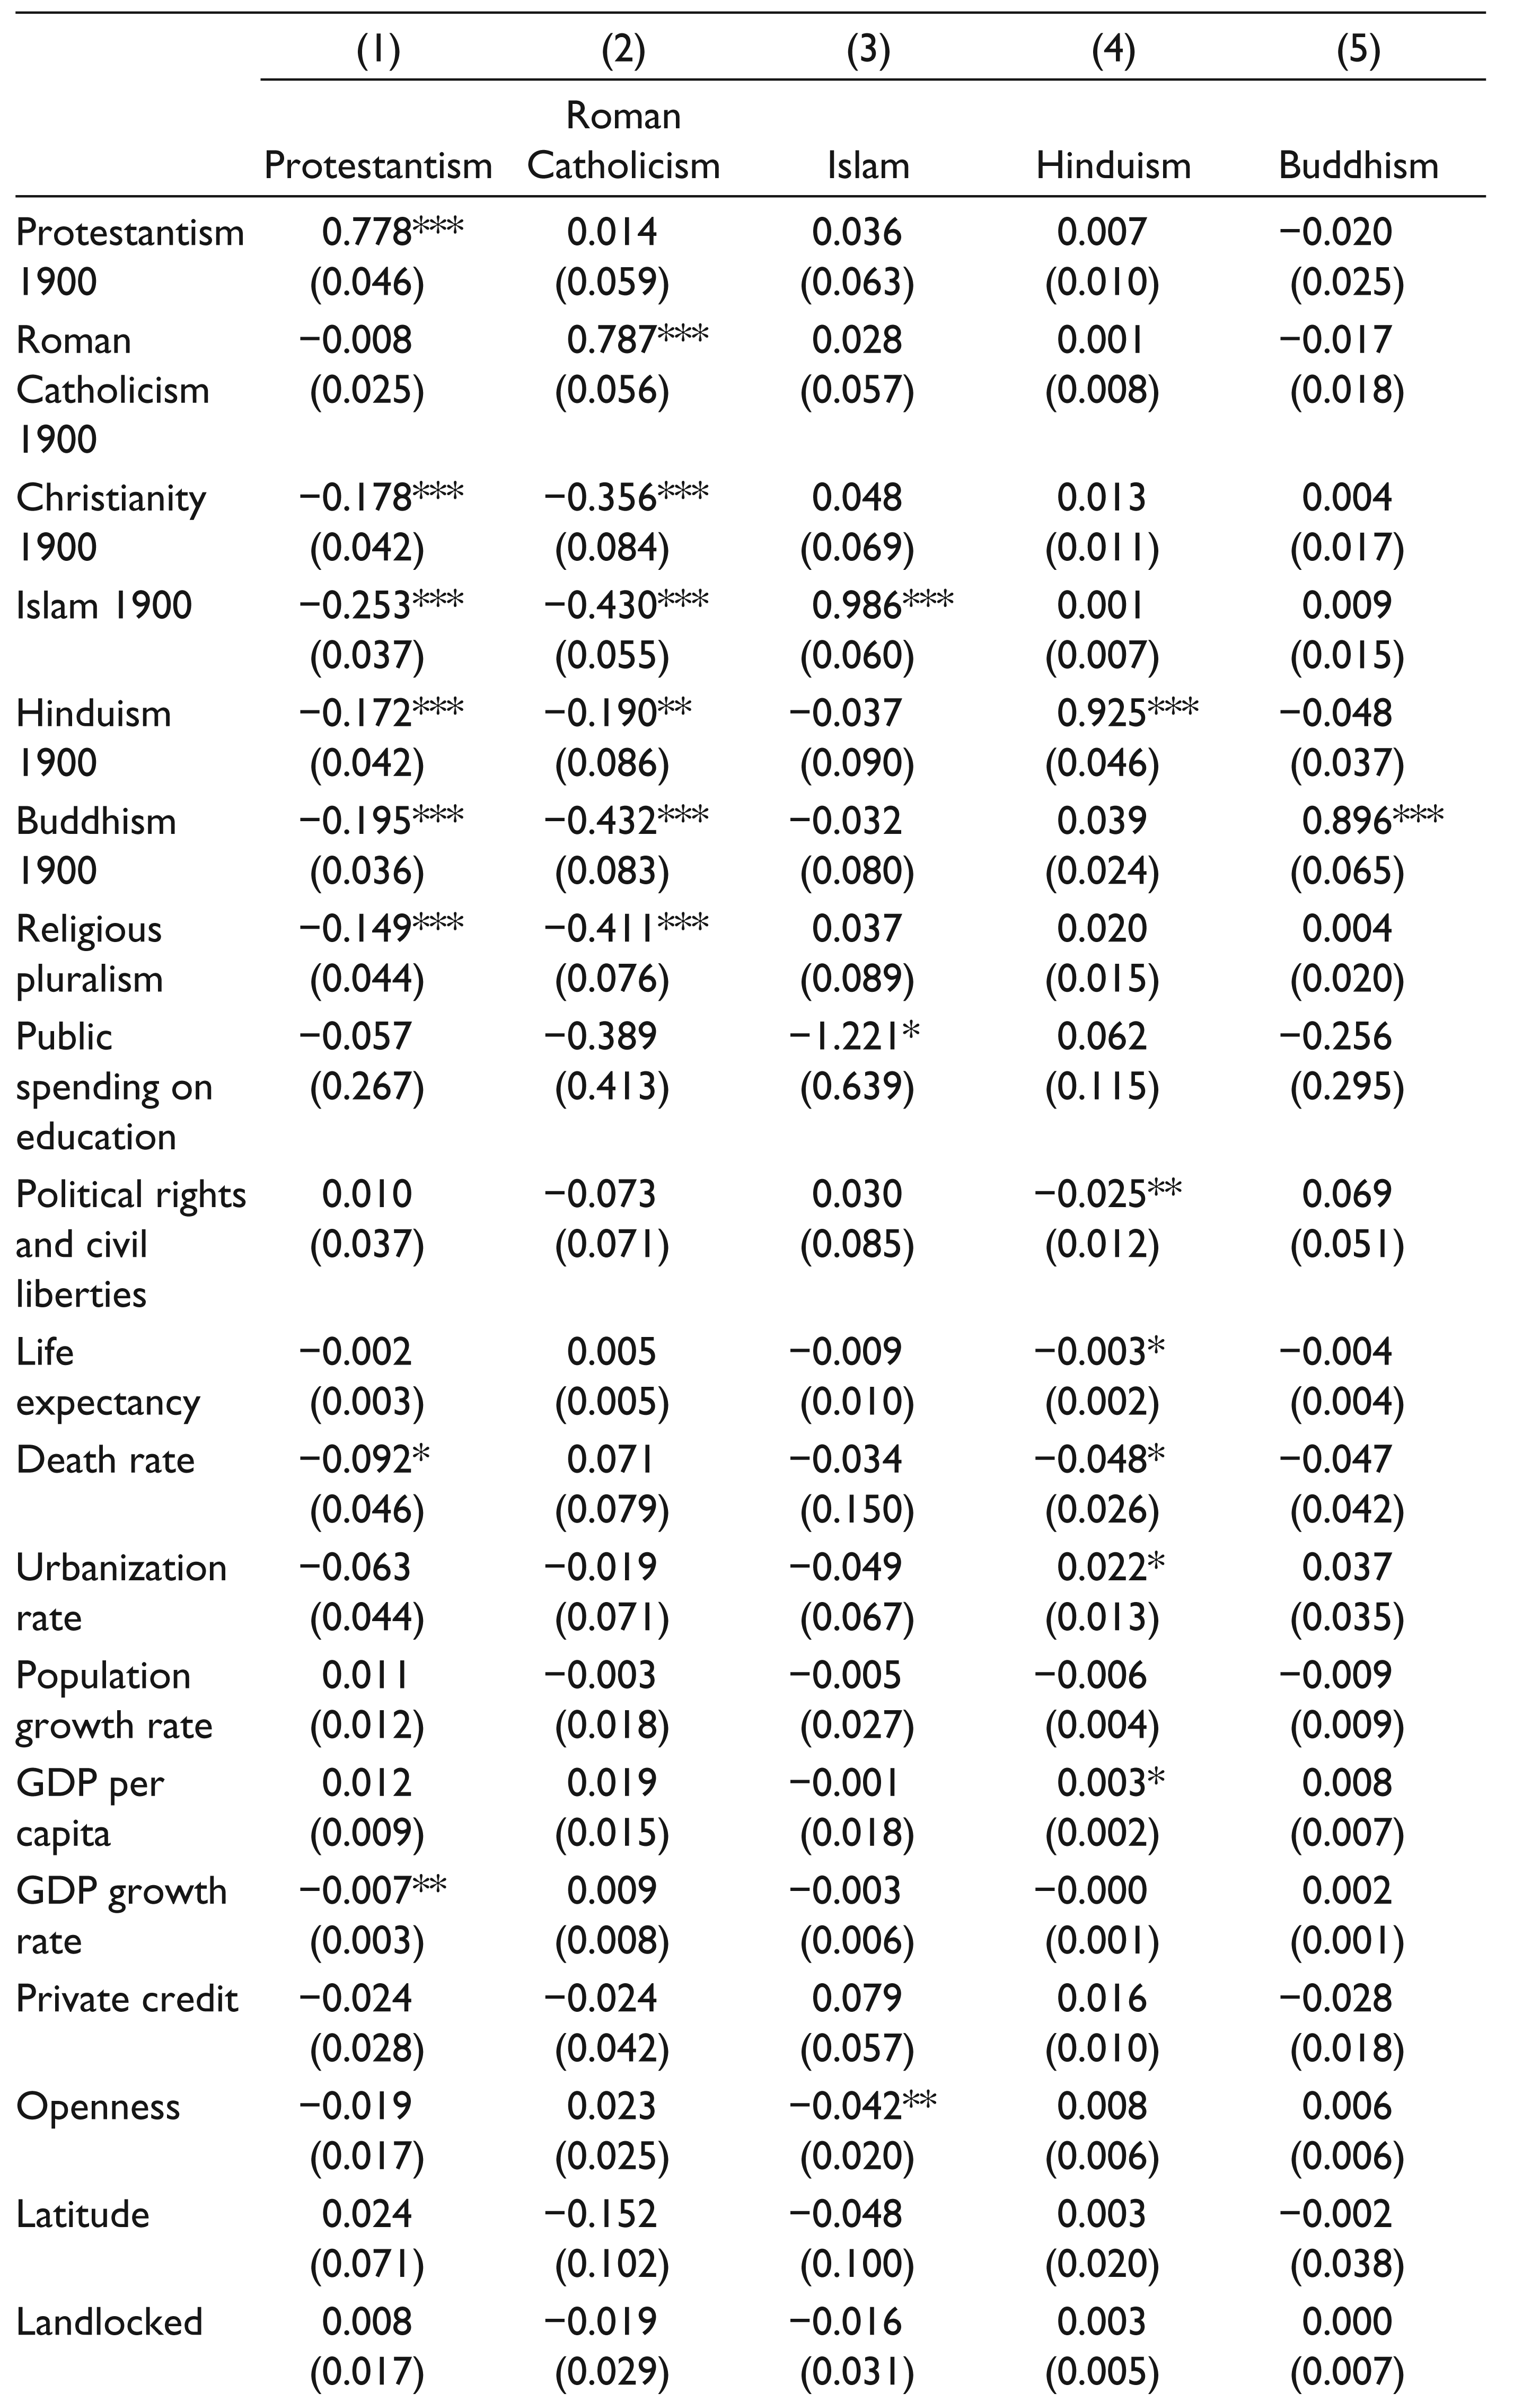
Causality may not only run from religion to education but also vice versa. Several studies using individual-level data find education to affect religiosity. 7 Although there are no studies using country-level data that find education to affect religion adherence, endogeneity of our religion adherence variables cannot be ruled out. To account for reverse causality and other aspects of endogeneity, we instrument these variables, thus extracting their exogenous components. As excluded instruments we use the population shares of the five religions in 1900 as well the Christian population share in 1900. 8 These variables can plausibly be assumed to be important factors in accounting for religion population shares in 1972–2010 and to have no direct effect on primary enrolment in that period.
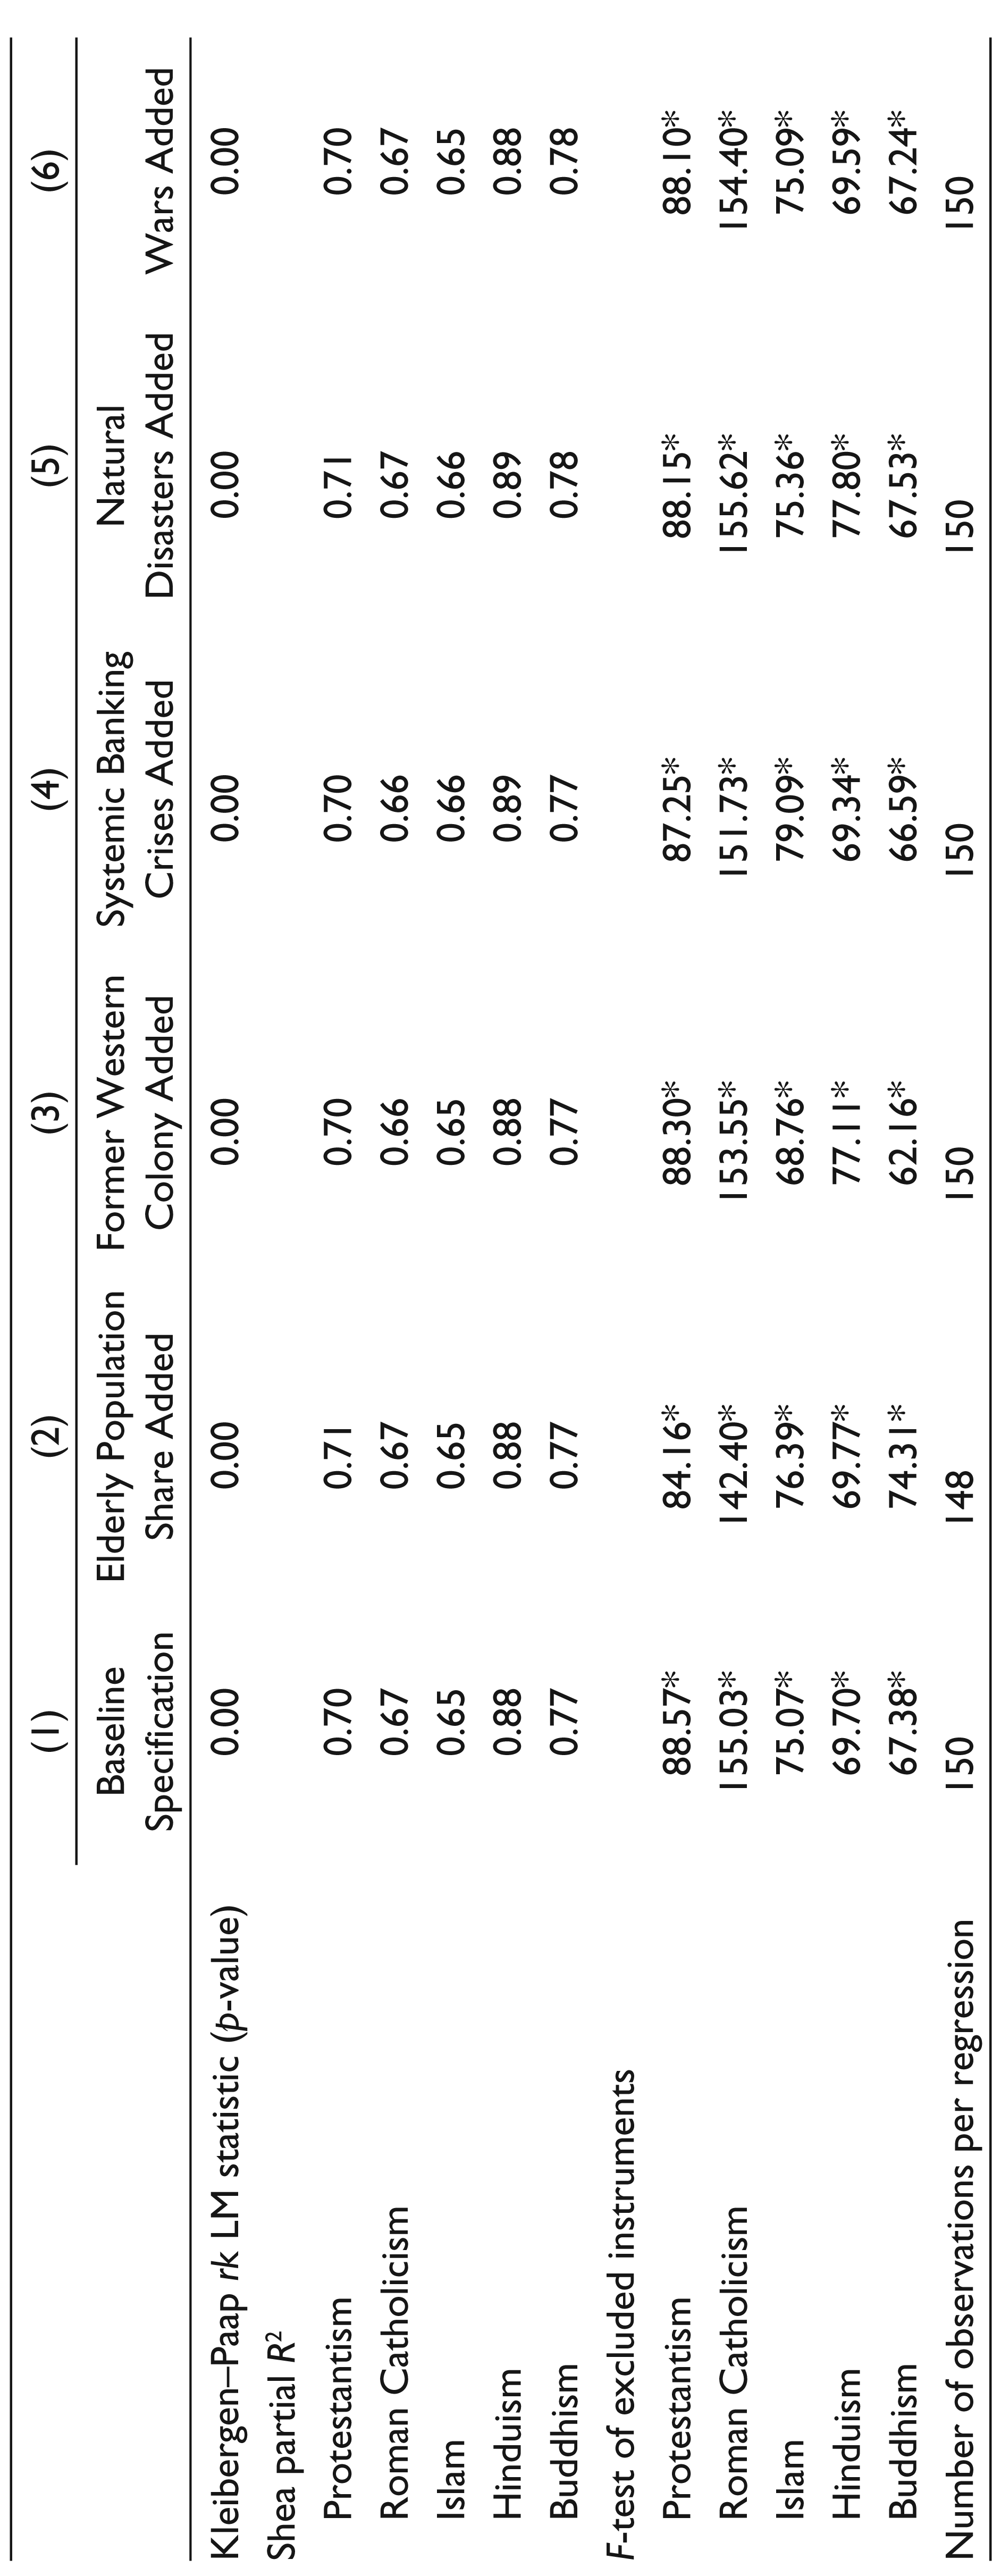
We perform various tests to check whether our excluded instruments are valid. To test for underidentification, we use the Kleibergen–Paap rk LM test (see Kleibergen & Paap, 2006). Its null hypothesis is that the structural equation is underidentified. For each of our specifications, Table 1 reports the p-value from this test. They suggest that the null is rejected throughout, that is, each structural equation is identified.
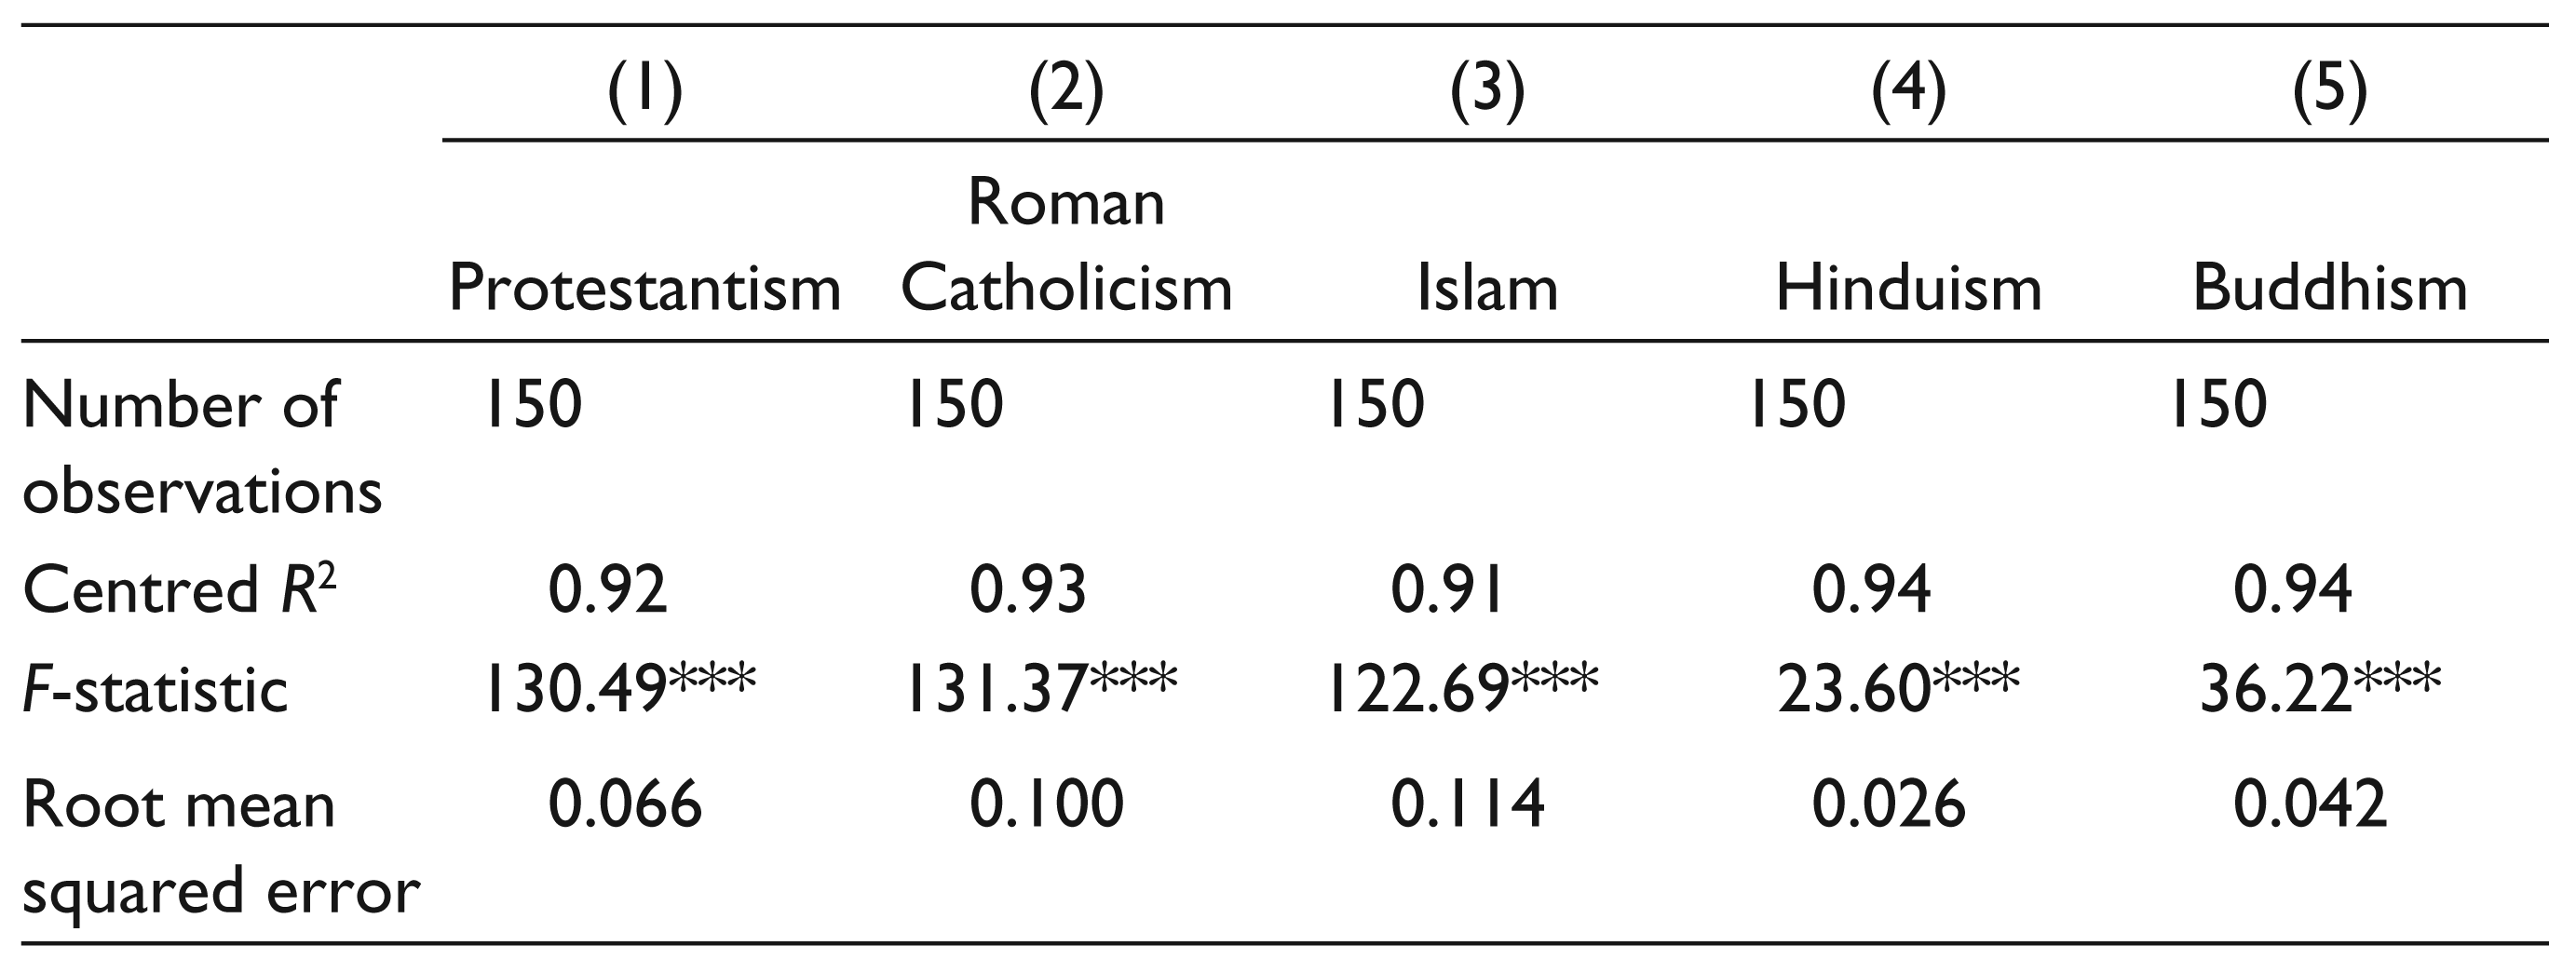
Additionally, we report the Shea (1997) partial R2 statistic (Table 1). It measures the relevance of the excluded instruments, taking intercorrelations among them into account. Whereas small values indicate that the excluded instruments lack sufficient relevance to explain the included endogenous regressors, high values indicate that they are relevant. As shown in Table 1, the Shea values are high for each of our instrumented variables and across all specifications. This suggests that our excluded instruments are relevant.
We also test for instrument relevance by performing an F-test of excluded instruments. The null hypothesis of this test is that the coefficients on these instruments are all zero in the first stage. According to Staiger and Stock’s (1997) rule of thumb, a first-stage F-statistic of less than 10 indicates that the excluded instruments are weak. Conversely, according to this rule of thumb, the instruments are strong if this statistic exceeds 10. In our case, it is well above 10 in each of the first-stage regressions, across all models (Table 1). This, too, suggests that our excluded instruments are relevant.
First-stage Test Statistics
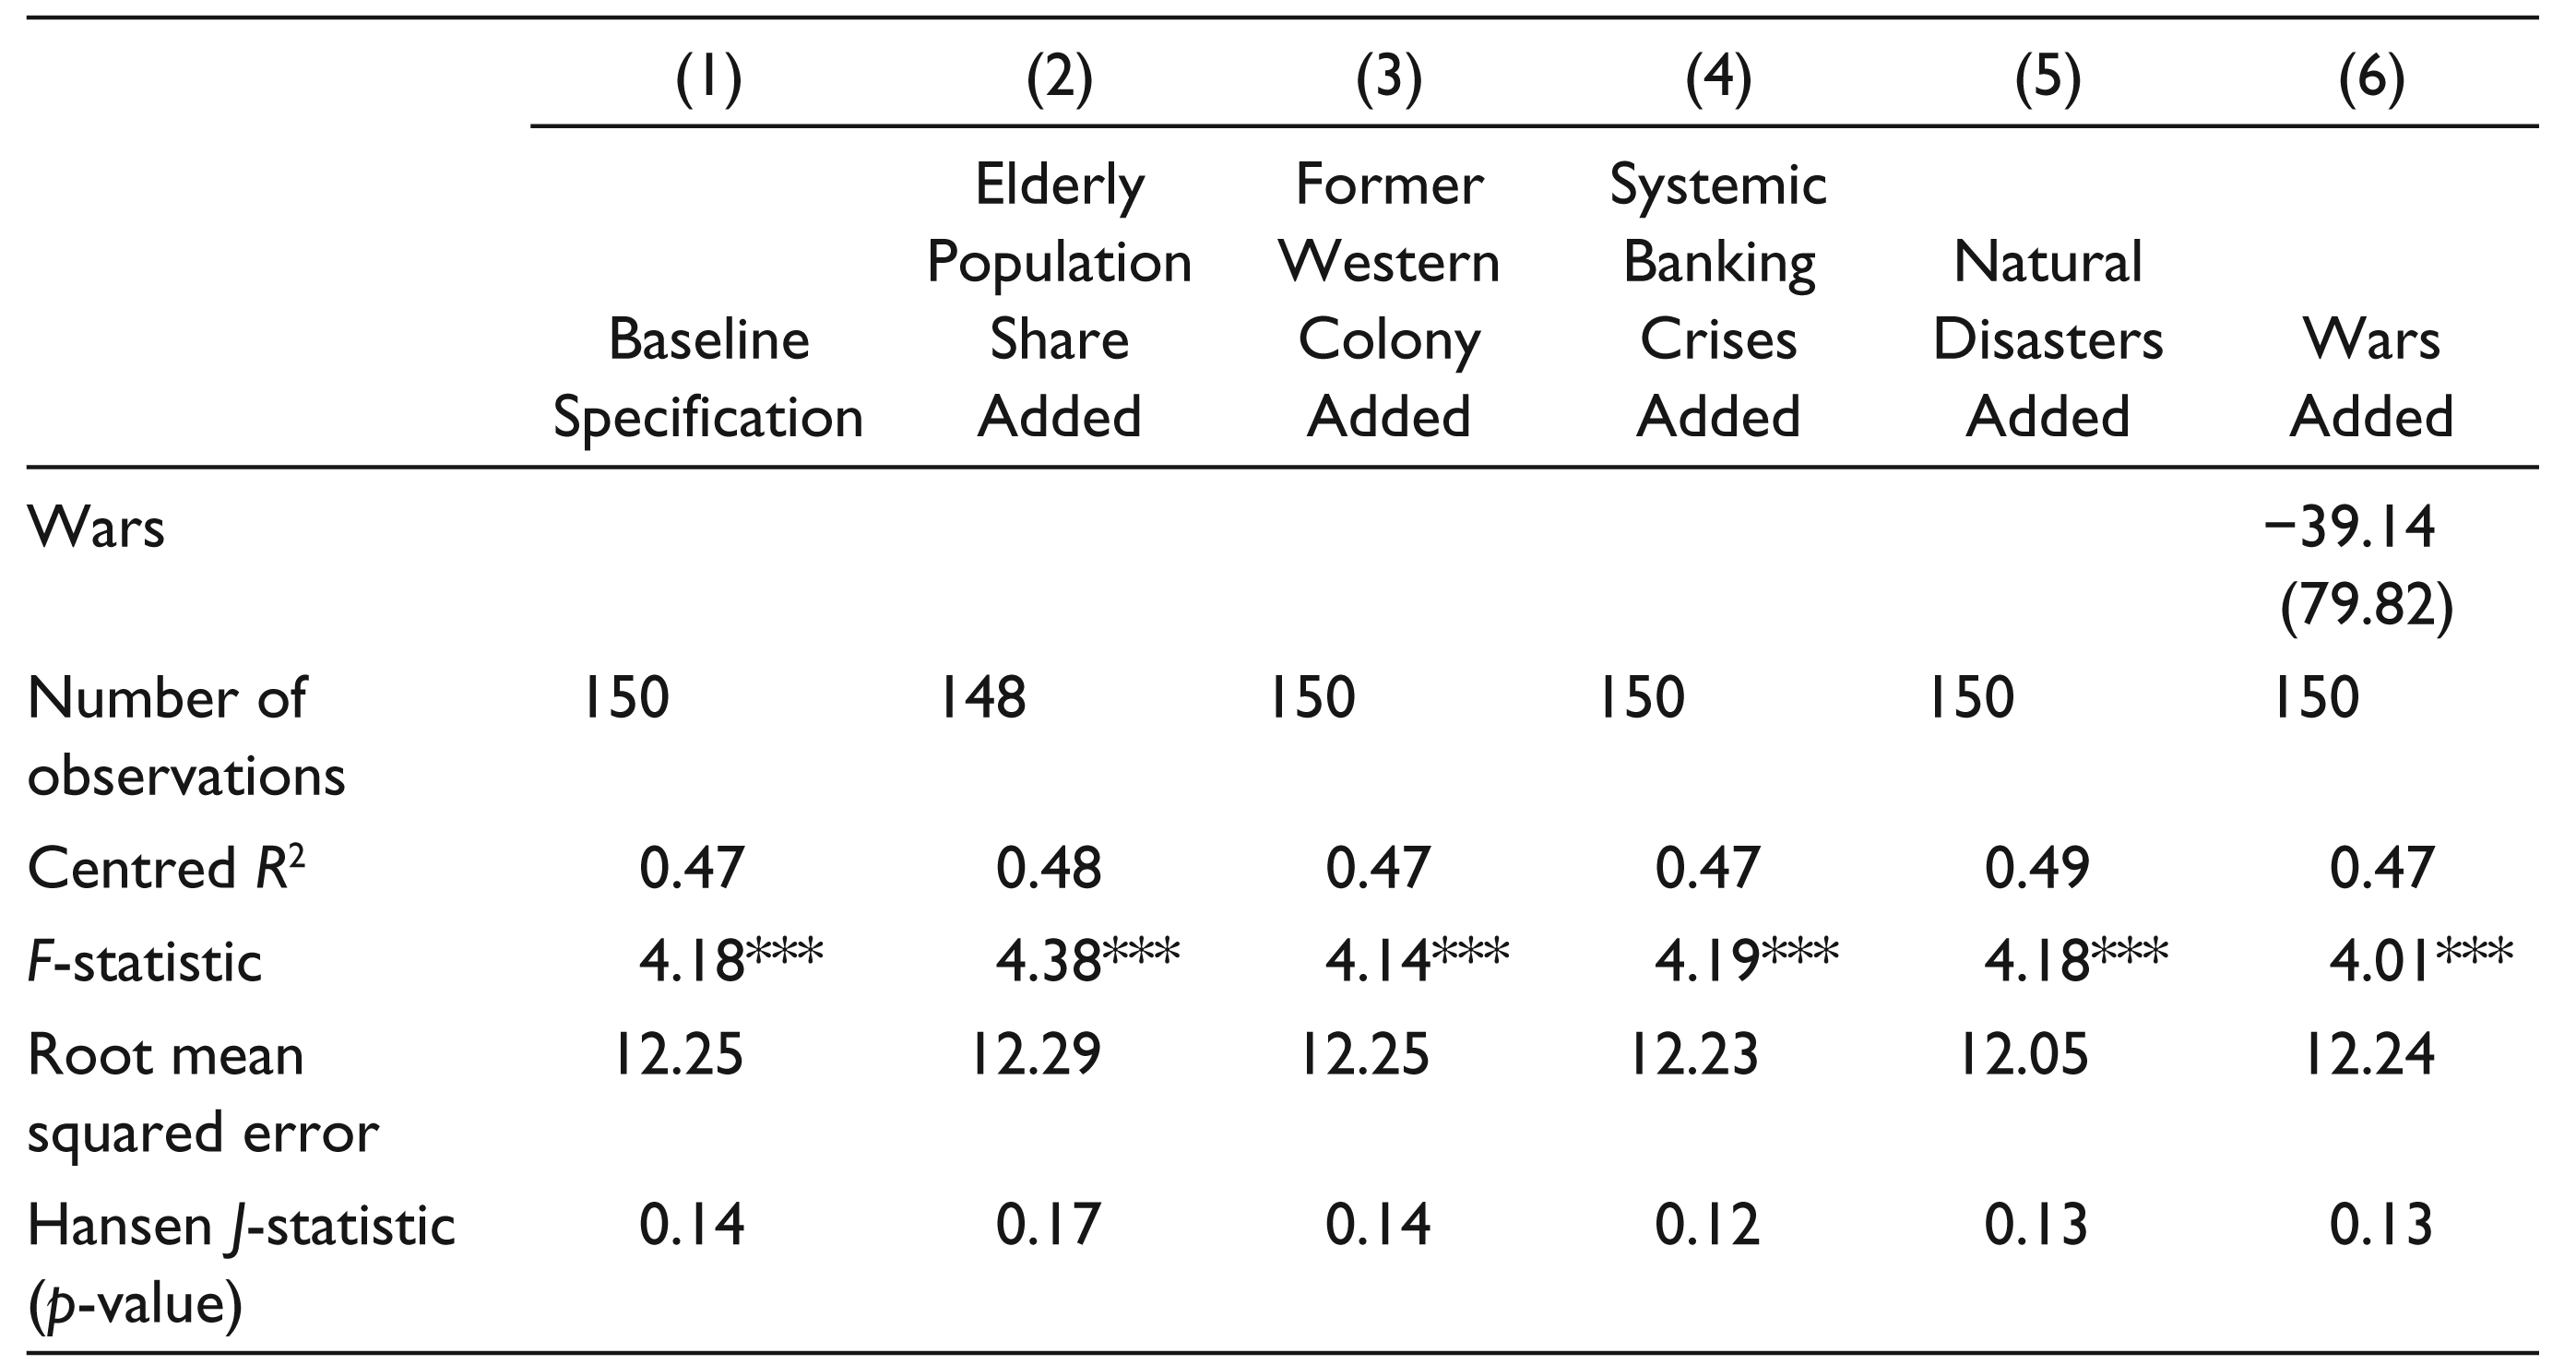
Finally, we test whether our excluded instruments are exogenous. To do so, we apply Hansen’s (1982) test of overidentifying restrictions. The null hypothesis of this test is that all the excluded instruments are exogenous, meaning that they are uncorrelated with the error term of the second-stage regression. As shown in Tables 2 and 3, we fail to reject this hypothesis in each of our models. Taken together, the results from the various tests indicate that our excluded instruments are valid.
Second-stage Regressions of Male Primary Enrolment Rate
Results and Discussion
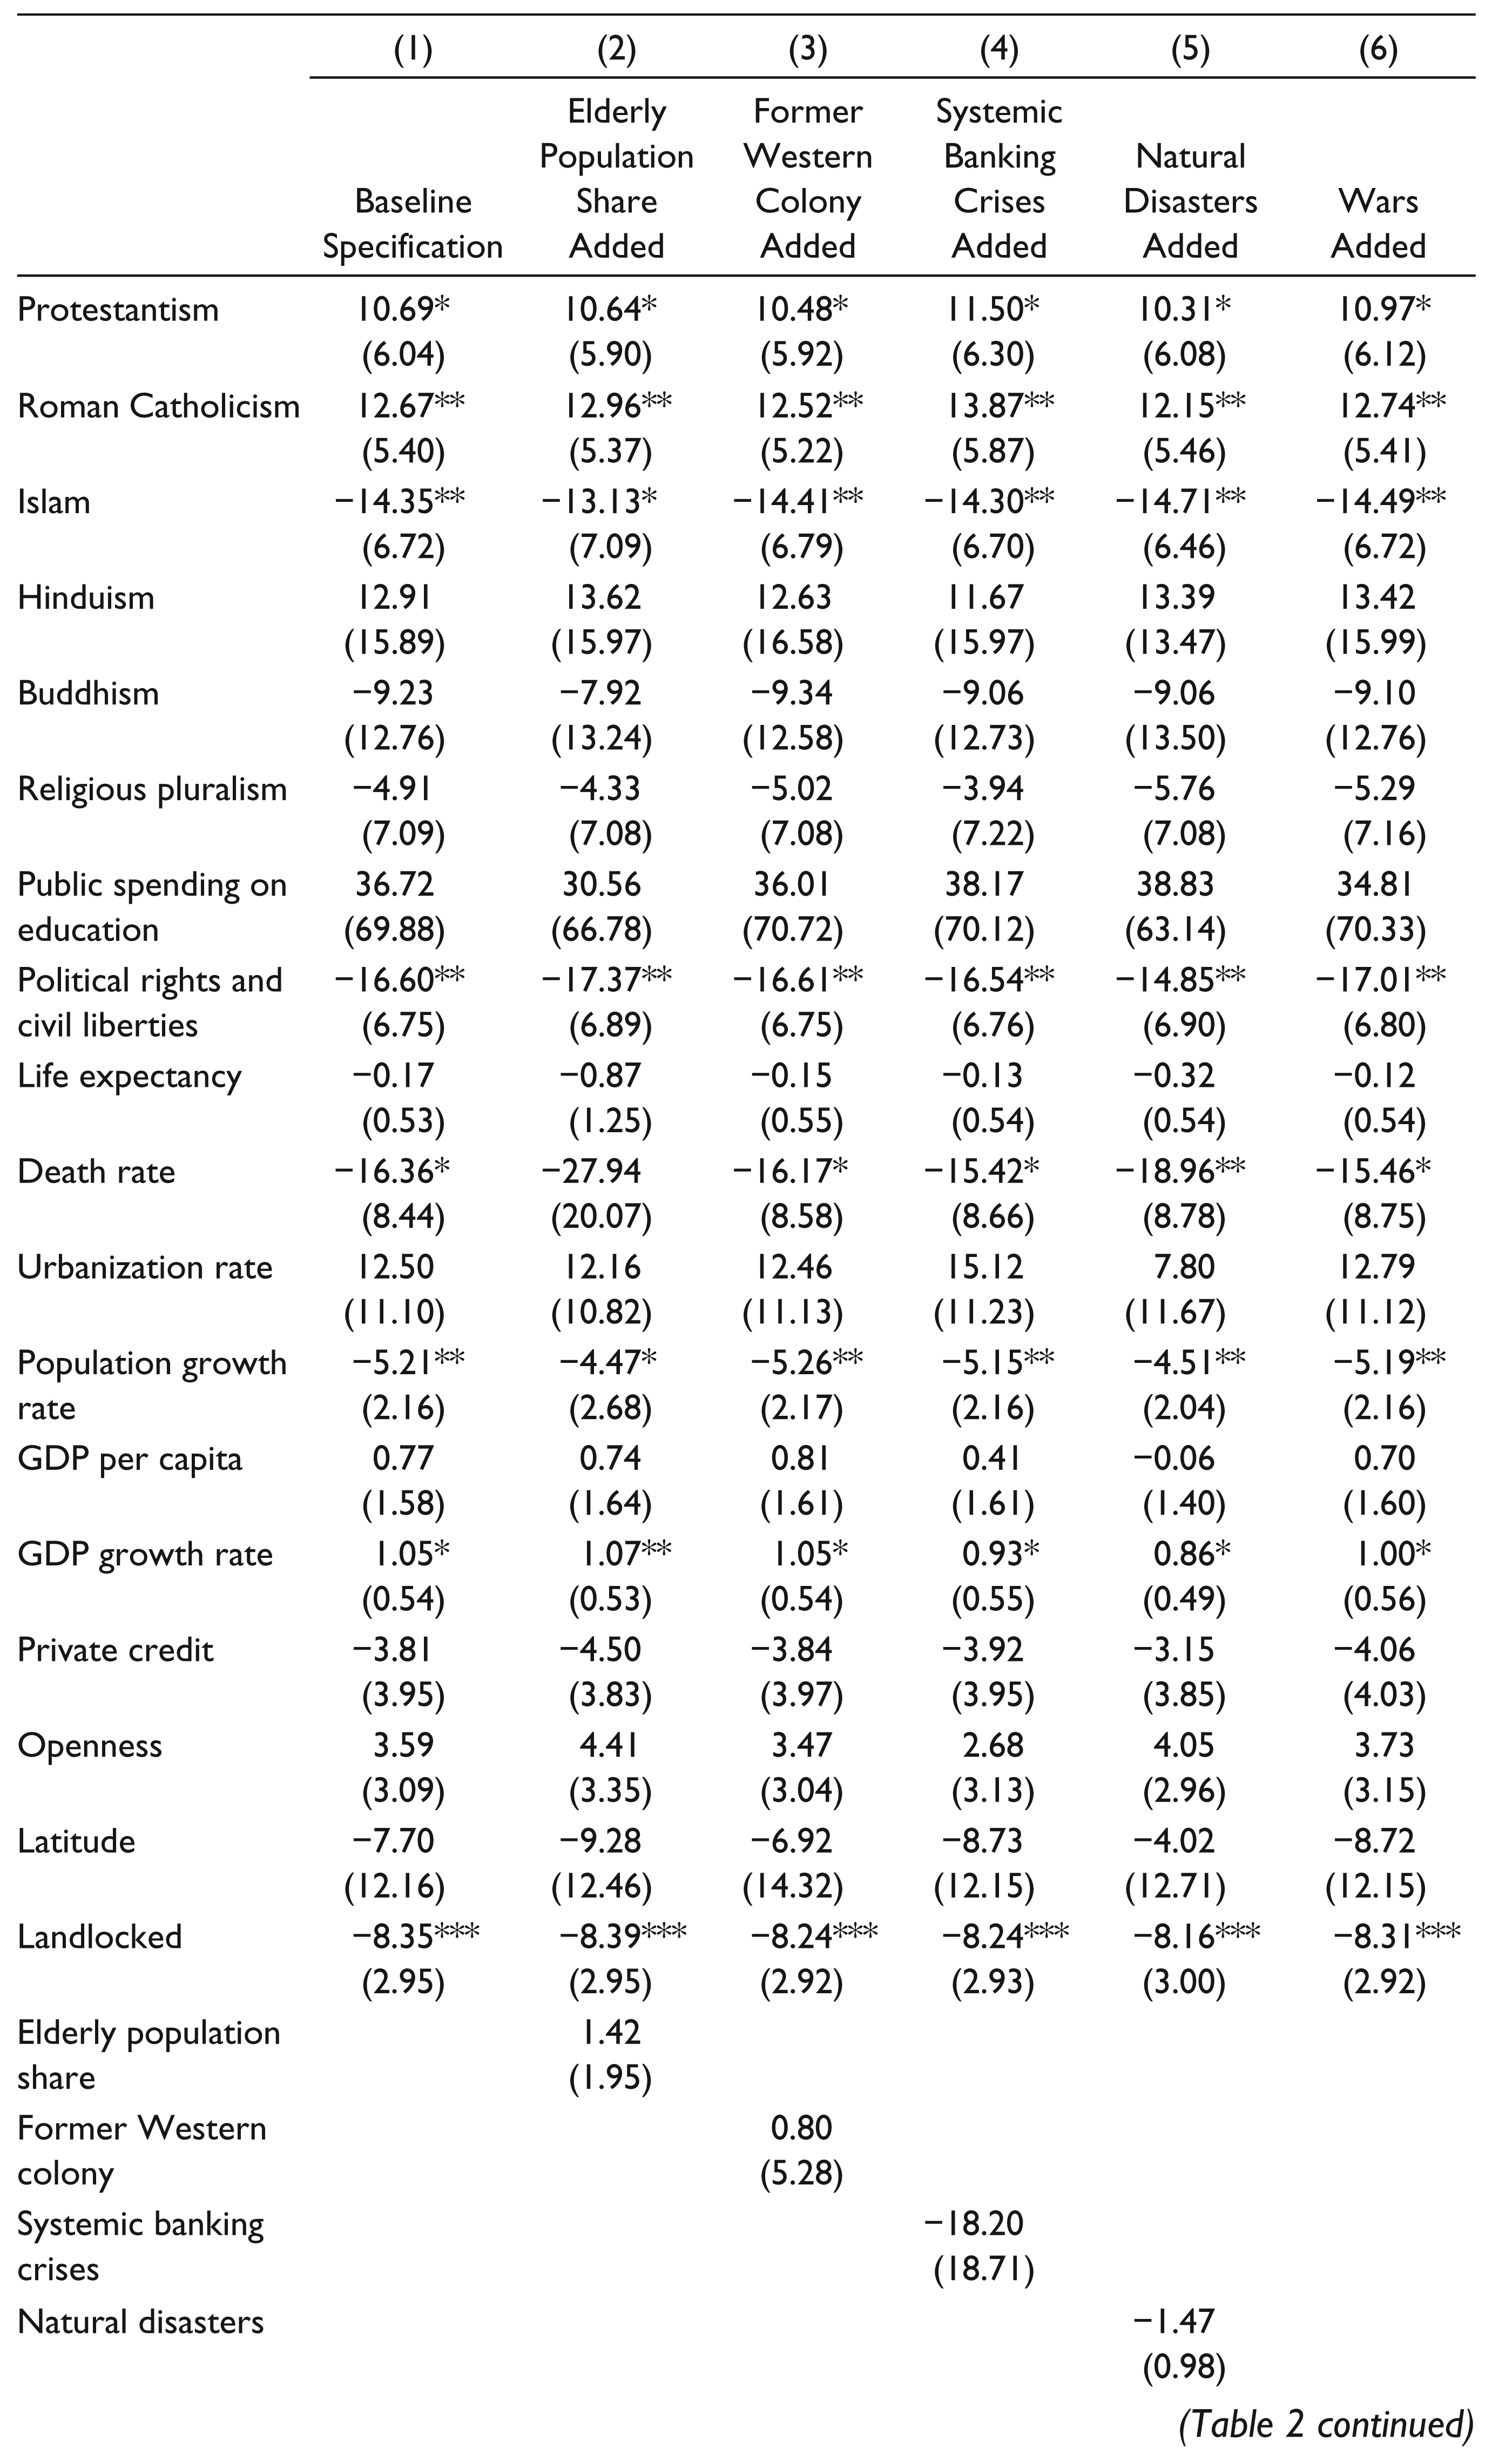
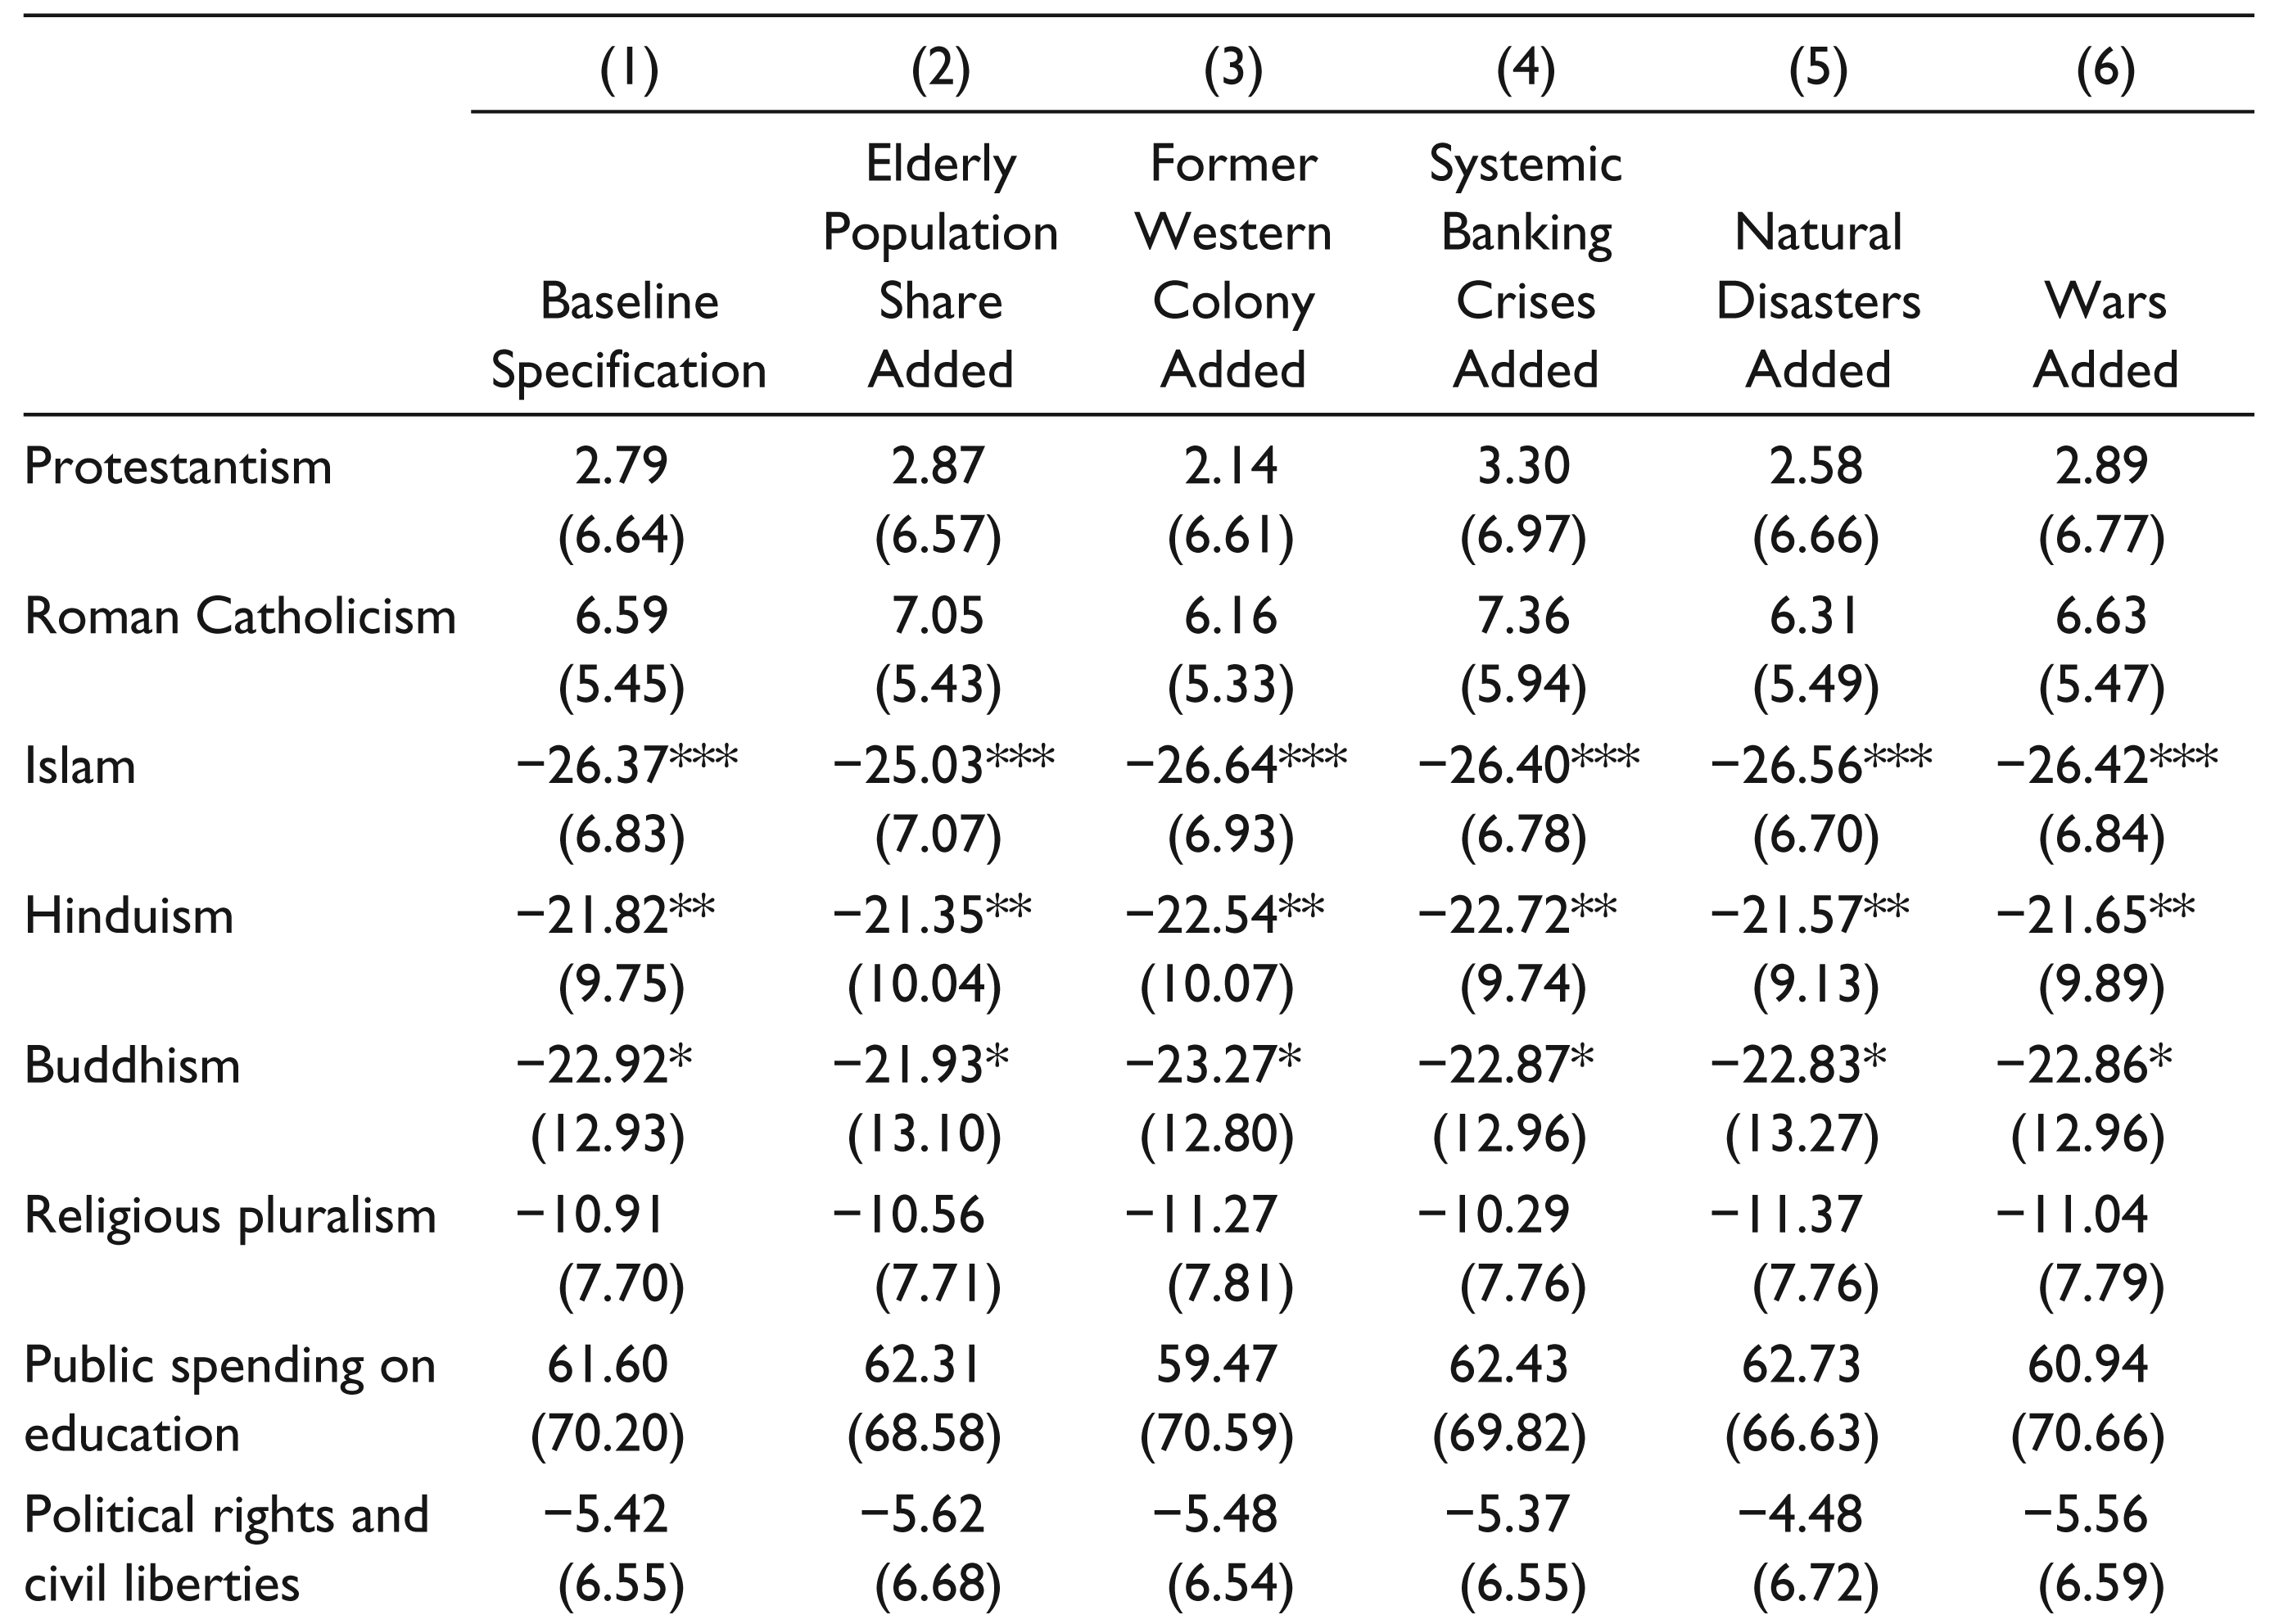
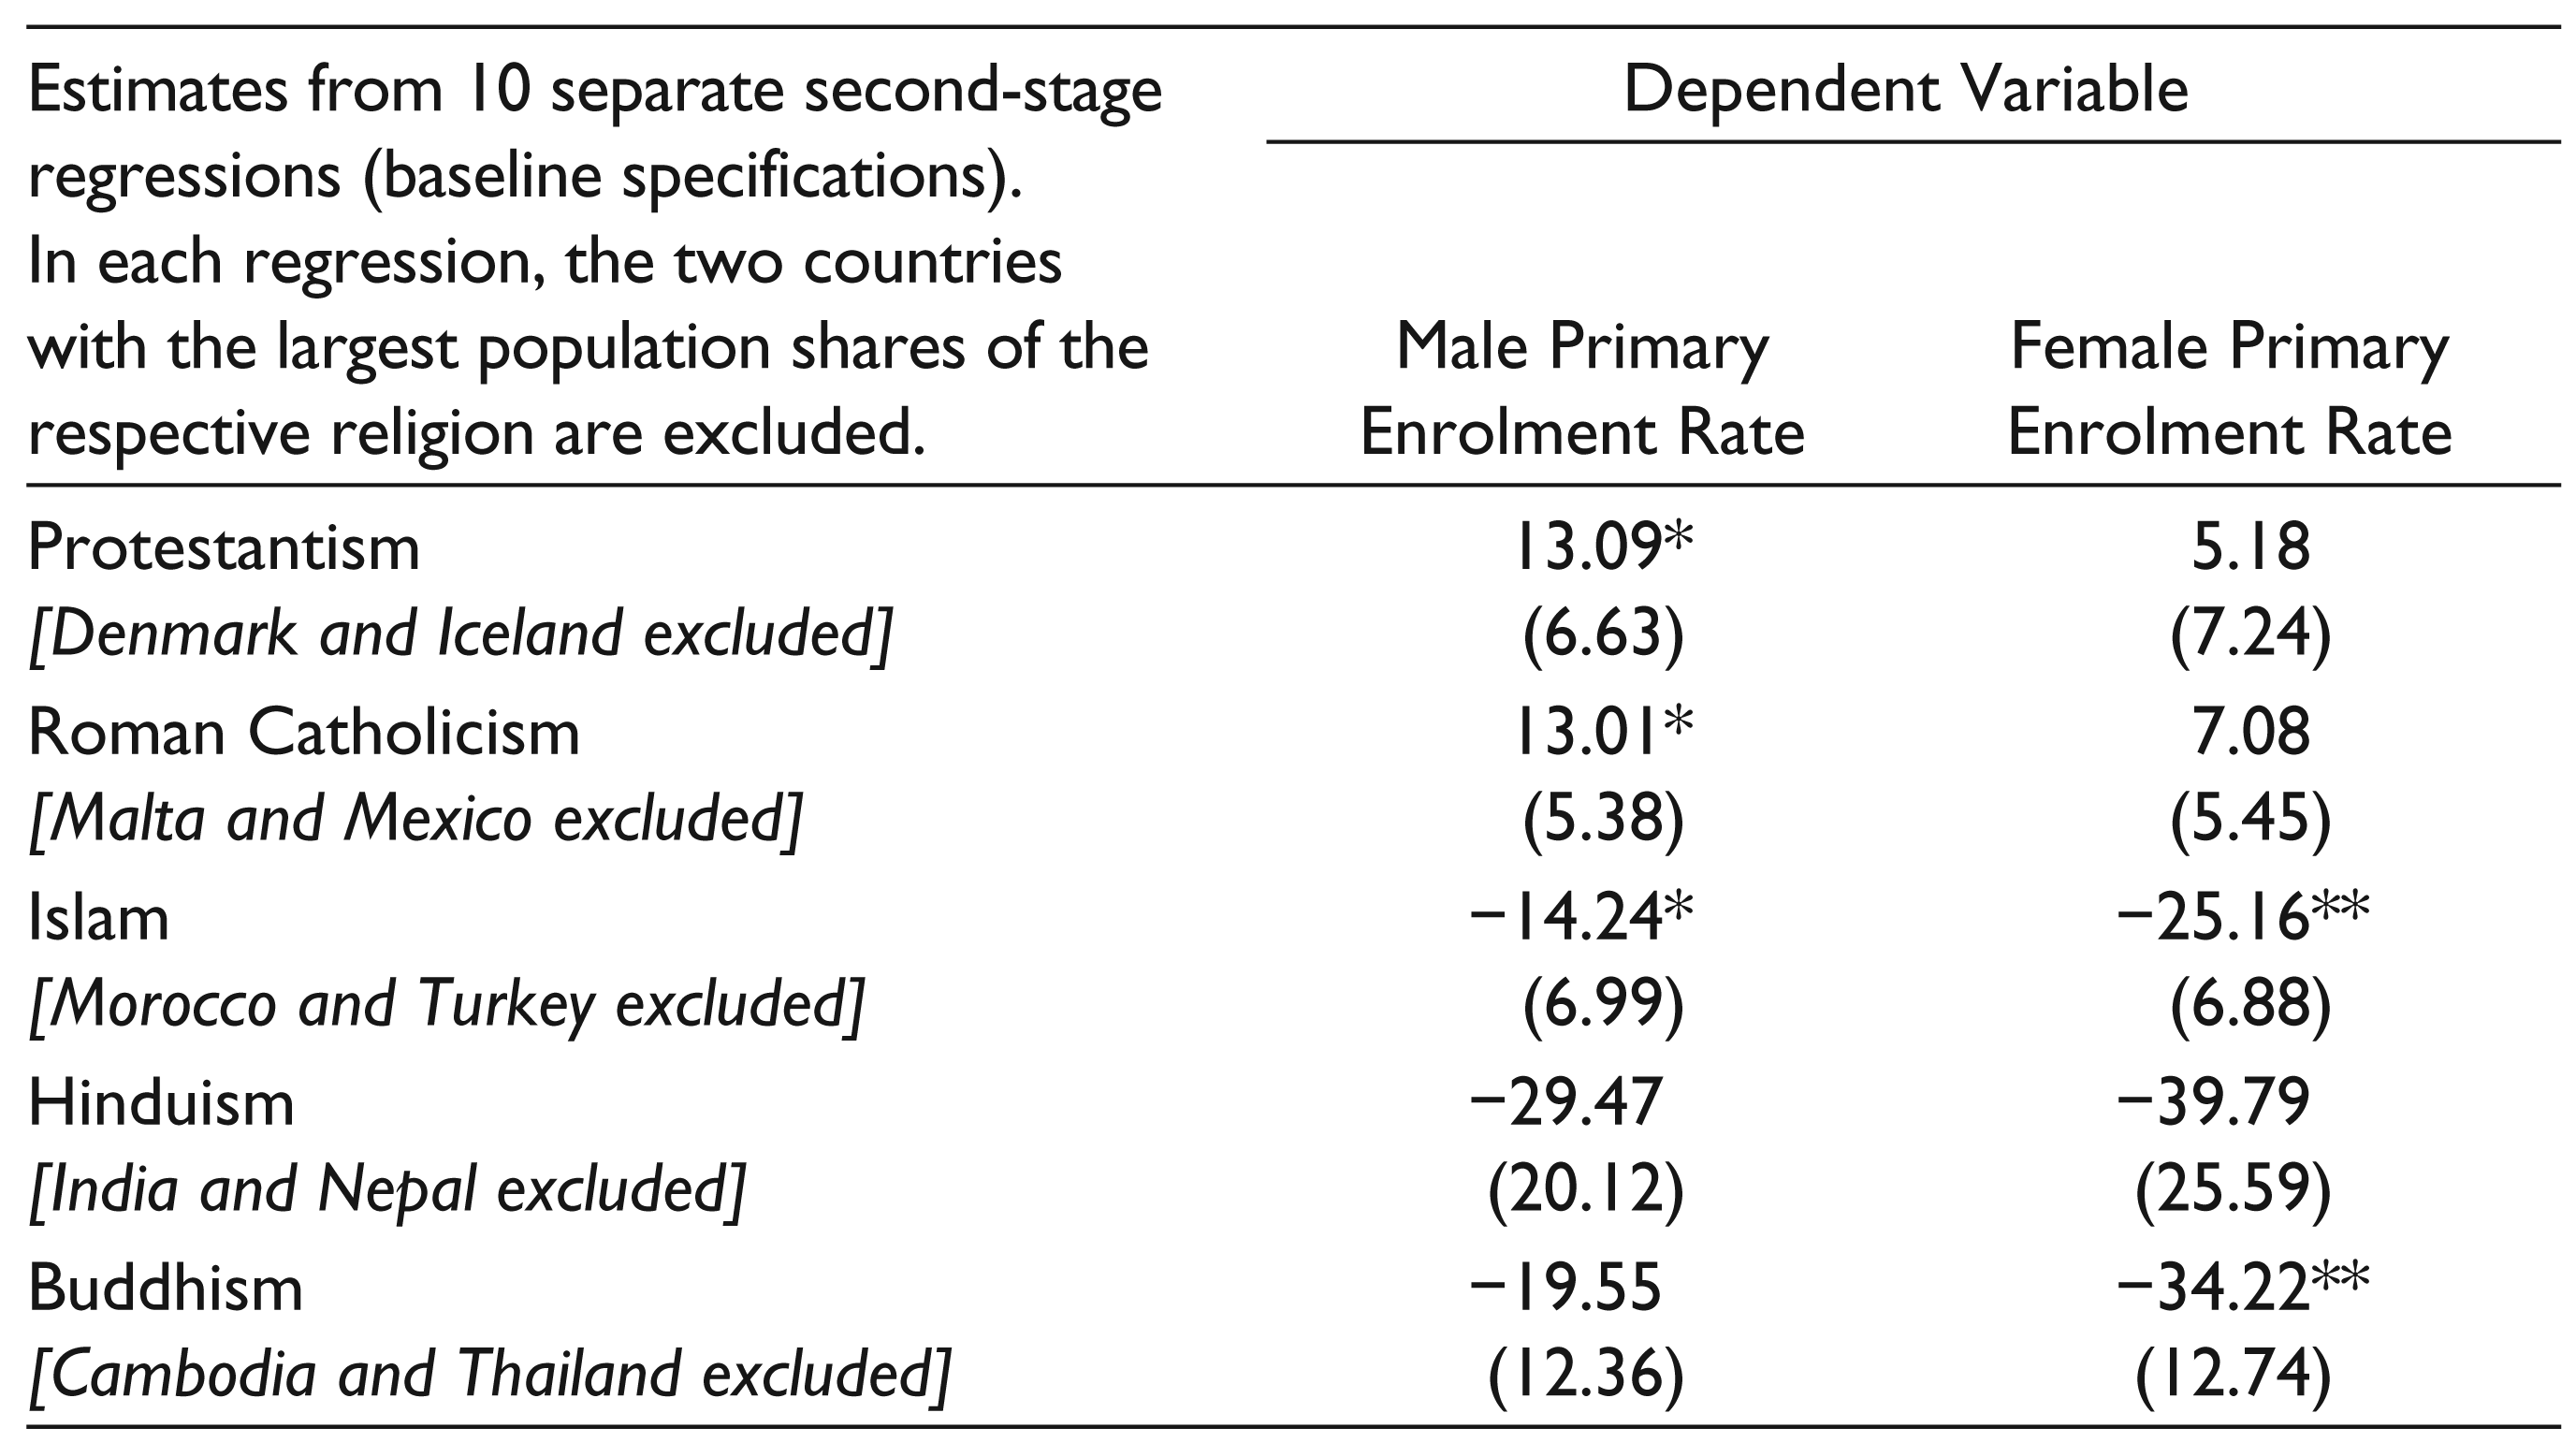
Tables 2 and 3 present the results from our second-stage regressions (for the results from the first-stage regressions of the baseline model, see Appendix B). While Table 2 reports the results for boys, Table 3 reports those for girls. In each of these two tables, column 1 reports the results from our baseline specification while the other columns report the results from our main robustness checks. Table 4 presents the results of an exercise in which we exclude outliers. Specifically, we exclude the two countries with the largest population shares of each of the five religions, one religion at a time, and re-run the baseline regressions. To save space, Table 4 reports only the estimates for the respective religion adherence variable from each of the 10 second-stage regressions.
Second-stage Regressions of Female Primary Enrolment Rate
Outliers Excluded
In all regressions of male primary enrolment rate, the coefficient on Protestantism is positive and significant, indicating that, over the sample period, this religion had a positive effect on boys’ primary education. According to our estimates, the magnitude of the effect was small but noticeable. For example, countries in which the Protestant population share was 10 percentage points higher than in other countries had a male primary enrolment rate that was a good 1 percentage point higher, ceteris paribus. By contrast, the coefficient on Protestantism is statistically insignificant in the regressions of female primary enrolment rate. The positive and significant result for boys is unsurprising. Protestantism has always advocated education (Boyd & King, 1975). Intriguingly, Protestantism’s positive influence on educational provision is still visible, although, compared with countries dominated by other religions, in all traditionally Protestant countries secularization of education started much earlier and was more encompassing, and in most of them the fall in levels of religiosity since the mid-twentieth century was steeper (Hans, 1967; Mitchell, 1993). In all traditionally Protestant countries and in many former British colonies, this religion’s emphasis on education has long become part of the national culture (Feldmann, 2018). As Protestantism has always advocated that girls should receive an education equal to that of boys (Bowen, 1975; Boyd & King, 1975), our insignificant estimate for this gender comes at a surprise. It may be due to the fact that in developing countries even in the recent past, traditional gender roles, which disadvantage girls, have still trumped Protestantism’s call to educate them (Foster Carroll, 1983).
The estimates for the Roman Catholicism variable are similar to those for Protestantism, that is, they are positive and significant for boys but insignificant for girls. Again, the size of the estimated effect on boys is small but noticeable, a 10 percentage point higher Catholic population share being on average associated with a 1.3 percentage point higher male primary enrolment rate, ceteris paribus. In contrast to Protestantism, not only the effect on boys but also the effect on girls is in line with expectations. For centuries, the Roman Catholic Church has neglected girls’ education (Bowen, 1981). Only in the mid-1960s did it concede that they should be allowed to acquire an education equal to that of boys (Foster Carroll, 1983). During our sample period, this more modern, official view did not yet have a visible effect globally—probably because in traditional Catholic countries (especially in southern Europe and Latin America), the entrenched neglect of female education has still persisted to some degree (Albisetti, Goodman, & Rogers, 2010; Foster Carroll, 1983), though not enough as to lead to a negative effect in our estimation. The positive effect on boys is probably due to a combination of two factors. First, the Roman Catholic Church has traditionally focused its educational provision and policy on this gender. Second, since Pope Pius XI’s encyclical letter Divini Illius Magistri of 1929 and particularly since the Second Vatican Council of the 1960s, it has finally backed governmental efforts to substantially expand educational provision (Elias, 2002; Fleming, 2006).
In line with the previous literature, we find Islam to have a substantial negative effect on girls’ primary education. Specifically, countries in which the share of Muslims in the population was 10 percentage points higher than in other countries had a female primary enrolment rate that was about 2.6 percentage points lower, ceteris paribus. Obviously, during our sample period, the traditional Muslim disregard of female education still held sway (Ibrahim, 2011; Jawad, 1998; Smith, 1987), negatively affecting female education even at the basic level. Interestingly, during our sample period, Islam also had a negative effect on the primary education of boys—though the magnitude was much smaller. Specifically, a 10 percentage point higher Muslim population share is on average correlated with a 1.4 percentage point lower male primary enrolment rate, ceteris paribus. The fact that, according to our estimates, Islam has negative effects not only on girls’ but also on boys’ primary education suggests that during our sample period, this religion’s often hostile view of knowledge and education, especially the secular kind, still had an adverse impact—despite strenuous efforts made by governments in all Muslim countries since the mid-twentieth century to expand education (Megahed, 2011; Shamsavary, Saqeb, & Halstead, 1993).
According to our results, Hinduism has no statistically significant effect on the enrolment of boys. This probably reflects that, since independence, governments in most Hindu countries have aimed to exclude religious considerations from educational policies and provision (Sebaly, 1993; Sharma, 1987). In most of our regressions, there is a negative effect on girls though, with a 10 percentage point larger Hindu population share being correlated with a female primary enrolment rate that is about 2.2 percentage points lower, ceteris paribus. The negative effect on girls may reflect that over the 1972–2010 period, it was still common in Hindu societies to provide less education for them (Foster Carroll, 1983; Sheshagiri, 2011). On balance, the conservative attitudes prevalent in many Hindu families appear to have outweighed governments’ efforts in recent decades to improve the education of girls (Sebaly, 1993; Sheshagiri, 2011). However, the coefficient on Hinduism in female regressions is insignificant when excluding India and Nepal, the countries with by far the largest Hindu population shares, which suggests that the negative influence is largely limited to these two countries.
Similar to the case of Hinduism, the estimates for the Buddhism variable are insignificant for boys but significant and negative for girls. Here, too, the magnitude of the negative effect on girls is substantial. According to most of our results, countries in which the Buddhist population share was 10 percentage points larger had a female primary enrolment rate that was about 2.3 percentage points lower, ceteris paribus. When excluding the two countries with the largest Buddhist population shares (Cambodia and Thailand), the magnitude is larger still (and more precisely estimated). The negative effect on girls is inconsistent with Buddha’s view that girls have the same right to education as boys (Foster Carroll, 1983; Gamage, 2011). Attitudes among the contemporary Buddhist population are more conservative in this regard (Fox & Gamage, 2011; Gamage & Setunga, 2011), which appears to have been more decisive. The insignificant estimate for boys is likely to be due to the fact that in most Buddhist countries, over the last few decades governments have largely excluded religious considerations from educational policies and provision, similar to Hindu countries (Fox & Gamage, 2011; Gamage & Setunga, 2011).
Finally, let us briefly comment on the estimates for the control variables (Tables 2 and 3). Several of them accord with the previous literature. For example, we find both the death rate and the population growth rate to be negatively correlated with the male as well as with the female enrolment rate. We also find more open economies to have a higher female enrolment rate and landlocked economies to have a lower male enrolment rate. This is probably due to the fact that while more openness to the global economy increases earning opportunities and thus returns to schooling, being landlocked reduces them. The insignificant results for some of the other variables are also in line with some of the previous literature. For example, various previous papers find neither public education spending nor urbanization to significantly affect school enrolment.
Conclusion
Although primary education has been compulsory in most countries for at least several decades, our regression results suggest that the largest world religions have still been able to influence the extent of education at this level in the recent past. Specifically, whereas Protestantism and Catholicism had a positive effect on the male primary enrolment rate, Hinduism and Buddhism had a negative effect on the female primary enrolment rate. Islam had a negative effect on both. While the magnitude of the estimated effects is small for boys, it is quite substantial for girls, particularly the negative effect of Islam.
Our results are robust to endogeneity of all five religion adherence variables. They are also robust to numerous controls and variations in specification. As pointed out in the Introduction, our article goes beyond almost all previous studies in several respects—most importantly by using data from a large country sample over a long sample period, by including numerous controls and by instrumenting for religion adherence.
Although our results are robust and our article adds to the literature in several ways, more research is clearly warranted. Most importantly, the ways in which the various world religions nowadays affect the demand for and the supply of schooling need to be systematically studied. Furthermore, the historical legacies of the various world religions need to be better disentangled from their contemporary ability to affect education. As primary education is of fundamental importance for economic and social development, a better understanding of the influences that world religions still exert today is an important issue for future research. Obviously, it is also important for educational policy.
Declaration of Conflicting Interests
The author declared no potential conflicts of interest with respect to the research, authorship and/or publication of this article.
Funding
The author received no financial support for the research, authorship and/or publication of this article.
Footnotes
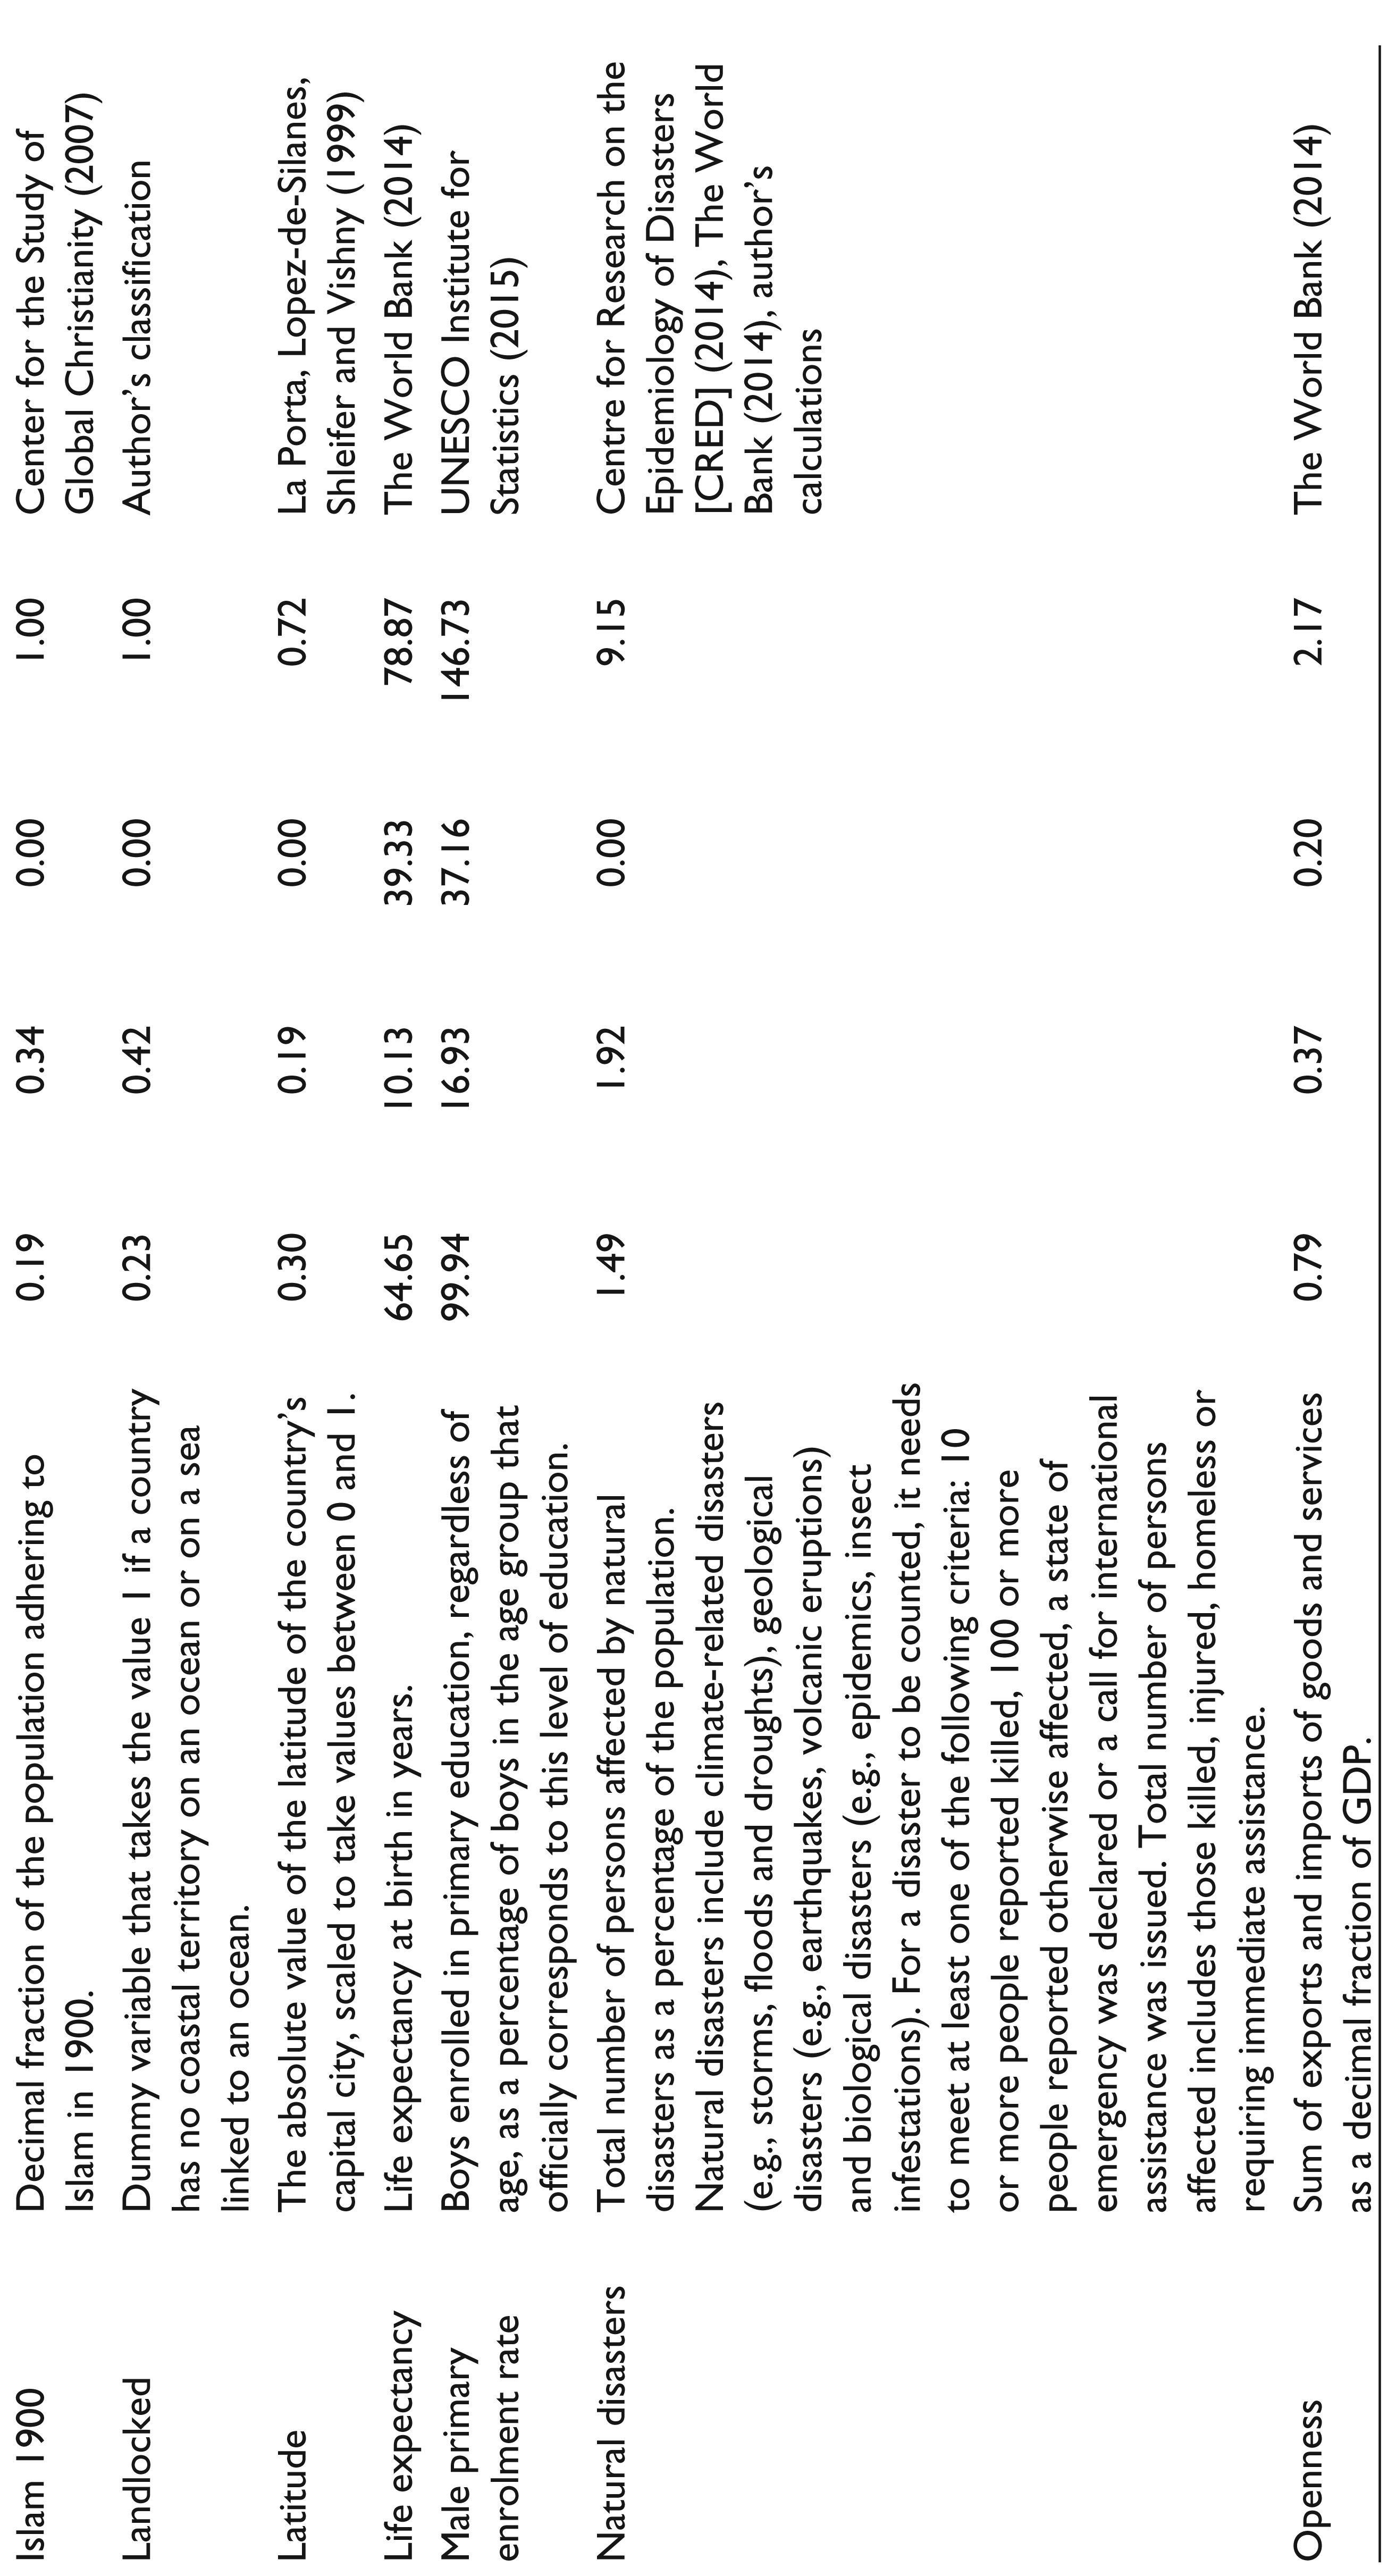
List of Variables
| Definition | Mean | Std. Dev. | Min. | Max. | Source | |
| Buddhism | Decimal fraction of the population adhering to Buddhism. | 0.04 | 0.16 | 0.00 | 0.89 | Maoz and Henderson (2013a) |
| Buddhism 1900 | Decimal fraction of the population adhering to Buddhism in 1900. | 0.04 | 0.17 | 0.00 | 0.95 | Center for the Study of Global Christianity (2007) |
| Christianity 1900 | Decimal fraction of the population adhering to Christianity in 1900. | 0.49 | 0.46 | 0.00 | 1.00 | Center for the Study of Global Christianity (2007) |
| Death rate | Number of deaths per 100 people. | 1.05 | 0.42 | 0.34 | 2.41 | The World Bank (2014) |
| Elderly population share | Population ages 65 years and older as a percentage of the total population. | 6.71 | 4.30 | 2.08 | 16.92 | The World Bank (2014) |
| Female primary enrolment rate | Girls enrolled in primary education, regardless of age, as a percentage of girls in the age group that officially corresponds to this level of education. | 93.12 | 21.42 | 24.49 | 143.79 | UNESCO Institute for Statistics (2015) |
| Former Western colony | Dummy variable that takes the value 1 if the respective country is a former Western overseas colony. | 0.62 | 0.49 | 0.00 | 1.00 | Author’s classification |
| GDP growth rate | Annual percentage growth rate of real GDP. | 3.61 | 2.10 | −1.35 | 18.02 | IMF (2014), The World Bank (2014) |
| GDP per capita | Expenditure side real GDP per capita at chained purchasing power parity rates, in tens of thousands of 2005 US dollars. | 0.88 | 0.96 | 0.05 | 5.68 | Feenstra, Inklaar and Timmer (2013), author’s calculations |
| Hinduism | Decimal fraction of the population adhering to Hinduism. | 0.02 | 0.10 | 0.00 | 0.77 | Maoz and Henderson (2013a) |
| Hinduism 1900 | Decimal fraction of the population adhering to Hinduism in 1900. | 0.02 | 0.11 | 0.00 | 0.82 | Center for the Study of Global Christianity (2007) |
| Islam | Decimal fraction of the population adhering to Islam. | 0.22 | 0.34 | 0.00 | 0.99 | Maoz and Henderson (2013a) |
| Islam 1900 | Decimal fraction of the population adhering to Islam in 1900. | 0.19 | 0.34 | 0.00 | 1.00 | Center for the Study of Global Christianity (2007) |
| Landlocked | Dummy variable that takes the value 1 if a country has no coastal territory on an ocean or on a sea linked to an ocean. | 0.23 | 0.42 | 0.00 | 1.00 | Author’s classification |
| Latitude | The absolute value of the latitude of the country’s capital city, scaled to take values between 0 and 1. | 0.30 | 0.19 | 0.00 | 0.72 | La Porta, Lopez-de-Silanes, Shleifer and Vishny (1999) |
| Life expectancy | Life expectancy at birth in years. | 64.65 | 10.13 | 39.33 | 78.87 | The World Bank (2014) |
| Male primary enrolment rate | Boys enrolled in primary education, regardless of age, as a percentage of boys in the age group that officially corresponds to this level of education. | 99.94 | 16.93 | 37.16 | 146.73 | UNESCO Institute for Statistics (2015) |
| Natural disasters | Total number of persons affected by natural disasters as a percentage of the population. Natural disasters include climate-related disasters (e.g., storms, floods and droughts), geological disasters (e.g., earthquakes, volcanic eruptions) and biological disasters (e.g., epidemics, insect infestations). For a disaster to be counted, it needs to meet at least one of the following criteria: 10 or more people reported killed, 100 or more people reported otherwise affected, a state of emergency was declared or a call for international assistance was issued. Total number of persons affected includes those killed, injured, homeless or requiring immediate assistance. | 1.49 | 1.92 | 0.00 | 9.15 | Centre for Research on the Epidemiology of Disasters [CRED] (2014), The World Bank (2014), author’s calculations |
| Openness | Sum of exports and imports of goods and services as a decimal fraction of GDP. | 0.79 | 0.37 | 0.20 | 2.17 | The World Bank (2014) |
| Definition | Mean | Std. Dev. | Min. | Max. | Source | |
| Political rights and civil liberties | Average of political rights and civil liberties ratings. Political rights include the right to form political parties, to compete for public office and to elect representatives who have a decisive vote on public policies. Civil liberties include religious, ethnic, economic, linguistic, gender and family rights, personal freedoms and freedom of the press, belief and association. The index, which is based on surveys among analysts and academics, is scaled to range from 0 to 1, with higher values representing more political rights and civil liberties (or more respect for or more protection of political rights and civil liberties). | 0.54 | 0.29 | 0.05 | 1.00 | Freedom House (2014), author’s calculations |
| Population growth rate | Annual percentage growth rate of the population. | 1.67 | 1.08 | −0.33 | 4.45 | The World Bank (2014) |
| Private credit | The financial resources provided to the private sector by deposit money banks and other financial institutions as a decimal fraction of GDP. Domestic money banks comprise commercial banks and other financial institutions that accept transferable deposits, such as demand deposits. | 0.39 | 0.32 | 0.01 | 1.66 | The World Bank (2013) |
| Protestantism | Decimal fraction of the population adhering to Protestantism. | 0.14 | 0.22 | 0.00 | 0.93 | Maoz and Henderson (2013a) |
| Protestantism 1900 | Decimal fraction of the population adhering to Protestantism in 1900. | 0.13 | 0.28 | 0.00 | 0.99 | Center for the Study of Global Christianity (2007) |
| Public spending on education | Public spending on education as a decimal fraction of GDP. It consists of current and capital public expenditure on education and includes government spending on educational institutions (both public and private), education administration as well as subsidies for private entities (students/households and other private entities). | 0.04 | 0.02 | 0.01 | 0.17 | The World Bank (2014) |
| Religious pluralism | One minus the Herfindahl index of religious group shares, reflecting the probability that two randomly selected individuals from a population belong to different groups. | 0.30 | 0.19 | 0.03 | 0.66 | Maoz and Henderson (2013a), author’s calculations |
| Roman Catholicism | Decimal fraction of the population adhering to Roman Catholicism. | 0.30 | 0.34 | 0.00 | 0.95 | Maoz and Henderson (2013a) |
| Roman Catholicism 1900 | Decimal fraction of the population adhering to Roman Catholicism in 1900. | 0.26 | 0.38 | 0.00 | 1.00 | Center for the Study of Global Christianity (2007) |
| Systemic banking crises | Dummy variable that takes the value 1 if, in the respective year, the country experienced a systemic banking crisis. A banking crisis is defined as systemic if two conditions are met: first, significant signs of financial distress in the banking system (as indicated by significant bank runs, losses in the banking system or bank liquidations) and second, significant banking policy intervention measures in response to significant losses in the banking system. | 0.07 | 0.07 | 0.00 | 0.26 | Laeven and Valencia (2013) |
| Urbanization rate | People living in urban areas as a decimal fraction of the total population. | 0.50 | 0.23 | 0.07 | 0.96 | The World Bank (2014) |
| Wars | Military and civilian deaths in battle-related conflicts, per 1,000 people. | 0.01 | 0.02 | 0.00 | 0.12 | The World Bank (2014), author’s calculations |
First-stage Regressions of Baseline Model
| (1) |
(2) |
(3) |
(4) |
(5) |
|
| Protestantism | Roman Catholicism | Islam | Hinduism | Buddhism | |
| Protestantism 1900 | 0.778*** (0.046) |
0.014 (0.059) |
0.036 (0.063) |
0.007 (0.010) |
−0.020 (0.025) |
| Roman Catholicism 1900 | −0.008 (0.025) |
0.787*** (0.056) |
0.028 (0.057) |
0.001 (0.008) |
−0.017 (0.018) |
| Christianity 1900 | −0.178*** (0.042) |
−0.356*** (0.084) |
0.048 (0.069) |
0.013 (0.011) |
0.004 (0.017) |
| Islam 1900 | −0.253*** (0.037) |
−0.430*** (0.055) |
0.986*** (0.060) |
0.001 (0.007) |
0.009 (0.015) |
| Hinduism 1900 | −0.172*** (0.042) |
−0.190** (0.086) |
−0.037 (0.090) |
0.925*** (0.046) |
−0.048 (0.037) |
| Buddhism 1900 | −0.195*** (0.036) |
−0.432*** (0.083) |
−0.032 (0.080) |
0.039 (0.024) |
0.896*** (0.065) |
| Religious pluralism | −0.149*** (0.044) |
−0.411*** (0.076) |
0.037 (0.089) |
0.020 (0.015) |
0.004 (0.020) |
| Public spending on education | −0.057 (0.267) |
−0.389 (0.413) |
−1.221* (0.639) |
0.062 (0.115) |
−0.256 (0.295) |
| Political rights and civil liberties | 0.010 (0.037) |
−0.073 (0.071) |
0.030 (0.085) |
−0.025** (0.012) |
0.069 (0.051) |
| Life expectancy | −0.002 (0.003) |
0.005 (0.005) |
−0.009 (0.010) |
−0.003* (0.002) |
−0.004 (0.004) |
| Death rate | −0.092* (0.046) |
0.071 (0.079) |
−0.034 (0.150) |
−0.048* (0.026) |
−0.047 (0.042) |
| Urbanization rate | −0.063 (0.044) |
−0.019 (0.071) |
−0.049 (0.067) |
0.022* (0.013) |
0.037 (0.035) |
| Population growth rate | 0.011 (0.012) |
−0.003 (0.018) |
−0.005 (0.027) |
−0.006 (0.004) |
−0.009 (0.009) |
| GDP per capita | 0.012 (0.009) |
0.019 (0.015) |
−0.001 (0.018) |
0.003* (0.002) |
0.008 (0.007) |
| GDP growth rate | −0.007** (0.003) |
0.009 (0.008) |
−0.003 (0.006) |
−0.000 (0.001) |
0.002 (0.001) |
| Private credit | −0.024 (0.028) |
−0.024 (0.042) |
0.079 (0.057) |
0.016 (0.010) |
−0.028 (0.018) |
| Openness | −0.019 (0.017) |
0.023 (0.025) |
−0.042** (0.020) |
0.008 (0.006) |
0.006 (0.006) |
| Latitude | 0.024 (0.071) |
−0.152 (0.102) |
−0.048 (0.100) |
0.003 (0.020) |
−0.002 (0.038) |
| Landlocked | 0.008 (0.017) |
−0.019 (0.029) |
−0.016 (0.031) |
0.003 (0.005) |
0.000 (0.007) |
| Number of observations | 150 | 150 | 150 | 150 | 150 |
| Centred R2 | 0.92 | 0.93 | 0.91 | 0.94 | 0.94 |
| F-statistic | 130.49*** | 131.37*** | 122.69*** | 23.60*** | 36.22*** |
| Root mean squared error | 0.066 | 0.100 | 0.114 | 0.026 | 0.042 |