
Abstract
Introduction
Hyperuricaemia has been associated with elevated risk of gout, renal disease, cardiovascular disease (CVD) and metabolic dysfunction (Kuo et al., 2016; Terkeltaub et al., 2006). Several dietary modifications have been proposed for the prevention of hyperuricaemia, including restricting intakes of purine-rich and fructose-rich foods, limiting alcohol consumption, remaining hydrated and increasing cherry consumption (Collins et al., 2019; Schlesinger, 2005). The potential of cherries to prevent hyperuricaemia has been ascribed to their high content of polyphenols, especially anthocyanins (Chaovanalikit and Wrolstad, 2004; Kelley et al., 2018; Kirakosyan et al., 2009). Cherry consumption has been suggested to reduce serum uric acid (sUA) by: (i) inhibiting hepatic xanthine oxidoreductase and/or (ii) increasing the glomerular filtration of UA and inhibiting its tubular reabsorption, thereby increasing urinary uric acid (UUA) excretion (Haidari et al., 2009; Jacob et al., 2003; Kirakosyan et al., 2018; Zhang et al., 2012).
To our knowledge, three studies have reported that cherries decrease sUA in the hours after consumption (Bell et al., 2014a; Hillman and Uhranowsky, 2021; Jacob et al., 2003), two of which (Bell et al., 2014a; Jacob et al., 2003) also measured an increase in UUA excretion. However, these studies had methodological limitations. Two studies (Bell et al., 2014a; Jacob et al., 2003) had no control group. Whereas the third, which investigated the effect of one and two daily servings of tart cherry (TC) in capsules and as juice, only contained placebo groups for the once daily servings (Hillman and Uhranowsky, 2021). Since sUA is known to exhibit a diurnal rhythm, falling as the day progresses (Sennels et al., 2012), the failure to include control groups complicates the interpretation of these studies. Thus, the primary aim of the present study was to determine the acute effects of TC juice consumption on sUA and UUA excretion relative to a control drink.
Hyperuricaemia is a risk factor for CVD possibly because it promotes hypertension and increases arterial stiffness (An et al., 2024; Borghi et al., 2022). Within vascular endothelial cells, elevated UA promotes oxidative stress, inflammation and depletes nitric oxide causing endothelial dysfunction and vasoconstriction (Ndrepepa, 2025). The consumption of TC might be expected to reduce blood pressure (BP) and arterial stiffness by lowering urate or via the anti-inflammatory and antioxidant actions of its content of polyphenols. However, the results of human intervention studies investigating the effect of TC on BP and arterial stiffness have been mixed (Desai et al., 2021; Keane et al., 2016a; Kimble et al., 2021; Lynn et al., 2014). Thus, the secondary aim of this study was to determine the acute effects of TC juice on inflammation, BP and arterial stiffness.
Methods
This study was reported in line with the CONSORT 2010 statement (Dwan et al., 2019).
Trial design
The study was an open-label, 2-arm, randomised, placebo-controlled, crossover trial of thirteen healthy adults. Participants consumed 250 mL of TC juice (30 mL TC concentrate with 220 mL water) or 250 mL of water on two separate occasions, separated by a wash-out period of ≥7 days. Blood, urine and vascular measurements were collected at baseline and multiple time-points over 24 h following each drink (Figure 1). Each participant attended each of their test sessions at the same time (between 9 and 10 am).
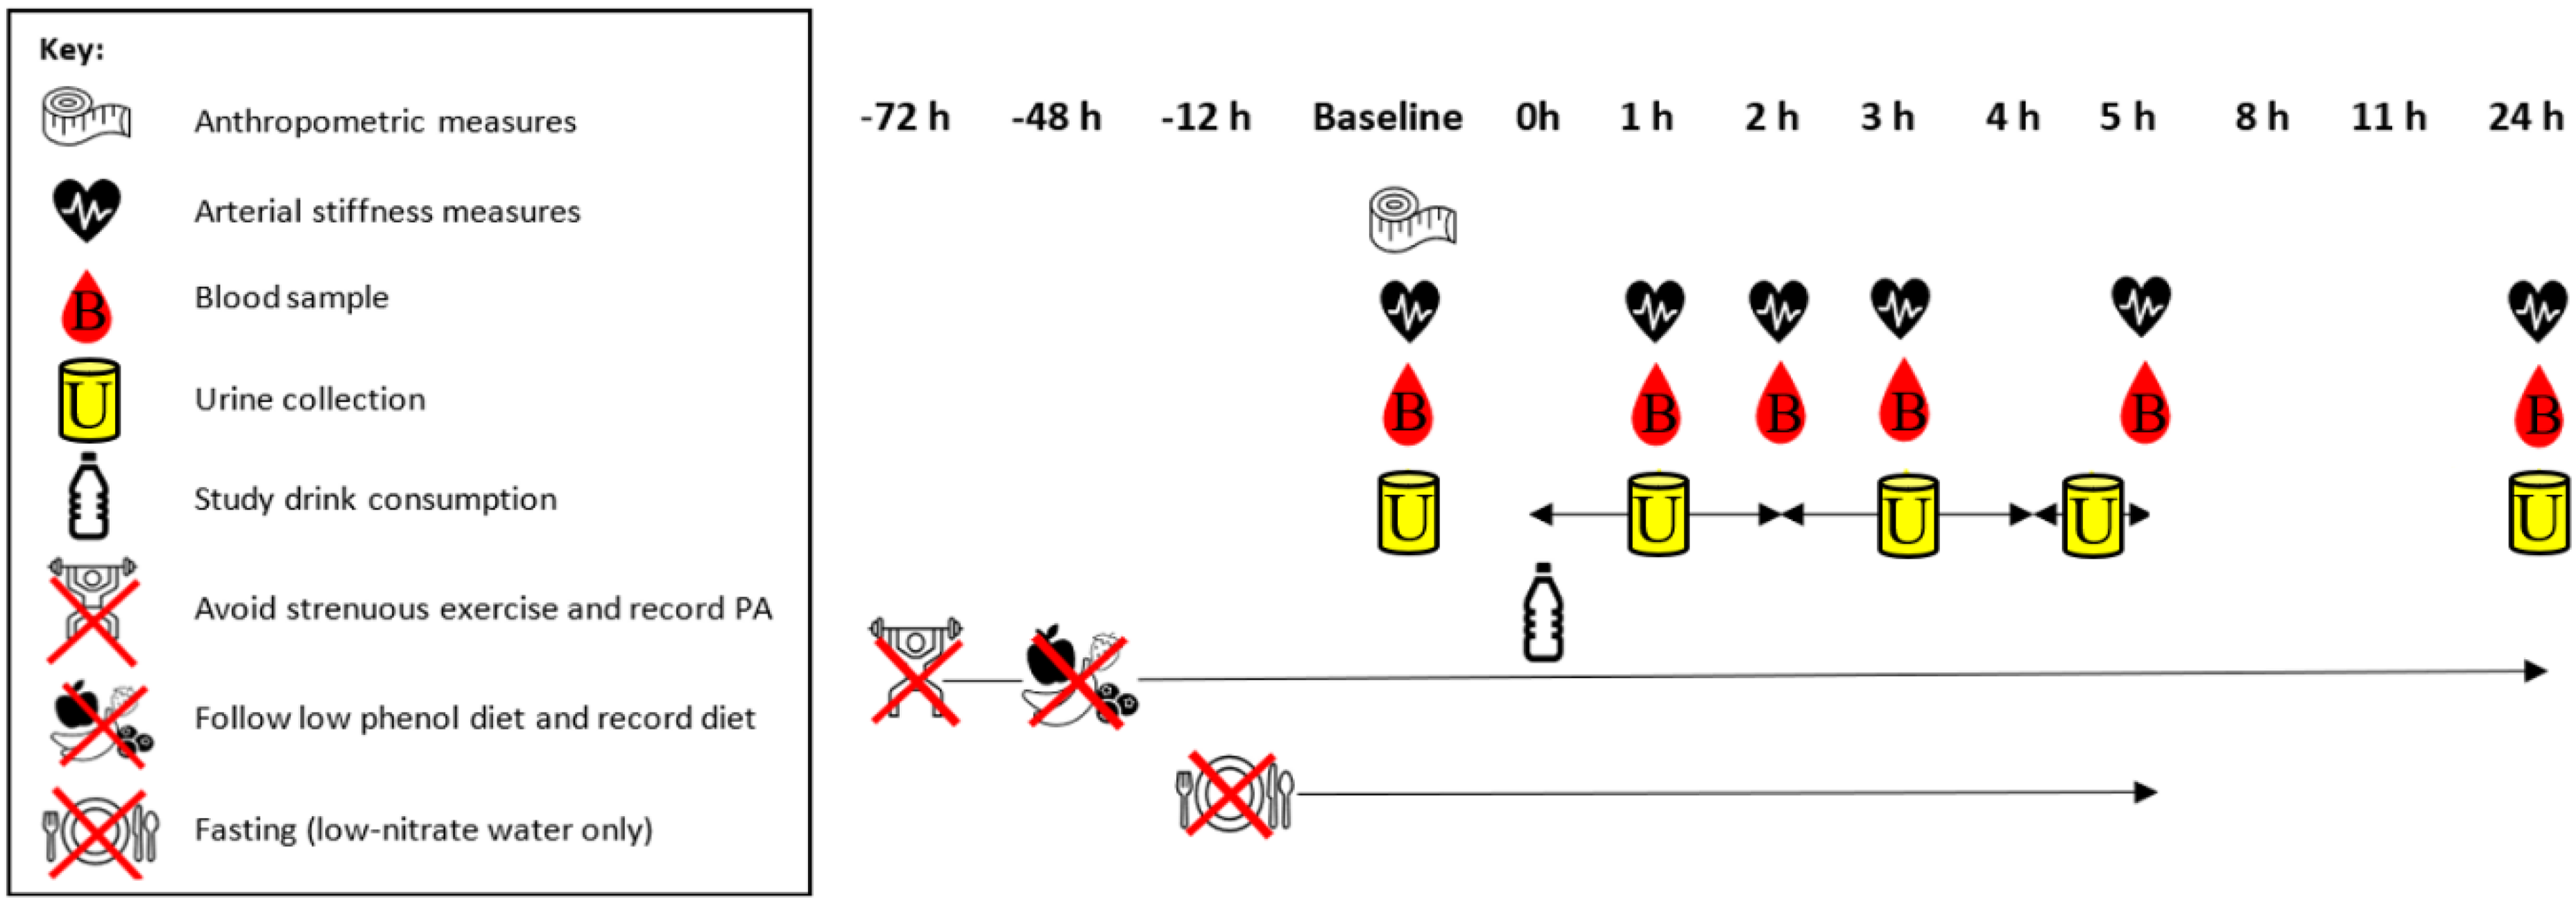
Study protocol. PA: physical activity.
The study opened recruitment in July 2021 and closed at the end of February 2022. It was approved by Sheffield Hallam University (SHU) ethics committee (ER9199256) and registered at ClinicalTrials.gov (NCT04960527) before recruitment commenced. The study was conducted in accordance with the 1964 Declaration of Helsinki and its later amendments.
Participants and settings
A total of 13 healthy, non-smoking, adult volunteers were recruited through word-of-mouth. Inclusion criteria were, aged between 18 and 85 years and no history of, gout, type 1 or type 2 diabetes, gastrointestinal disorders, CVD or kidney disease. Interested individuals were provided with a participant information sheet containing further details of the study. Potential participants also received a verbal explanation of the study and were screened for inclusion criteria. Written informed consent was gained from all participants. Measurements were made at the Nutrition Research Laboratory of SHU, Sheffield, United Kingdom.
Dietary interventions
During the active intervention arm of the study, participants consumed 250 mL of TC juice, consisting of 30 mL Montmorency TC concentrate (CherryActive®, ActiveEdge™, Hanworth, UK) and 220 mL low-nitrate water (Buxton®, UK). Analysis of the TC concentrate in our nutrition research laboratory revealed that each serving contained a mean phenol content of 408 (SD 5.4) mg gallic acid equivalents (Folin-Ciocalteu method; Singleton and Rossi, 1965) and an anthocyanin content of 3.8 (SD 0.3) mg cyanidin-3-glucoside equivalents (pH differential method; Lee et al., 2005). During the control arm, participants consumed 250 mL of low-nitrate water (Buxton®, UK). A low-nitrate water was selected for the control drink to minimise vascular effects (Hobbs et al., 2013) and avoid bioactive compounds such as polyphenols. The two study arms were separated by a wash-out period of ≥7 days. The wash-out duration was based on the known pharmacokinetics of cherry polyphenols (Keane et al., 2016b) and likely transient nature of any effects on the outcome measures. An investigator not involved in data collection generated a block randomised allocation sequence using www.random.org (block size 4) and assigned participants to their sequence of interventions. The use of a water control meant it was impossible to conceal this sequence from participants or the researcher collecting data.
Participants were provided with a dietary advice sheet containing meal recommendations to help them follow a low-polyphenolic diet, including avoiding fruits, vegetables, wholegrains and nuts, for 48 h prior to each test day. The evening prior to each test day participants were provided with a low-phenol spaghetti carbonara ready-meal (Sainsbury's PLC, UK), low-phenol dessert (Bonne Maman®, Somerset, UK) and low-nitrate water (Buxton®, UK) to consume. Participants attended the laboratory following an overnight fast of ≥10 h, although low-nitrate water was permitted.
Participants remained fasted during the first 5 h post drink consumption; however, 500 mL low-nitrate water was provided during this time. Participants were advised to drink when thirsty but avoid consuming large volumes at a single time-point to minimise possible effects on vascular function (Callegaro et al., 2007). A low-phenol lunch of sandwiches made from white bread and ham, ready salted crisps and plain Greek yoghurt were provided immediately following the 5-h measurements. Participants were also provided with low-phenol snacks, a low-phenol macaroni cheese ready-meal and low-nitrate water to consume over the rest of the day. Participants returned to the laboratory following another overnight fast of ≥10 h for their 24-h measurements.
Participants were asked to record their dietary intake throughout the first arm of the study and instructed to replicate this during the second arm. Participants were also asked to avoid strenuous exercise from 72 h before each test day until after their 24-h measurements.
Outcomes
The primary outcome measure was between-treatment difference in the change in sUA from baseline to 24 h post-drink. Secondary outcome measures were between-treatment differences in the change in the inflammatory marker, serum C-reactive protein (CRP) from baseline to 5 h post-consumption and changes in UUA excretion and vascular function (resting brachial and central BP and arterial stiffness) from baseline to 24 h post-consumption. Non-efficacy outcomes included physical activity (PA) and dietary intake measures, for example consumption of high-phenolic foods.
Anthropometry
Height (to 0.1 cm) and mass (to 0.1 kg) of participants were measured during their first visit to the laboratory and used to calculate body mass index (BMI) (mass (kg)/height (m)2).
Arterial stiffness and BP
A Vicorder® device (SMT Medical, Germany) was used to measure brachial and central BP, carotid-femoral pulse wave velocity (PWV) and augmentation index (AIx). Participants were familiarised with the Vicorder® prior to their first experimental session to reduce the effects of anxiety on BP and other vascular measures (Franklin et al., 2013). Familiarisation consisted of practice measurements with carotid, arm and femoral cuffs, so participants could become accustomed to the sensation of each cuff inflating. BP, PWV and AIx were measured at baseline and 1, 2-, 3-, 5- and 24-h post-drink consumption. Following the Vicorder® instructions, brachial diastolic BP (DBP) values were also used as central DBP values. Three replicate measures with 1-min intervals were taken at each time-point. Participants rested in a supine position for 15 min before the measurements and remained still throughout.
Collection and processing of blood samples
Blood was collected at baseline, 1, 2, 3, 5 and 24 h, post-consumption. Samples were centrifuged at 2500× g for 15 min at 18°C to separate serum (Hermle Z 36 HK, HERMLE Labortechnik GmbH, Germany), which was stored at −80°C until analysis.
Serum C-reactive protein and sUA
C-reactive protein was measured in serum collected at baseline, 2 and 5 h using a CRP Quantikine enzyme-linked immunosorbent assay kit (R&D systems, Abingdon, UK). The intra-assay CV was 5.5%. Serum UA was determined in serum collected at baseline, 1, 2, 3, 5 and 24 h using a UA (Amplex® Red, Invitrogen™, UK) assay kit. The intra-assay CV was 3.9%. Both analytes were measured on a microplate reader (BioTek synergy HT, Winooski, USA).
Urine collection and analysis
Spot urine samples were collected at baseline and 24 h post-drink consumption. Urine was also collected between 0 to 2, 2 to 4 and 4 to 5 h. Samples were centrifuged twice at 2800× g for 15 min to remove unwanted cells and material (Hermle Z 36 HK, HERMLE Labortechnik GmbH, Germany) and stored at −80°C until analysis. Urine samples were analysed for UUA (Amplex® Red, Invitrogen™, UK) and creatinine (ELISA; R&D systems, Abingdon, UK) concentrations, using a microplate reader (BioTek synergy HT, Winooski, USA). The intra-assay CV was 2.0% for UUA and 2.1% for urinary creatinine. The UUA (µmol) was corrected for creatinine concentration (µmol) to provide a UUA to urinary creatinine excretion ratio.
Assessment of diet and PA
From 48 h prior to baseline until 24-h post-consumption, participants completed a food diary. Participants recorded PA in a diary from 72 h prior to their two main laboratory sessions until their 24-h post-consumption measurements.
Statistical methods
The primary outcome was change in sUA concentration. Change in UUA, CRP, BP and arterial stiffness was secondary outcomes. The effect of treatment (TC versus water) on all outcomes was analysed as the percentage change from baseline using two-way repeated measures analyses of variance (ANOVAs) with Bonferroni post-hoc tests. Partial Eta-Squared (ηp2) effect sizes for ANOVA were classified as small (0.01–0.059), moderate (0.06–0.137) and large (≥0.138) (Pallant, 2010). Further exploratory analyses investigating between-sex differences on the effect of cherry consumption on sUA and UUA were undertaken by adding sex as a between-subjects factor in two-way repeated measures ANOVAs. Baseline data is presented as mean (SD) or median and interquartile range, as appropriate. Results are reported as mean % and SD for continuous data. All analyses were conducted using IBM SPSS Statistics v24. The critical value for statistical significance was set at p < 0.05.
A sample size of 13 was determined sufficient to detect a decrease in sUA of 15 µmol/L with 80% power at a significance level of 0.05, using data from White et al. (2018).
Results
Participant characteristics
Thirteen participants started the study; however, one dropped out following completion of the control treatment. Of the 12 participants (7 male/5 female) who completed the study, mean age was 41.1 (±11.1; range 27–60) years, and average BMI 26.4 (±4.3; range 20.1–35.1) kg/m2. Baseline clinical data did not differ between TC juice and control drink visits (p > 0.05 for all), (Table 1).
Baseline clinical data of participants prior to the provision of 250 mL tart cherry juice and 250 mL water.
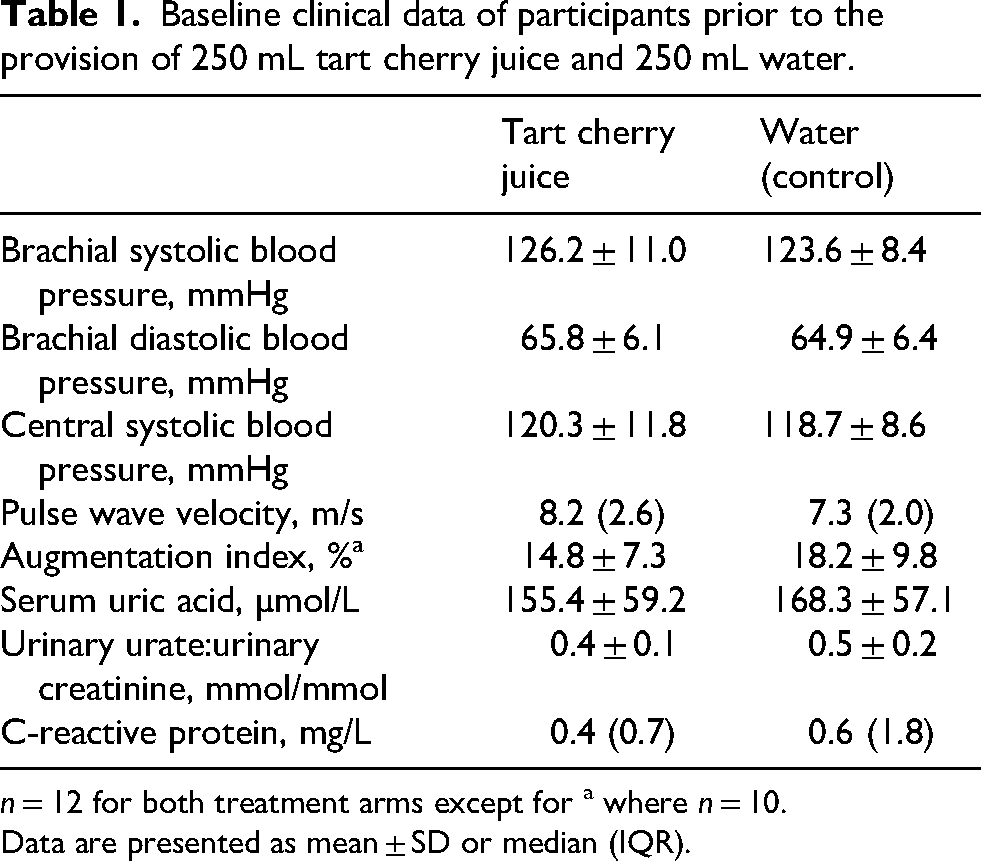
n = 12 for both treatment arms except for a where n = 10.
Data are presented as mean ± SD or median (IQR).
Dietary adherence and avoidance of high-intensity PA
Evaluation of participants’ diet and PA diaries indicated that participants complied with the low-phenol diet and PA guidance.
Serum uric acid
There was a large-sized main effect of time on sUA following consumption of the drinks (F5,55 = 3.529, p = 0.008, ηp2 = 0.243) with a mean 10.4% reduction in sUA between 1 h and 5 h post-consumption (p = 0.034) and a mean 8.5% increase from 5 h to 24 h post-consumption (p = 0.022) (Figure 2(a), Table 2). However, no drink type (F1,11 = 2.061, p = 0.179, ηp2 = 0.158) or drink by time interaction (F5,55 = 1.222, p = 0.311, ηp2 = 0.100) effects were found. Furthermore, there were no between-sex differences in response (F5,55 = 1.151, p = 0.347, ηp2 = 0.103).
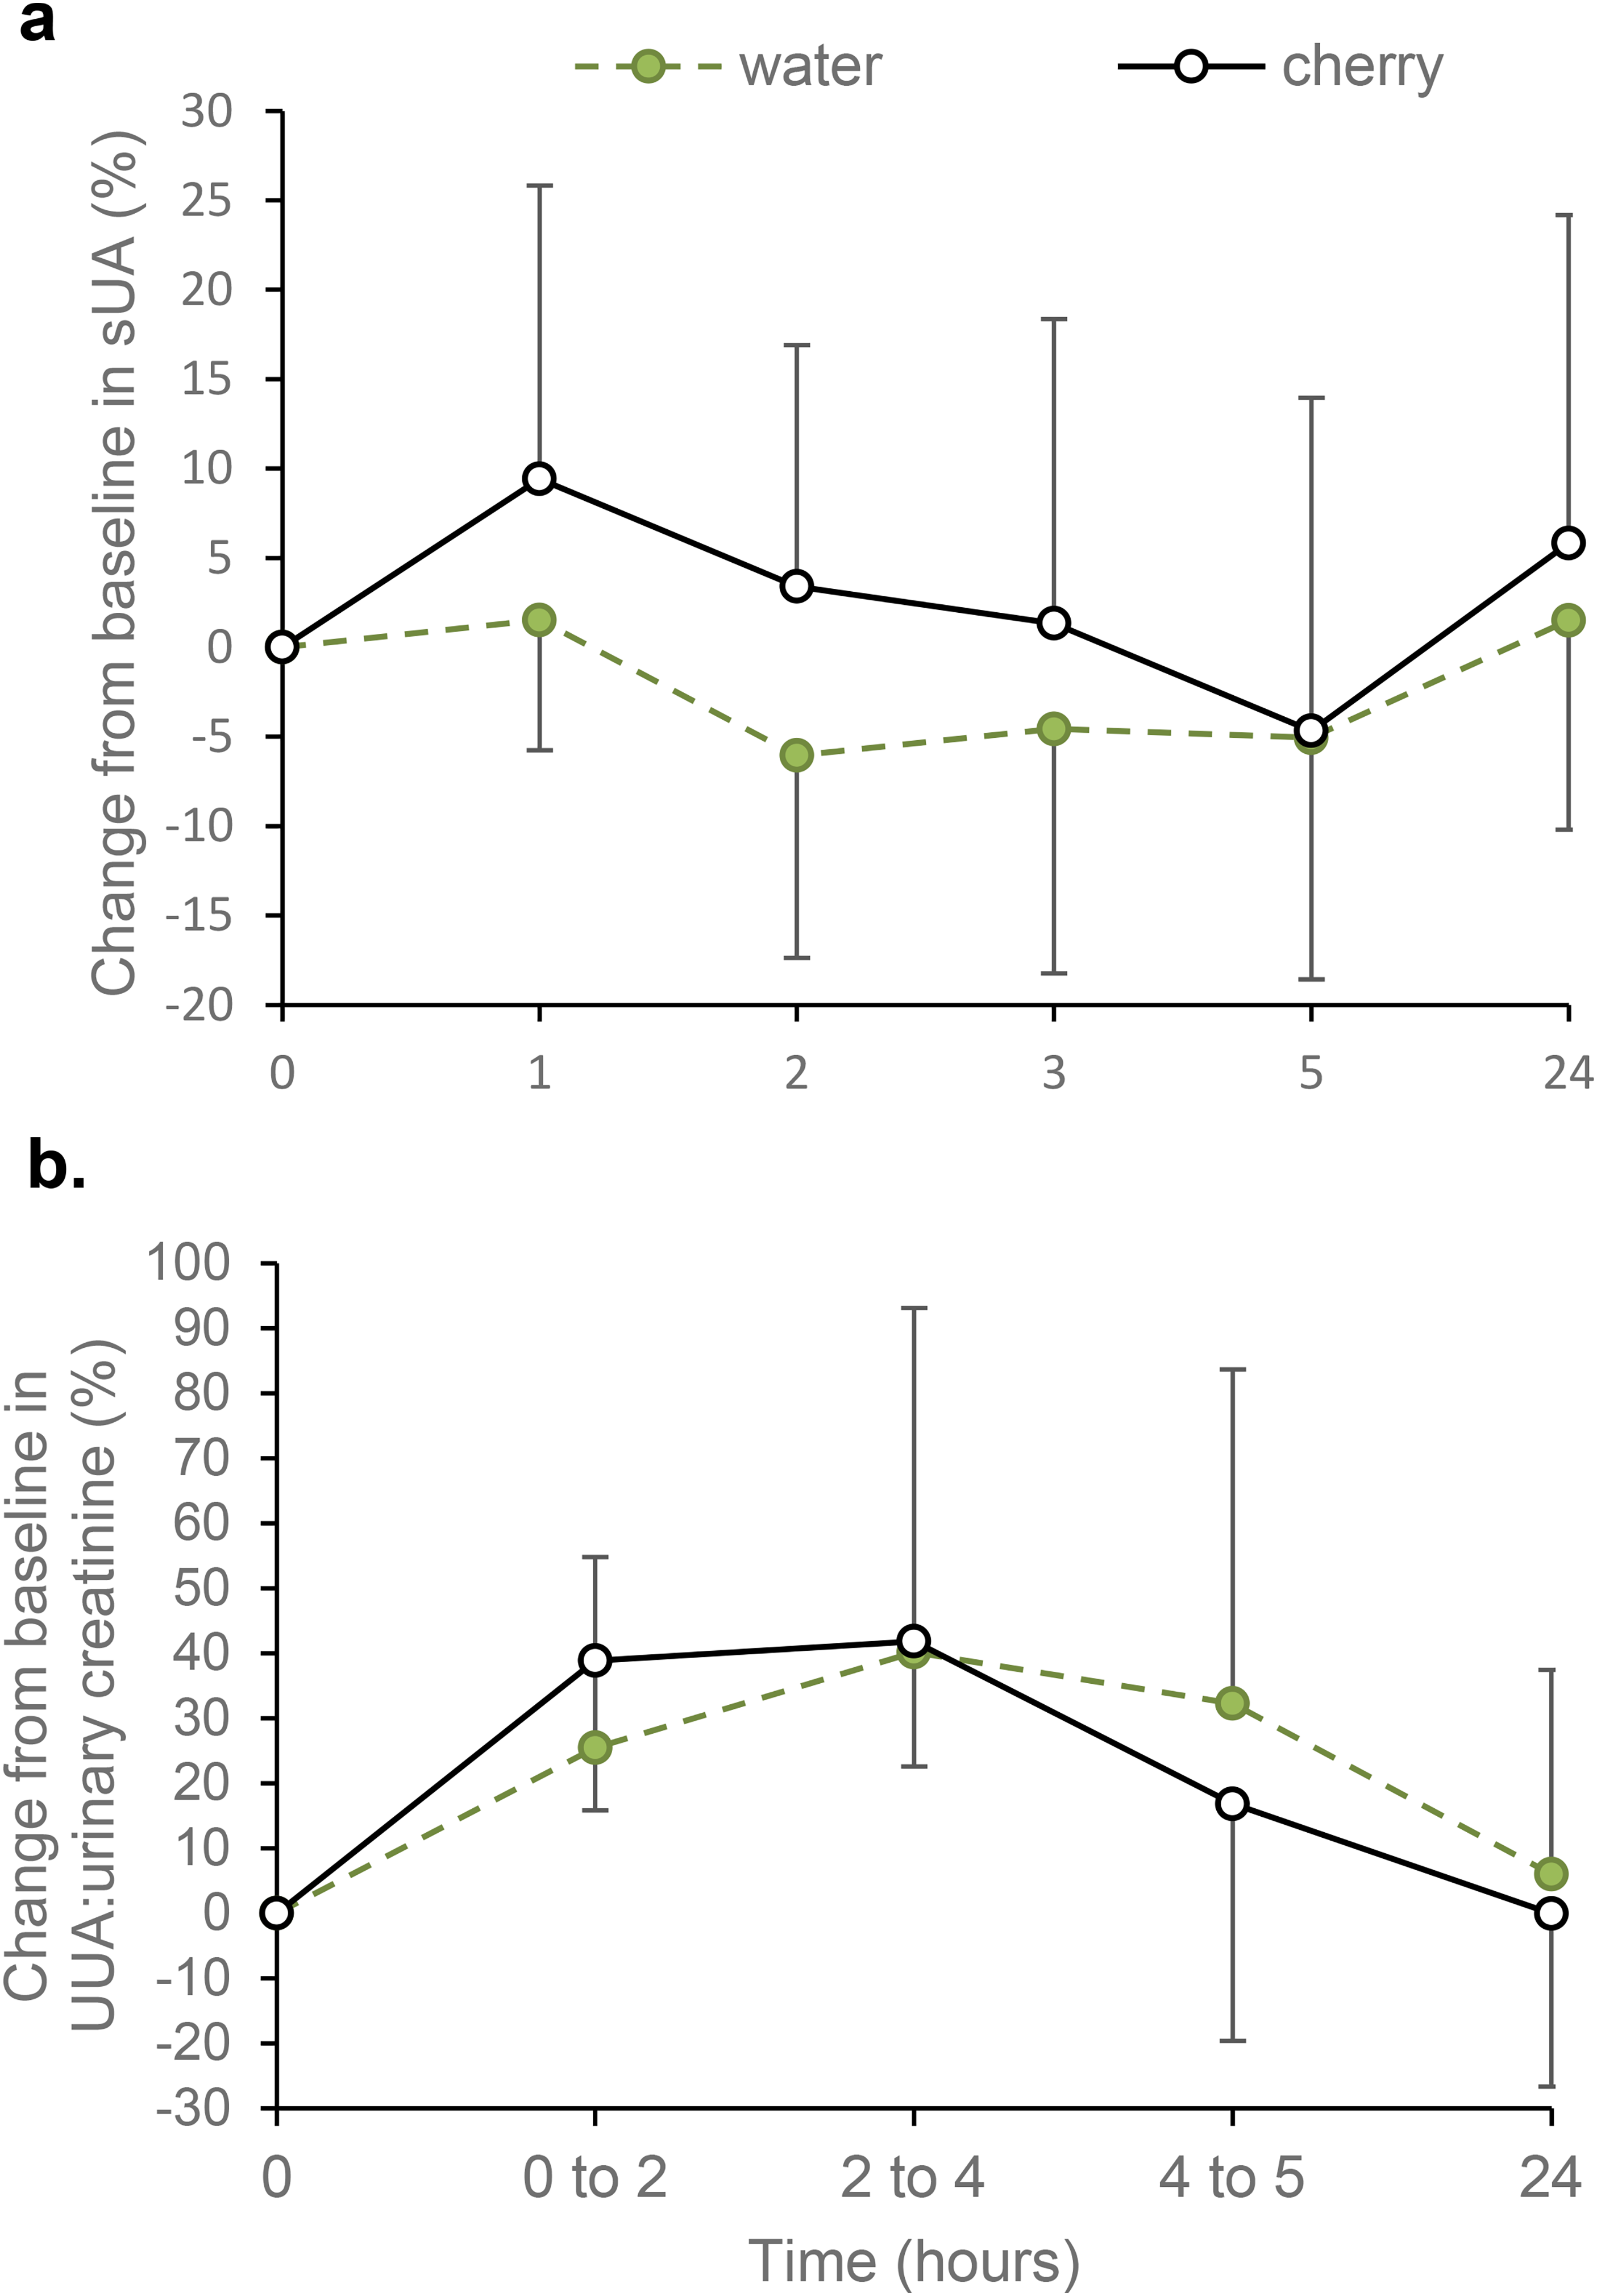
Effect of tart cherry juice and water on percentage change from baseline values in (a) serum uric acid (sUA) concentration and (b) urinary uric acid (UUA) to urinary creatinine ratio. Data are presented as mean ± SD, n = 12 for both outcomes.
Acute effects of 250 mL tart cherry juice versus water (control) on vascular function, inflammation and uratea.
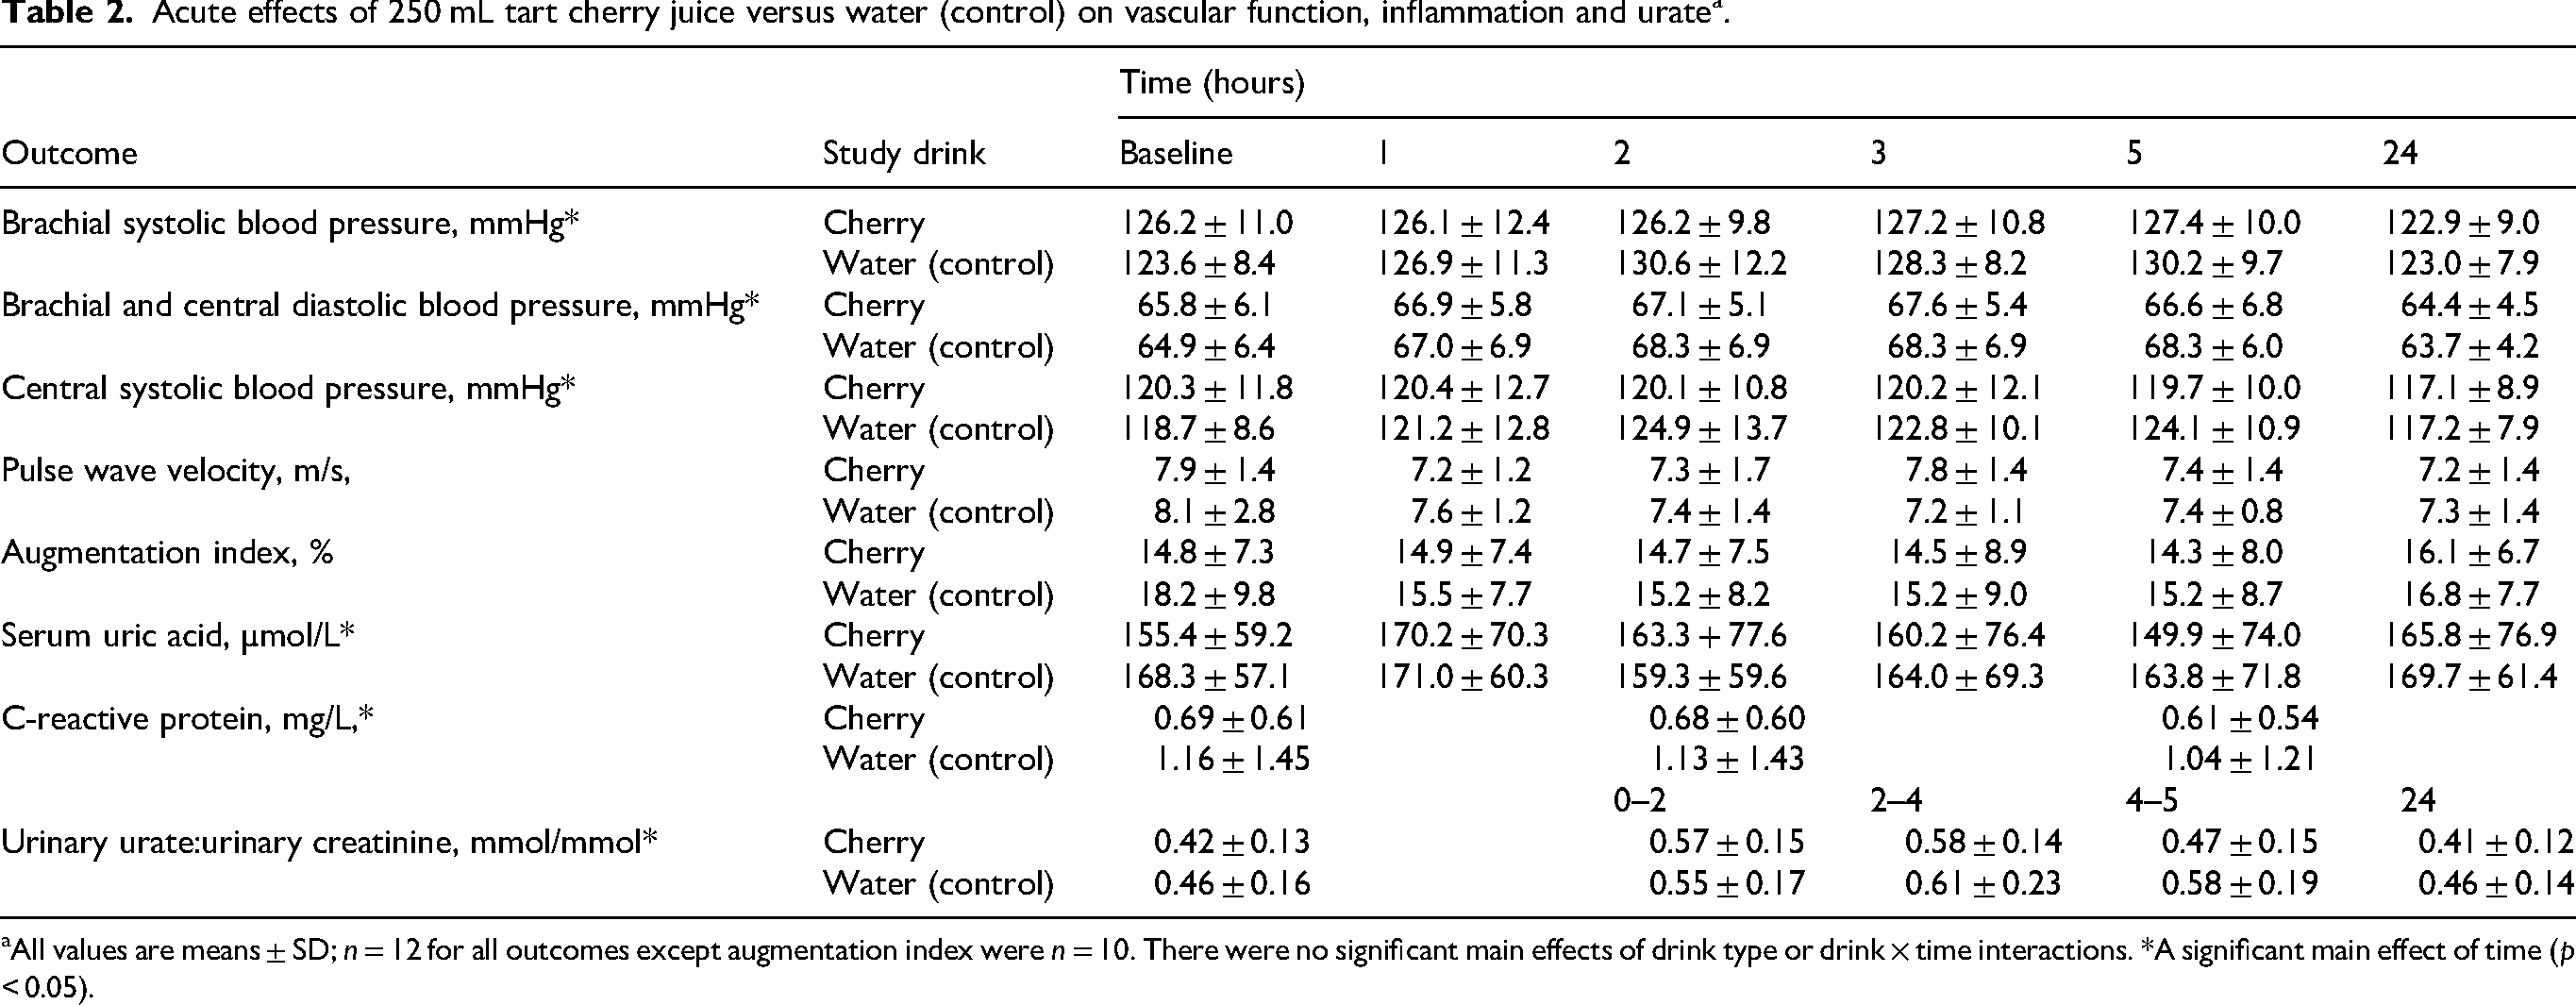
aAll values are means ± SD; n = 12 for all outcomes except augmentation index were n = 10. There were no significant main effects of drink type or drink × time interactions. *A significant main effect of time (p < 0.05).
Urinary uric acid
As shown in Figure 2(b) and Table 2, creatinine-adjusted UUA fluctuated significantly over time and this main effect was large (F4,44 = 11.656, p < 0.001, ηp2 = 0.514). The greatest increase in UUA above baseline (0 h) was observed at 2 to 4 h (41.0%; p = 0.001), followed by 0 to 2 h (32.2%; p < 0.001). The UUA was significantly lower at 24 h than at 0 to 2 h (p < 0.001) and 2 to 4 h (p = 0.005). There were no statistically significant main effects of drink type (F1,11 = 0.015, p = 0.906, ηp2 = 0.001) or drink by time interaction (F4,44 = 1.084, p = 0.358, ηp2 = 0.090). There were also no between-sex differences in response (F4,44 = 1.397, p = 0.263, ηp2 = 0.123).
C-reactive protein
There was a large-sized main effect of time for change in CRP from baseline (F2,22 = 4.488, p = 0.023, ηp2 = 0.290), with a statistically significant 7.4% reduction between 2 h and 5 h (p = 0.020) (Figure 3 and Table 2). Despite this, CRP at 5 h was not significantly different from baseline (p = 0.202), and no main effect of drink type (F1,11 = 0.434, p = 0.524, ηp2 = 0.038) or drink by time interaction (F2,22 = 0.644, p = 0.525, ηp2 = 0.055) was detected.
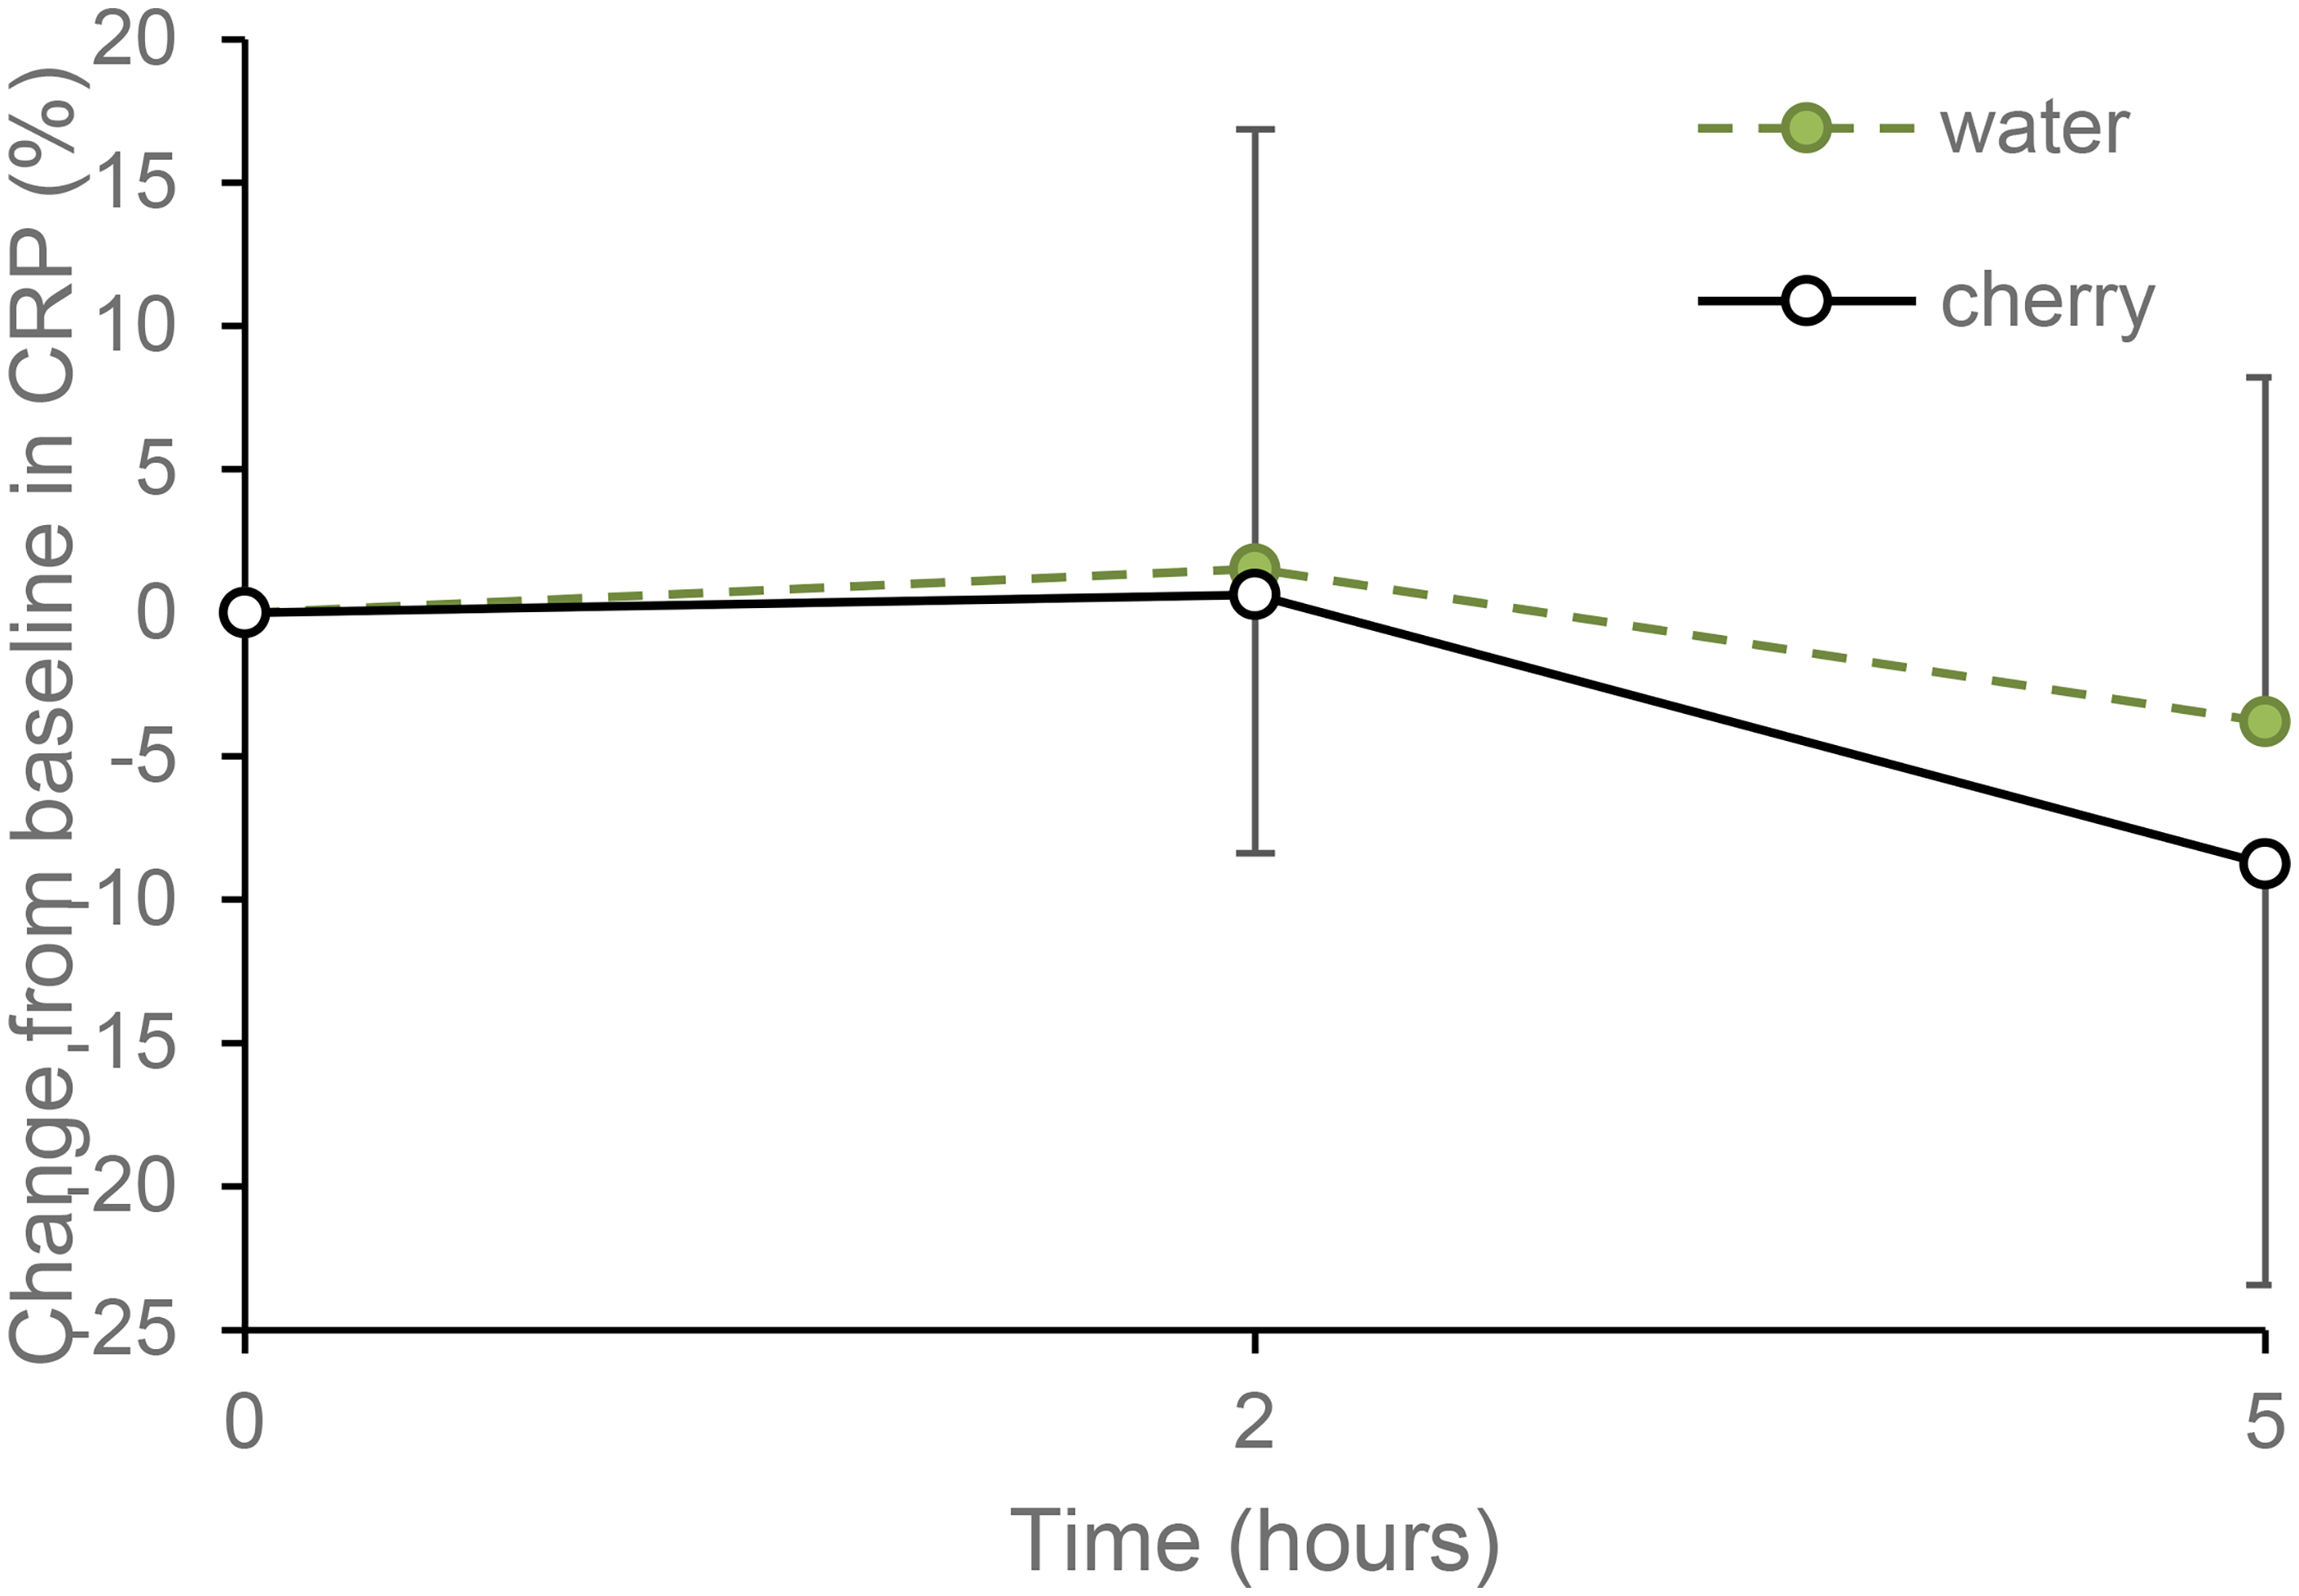
Effect of tart cherry juice and water on percentage change in C-reactive protein (CRP) concentration from baseline values. Data are presented as mean ± SD, n = 12.
Blood pressure
Brachial systolic BP
A large main effect of time (F5,55 = 5.360, p < 0.001, ηp2 = 0.328) was detected for brachial systolic BP (SBP) (Figure 4(a), Table 2), with a mean reduction of 4.6% between 5 h and 24 h (p < 0.001). There was a non-significant large main effect of drink (F1,11 = 3.654, p = 0.082, ηp2 = 0.249); estimated marginal mean for brachial SBP was 3.0% (95% CI −6.5, 0.5) lower in the water arm than in the TC juice arm. No drink by time interaction effect (F5,55 = 1.459, p = 0.218, ηp2 = 0.117) was observed.
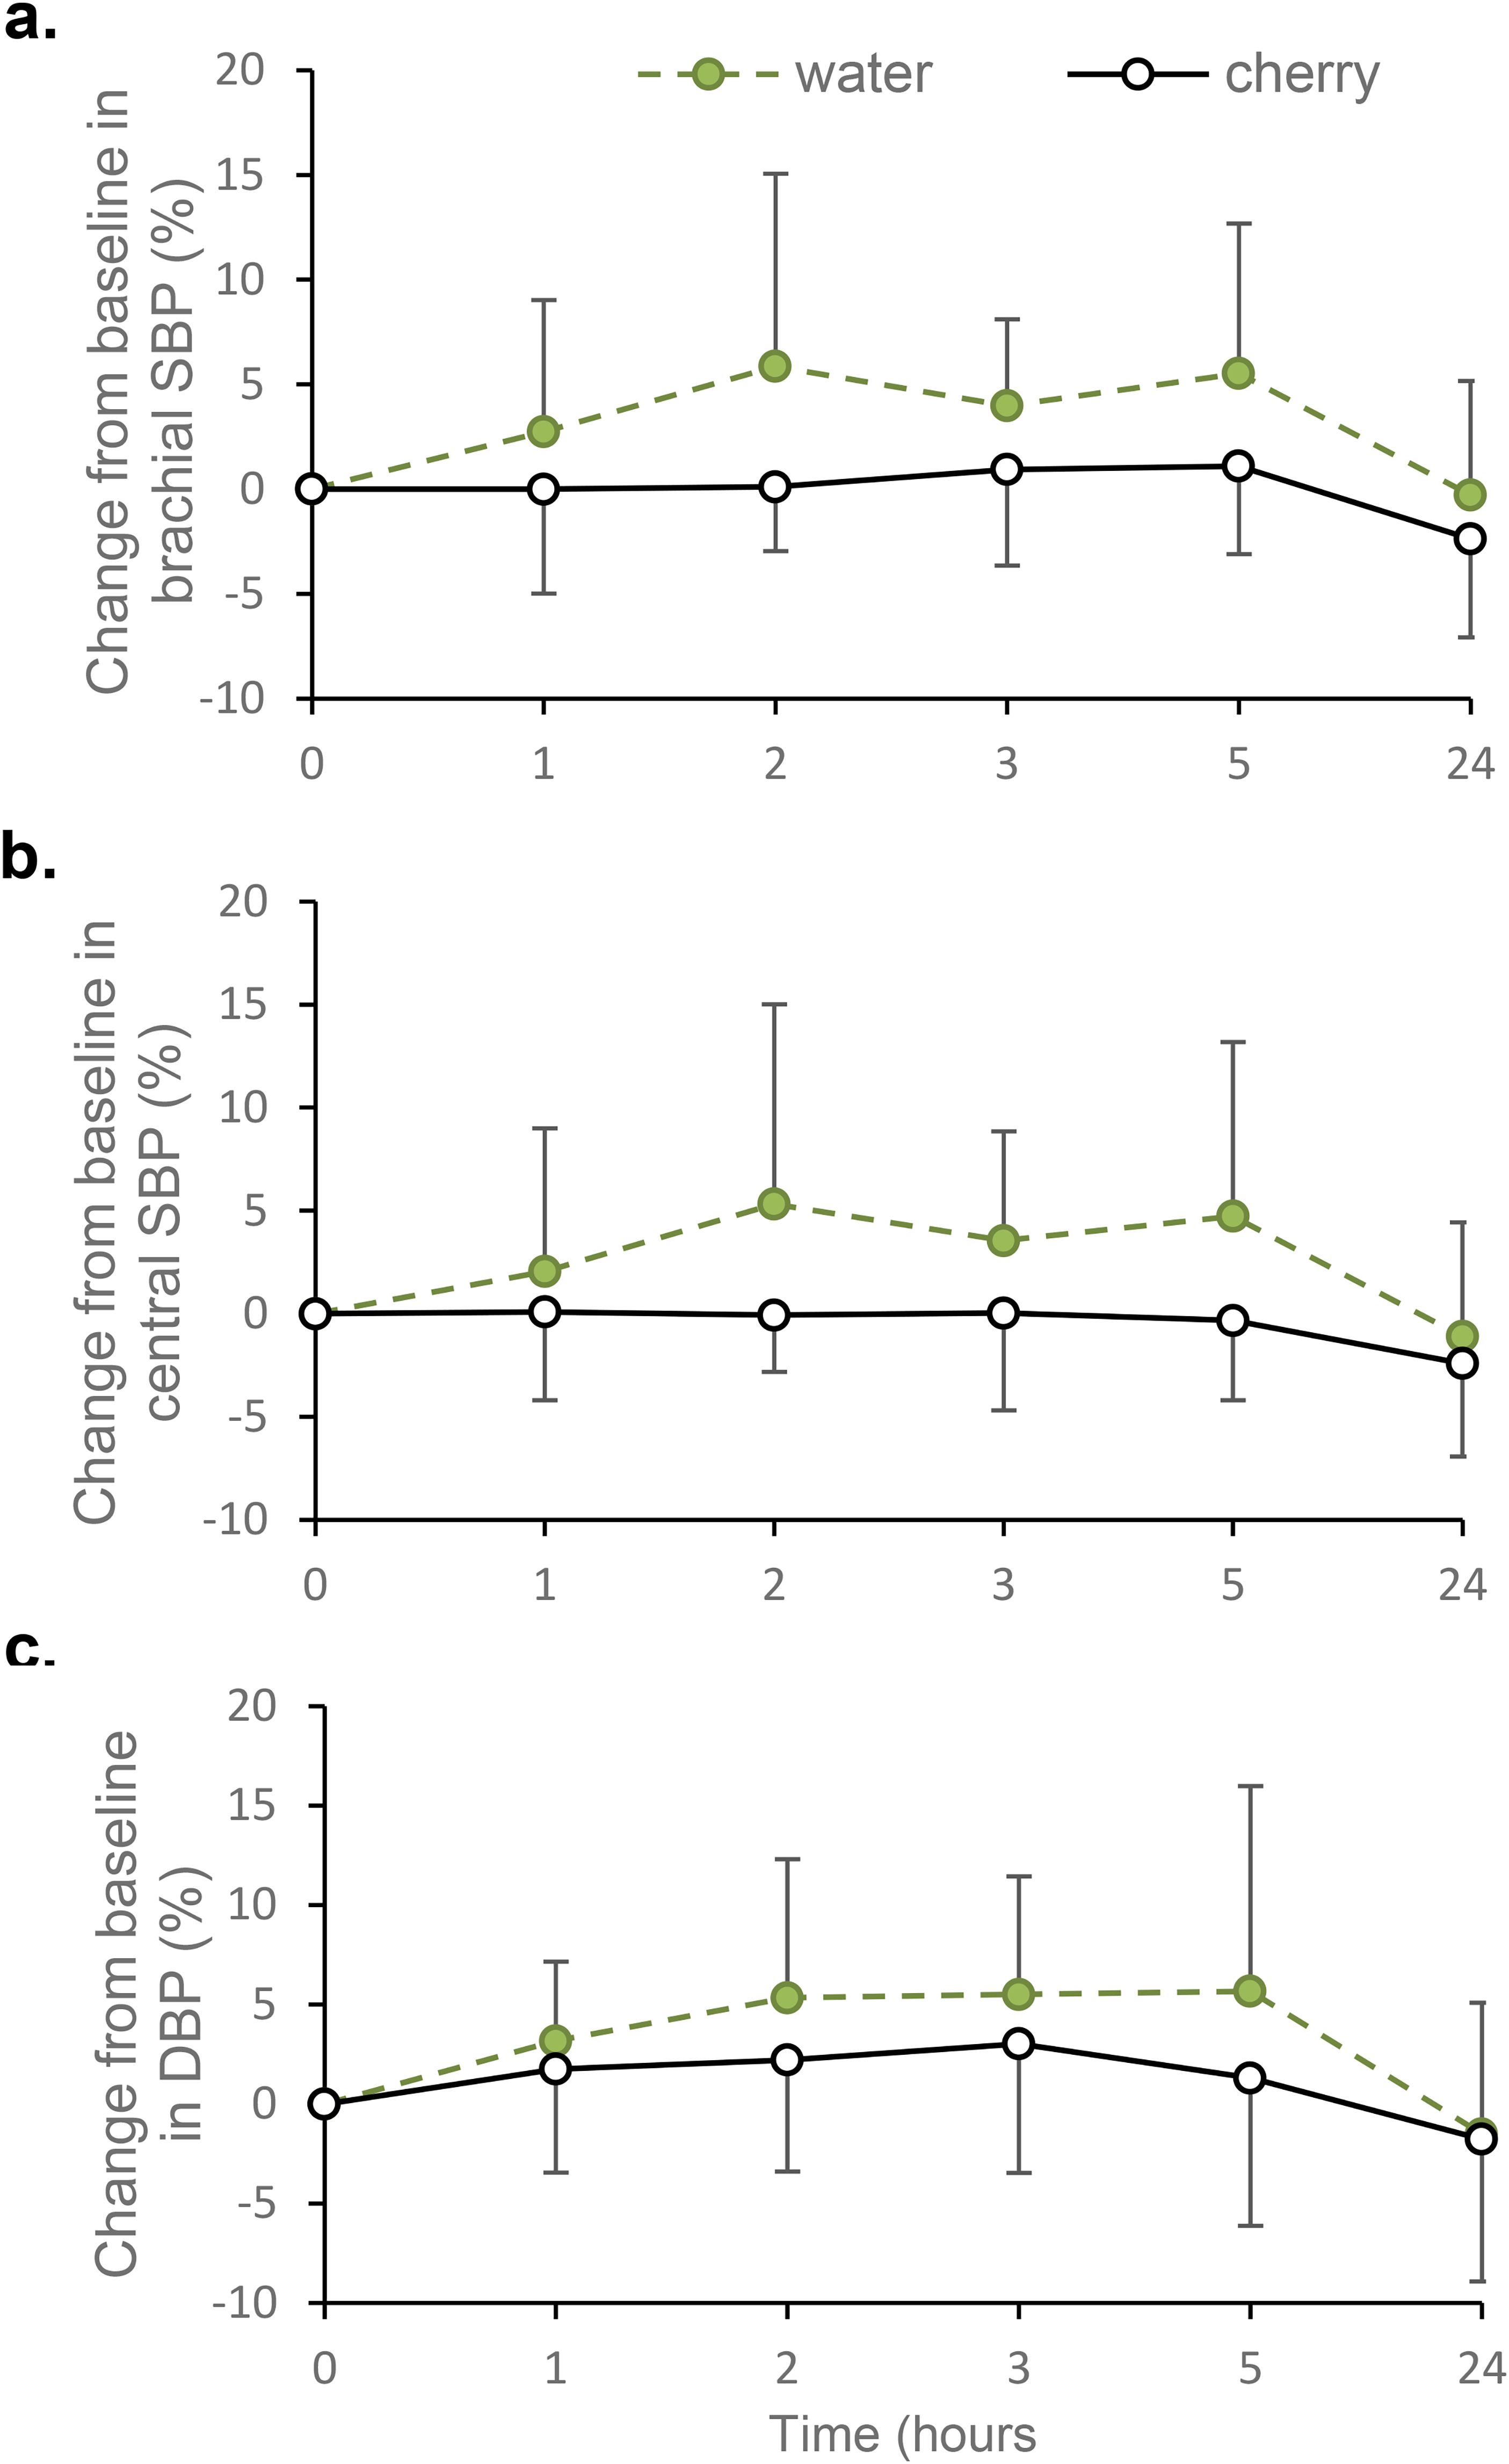
Effect of tart cherry juice and water on percentage change from baseline values in (a) brachial systolic blood pressure (SBP), (b) central systolic blood pressure (SBP) and (c) brachial and central diastolic blood pressure (DBP). Data are presented as mean (±SD); n = 12 for all outcomes.
Central SBP
A large main effect of time (F5,55 = 3.403, p = 0.009, ηp2 = 0.236) was detected for central SBP, with a 4.0% reduction observed between 5 h and 24 h (p = 0.014) (Figure 4(b), Table 2). There was no drink by time interaction effect (F5,55 = 1.866, p = 0.154, ηp2 = 0.145) or main effect of drink type (F1,11 = 3.234, p = 0.100, ηp2 = 0.227).
Brachial and central DBP
Brachial DBP values were used as central DBP values, in accordance with the Vicorder® instructions. There was a large significant main effect of time (F5,55 = 5.908, p < 0.001, ηp2 = 0.349) for DBP (Figure 4(c), Table 2). On average, DBP fell by 5.4% between 2 h and 24 h (p = 0.027) and by 5.9% between 3 h and 24 h (p = 0.001). There was no drink by time interaction effect (F5,55 = 0.718, p = 0.612, ηp2 = 0.061) or main effect of drink type (F1,11 = 1.782, p = 0.209, ηp2 = 0.139).
Arterial stiffness
Pulse wave velocity
Carotid-femoral PWV fluctuated over the measurement period (Table 2); however, these fluctuations were not statistically significant (time: F5,50 = 0.493, p = 0.667, ηp2 = 0.047). There were no main effects of drink type (F1,10 = 1.948, p = 0.193, ηp2 = 0.163) or drink by time interaction (F5,50 = 1.257, p = 0.297, ηp2 = 0.112), (n = 12).
Augmentation Index
Augmentation Index was measured in 10 of the 12 participants. For two participants, AIx could not be consistently measured due to low pulse amplitude so these participants were excluded from analysis. There were no main effects of time (F5,45 = 1.819, p = 0.204, ηp2 = 0.168) or drink type (F1,9 = 2.688, p = 0.136, ηp2 = 0.230), and no drink by time interaction (F5,45 = 1.085, p = 0.344, ηp2 = 0.108) for AIx (Table 2).
Harms
No adverse effects were reported.
Discussion
The primary aim of the present study was to investigate the effect of TC juice on sUA. In contrast to other studies, we did not find evidence that TC juice reduces sUA for up to 24 h post-consumption. We also found no evidence that TC juice acutely increases UUA excretion or lowers inflammation, BP or arterial stiffness.
The failure of TC juice to reduce sUA and increase UUA excretion contrasts with previous studies of sweet and tart cherries. Jacob et al. (2003) reported that 280 g of sweet cherries and Bell et al. (2014a) reported that 30 mL and 60 mL of TC concentrate (diluted with 100 mL of H2O) lowered sUA and increased UUA excretion post-consumption in healthy adults. This contrast may be partly explained by the failure of Jacob et al. (2003) and Bell et al. (2014a) to include a control group, because sUA has previously been reported to fall from morning onwards (Sennels et al., 2012), a phenomenon observed in our participants after consumption of both placebo and TC drinks. The maximal decrease observed in sUA of 10% and increase in UUA excretion of 41% was comparable to that reported by Jacob et al. (2003) (sUA −14% & UUA +69%) in women with similar baseline sUA to our participants, but much lower than reported by Bell et al. (2014a) (sUA −36% and UUA +250%), but their participants had much greater baseline sUA (approximately 480 µmol/L) than our participants (162 µmol/L), despite being described as healthy young adults. Notwithstanding the difficulty of interpreting the results of Bell et al. (2014a) because of the lack of a control arm, it is possible that the UA lowering effect of TC juice may partly depend on baseline sUA. Hillman and Uhranowsky (2021) reported that one and two daily servings of TC in powdered form (480 mg per capsule) and two daily servings of TC juice reduced sUA over a 48-h period, whereas one daily serving of TC juice (30 mL of concentrate diluted to 240 mL with H2O) seemed ineffective leading to a small increase in sUA at 8 h post-consumption. The lack of benefit of a single daily serving of TC juice containing 30 mL of concentrate is broadly consistent with our findings. Interpretation of the results of Hillman and Uhranowsky (2021) is complicated by the inclusion of apple juice in their TC drinks, because it is known to increase sUA (White et al., 2018), and lack of clarity whether reported treatment effects are in comparison to a placebo (and if so, which of the two placebos in their study) or within arm baseline values. Our findings challenge the results of previous acute studies reporting beneficial effects of cherries on urate metabolism and highlight the need for future studies to include a control group. However, our participants were healthy and there is a need to confirm whether TC acutely alters urate metabolism in individuals with elevated sUA such as those suffering from gout.
Processed TC products (Ou et al., 2012), whole TC extracts (Seeram et al., 2001), or anthocyanins found in TC, namely cyanidin-3-glucosylrutinoside and cyanidin-3-rutinoside (Wang et al., 1999) have been shown to exert anti-inflammatory effects in vitro (Virgen Gen et al., 2020), reduce exercise-induced inflammation (Bell et al., 2014b, 2015, 2016; Dimitriou et al., 2015; Howatson et al., 2009; Levers et al., 2016) and lower serum CRP for up to 5 h after consumption in an uncontrolled study of purportedly healthy young adults with raised baseline CRP (Bell et al., 2014a). In contrast, we failed to observe a significant difference between TC and water with CRP falling between 2 and 5 h after the consumption of both drinks. This finding demonstrates the difficulty of interpreting results from uncontrolled studies. This is further illustrated by studies with longer intervention periods. For example, in healthy adults with normal CRP at baseline (Lynn et al., 2014) and obese adults with raised CRP at baseline (Martin et al., 2018) TC failed to lower CRP, relative to control groups, whereas an uncontrolled study reported that sweet cherry consumption lowered serum CRP after 14 and 28 days (Kelley et al., 2006).
The consumption of cherries has been proposed to reduce BP by altering the synthesis and activity of vasodilators and vasoconstrictors (Kelley et al., 2018). However, we observed no effect of TC juice on brachial or central BP or measures of arterial stiffness. The lack of modulation of BP contrasts with two studies that reported that TC reduced SBP for up to 3 h post consumption in men with early hypertension (Keane et al., 2016a) and middle-aged adults with moderately raised SBP (Keane et al., 2016c). The disagreement with our study may be explained by the lower baseline BP of our participants. In a review of factors influencing the effects of dietary anthocyanins on the regulation of BP, elevated baseline BP was highlighted as a major determinant of whether anthocyanins exerted hypotensive effects (Vendrame and Klimis-Zacas, 2019). The quantity of TC juice would also be expected to be important. Keane et al. (2016a) and Keane et al. (2016c) adminstered 60 mL of TC concentrate whereas we used 30 mL of concentrate. However, 30 mL is the typical suggested serving size for TC concentrate and therefore may be the amount commonly drunk by consumers. In agreement with our study, Desai et al. (2021) observed no acute effect of a single 30 mL serving of TC concentrate on SBP in individuals with metabolic syndrome, but they did report that 24 h ambulatory BP was reduced at the end of a 7-day intervention period. Thus, it is possible that a longer duration of intake is needed for 30 mL servings of TC concentrate to lower BP, although Lynn et al. (2014) failed to find an effect of 30 mL/d of TC concentrate consumed for 4 weeks by normotensive adults when BP was measured at laboratory visits.
TC might be expected to reduce arterial stiffness via urate lowering or through putative anti-oxidant and anti-inflammatory effects. However, we found no significant differences in PWV or AIx between TC and water over the 24-h measurement period. This is in line with Keane et al. (2016a) who reported no effect of 60 mL of TC concentrate on PWV or AIx over an 8-h measurement period. The lack of an acute effect of TC juice on PWV and AIx is consistent with studies of other polyphenol rich fruits (Del Bo et al., 2014; Richter et al., 2017; Rodriguez-Mateos et al., 2013, 2016), indicating that neither measure of arterial stiffness is particularly amenable to rapid modulation by polyphenol rich fruits.
This study has several limitations. First, our participants were apparently healthy, and TC might only benefit individuals with elevated sUA and markers of cardiovascular risk. Second, it is possible that TC juice may have changed some outcome markers outside the time-period we took measurements. Third, the TC concentrate we used may not have supplied sufficient bioactive compounds to exert an effect. Whilst our analyses of the TC concentrate revealed that a serving supplied a dose of total phenols within the range shown in other TC interventions to exert physiological effects (Connolly et al., 2006; Keane et al., 2016a), its content of intact anthocyanins was relatively low (Bell et al., 2014a; Martin and Coles, 2019). This could partly explain our null findings if intact anthocyanins are the primary compounds driving the biological actions of TC. Fourth, the study was not blinded, but this might have been expected to increase the likelihood of finding a treatment effect for an outcome such as BP which is particularly susceptible to the placebo effect (Howard et al., 2016). Fifth, although each participant arrived at the same time for both of their study visits we could not control their wake time, which could have introduced variability into our measurements given that many have been reported to exhibit diurnal patterns (Hernandez et al. 2024; Shimizu et al., 2023). Sixth, the final sample size was one less than the pre-determined sample size, because one participant dropped out. It is unlikely however that one more participant completing the study would have meaningfully changed the outcome for sUA, because the difference between TC and control was not close to statistically significant. The sample size was determined to detect a change in sUA so the study may have been underpowered to detect changes in other outcomes. Also, we did not power the study to investigate between sex differences in the response of urate metabolism to TC so the results of these analyses should be interpreted cautiously.
This study has several strengths. First, unlike some studies reporting a UA lowering effect of cherries (Bell et al., 2014a; Jacob et al., 2003), there was a control group. Second, diet was controlled during the study by giving participants standardised meals low in polyphenols the evening before and during the 24-h measurement periods and by providing clear guidance on consuming a diet low in polyphenols for the duration of the study. Third, the low-nitrate water control drink was devoid of factors that could influence uric acid metabolism and vascular function such as fructose and nitrate (Hobbs et al., 2013).
In conclusion, the present study found no evidence that a single serving of TC benefits urate metabolism, inflammation or markers of vascular function in healthy adults compared with a control drink of water. However, following consumption of both TC and water, changes in urate metabolism, inflammation and BP occurred over the 24-h measurement period likely reflecting diurnal fluctuations. Our findings need to be considered when interpreting the results of previous uncontrolled studies that have reported beneficial acute effects of TC juice or sweet cherries in healthy adults. Future controlled studies are needed to determine whether TC consumption exerts beneficial acute effects in individuals with hyperuricaemia or gout.
Footnotes
Acknowledgements
The authors are grateful to all our volunteers for their time and commitment to the study.
Authors’ contributions
Conceptualisation and methodology, KL and AL; Investigation, KL; Writing initial draft, KL; Writing – review and editing, AL; Writing – formatting, KL. All authors have approved the final version of this paper.
Ethical statement
The study was approved by Sheffield Hallam University (SHU) ethics committee (ER9199256) and registered at ClinicalTrials.gov (NCT04960527) before recruitment commenced. The study was conducted in accordance with the 1964 Declaration of Helsinki and its later amendments. Trial registry name and URL: ClinicalTrials.gov, ![]() .
.
Consent to participate
Written informed consent was obtained from all study participants.
Funding
The authors disclosed receipt of the following financial support for the research, authorship, and/or publication of this article: The study was funded by Sheffield Hallam University.
Declaration of conflicting interests
The authors declared the following potential conflicts of interest with respect to the research, authorship, and/or publication of this article: AL has previously been a recipient of a research grant from the Cherry Marketing Institute, Michigan, USA.
Availability of data and materials
The data that support the findings of this study are available from the corresponding author, AL, upon reasonable request.