
Abstract
Introduction
In the recommendation statement entitled “Weight Loss to Prevent Obesity-Related Morbidity and Mortality in Adults: Behavioral Interventions,” the United States Preventive Services Task Force (USPSTF) suggests primary care practitioners refer individuals with obesity to intensive, multi-component weight-loss interventions (Curry et al., 2018; LeBlanc et al., 2018). In the past, behavioral weight-loss interventions like those used in the Diabetes Prevention Program (DPP) (The Diabetes Prevention Program Research, 1999) and Look AHEAD (Wadden et al., 2006) trials focused on energy restriction and low-fat diets. In the DPP, the weight loss goal was at least 7% of initial body weight to be achieved through physical activity and initially a reduction in dietary fat to < 25% of energy (The Diabetes Prevention Program Research, 1999). The Look AHEAD lifestyle intervention was similar to that of the DPP, though the goal for energy from dietary fat was < 30% (Wadden et al., 2006). These trials provided evidence of some short-term benefits with respect to improving cardiovascular disease (CVD) risk factors and diabetes incidence (Knowler et al., 2002; Wing et al., 2013). However, long-term follow-up of these interventions failed to demonstrate reductions in CVD events (Goldberg et al., 2022) or mortality from CVD and cancer (Lee et al., 2021). In comparison, subsequent research has shown that a dietary pattern promoting a whole diet approach (Dalen and Devries, 2014) with a focus on fat and carbohydrate quality is associated with favorable chronic disease outcomes (Delgado-Lista et al., 2022; Estruch et al., 2018; Morze et al., 2020; Saraiya et al., 2020, 2024a).
In brief, the dietary pattern associated with reduced chronic disease risk includes (1) regular consumption of high-quality fats (fats from vegetable oils, nuts, seeds, and fish) (Wang et al., 2016) and high-quality carbohydrates (whole grains, fruits, and non-starchy vegetables) (Ludwig et al., 2018; Park et al., 2011; Wang et al., 2014) and (2) reduced intake of refined carbohydrates and processed foods (Rico-Campà et al., 2019). Importantly, this diet pattern—rich in fruits and non-starchy vegetables—provides a generous amount of phytonutrients, such as polyphenols, flavonoids, carotenoids, and other beneficial plant compounds that have been linked to the prevention and treatment of chronic diseases (Forni et al., 2019; Muscolo et al., 2024; Tufail et al., 2025; Zhang et al., 2015). This pattern resembles a Mediterranean-style (hereafter, termed Med-style) diet, which has been shown in meta-analyses of cohort studies to substantially reduce all-cause mortality, CVD, cancer, type 2 diabetes, and neurodegenerative disease risk (Morze et al., 2020) and in randomized controlled trials (RCTs) to substantially reduce CVD events when compared to low-fat diets (Delgado-Lista et al., 2022; Estruch et al., 2018). In the Med-style interventions arms of these RCTs (Delgado-Lista et al., 2022; Estruch et al., 2018), reported energy intake from fat increased from 37%–39% to ∼ 41% (primarily from intervention-recommended increases in non-saturated fat) while carbohydrate intake was reduced from 41%–42% to about 39%–40% of energy, with improved carbohydrate quality (Delgado-Lista et al., 2022; Estruch et al., 2018).
Given the importance of diet quality in reducing chronic disease risk and mortality, our group has collected detailed baseline dietary data on participants who enrolled in an RCT assessing the impact of a Med-style focused behavioral weight loss intervention on weight change. In this article, we describe baseline participant characteristics and diet quality, overall, and by subgroups often understudied in weight loss intervention studies and/or at increased risk for chronic diseases: males, Black or African Americans (hereafter, Black), and those with type 2 diabetes mellitus (T2DM). Of note, most randomized trials evaluating weight loss intervention have not carefully assessed baseline or change in diet quality (Al-Nimr et al., 2020; Cheng et al., 2023), particularly in older clinic-based cohorts with multiple chronic diseases (Cheng et al., 2023). Thus, carefully documenting baseline diet quality in our sample may provide key insights for developing and deploying dietary interventions designed to reduce obesity-related morbidity and mortality among individuals who enroll in intensive behavioral weight loss programs.
Methods
Study population and design
Participants enrolled in the Delicious Eating for Life in Southern Homes (DELISH) RCT comprised the study population. Participants were randomized to a behavioral weight loss intervention promoting a Med-style dietary pattern or to a commercial weight loss intervention, WW™ (previously Weight Watchers™), with the primary study outcome weight loss at 24 months. Based on a two-sided test of significance with α = 0.05, a standard deviation for percent change in weight of 7.3% (Embree et al., 2017), anticipated difference of 4% body weight loss between study groups, and attrition up to 20%, a sample of 350 participants provides 99% power to detect a difference in weight loss for all participants and 82% power for weight loss within subgroups of interest. A total of 360 participants were enrolled and comprised the sample for this cross-sectional analysis. A secondary objective of this study was to understand intervention acceptability and effectiveness among males, Black individuals, and persons with T2DM, sub-groups typically underrepresented in weight loss studies (Booth et al., 2014; Hartman et al., 2014; Katzmarzyk et al., 2018; Tsai et al., 2015; Yoong et al., 2013). Accordingly, during enrollment, we enriched our sample with a goal that males, Black participants, and persons with T2DM would each comprise at least 40% of the study sample. Contextually, we recognize race as a social construct grouping individuals based on shared physical, social, and/or cultural characteristics (Duncan and Montoya-Williams, 2024; Swilley-Martinez et al., 2023). We over-recruited and report results by race to (1) promote generalizability of findings and (2) better understand racial disparities in obesity prevalence and treatment (Duncan and Montoya-Williams, 2024). Enrollment took place from 06/12/2020 to 05/11/2022. This study was approved and monitored by the University of North Carolina (UNC) at Chapel Hill Institutional Review Board.
Participant enrollment
As described in detail elsewhere (Saraiya et al., 2024b), participants were enrolled from seven primary care practices in central North Carolina. Using data acquired from the UNC Health electronic health record, we identified 5322 patients with body mass index (BMI) ≥ 30 kg/m2 and age 18–75 years (inclusive) as potentially eligible. Primary care clinicians at participating study sites were asked to review a listing of their patients so identified and refer those they considered appropriate to take part in a behavioral weight loss intervention research study. Those referred received a phone call from study staff to confirm eligibility and assess interest. Study staff also reviewed the informed consent document with eligible and interested participants over the phone, and participants provided their consent either digitally or using a paper form.
Dietary assessment
The Harvard semi-quantitative Food Frequency Questionnaire (FFQ) (Hu et al., 1999; Rimm et al., 1992; Willett et al., 1985), which has been validated in comparison to other dietary assessment methods (Al-Shaar et al., 2021; Yuan et al., 2017), was used to assess dietary intake. In this study, the 2007 Harvard FFQ (SCRIBD, 2025) was used. The exact wording from the booklet was incorporated into a web-based survey, which participants completed online before the baseline study visit. A portion size was specified for each food item, and participants were asked how often, on average, a specified quantity was consumed during the past year, with frequency ranging from “never” on the low end to “1–6 or more” servings per day (depending on the food item) on the high end. Participants with implausible daily energy intake (< 500 kcal or > 3500 kcal for women and < 800 kcal or > 4200 kcal for men) were not included in the dietary data analysis. Harvard T.H. Chan School of Public Health (Boston, MA) provided nutrient analysis using the Harvard Nutrient Database (Harvard T.C. Chan School of Public Health, 2024). We used macronutrient data derived from this FFQ to compare diet quality in our sample to diet quality reported in other studies, many of which used similar FFQ assessments (Delgado-Lista et al., 2022; Estruch et al., 2018; Fernández-Ballart et al., 2010; Martin-Moreno et al., 1993).
Diet quality indexes
Items from the Harvard FFQ were used to calculate the following diet quality indexes: the Alternative Health Eating Index (AHEI-2010) (Chiuve et al., 2012), the Dietary Approaches to Stop Hypertension (DASH) score (Fung et al., 2008), and the Alternative Mediterranean Diet (aMED) score (Fung et al., 2009). eMethods 1 in the Supplemental Material contains detailed descriptions of the scoring algorithms used to calculate each diet quality index. The AHEI-2010 score is based on reported dietary intake, while DASH and aMED scores are based on reported intake relative to others in the sample. Because dietary items used to calculate the AHEI-2010 vary across studies, there are limitations to comparing AHEI scores across studies. Thus, we assessed relative diet quality among our participants using AHEI-2010 tertiles. We chose tertiles due to sample size limitations.
Objective measure of fruit and vegetable intake
Pressure-mediated reflection spectroscopy (Veggie Meter® model716W0224, Longevity Link Corp., Salt Lake City, UT) was used to record a skin carotenoid concentration (SCC) score. The right index finger was scanned three times, with study participants taking the finger out and reinserting it between scans. The mean of the three skin carotenoid measures was used for analyses. As previously described (Jilcott Pitts et al., 2022, 2023), SCC scores are highly correlated with plasma carotenoids (Jilcott Pitts et al., 2022) and sensitive to changes in daily carotenoid intake (Jilcott Pitts et al., 2023). Furthermore, SCC scores are a valid approximation of fruit and vegetable intake among various racial and ethnic groups, with the correlation between SCC scores and plasma carotenoids ranging from 0.64 for non-Hispanic blacks to 0.80 for Hispanic/Latino participants (Jilcott Pitts et al., 2022).
Assessment of covariates
In addition to the FFQ, the baseline surveys included demographic and medical data. A listing of medications was obtained at the baseline visit. Weight was assessed in pounds to the nearest tenth by electronic scale (Seca 874, Seca, Hanover, MD) as the average of two or three measures (difference between the first and second measures exceeding one pound required a third measure), and height was assessed with a portable stadiometer (Weigh and Measure, LLC, Olney, MD). After the participant was seated for 5 min, three automated blood pressure measurements were obtained (Omron HEM-907XL, Omron Healthcare, Lake Forest, IL) at 60 s intervals and averaged. Using standard phlebotomy techniques, blood samples were obtained (fasting requested for 9 h) for the measurement of hemoglobin A1c, total cholesterol, high-density lipoprotein cholesterol (HDL-C), low-density lipoprotein cholesterol (LDL-C), triglycerides, and C-reactive protein (CRP) at a commercial clinical lab (LabCorp, Burlington, NC).
Although we recognize gender is best reported using the terms men and women, in our baseline survey participants’ options to specify gender included male, female, transgender, additional category, and non-binary. Two participants did not select male or female and were not included in our analysis by gender. Participants specified their race by marking all options that apply from: White, Black or African American, Asian, American Indian or Alaska Native, Native Hawaiian or other Pacific Islander, or some other race. Five participants marked Black and White, and nine did not mark either category. In our analysis by race, we compared all who selected Black to all who did not select this option (categorized as other). Participants were classified as having T2DM based on self-report, if on medications for diabetes, or if baseline A1c ≥ 6.5%.
Statistical analysis
Distributions of demographic, clinical, and dietary factors were evaluated overall and by race, gender, diabetes status, BMI level, income level, and by tertile of the AHEI-2010 score. Continuous variables were reported as means with standard deviation unless highly skewed (Skew > 1), in which case medians with interquartile ranges were reported. Frequencies and percentages were reported for categorical variables. Crude diet quality index summary score differences between subgroups were assessed using t-tests. Linear regression estimated diet quality index summary score differences using a model that only adjusted for daily energy intake (continuous variable), and another model that additionally included age and BMI as continuous variables and gender (male/female) race (Black/other, diabetes status (yes/no) and income (≥ $80,000, < $80,000, missing data) as categorical variables. All analyses were conducted using the SAS version 9.4 (SAS Institute, Cary, NC). A P-value < 0.05 was considered statistically significant.
Results
Table 1 describes study participants’ demographic characteristics overall and by sub-groups (gender: male/female; race: Black/other; diabetes status: with/without T2DM; BMI category: above/below median BMI of 35.1 kg/m2; income level: low/high (</≥ $80,000). The mean (SD) age was 54.7 (12.0) years, 44.1% were male, 36.7% self-identified as Black, and 32.5% had T2DM. Among the 158 males, 19.0% self-identified as Black and 24.1% had diabetes. Among the 117 persons with diabetes, 32.5% were male and 45.3% self-identified as Black. Overall, our sample was well educated, with only 10% not attending some college, and most (94.7%) had health insurance at enrollment. Almost 50% of the sample reported annual household income > $80,000 per year.
Baseline demographic characteristics: overall and by subgroups.
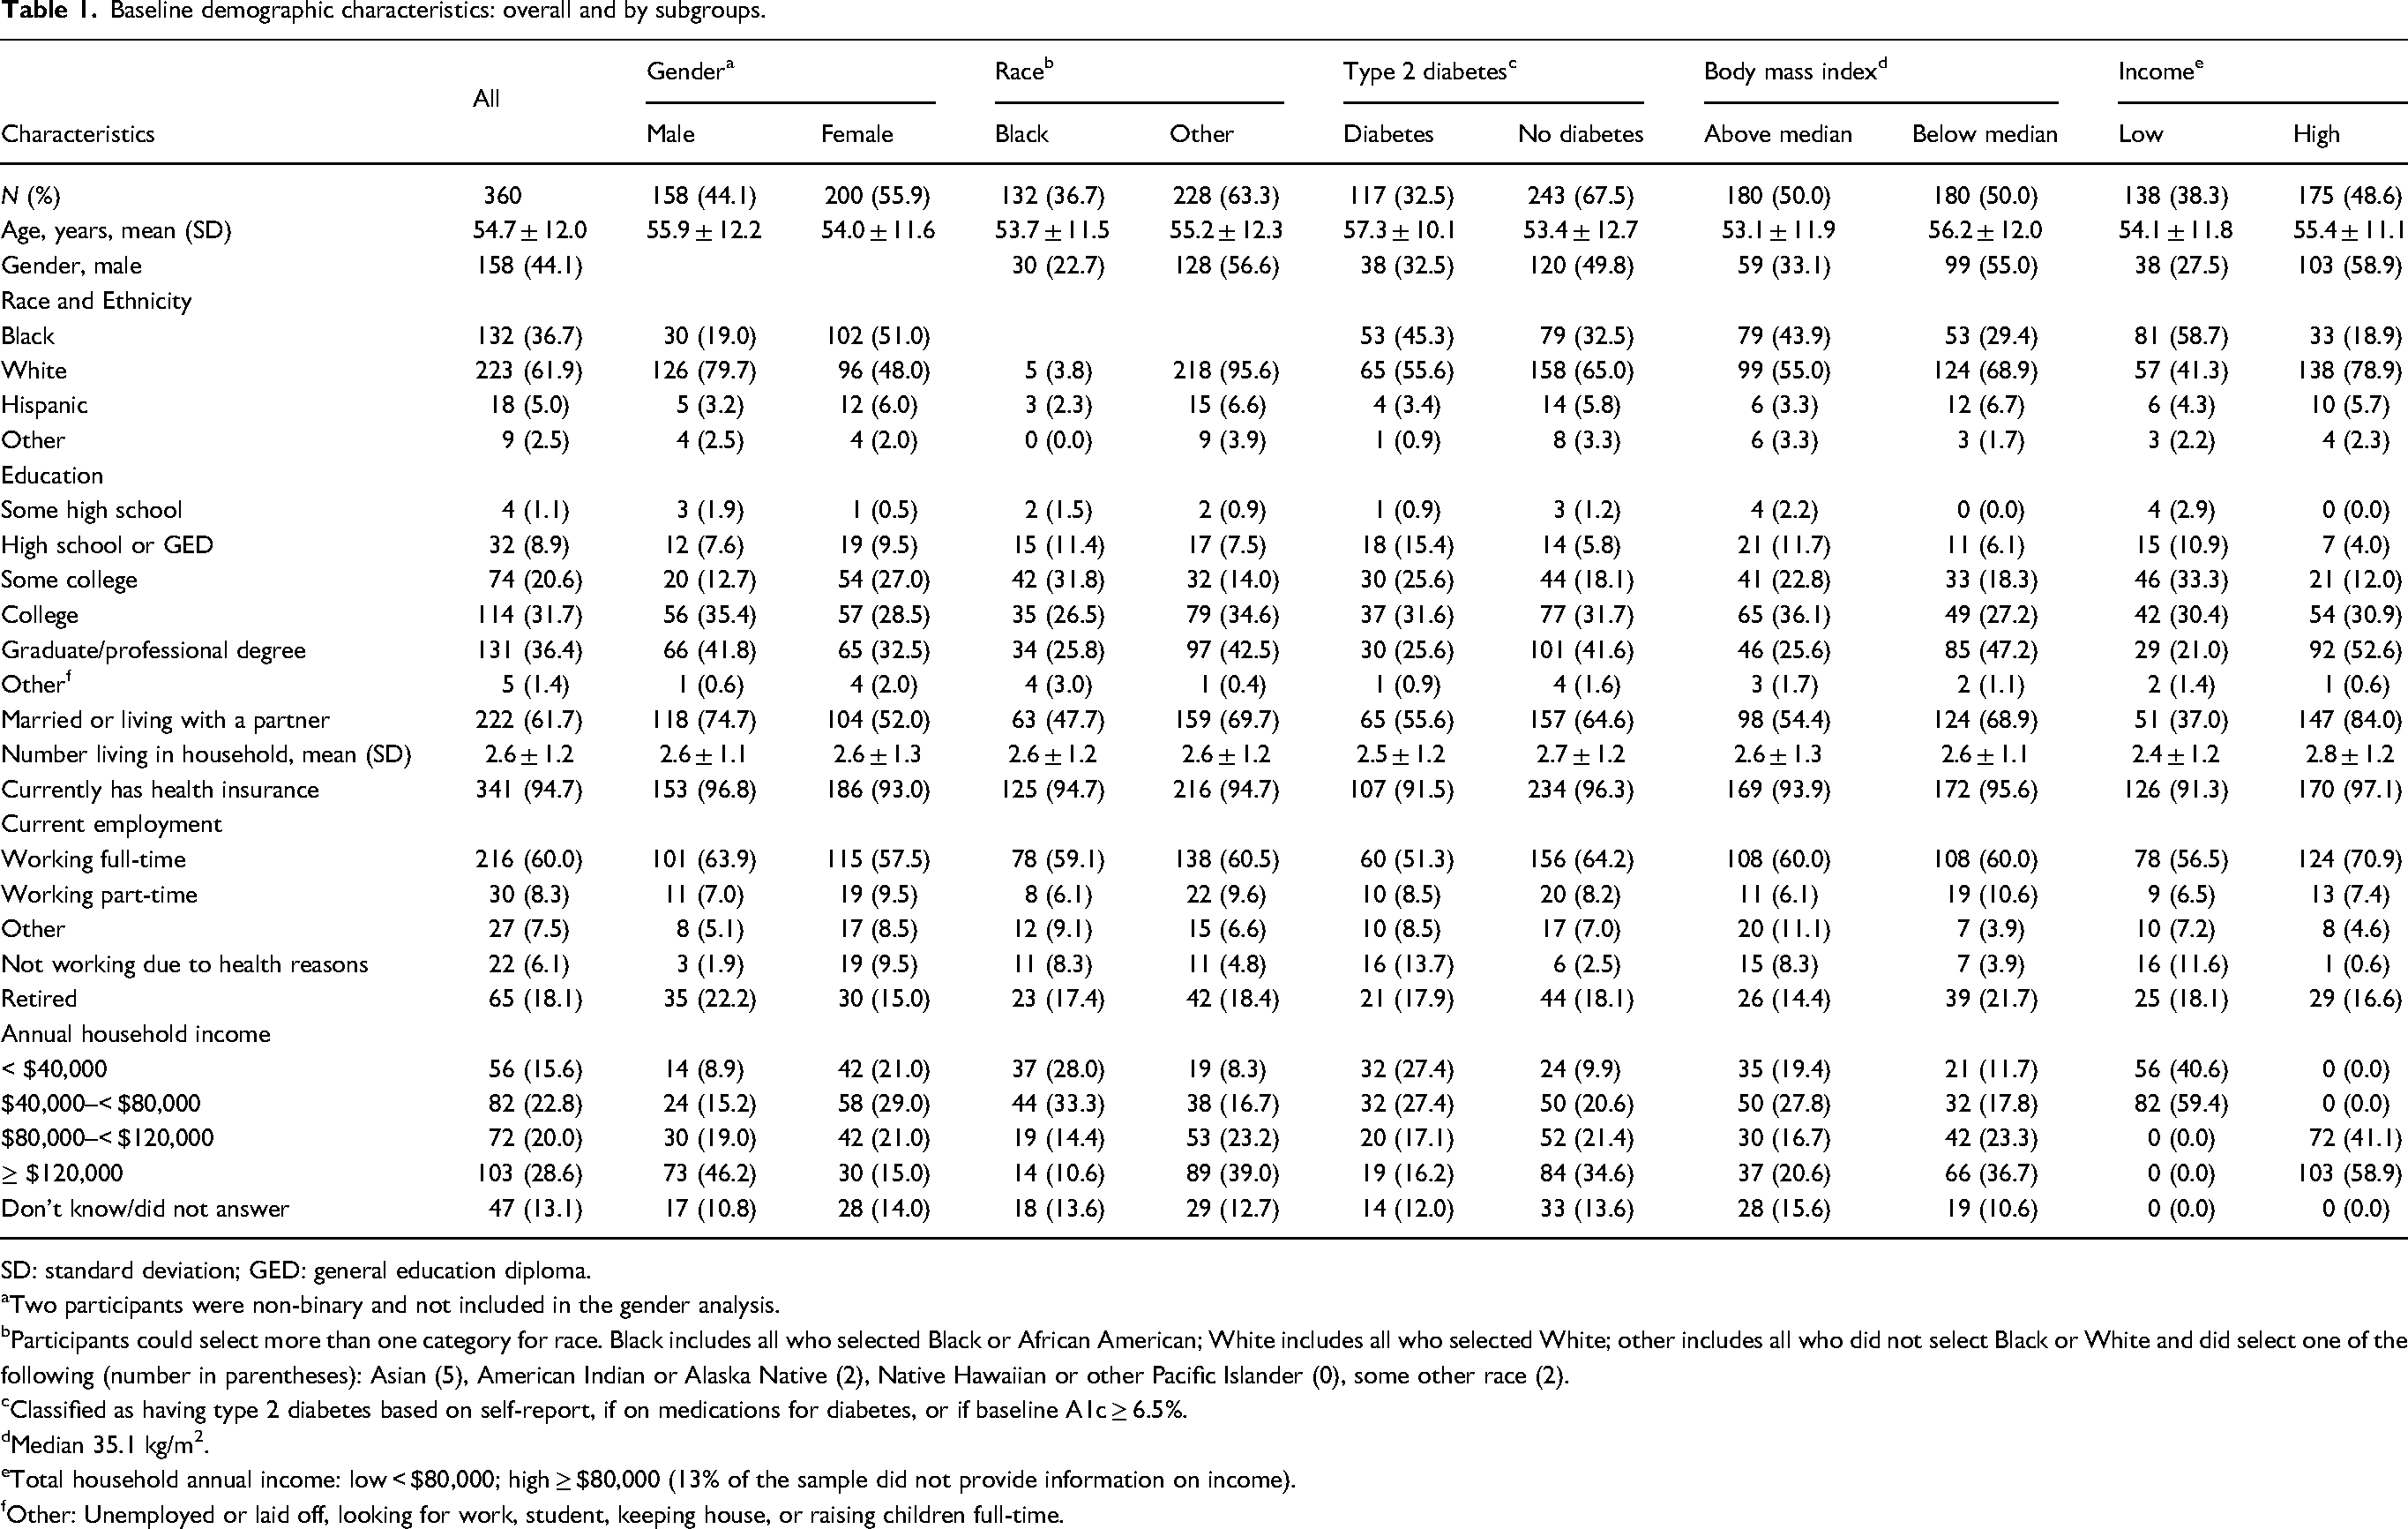
SD: standard deviation; GED: general education diploma.
Two participants were non-binary and not included in the gender analysis.
Participants could select more than one category for race. Black includes all who selected Black or African American; White includes all who selected White; other includes all who did not select Black or White and did select one of the following (number in parentheses): Asian (5), American Indian or Alaska Native (2), Native Hawaiian or other Pacific Islander (0), some other race (2).
Classified as having type 2 diabetes based on self-report, if on medications for diabetes, or if baseline A1c ≥ 6.5%.
Median 35.1 kg/m2.
Total household annual income: low < $80,000; high ≥ $80,000 (13% of the sample did not provide information on income).
Other: Unemployed or laid off, looking for work, student, keeping house, or raising children full-time.
Table 2 displays study participant characteristics related to medical conditions and physiologic measures. The prevalence of hypertension, hypercholesterolemia, and diabetes was 56.7%, 42.3%, and 32.5%, respectively. Among sub-groups of interest: (1) males, Black participants, persons with T2DM, and those reporting low-income had higher prevalence of hypertension and use of hypertensive medication, (2) males, those with T2DM, and those with lower income had higher hypercholesterolemia prevalence, and (3) females, Black participants, those with high BMI, and those reporting lower income had higher diabetes prevalence. Tobacco use was minimal.
Medical conditions and physiologic measures: overall, and by subgroups.
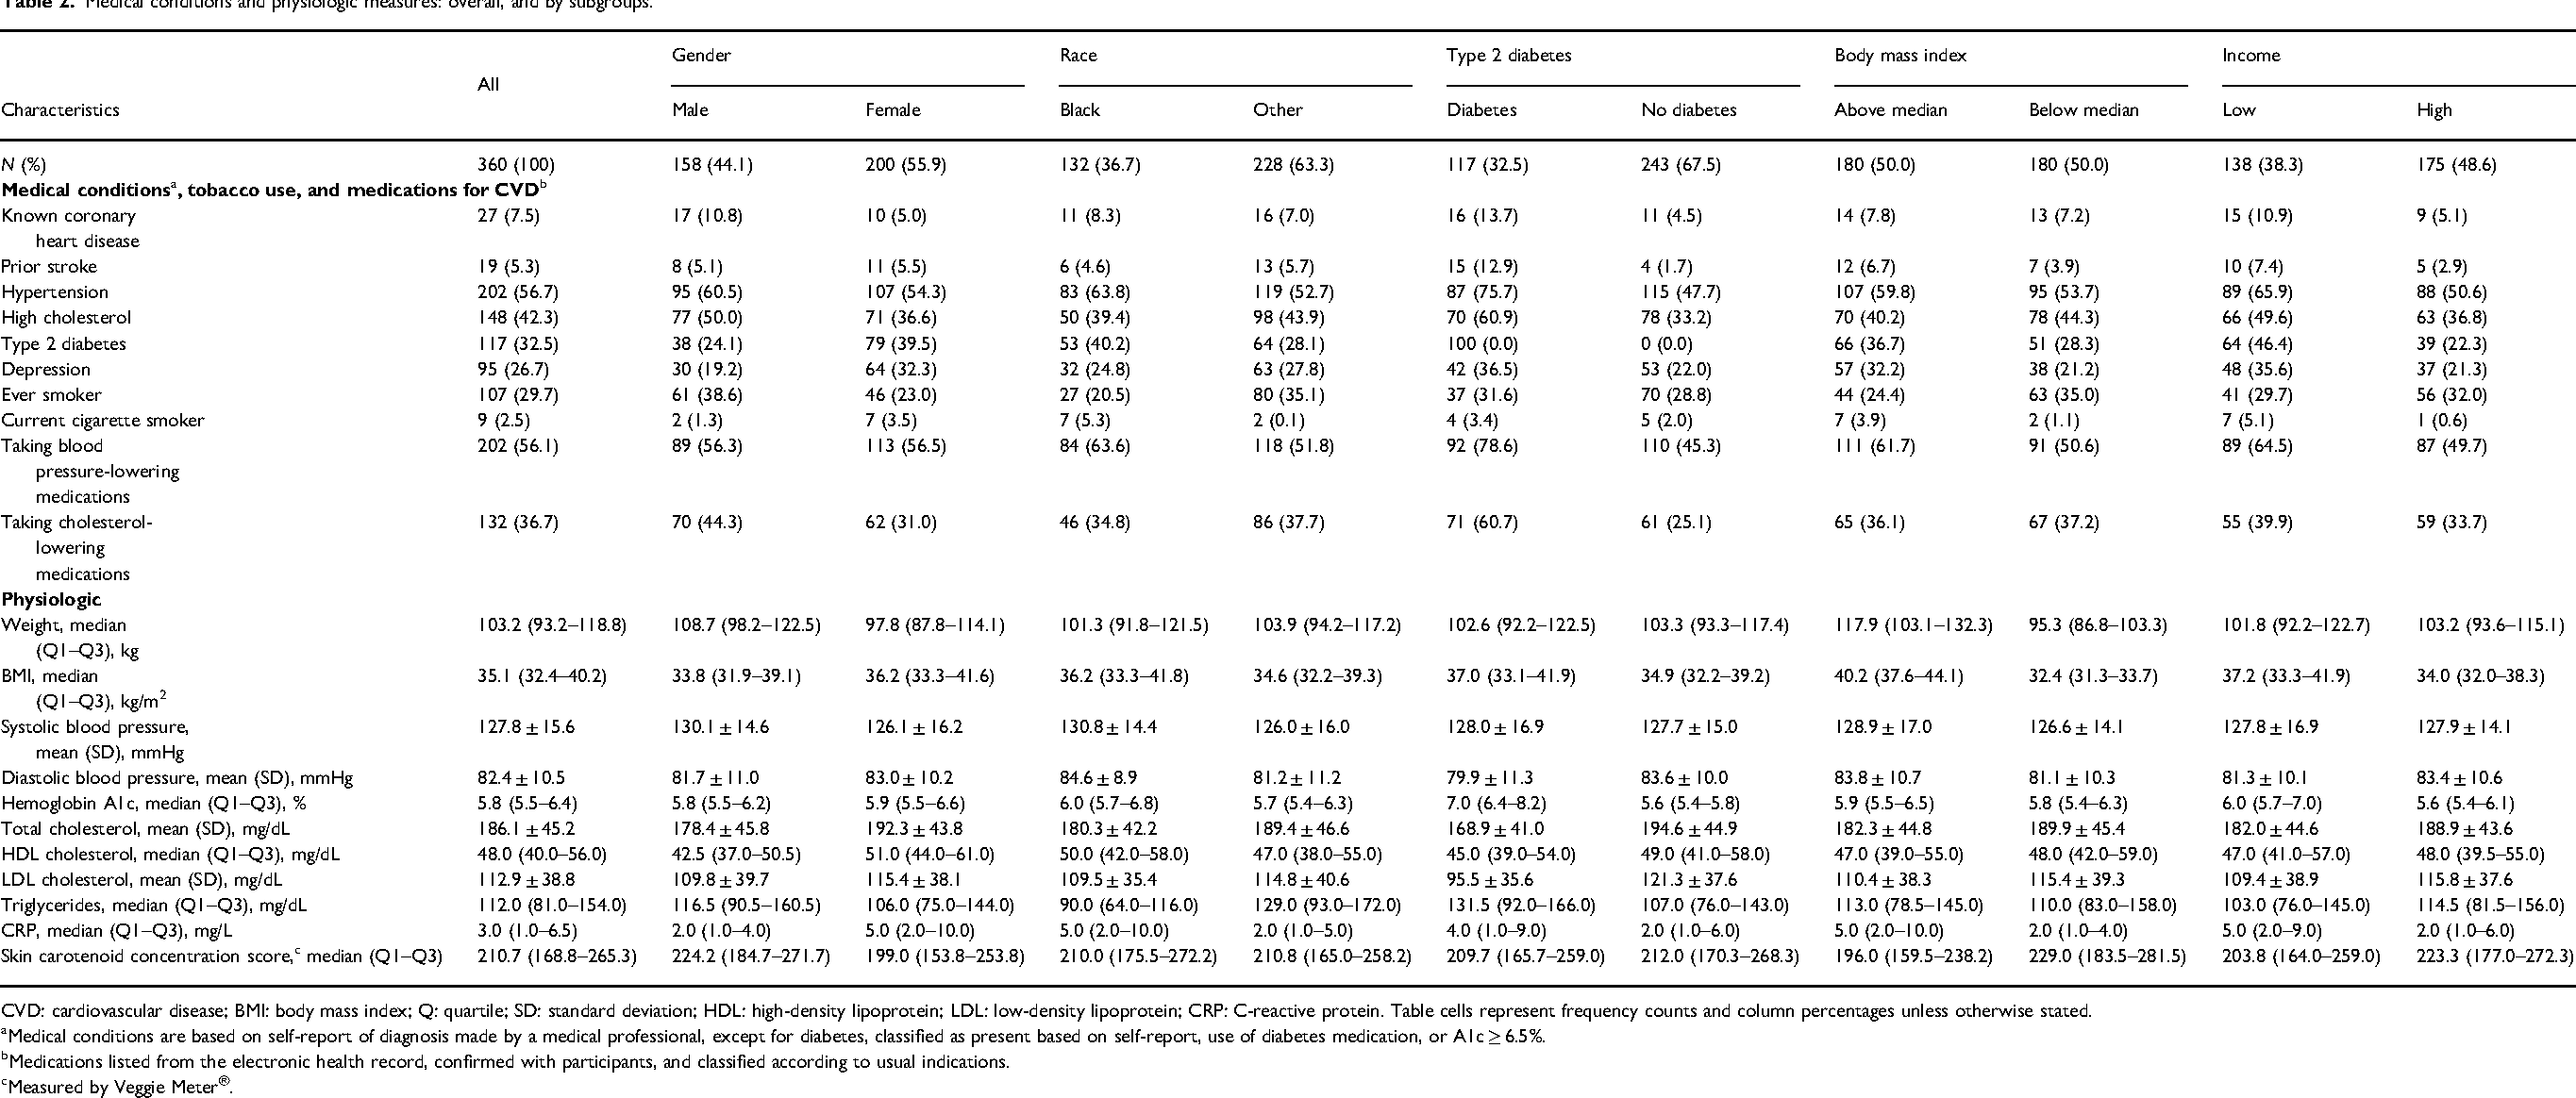
CVD: cardiovascular disease; BMI: body mass index; Q: quartile; SD: standard deviation; HDL: high-density lipoprotein; LDL: low-density lipoprotein; CRP: C-reactive protein. Table cells represent frequency counts and column percentages unless otherwise stated.
Medical conditions are based on self-report of diagnosis made by a medical professional, except for diabetes, classified as present based on self-report, use of diabetes medication, or A1c ≥ 6.5%.
Medications listed from the electronic health record, confirmed with participants, and classified according to usual indications.
Measured by Veggie Meter®.
The median (Q1–Q3) weight was 103.2 (93.2–118.8) kg and BMI 35.1 (32.4–40.2) kg/m2. While over half the sample reported hypertension, measured blood pressure was near goal levels (systolic blood pressure < 130 mmHg and diastolic blood pressure < 80 mmHg), and lipid levels were also well controlled. CRP was higher among females, Black participants, and among those with T2DM, high BMI, and low income.
Table 3 displays self-reported dietary intakes, SCC score, and diet quality index scores overall and by sub-groups. One participant did not complete the FFQ, and 13 had implausible energy levels, yielding a sample of 346 for data reported in Table 3. The median (Q1–Q3) reported total energy was 1641 (1241–2147) kcal/day. Among Black participants, reported total energy was 326 kcal/day less than that reported by individuals of other race. Compared to males and females of other race, Black males and Black females reported 393 and 186 kcal/day less energy intake, respectively (data not shown). Overall, energy intake by macronutrients was 16.2% for protein, 37.2% for fat, and 44.8% for carbohydrate, and did not vary appreciably by sub-groups. Median energy from saturated fat (12.1%), monounsaturated fat (13.5%), and polyunsaturated fat (8.1%) was consistent across sub-groups. Among all study participants, median (Q1–Q3) total fiber intake was 17.0 (12.3–23.4) g/day and was higher for males, those of other race, and those with lower BMI. Total sugar intake was higher for other race, those with diabetes, and those with low income. Reported alcohol intake was generally low, but substantially higher for males compared to females. Reported sodium intake was higher for other race and those with diabetes.
Self-reported dietary intake, skin carotenoids, and diet quality indexes: overall, and by subgroups a .
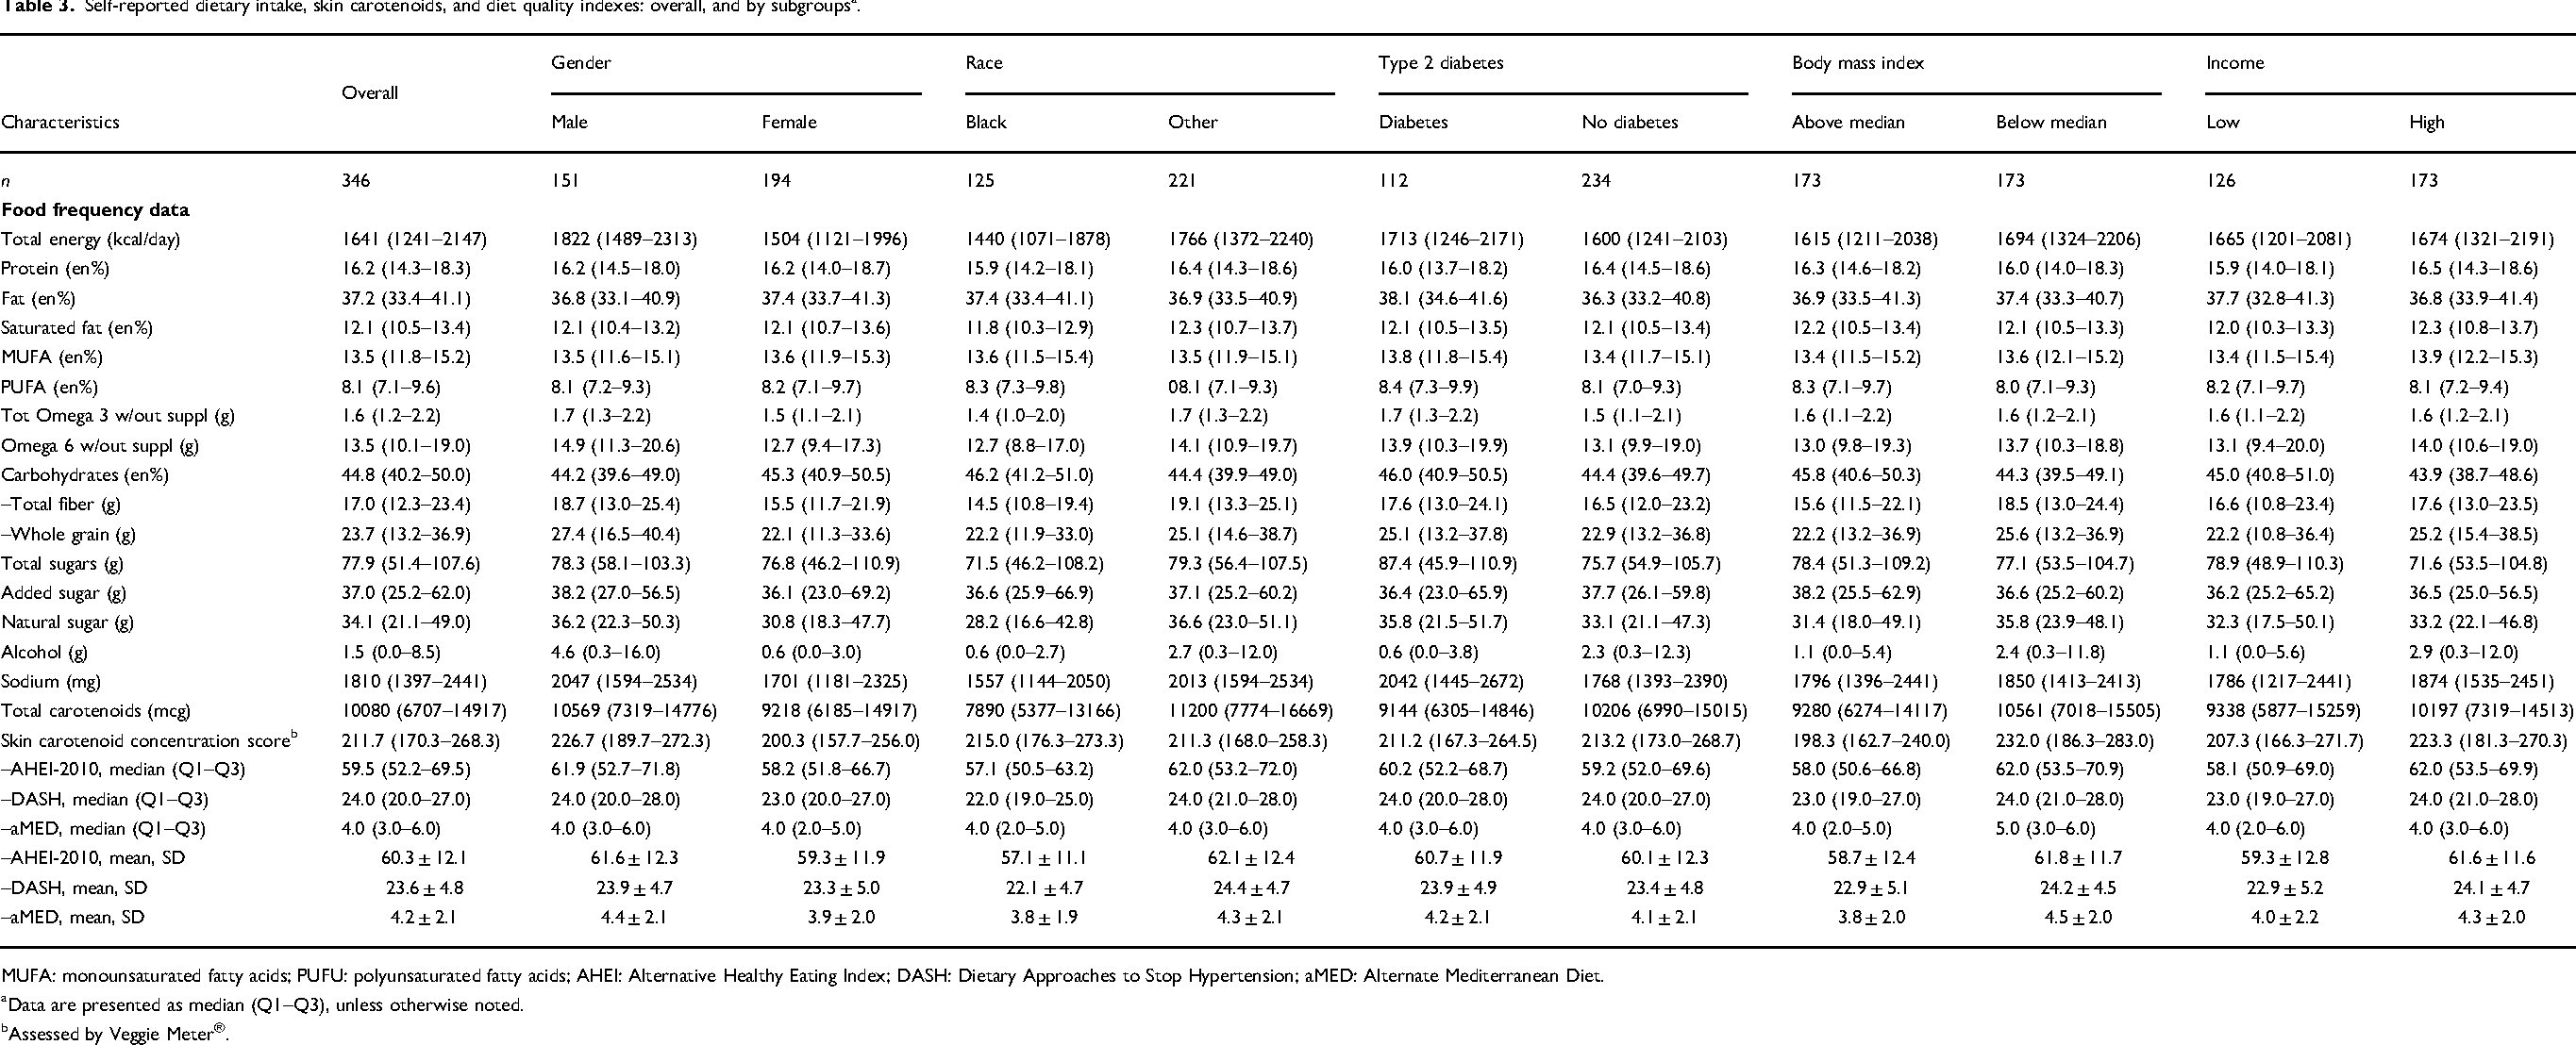
MUFA: monounsaturated fatty acids; PUFU: polyunsaturated fatty acids; AHEI: Alternative Healthy Eating Index; DASH: Dietary Approaches to Stop Hypertension; aMED: Alternate Mediterranean Diet.
Data are presented as median (Q1–Q3), unless otherwise noted.
Assessed by Veggie Meter®.
The median (Q1–Q3) self-reported intake for carotenoids was 10,080 (6707–14917) µg/day. Black participants reported much lower carotenoid intake than participants of other race. The median SCC score was 212, and SCC scores were similar across racial subgroups and were higher among those with lower BMI and higher income.
Table 3 also reports median and mean scores for the diet quality indexes. The mean (SD) summary score among all study participants for the AHEI-2010, DASH, and aMED diet quality indexes was 60.3 (1.2), 23.6 (4.9), and 4.2 (2.1), respectively. Figure 1 provides a graphical representation of the diet quality index scores distributions by subgroups of interest. Summary scores were higher for males, and for those of other race, with lower BMI, and higher income.
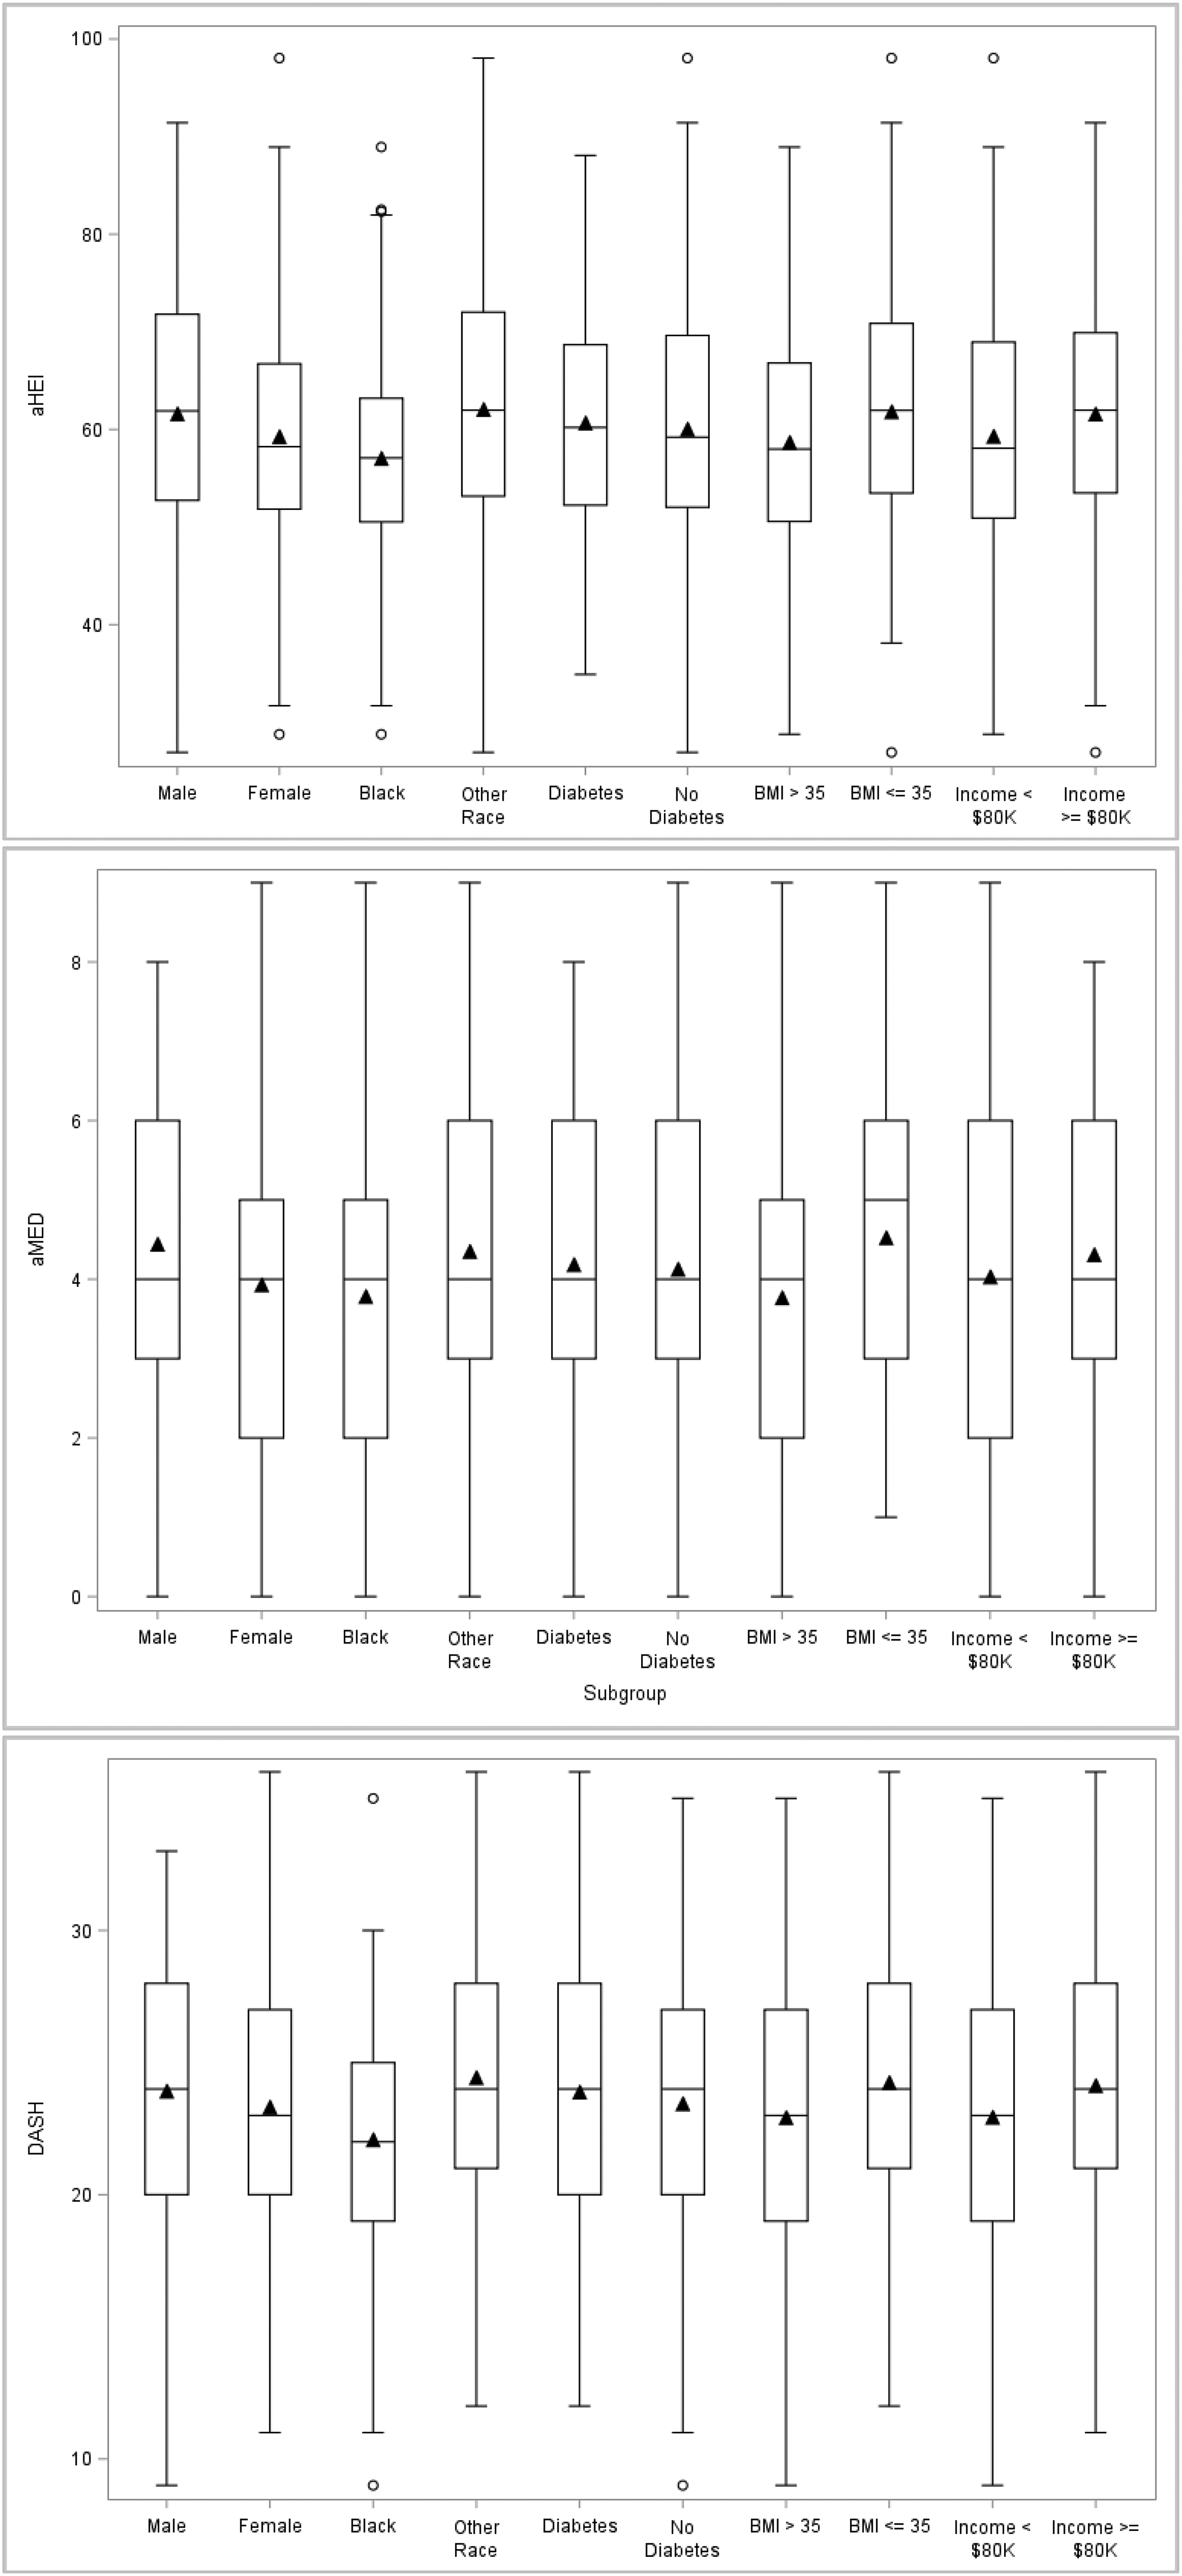
Diet quality index values for study participants by sub-groups. The vertical axis depicts the total score for each of the food quality indexes. The boxes represent the IQR with a bar inside indicating the median and the triangle indicating the mean values. The whiskers extend to the highest and lowest values within 1.5 times above or below the IQR quartiles, with points outside the whiskers representing more extreme values.
Table 4 reports crude and adjusted diet quality summary score differences by subgroups of interest. In the unadjusted model, comparisons were statistically significant for race and BMI for all indexes, with findings generally similar when controlling for energy (except aMED not significant for race). In the fully adjusted model (Table 5), younger age and Black race were significant predictors of lower AHEI-2010 and DASH index scores; for aMED, significant predictors of a lower score were low reported energy intake, younger age, and higher BMI.
Comparisons of dietary index scores, crude and adjusted for energy.
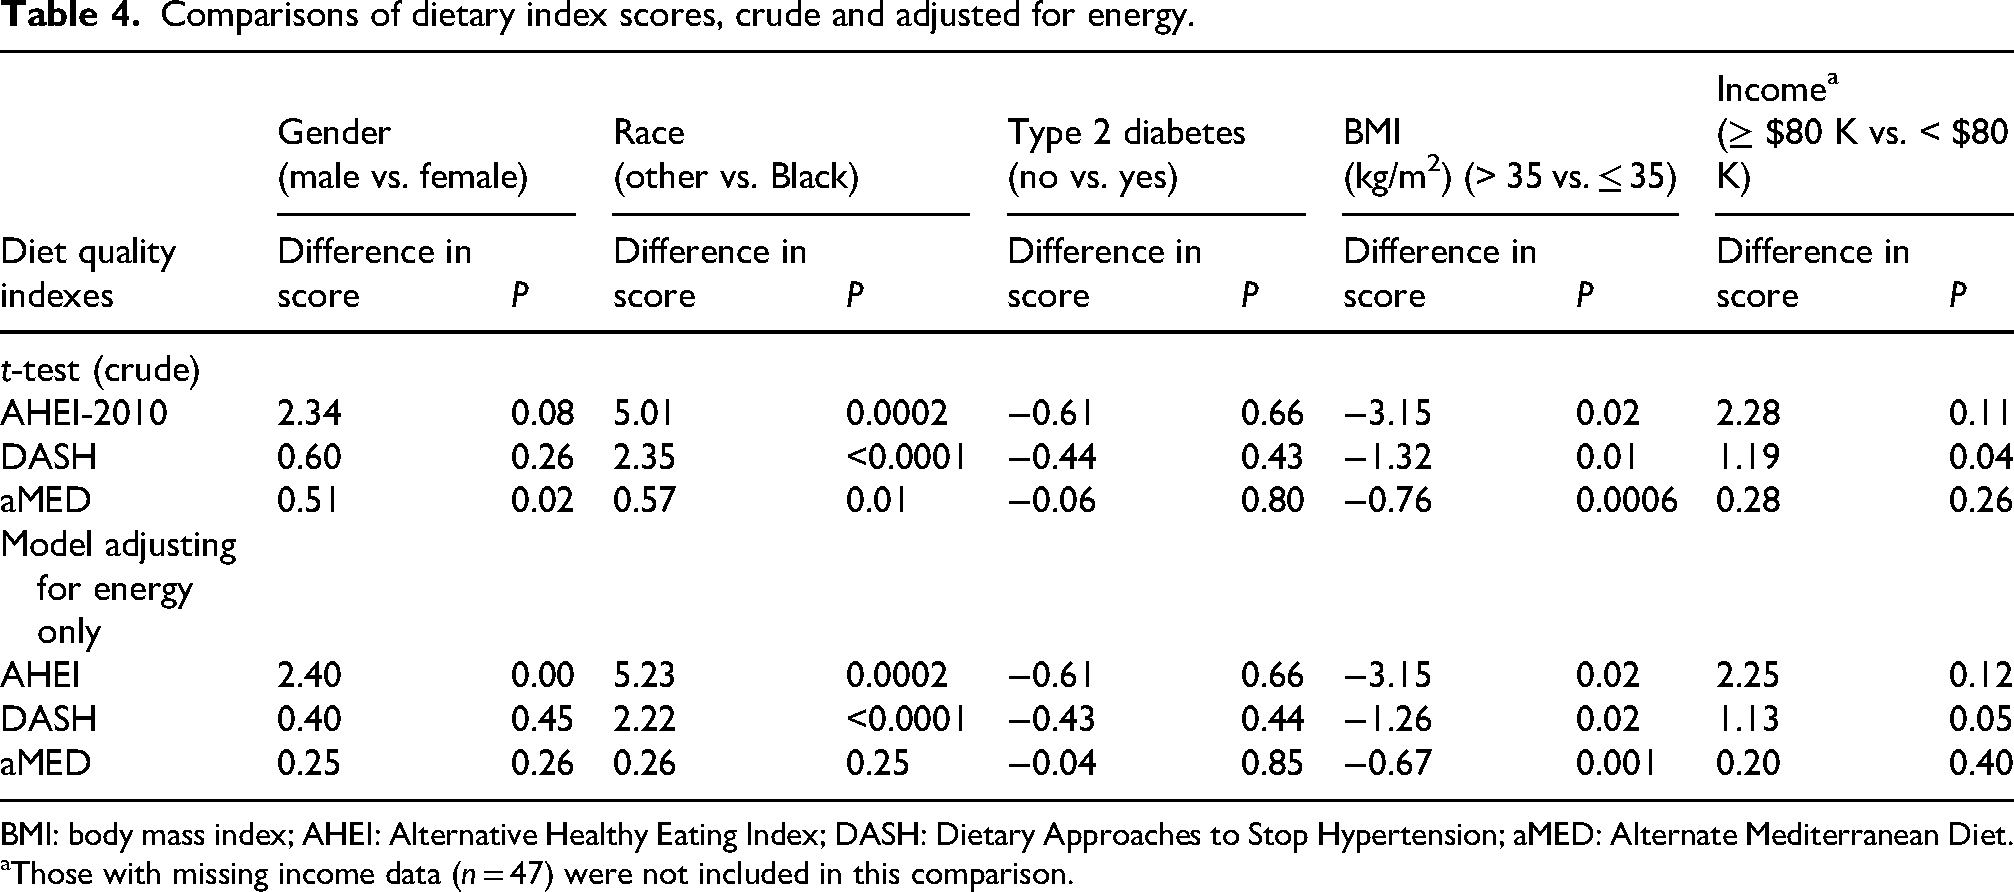
BMI: body mass index; AHEI: Alternative Healthy Eating Index; DASH: Dietary Approaches to Stop Hypertension; aMED: Alternate Mediterranean Diet.
Those with missing income data (n = 47) were not included in this comparison.
Comparisons of dietary index in multivariable adjusted models.
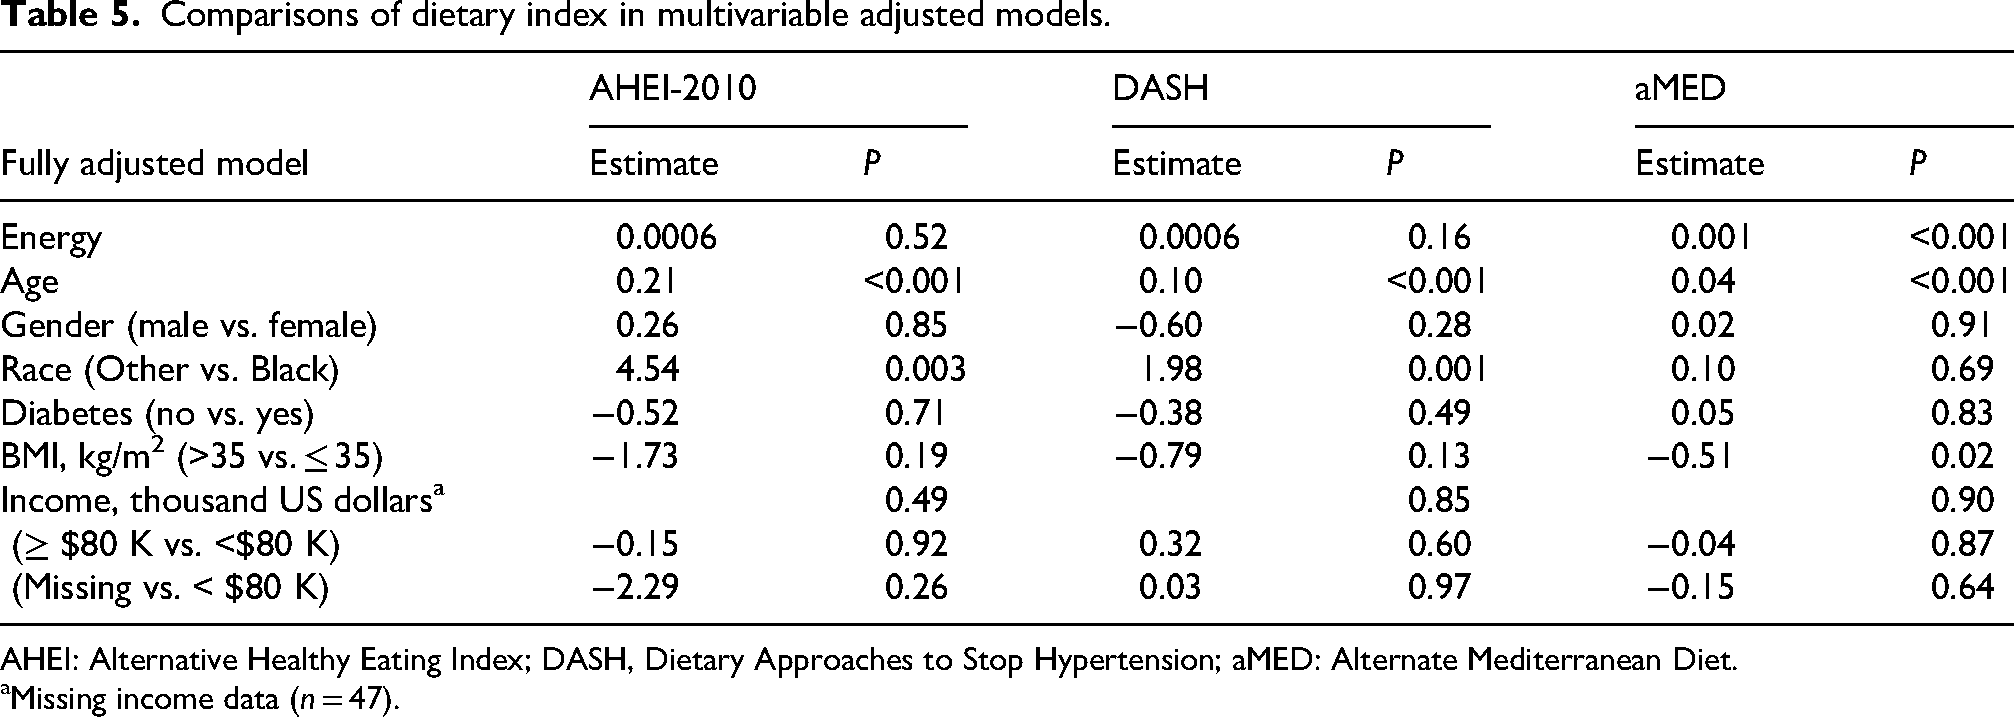
AHEI: Alternative Healthy Eating Index; DASH, Dietary Approaches to Stop Hypertension; aMED: Alternate Mediterranean Diet.
Missing income data (n = 47).
Table 6 reports participant characteristics and dietary behaviors by AHEI-2010 tertile score overall and by gender. Among demographic factors, older age was consistently and strongly associated with better diet quality. Income and education levels appeared to be positively associated with AHEI-2010 tertiles, while Black participants and those with lower income were less likely to be classified into the highest AHEI-2010 tertile category. Diabetes status did not appear to be associated with AHEI-2010 tertiles.
Study variables by AHEI tertiles, overall and by gender a .
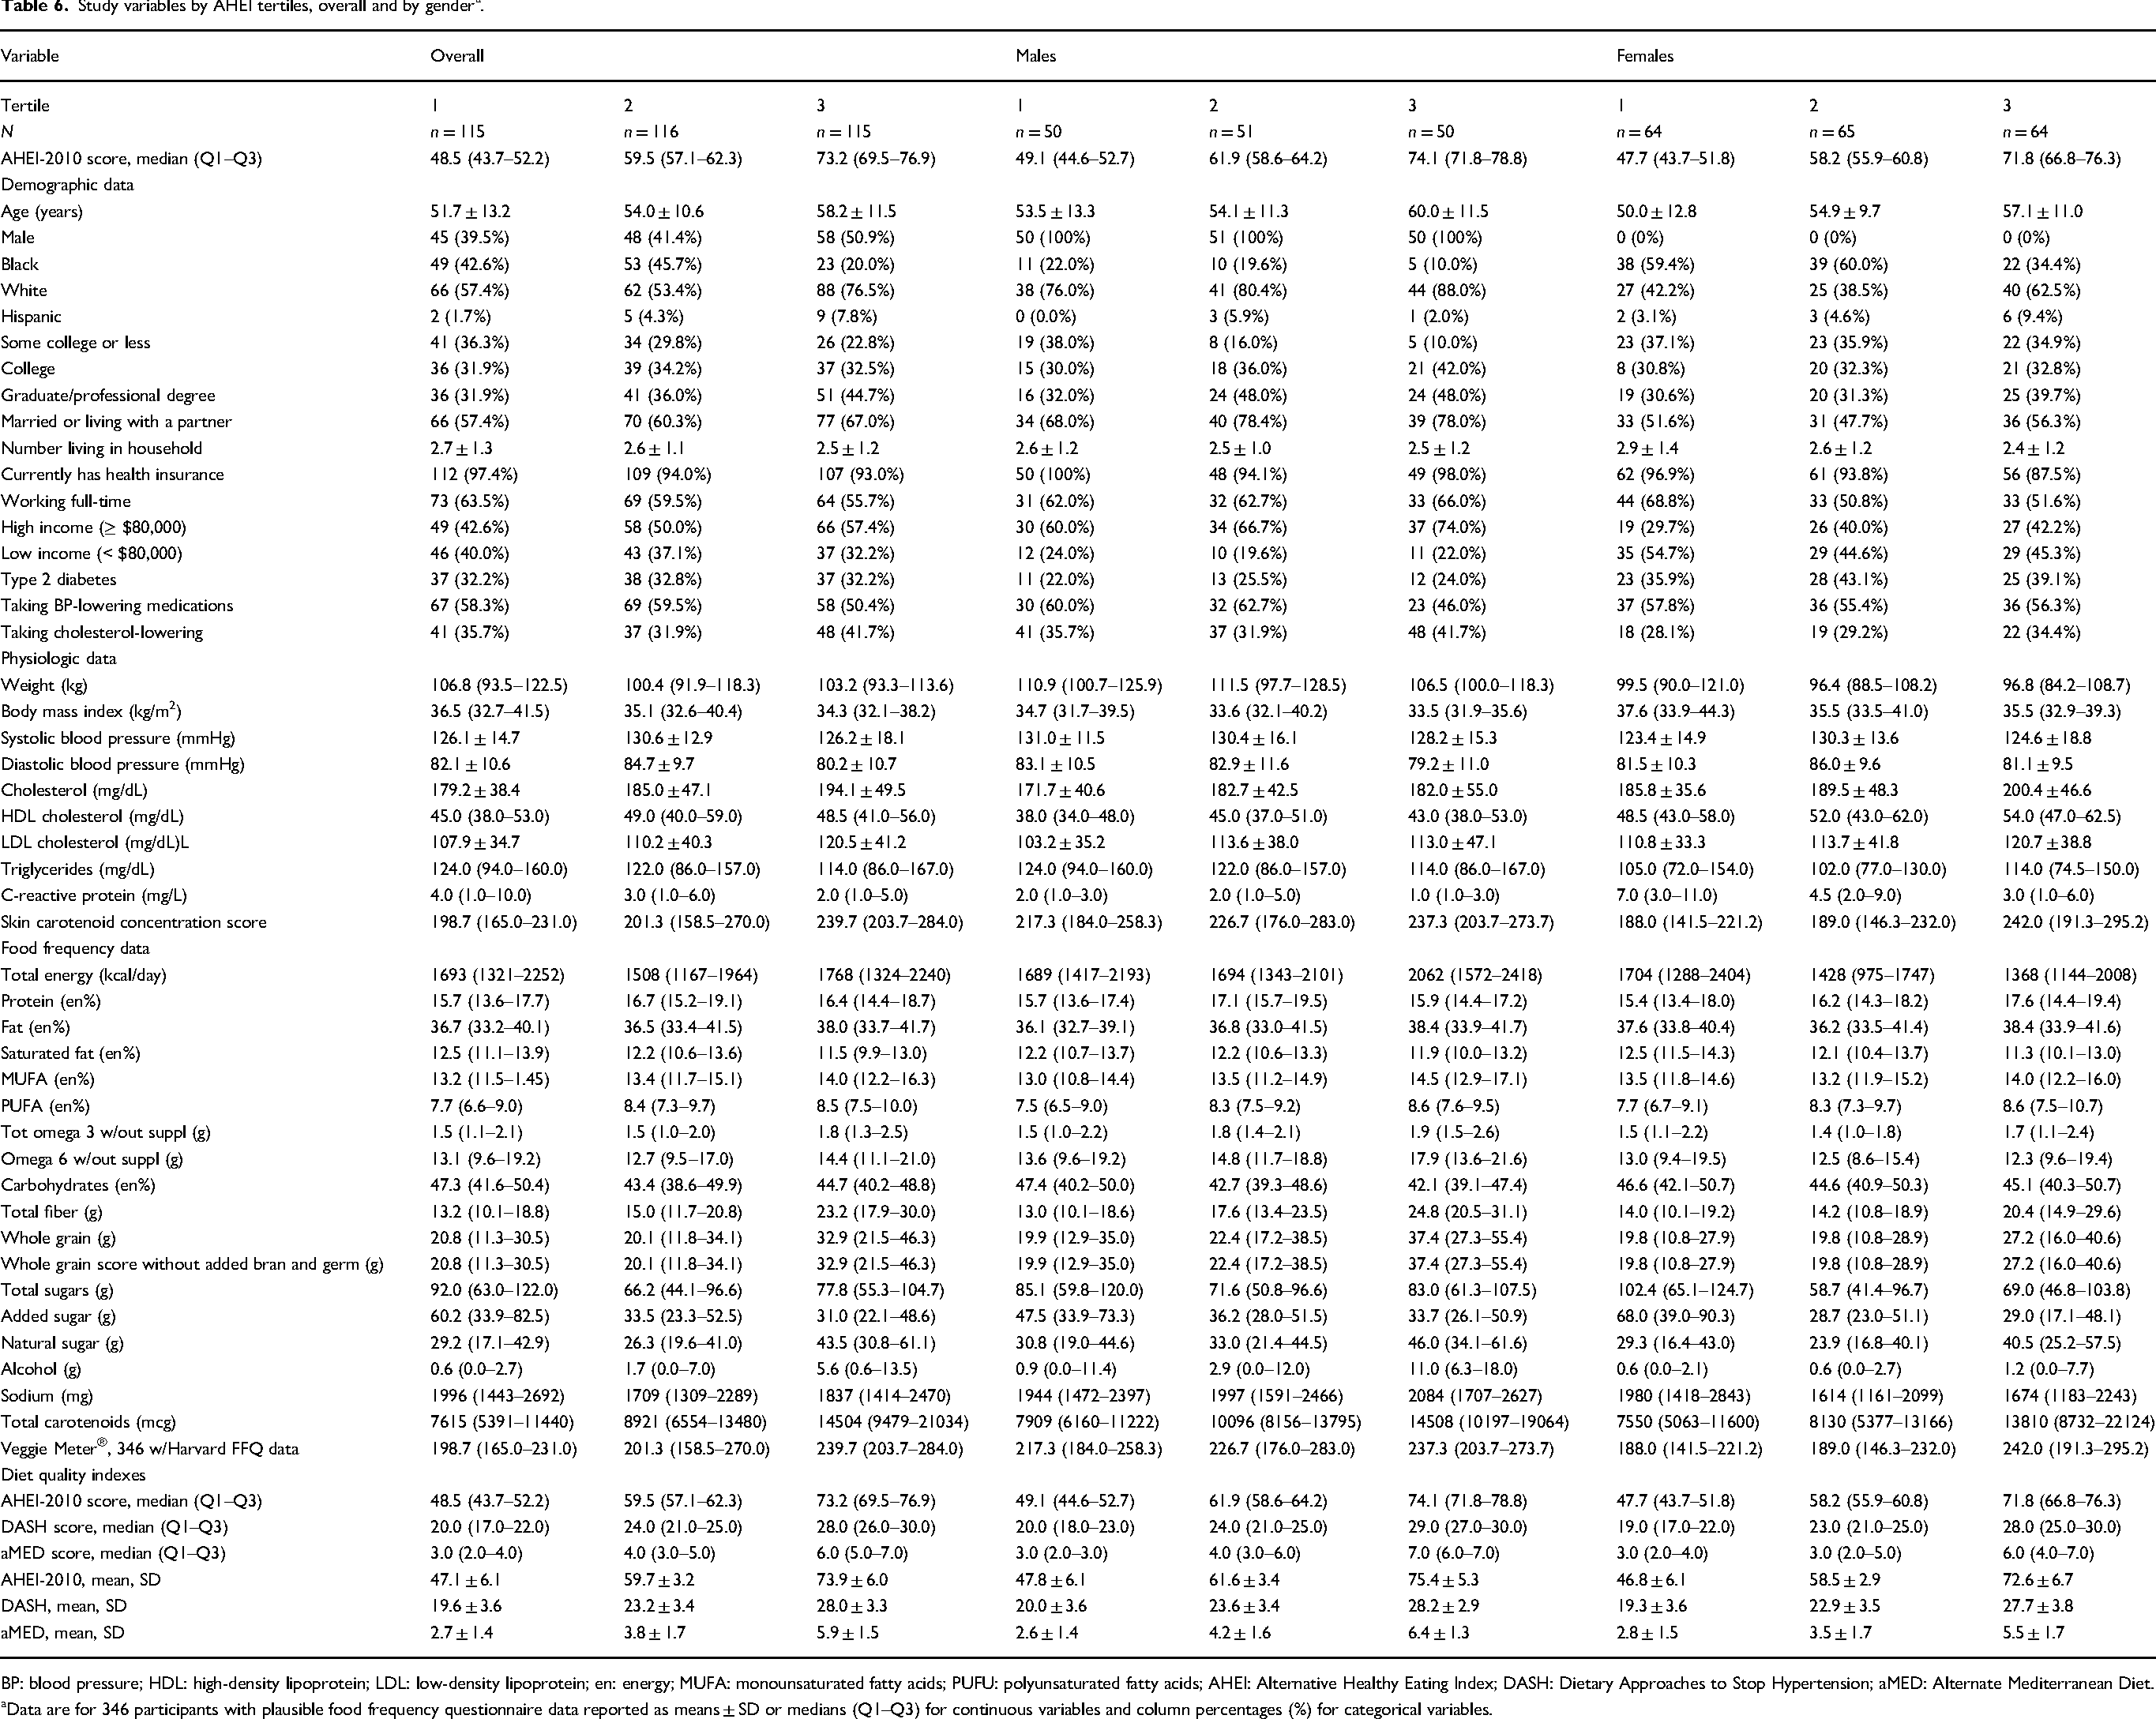
BP: blood pressure; HDL: high-density lipoprotein; LDL: low-density lipoprotein; en: energy; MUFA: monounsaturated fatty acids; PUFU: polyunsaturated fatty acids; AHEI: Alternative Healthy Eating Index; DASH: Dietary Approaches to Stop Hypertension; aMED: Alternate Mediterranean Diet.
Data are for 346 participants with plausible food frequency questionnaire data reported as means ± SD or medians (Q1–Q3) for continuous variables and column percentages (%) for categorical variables.
Regarding dietary behaviors, total energy intake patterns differed by gender. For males, those in the high AHEI-2010 tertile reported materially greater total energy intake, while women in this tertile reported less energy intake. Overall and by gender, energy from protein and fat did not vary by AHEI-2010 tertile. For energy from carbohydrates, overall, those in the lowest tertile reported greater intake, with the gradient greater for males. Overall, the trend for total fiber and whole grain intake tended to be higher by increasing AHEI-2010 tertile score, with a steeper gradient across tertiles for males than females. For sodium, males in the high tertile reported greater intake, while females in this tertile reported lower intake. Overall and by gender, there was a relatively steep gradient in self-reported carotenoid intake across tertiles, with a similar pattern but a less steep gradient in SCC score.
Discussion
In this study, we report baseline diet quality among participants enrolled in the DELISH weight loss randomized trial. Enrollment from primary care practices yielded a sample that was relatively older in age with high prevalence of hypertension, hypercholesterolemia, and T2DM, a sample very likely to benefit from eating a healthful dietary pattern (Delgado-Lista et al., 2022; Estruch et al., 2018; Morze et al., 2020). Yet, overall, the macronutrient profile of our participants did not align with the Med-style pattern associated with favorable chronic disease outcomes, emphasizing the need to assess and address diet quality in behavioral weight loss interventions targeting a reduction in obesity-related morbidity and mortality.
For fat intake assessed as a percentage of total energy, DELISH participants consumed less total fat (37% vs. 41%) and significantly less MUFA (13% vs. 21–22%) compared to participants in the Med-style arms of PREDIMED and CORDIOPREV (Delgado-Lista et al., 2022; Estruch et al., 2018). In addition, consumption of saturated fat was substantially higher (13% vs. 8%–9%) than in the PREDIMED and CORDIOPREV Med-style intervention arms (Delgado-Lista et al., 2022; Estruch et al., 2018). Regarding carbohydrate quantity, DELISH participants had a greater contribution to total energy from carbohydrates (45% vs. 39%–40%) than those in the intervention arms evaluated in PREDIMED and CORDIOPREV (Delgado-Lista et al., 2022; Estruch et al., 2018). As a crude measure of carbohydrate quality, DELISH participants reported less total fiber intake (17 g/day) compared to PREDIMED MED-style arm participants (26 g/day) (Estruch et al., 2018) and CORDIOPREV Med-style intervention arms participants (27 g/day) (Delgado-Lista et al., 2022). Adjusting for energy, fiber intake in these studies per 1000 kcal/day was 10.3, 11.5, and 12 g/day, for DELISH, PREDIMED, and CORDIOPREV, respectively. Of note, energy from protein intake was virtually identical across DELISH, PREDIMED, and CORDIOPREV at 16% and at baseline, overall diet quality was better for the European cohorts (Delgado-Lista et al., 2022; Estruch et al., 2018) compared to the DELISH sample.
The energy intake and macronutrient profile reported by DELISH participants are consistent with other studies using a similar FFQ. For example, mean energy intake for women in the Nurses’ Health Study was 1702 kcal/day for the middle quintile and 1939 kcal/day for the middle quintile among men in the health professionals follow-up study (Yeh et al., 2022), compared to a median 1504 and 1822 kcal/day among women and men in our sample, respectively. In a report that compiled National Health and Nutrition Examination Survey (NHANES) data from cycles 2013 to 2016, McClure and colleagues (McClure et al., 2020) report macronutrient data for 947 participants with and 3352 participants without diabetes. In this sample, total fat provided ∼35%, total carbohydrate about 48%, and protein ∼16% of total energy. Further, daily fiber intake was about 8 g/1000 kcal, and saturated fat about 11.5% of energy. As in our sample, differences in macronutrient intake between those with and without diabetes were minimal.
There were relatively large differences in diet quality between subgroups. In our fully adjusted model, Black and younger participants had statistically significantly lower AHEI-2010 and DASH diet quality scores than other race and older participants, respectively. Similar patterns of poorer diet quality for these groups have been observed in National Health and Nutrition Examination Survey (NHANES) data (Liu and Mozaffarian, 2024; Rehm et al., 2016).
While there is no consensus on the definition of a “low” versus a “high” Veggie Meter®-assessed SCC score, Obana et al. define a score < 239 as “severe shortage of vegetables” and a score of > 396 as “doing well” and “excellent” (Obana et al., 2022). Overall, Veggie Meter®-assessed SCC scores were low (median of 212 units) and were comparable to mean SCC scores in rural, Southern populations. For example, in a sample of rural, Southern corner store customers, the mean was 236 units (McGuirt et al., 2020), and in a sample of rural, Southern supermarket shoppers, the mean was 251 units (McGuirt et al., 2018). For subgroups, females and those with higher BMI and lower income had lower SCC scores as observed in prior studies (Di Noia and Gellermann, 2021; Madore et al., 2023).
Overall, the average baseline diet quality in our sample was typical of dietary patterns in the United States and did not align well with the healthful Med-style dietary pattern (Delgado-Lista et al., 2022; Estruch et al., 2018; Morze et al., 2020). As the literature is relatively robust in support of (1) the positive impact of the Med-style dietary pattern on chronic disease incidence and mortality and (2) consistent shortcomings with respect to chronic disease outcomes for energy-restricted diets that do not emphasize diet quality, a key component of behavioral weight loss interventions should be a focus on diet quality. This focus is particularly relevant for weight loss interventions delivered to patients enrolled in primary care settings, who, as in our sample, have elevated chronic disease risk. Of note, most published primary care setting weight loss studies in the US have not emphasized diet quality as a key component of the intervention (Webb and Wadden, 2017) and have not carefully measured diet quality (Cheng et al., 2023).
The impact of behavioral weight loss interventions that both improve diet quality and achieve weight loss remains to be determined by ongoing (DELISH study and others) and future research. Also, with GLP-1 receptor agonists yielding substantial weight loss and CVD risk reductions (Lincoff et al., 2023; Marso et al., 2016), patients interested in weight loss may opt for these medications. Although it is unknown if a healthful diet provides additional benefits to those taking these medications (Wadden et al., 2023), given that the Med-style diet conferred significant CVD event reduction amidst high cardio-protective medication use prevalence in CORDIOPREV (Delgado-Lista et al., 2022), it is plausible that improved diet quality may interact favorably with GLP-1 receptor agonist medications.
Strengths of our study include a detailed description of dietary intakes, biomarker-validated fruit and vegetable intake, and the use of well-studied diet quality indexes. There are also some limitations. While the Veggie Meter® captures carotenoid-rich fruits and vegetables, it does not capture intake of fruits and vegetables that do not contain carotenoids, such as cauliflower and bananas, so that fruit and vegetable intake may be underestimated by this measure. Also, we do not have direct measures of other phytonutrients that have beneficial effects on health outcomes. Also, dietary intake was assessed by participant self-report, and thus, recall bias and social desirability bias may impact our findings. Further, social desirability bias sometimes varies by demographic characteristics and may have contributed to the observed subgroup differences in diet quality. Also, given that economic disadvantage is associated with lower diet quality (Liu and Mozaffarian, 2024; Orr et al., 2019), our reported quality index scores may be higher than for other US populations, as our participants’ median family income was relatively high.
Another limitation is that our conceptualization of a healthful dietary pattern is primarily based on two large RCTs conducted in Spain and a meta-analysis of cohort studies. With regard to these RCTs (Delgado-Lista et al., 2022; Estruch et al., 2018), there may be issues with comparing dietary factors between Mediterranean and non-Mediterranean populations (Hoffman and Gerber, 2013), and cohort studies are subject to residual confounding. In addition, there are other dietary patterns that are healthful but less well studied than the Med-style pattern evaluated in the PREDIMED and CORDIOPREV RCTs (Delgado-Lista et al., 2022; Estruch et al., 2018) and the patterns assessed by the AHEI, DASH, and aMED indexes (Morze et al., 2020). For example, vegetarians' diets of many varieties have health benefits (Almuntashiri et al., 2025; Baroni et al., 2024) as do many traditional dietary patterns (LeBlanc et al., 2024). Evaluating associations between our study participants’ dietary intake and these less well studied patterns is beyond the scope of this article.
Conclusion
Participants referred to the DELISH study were at high risk for chronic diseases. Overall, their baseline diet quality, as assessed by macronutrient and fiber intake, did not align with the Med-style diet pattern associated with lower chronic disease incidence and mortality. Diet quality appeared to be worse among Black and younger participants. These findings among individuals referred for weight loss counseling suggest that (1) behavioral weight loss interventions undertaken to reduce obesity-related morbidity and mortality should emphasize fat and carbohydrate quality and (2) such interventions should address barriers to improving diet quality among subgroups with poorer diet quality at baseline. High-quality research is needed that addresses the impact of diet quality in the context of behavioral weight loss interventions.
Supplemental Material
sj-docx-1-nah-10.1177_02601060251379522 - Supplemental material for A cross-sectional analysis of baseline diet quality among participants enrolled in delicious eating for life in the southern homes weight loss randomized trial
Supplemental material, sj-docx-1-nah-10.1177_02601060251379522 for A cross-sectional analysis of baseline diet quality among participants enrolled in delicious eating for life in the southern homes weight loss randomized trial by Veeral M Saraiya, Teresa T Fung, Stephanie B Jilcott Pitts, Qiang Wu, Seth A Berkowitz, Harlyn G Skinner, Cheyenne K Thaxton, Candice L Alick, Daniela Sotres-Alvarez, Kelly R Evenson, Carmen D Samuel-Hodge and Thomas C Keyserling in Nutrition and Health
Supplemental Material
sj-docx-2-nah-10.1177_02601060251379522 - Supplemental material for A cross-sectional analysis of baseline diet quality among participants enrolled in delicious eating for life in the southern homes weight loss randomized trial
Supplemental material, sj-docx-2-nah-10.1177_02601060251379522 for A cross-sectional analysis of baseline diet quality among participants enrolled in delicious eating for life in the southern homes weight loss randomized trial by Veeral M Saraiya, Teresa T Fung, Stephanie B Jilcott Pitts, Qiang Wu, Seth A Berkowitz, Harlyn G Skinner, Cheyenne K Thaxton, Candice L Alick, Daniela Sotres-Alvarez, Kelly R Evenson, Carmen D Samuel-Hodge and Thomas C Keyserling in Nutrition and Health
Footnotes
Acknowledgements
We thank the study participants and study staff, without whom this work would not have been possible.
Ethical considerations
This study was approved by the University of North Carolina at Chapel Hill Institutional Review Board (IRB) (Ethics Code: 19-1712) on 2 October 2019.
Consent to participate
All participants provided written or digital informed consent prior to enrollment in the study.
Consent to publication
This research was conducted ethically in accordance with the World Medical Association Declaration of Helsinki.
Authors’ contributions
VMS and TCK had full access to all of the data in the study and take responsibility for the integrity of the data and the accuracy of the data analysis; VMS, SBJP, SAB, DS-A, CDS-H, and TCK: concept and design; VMS, TTF, SBJP, QW, SAB, DS-A, CKT, HGS, CLA, KRE, CDS-H, and TCK: acquisition, analysis, or interpretation of data; VMS and TKC: drafting of the manuscript; VMS, TTF, SBJP, QW, SAB, HGS, CKT, CLA, DS-A, KRE, CDS-H, and TCK: critical review of the manuscript for important intellectual content; QW, VMS, and TCK: statistical analysis; CDS-H and TCK: obtained funding; VMS, CKT, and TCK: administrative, technical, or material support; VMS and TCK: supervision.
Funding
The authors disclosed receipt of the following financial support for the research, authorship, and/or publication of this article: This work was supported by the National Heart, Lung, and Blood Institute (grant numbers R33 HL142680 and R61 HL142680).
Declaration of conflicting interest
The author(s) declared the following potential conflicts of interest with respect to the research, authorship, and/or publication of this article: Dr Berkowitz reports research grants from NIH/NHLBI, Blue Cross Blue Shield of North Carolina, North Carolina Department of Health and Human Services, American Diabetes Association, Rockefeller Foundation, and the American Heart Association outside of the submitted work. He reports consulting fees from Kaiser Permanente outside of the submitted work. Dr Pitts reports research grants from NIH, the Centers for Disease Control and Prevention, and Albemarle Regional Health Services, outside of the submitted work. She reports consulting fees from the Gretchen Swanson Center for Nutrition, outside of the submitted work. Dr Wu reports research grants from NIH/NCI, Bill and Melinda Gates Foundation, and NIH Science Education Partnership Award. Dr Sotres-Alvarez reports research grants from NIH/NHLBI, NIH/NIDDK, and NIH/NIMHD, outside of the submitted work. Dr Samuel Hodge reports research grants from NIH/NIMHD and CDC outside of the submitted work. Dr Keyserling reports research grants from NIH/NIDDK, NIH/NHLBI, CDC, and the Duke Endowment outside of the submitted work. Dr Keyserling's wife was the founder and now volunteer advisor to a company that makes healthful frozen foods. She does not hold equity in the company.
Data availability statement
The datasets generated during and/or analyzed during the current study are not publicly available due to study participant privacy, but may be made available from the corresponding author on reasonable request.
Supplemental material
Supplemental material for this article is available online.
References
Supplementary Material
Please find the following supplemental material available below.
For Open Access articles published under a Creative Commons License, all supplemental material carries the same license as the article it is associated with.
For non-Open Access articles published, all supplemental material carries a non-exclusive license, and permission requests for re-use of supplemental material or any part of supplemental material shall be sent directly to the copyright owner as specified in the copyright notice associated with the article.