
Abstract
Background
Nutrition at midlife and beyond influences how an individual ages. Nutrition risk, the risk of poor nutritional health, is highly prevalent in community-dwelling adults in these age groups. As the factors associated with nutrition risk may vary between different age groups, research is needed on the differences in nutrition risk between age groups.
Aim
To examine the social, demographic, and health factors associated with high nutrition risk, determined using SCREEN-8, using data from the Canadian Longitudinal Study on Aging (CLSA), stratified by 10-year age groups.
Methods
Using the baseline and first follow-up waves of the CLSA, bivariate multivariable logistic regression was conducted to examine the variables associated with high nutrition risk (SCREEN-8 score < 38) by 10-year age group.
Results
Higher levels of social support, higher social standing, more frequent participation in community activities, screening negative for depression, and higher levels of self-rated general health, healthy aging, and oral health were consistently associated with lower odds of being at high nutrition risk across all age groups at both baseline and follow-up.
Conclusion
Individuals with low levels of social support, low social standing, infrequent participation in community activities, poor general health, poor healthy aging, poor oral health, or who screen positive for depression should be screened proactively for nutrition risk. Programs and policies designed to address social support, social standing, participation in community activities, depression, health, healthy aging, and oral health may also help reduce the prevalence of high nutrition risk.
Introduction
Nutrition at midlife and beyond can prevent the development of many chronic diseases or help manage them (Lambrinoudaki et al., 2013). However, as people enter midlife and older adulthood, physiological, psychological, and social changes can lead to changes in food intake (de Boer et al., 2013). When these changes lead to inadequate intake, nutrition risk can develop (Ramage-Morin and Garriguet, 2013).
Approximately one-third of community-dwelling Canadians aged 55 and older are at nutrition risk (Morrison et al., 2019). Unaddressed, nutrition risk can lead to malnutrition, frailty, hospitalization, decreased quality of life, and death (Cederholm et al., 2019; Keller et al., 2004; Keller and Østbye, 2003; Ramage-Morin et al., 2017).
Cross-sectional studies of community-dwelling older adults ages 55 and older have examined factors associated with nutrition risk. However, few studies have included adults at midlife (aged 45–54), and relatively few have examined how nutrition risk varies between age groups. Doing so will enable a more nuanced understanding of nutrition risk and offer targeted interventions by age group.
One Canadian study by Ramage-Morin and Garriguet (2013) did not find a difference in the percentage of individuals at high nutrition risk between the 65 to 74 age group and the 75 years and older age group. Similarly, a study of Irish older adults, did not find a difference in malnutrition risk status between those aged 64 to 75 and those 75 and older (Power et al., 2014). However, a study from Japan, found that those 75 and older were more likely to be at risk of malnutrition than those aged 65 to 74 (Yoshimura et al., 2013). Additionally, a Canadian study by Keller (2016) found that nutrition risk increased with age, with a gradient noted such that the lowest prevalence of high nutrition risk was in the 50 to 64 age group and highest in those 85 and older.
Thus, while several studies have examined differences in nutrition risk between age groups, only one has looked at individuals under 65 (Keller, 2016) and only one has used a nationally representative Canadian sample (Ramage-Morin and Garriguet, 2013). As the factors associated with nutrition risk may vary between different age groups (Keller, 2016), more research is needed on the differences between age groups and the factors associated with nutrition risk in younger age groups. In discovering the factors associated with nutrition risk in different age groups, appropriate programs and policies targeting individuals at different life stages can be designed.
Our research aims to examine nutrition risk in community-dwelling Canadians aged 45 and older, stratified by 10-year age group, using data from the Canadian Longitudinal Study on Aging (CLSA).
Methods
Data source
We used data from the CLSA, Canada's largest and most comprehensive prospective cohort study examining aging longitudinally. When recruited, CLSA participants were between the ages of 45 and 85; they are followed every 3 years for 20 years or until death (Kirkland et al., 2015). Baseline data collection occurred from 2011 to 2015, and the first follow-up data were collected 3 years later (Raina et al., 2019).
There are two CLSA cohorts: tracking and comprehensive. The comprehensive cohort includes 30,097 participants who are interviewed in person, undergo physical assessments, and provide urine and blood samples. The tracking cohort included 21,241 participants at baseline who are followed by telephone interview only. Our study used data from the tracking cohort. CLSA data can be generalized to the Canadian population (Raina et al., 2009).
The core set of questionnaires is common for both cohorts. Questionnaires ask about demographics, social and psychological measures, health and functional status, lifestyle, and behavior (Raina et al., 2019). We use data from baseline for social, demographic, and health variables, and data from baseline and follow-up for nutrition risk. We chose variables based on their association with nutrition risk in previous studies.
CLSA measures
Social variables
Social network type: We previously derived social network type using latent class analysis (Mills et al., 2023a). We then classified tracking participants into one of three types of social networks: diverse, family- or friend-focused, and restricted.
Social participation: Participants reported how often they participated in eight types of activities over the past 12 months. These were: family/friend activities, religious activities, sports or physical activities with others, education or cultural activities, clubs or fraternal organizations, association activities, volunteer or charity work, and other recreational activities. Participants could respond, never, at least once a year, at least once a month, at least once a week, and at least once a day. As previously done (Harasemiw et al., 2018; Mills et al., 2023b), we summed the responses for each category to create a social participation variable ranging from 0 to 32, with higher numbers indicating increased frequency of participation.
Social support: Social support was measured using the 19-item Medical Outcomes Study Social Support Survey (MOS). It measures multiple components of social support, including affection, emotional and informational support, tangible social support, and positive social interaction. The MOS has excellent internal consistency and test-retest reliability (Sherbourne and Stewart, 1991).
Demographic variables
CLSA demographic measures include age, sex assigned at birth, living situation (alone or with others), marital status, education, and income. For marital status, participants the options were: single (never married), married/common-law, widowed, divorced, and separated. These were collapsed into three categories: “married/common law,” “single (including single, divorced, or separated),” and “widowed.” Participants were asked about their highest level of education. Our study used the level of education (four levels) variable: “less than secondary school graduation,” “secondary school graduation (but no post-secondary),” “some post-secondary,” and “post-secondary degree/diploma.” Participants were asked about the number of people living in their household, other than the participant. We categorized individuals as living alone if they indicated no other person resided in their household. For income, participants reported household income using the following categories: “less than $20,000,” “$20,000–$49,999,” “$50,000–$99,999,” “$100,000–$149,999,” and “$150,000 or more.”
Health variables
Self-rated general health, healthy aging, and oral health: These were measured by asking participants: Would you say your health is excellent, very good, good, fair, or poor? The same question was asked for mental health, healthy aging, and oral health. As done previously (Mills et al., 2023b; Morrison et al., 2019; Wister et al., 2019), participant responses were collapsed into three categories: “fair/poor,” “good,” and “very good/excellent.”
Depression: Depression was measured using the short form of the Center for Epidemiologic Studies—Depression (CES-D10) Scale. The CES-D10 has been used in many large studies and is reliable and valid in adult and older adult populations (Andresen et al., 1994). It has a positive correlation with poor health status and a negative correlation with positive affect (Andresen et al., 1994).
Body mass index: Height in meters (m) and weight in kilograms (kg) were self-reported; BMI was calculated (kg/m2). These calculated values were used.
Nutrition risk
Nutrition risk was measured using the abbreviated version of Seniors in the Community: Risk Evaluation for Eating and Nutrition II, rebranded as SCREEN-8 (Keller, n.d.). SCREEN-8 consists of eight questions about typical daily eating habits and includes questions on weight change, meal skipping, appetite, swallowing, servings of fruit and vegetables, fluid intake, eating with others, and meal preparation. Scores range from 0 to 48, with a score less than 38 indicating that an individual is at high nutrition risk. SCREEN-8 has good specificity and sensitivity compared to registered dietitians’ nutrition risk assessment; the test-retest and inter-rater reliability of SCREEN-8 are also good (Keller et al., 2005).
Data analysis
Our primary analytic strategy was bivariate multivariable logistic regression. We set the significance level at α ≤ 0.05, and report confidence intervals and effect sizes. We conducted all analyses using RStudio version 2023.6.1.524.
We examined the percentage of missing values for each variable, overall and stratified by 10-year age group. We explored patterns of missingness and compared the complete cases to cases with any missing data.
For each 10-year age group, we ran two multivariable logistic regression analyses; the first had high nutrition risk at baseline as the dependent variable and the second, high nutrition risk at follow-up. The social, demographic, and health variables were the independent variables. We used the package caret (Kuhn, 2008) for each analysis to determine the accuracy, sensitivity, specificity, and positive and negative predictive values.
Results
Sample description
Of the 21,241 participants in the baseline tracking cohort, there was data at follow-up for 17,051 individuals, and we used that sample for all analyses. Between baseline and follow-up, 3 years later, 6.0% (n = 1266) of participants withdrew from the CLSA, 12.0% (n = 2546) were lost to follow-up, 1.8% (n = 377) had their follow-up data still in preparation at the time we received the data, and there were confirmed deaths for 5.5% (n = 1165) of participants.
At baseline, the mean age of the sample participants was 59.46 (SD = 9.94), and most participants were married or partnered (77.5%). The mean SCREEN-8 score at baseline was 38.85 (SD = 6.30), and the mean SCREEN-8 score at follow-up was 38.02 (SD = 6.53). At baseline, 34.3% of the sample was at high nutrition risk, and 40.0% were at high nutrition risk at follow-up (Table 1). The percentage of individuals at high nutrition risk at both time points varied by age group; however, the effect size was trivial (Table 1).
Characteristics of the CLSA tracking cohort, overall, and stratified by 10-year age group.
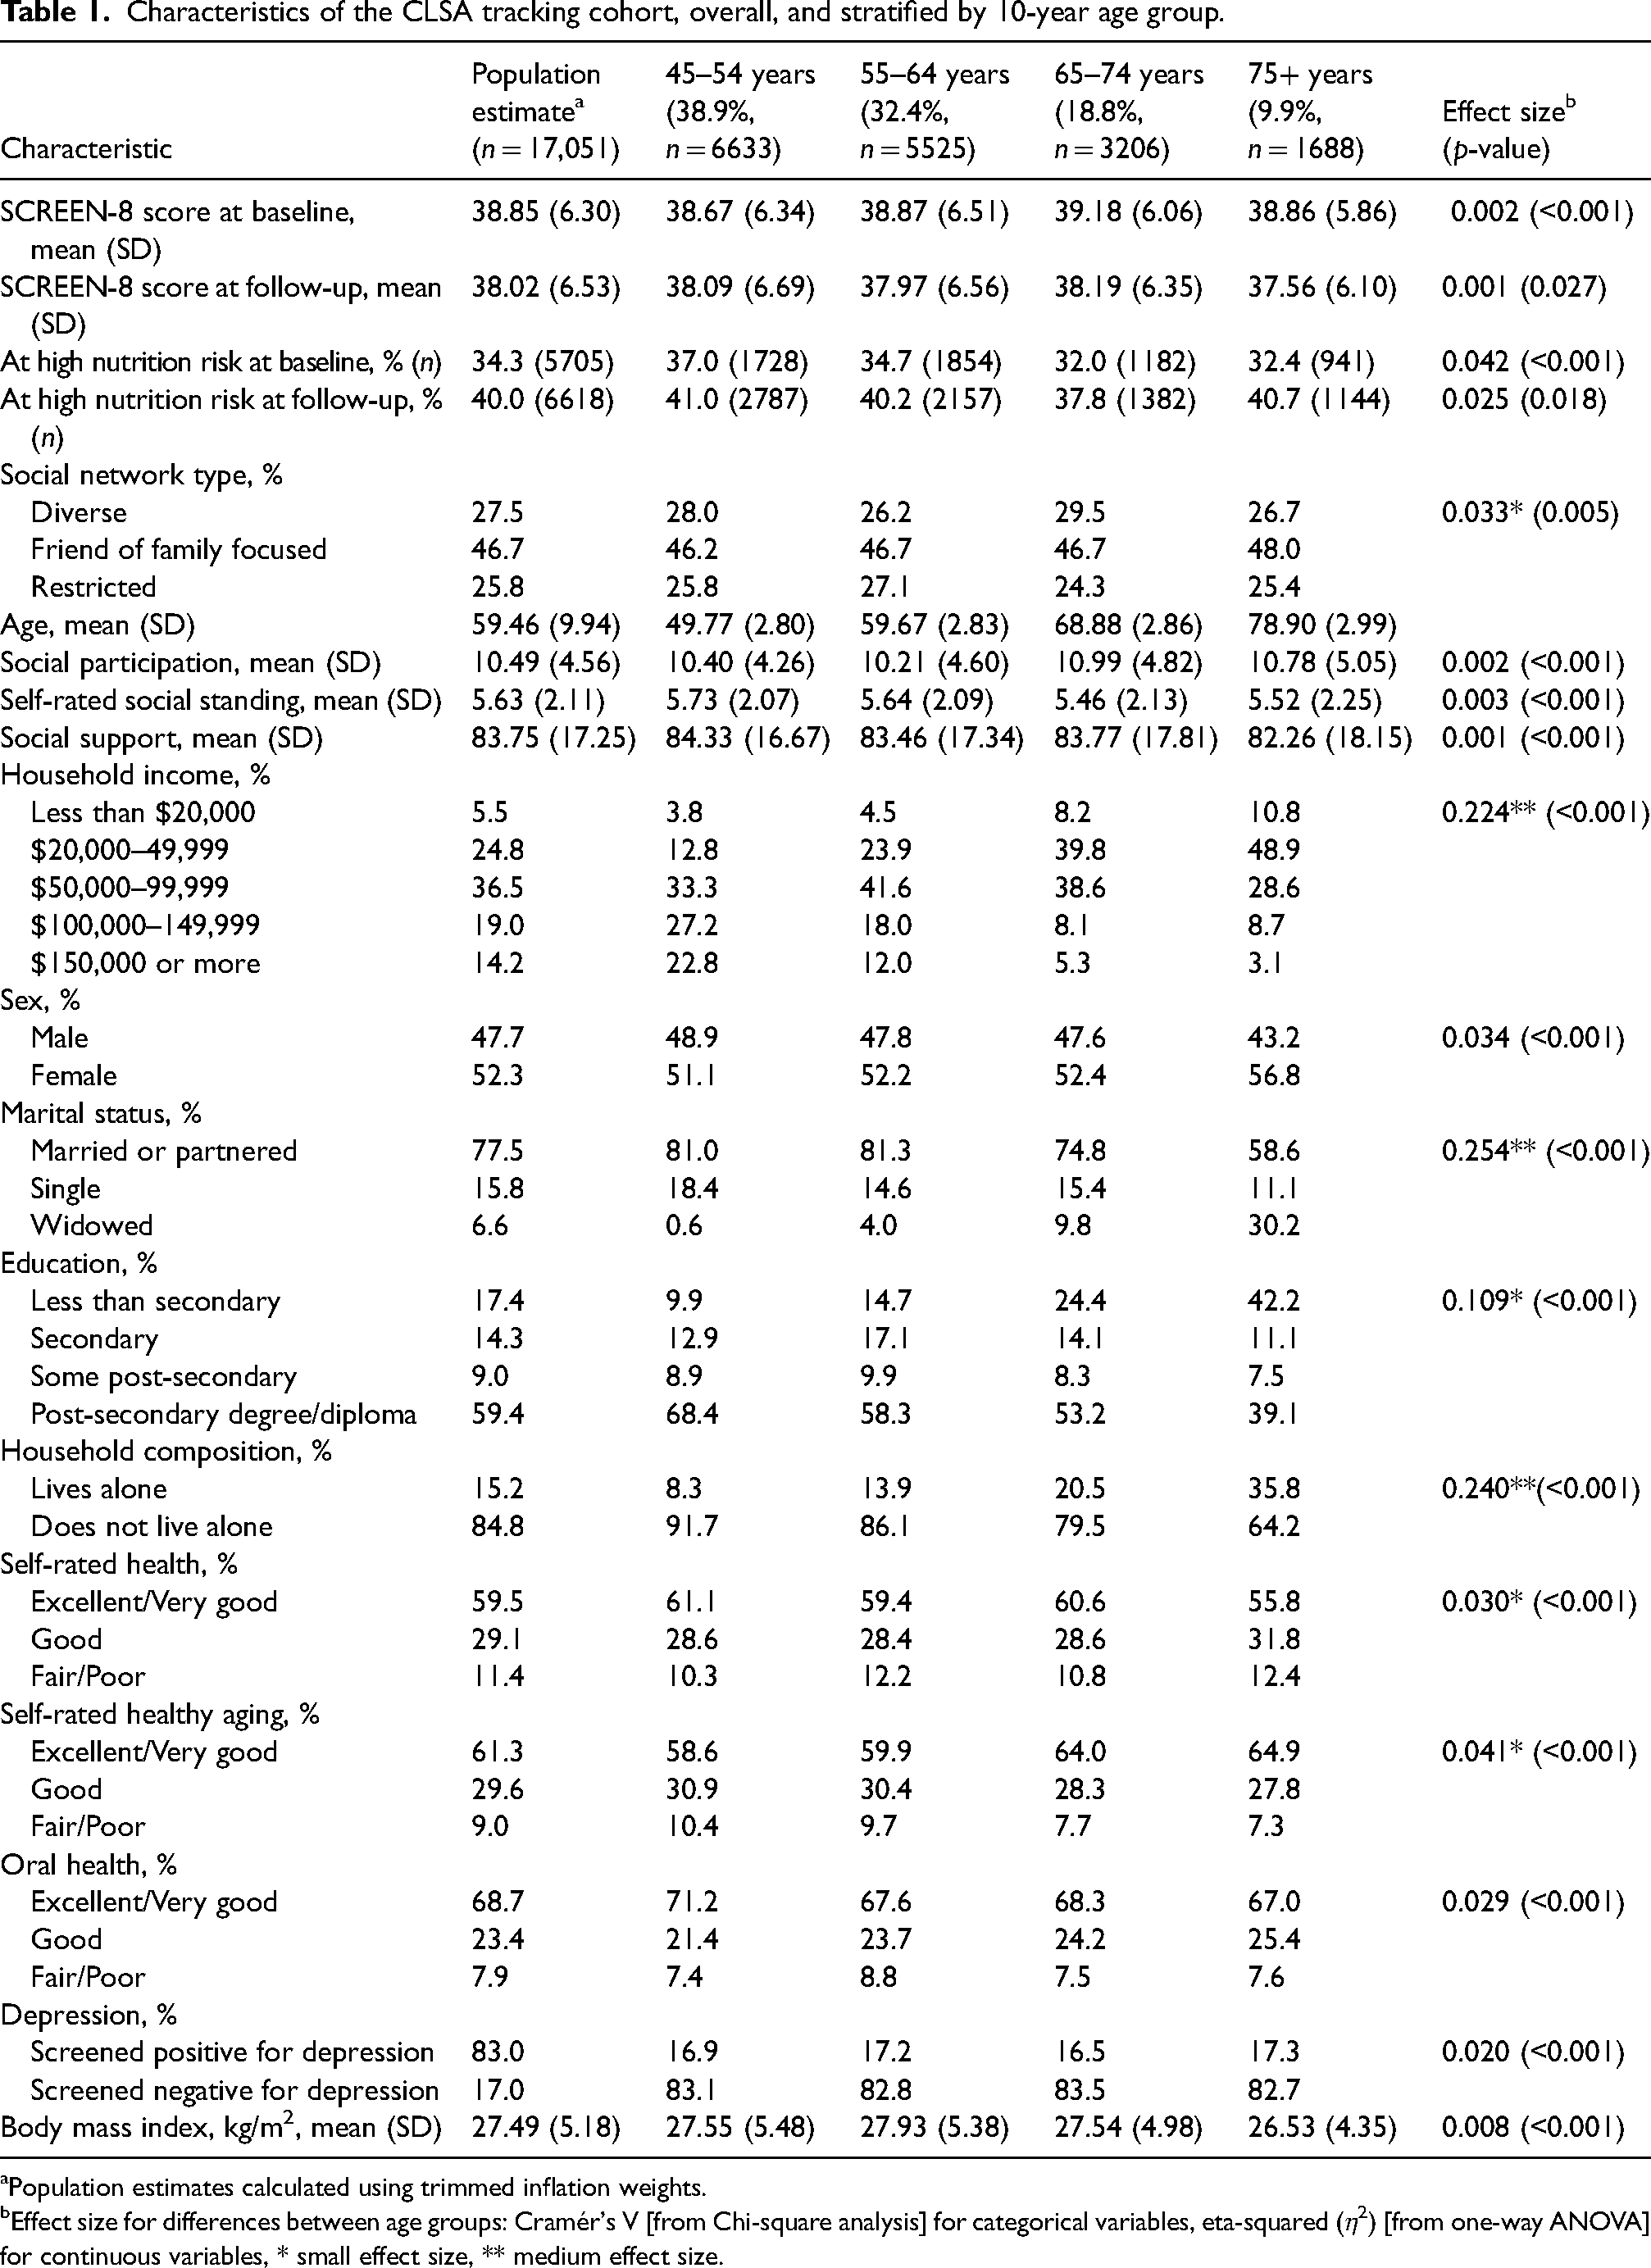
Population estimates calculated using trimmed inflation weights.
Effect size for differences between age groups: Cramér's V [from Chi-square analysis] for categorical variables, eta-squared (η2) [from one-way ANOVA] for continuous variables, * small effect size, ** medium effect size.
When we examined the proportion of missing data in our dataset, we were missing SCREEN-8 scores at baseline for 4.32% of the sample and 2.93% at follow-up (Supplemental Table S1). Out of 17,051 participants for whom we had data, 11,932 (70%) participants had complete data on all the variables of interest.
Binary logistic regression analysis examining high nutrition risk at baseline and follow-up by 10-year age group
We observed similarities and differences among the social variables between the age groups at baseline (Table 2) and follow-up (Table 3). Social support was associated with high nutrition risk at baseline and follow-up in all four age groups, with higher levels of social support associated with lower odds of high nutrition risk. Self-rated social standing was associated with high nutrition risk at baseline for all but the 65 to 74 age group at baseline and all but the two oldest age groups at follow-up, with higher social standing associated with lower odds of high nutrition risk. Higher levels of social participation were associated with lower odds of high nutrition risk for all but the oldest age group at baseline and all age groups at follow-up.
Binary logistic regression analysis examining the presence of high nutrition risk at baseline in the CLSA tracking cohort.
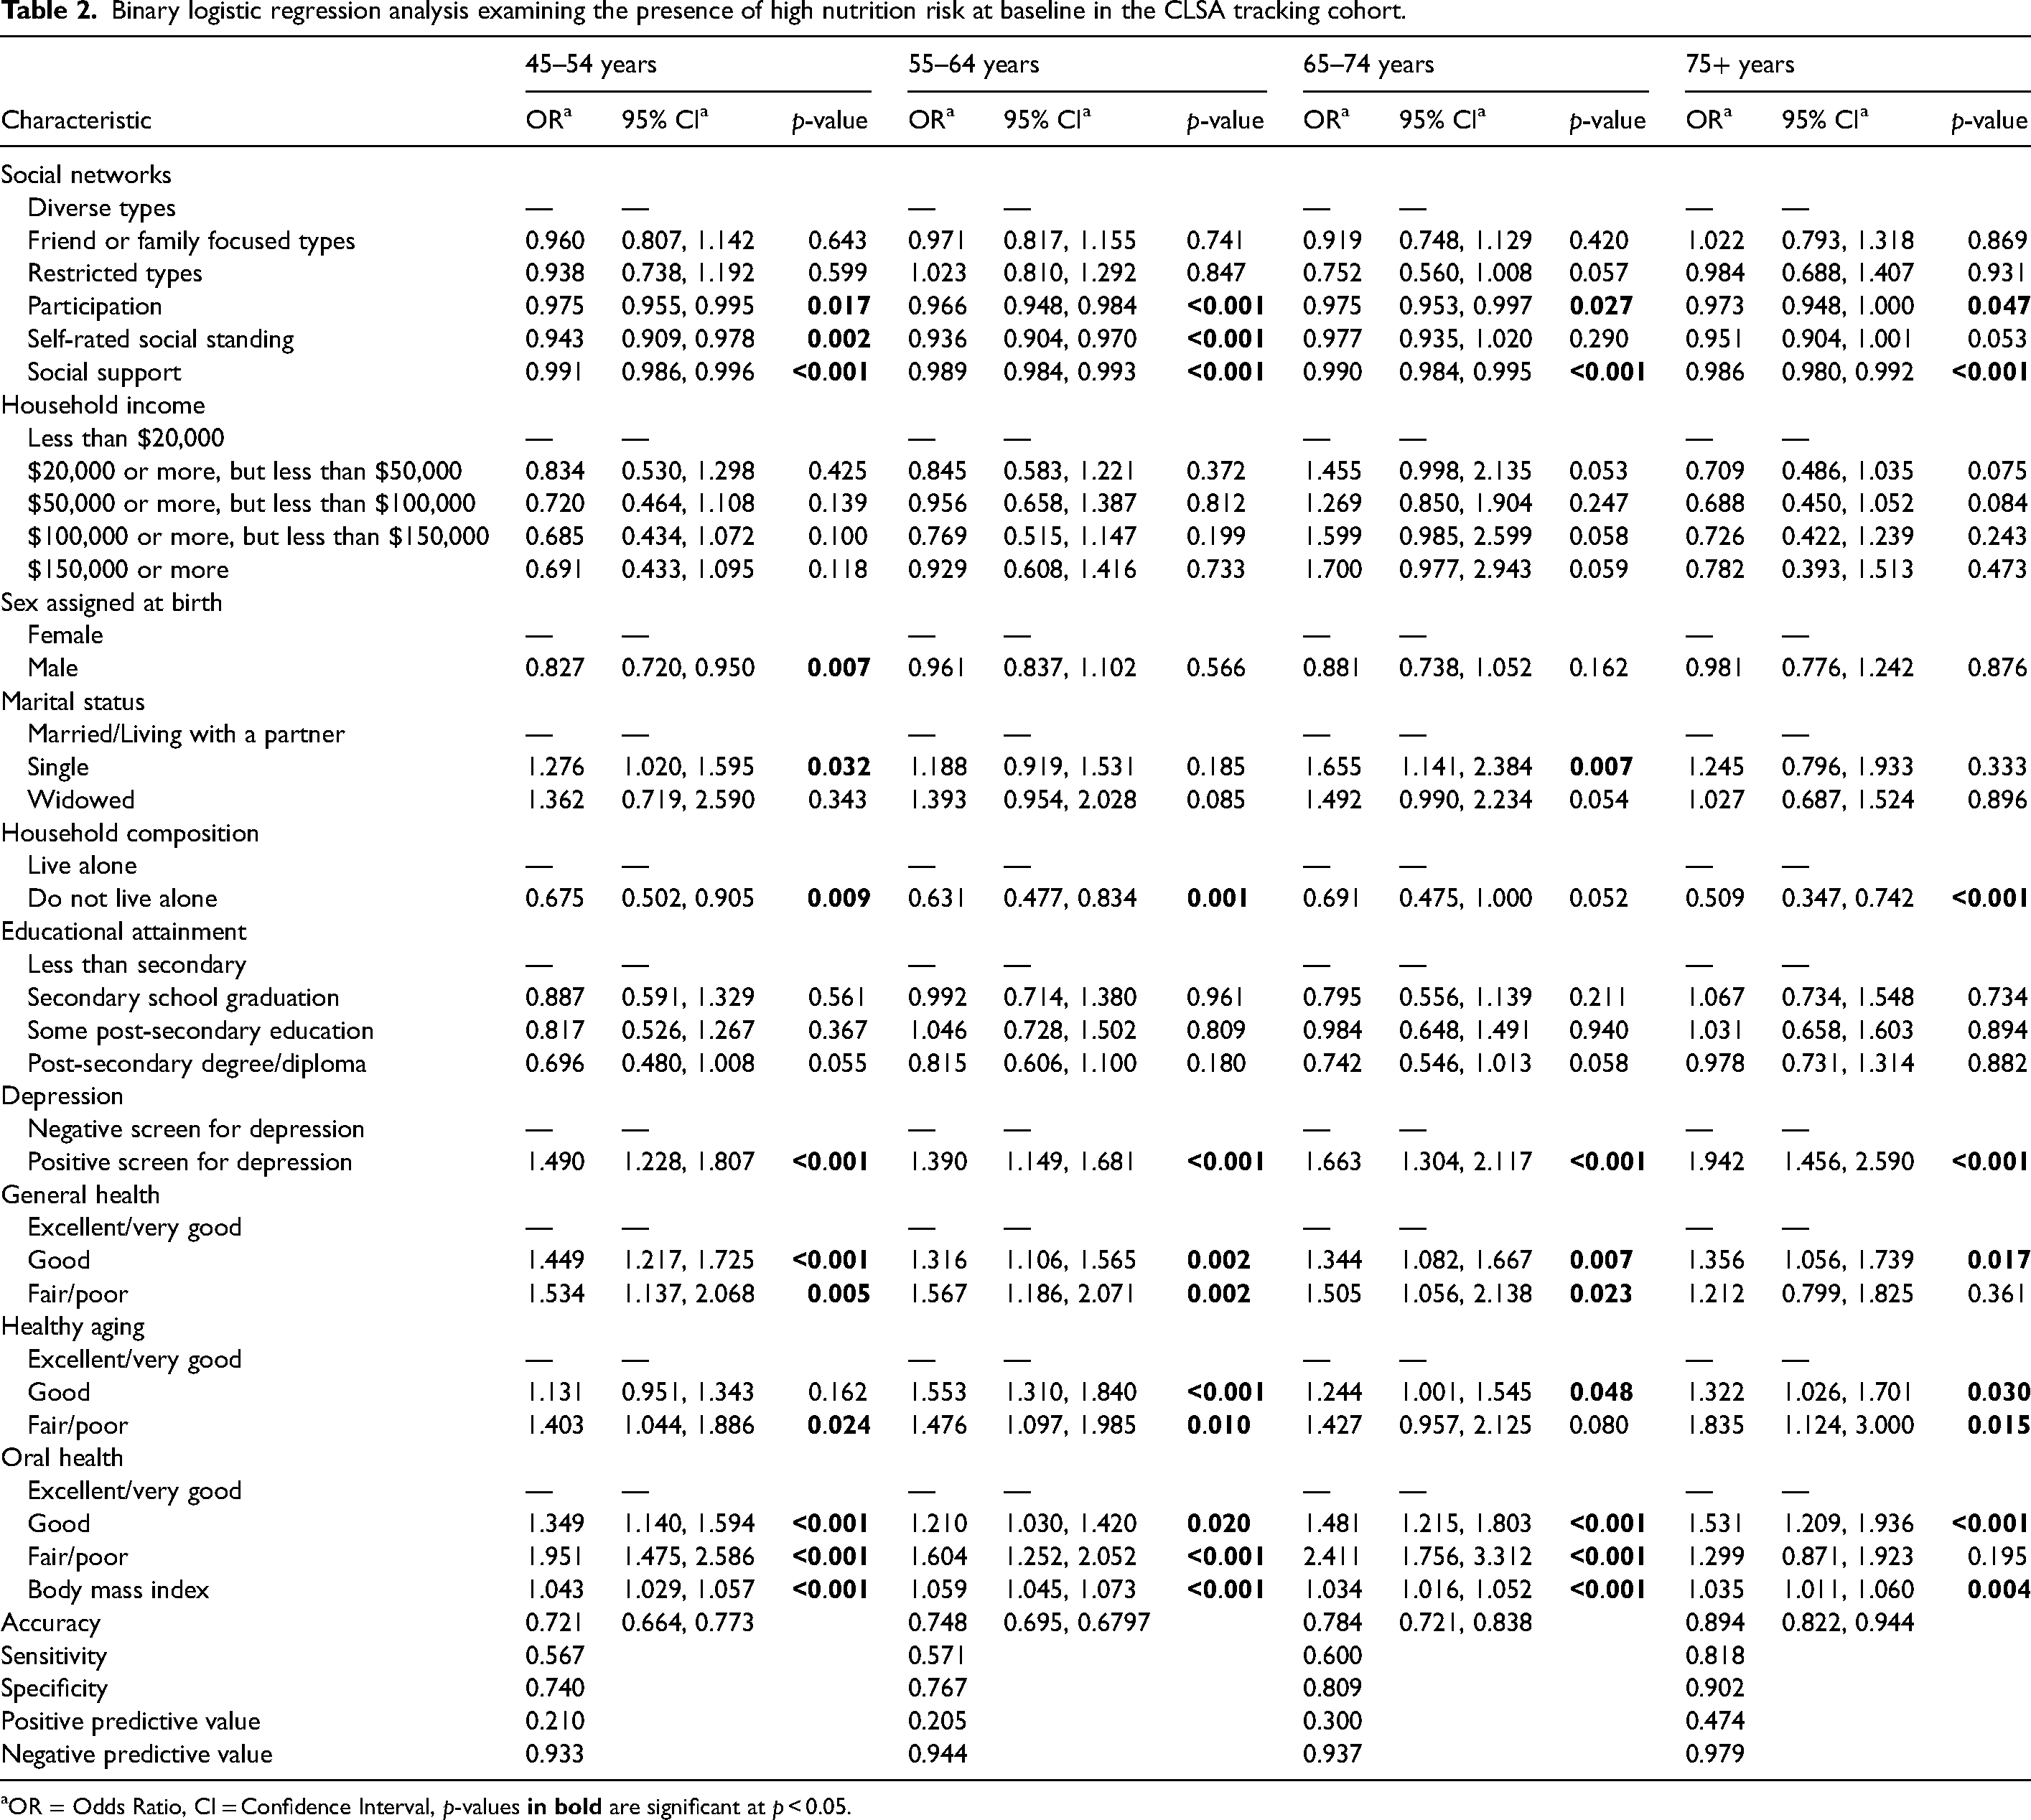
OR = Odds Ratio, CI = Confidence Interval, p-values
Binary logistic regression analysis examining the presence of high nutrition risk at first follow-up in the CLSA tracking cohort.
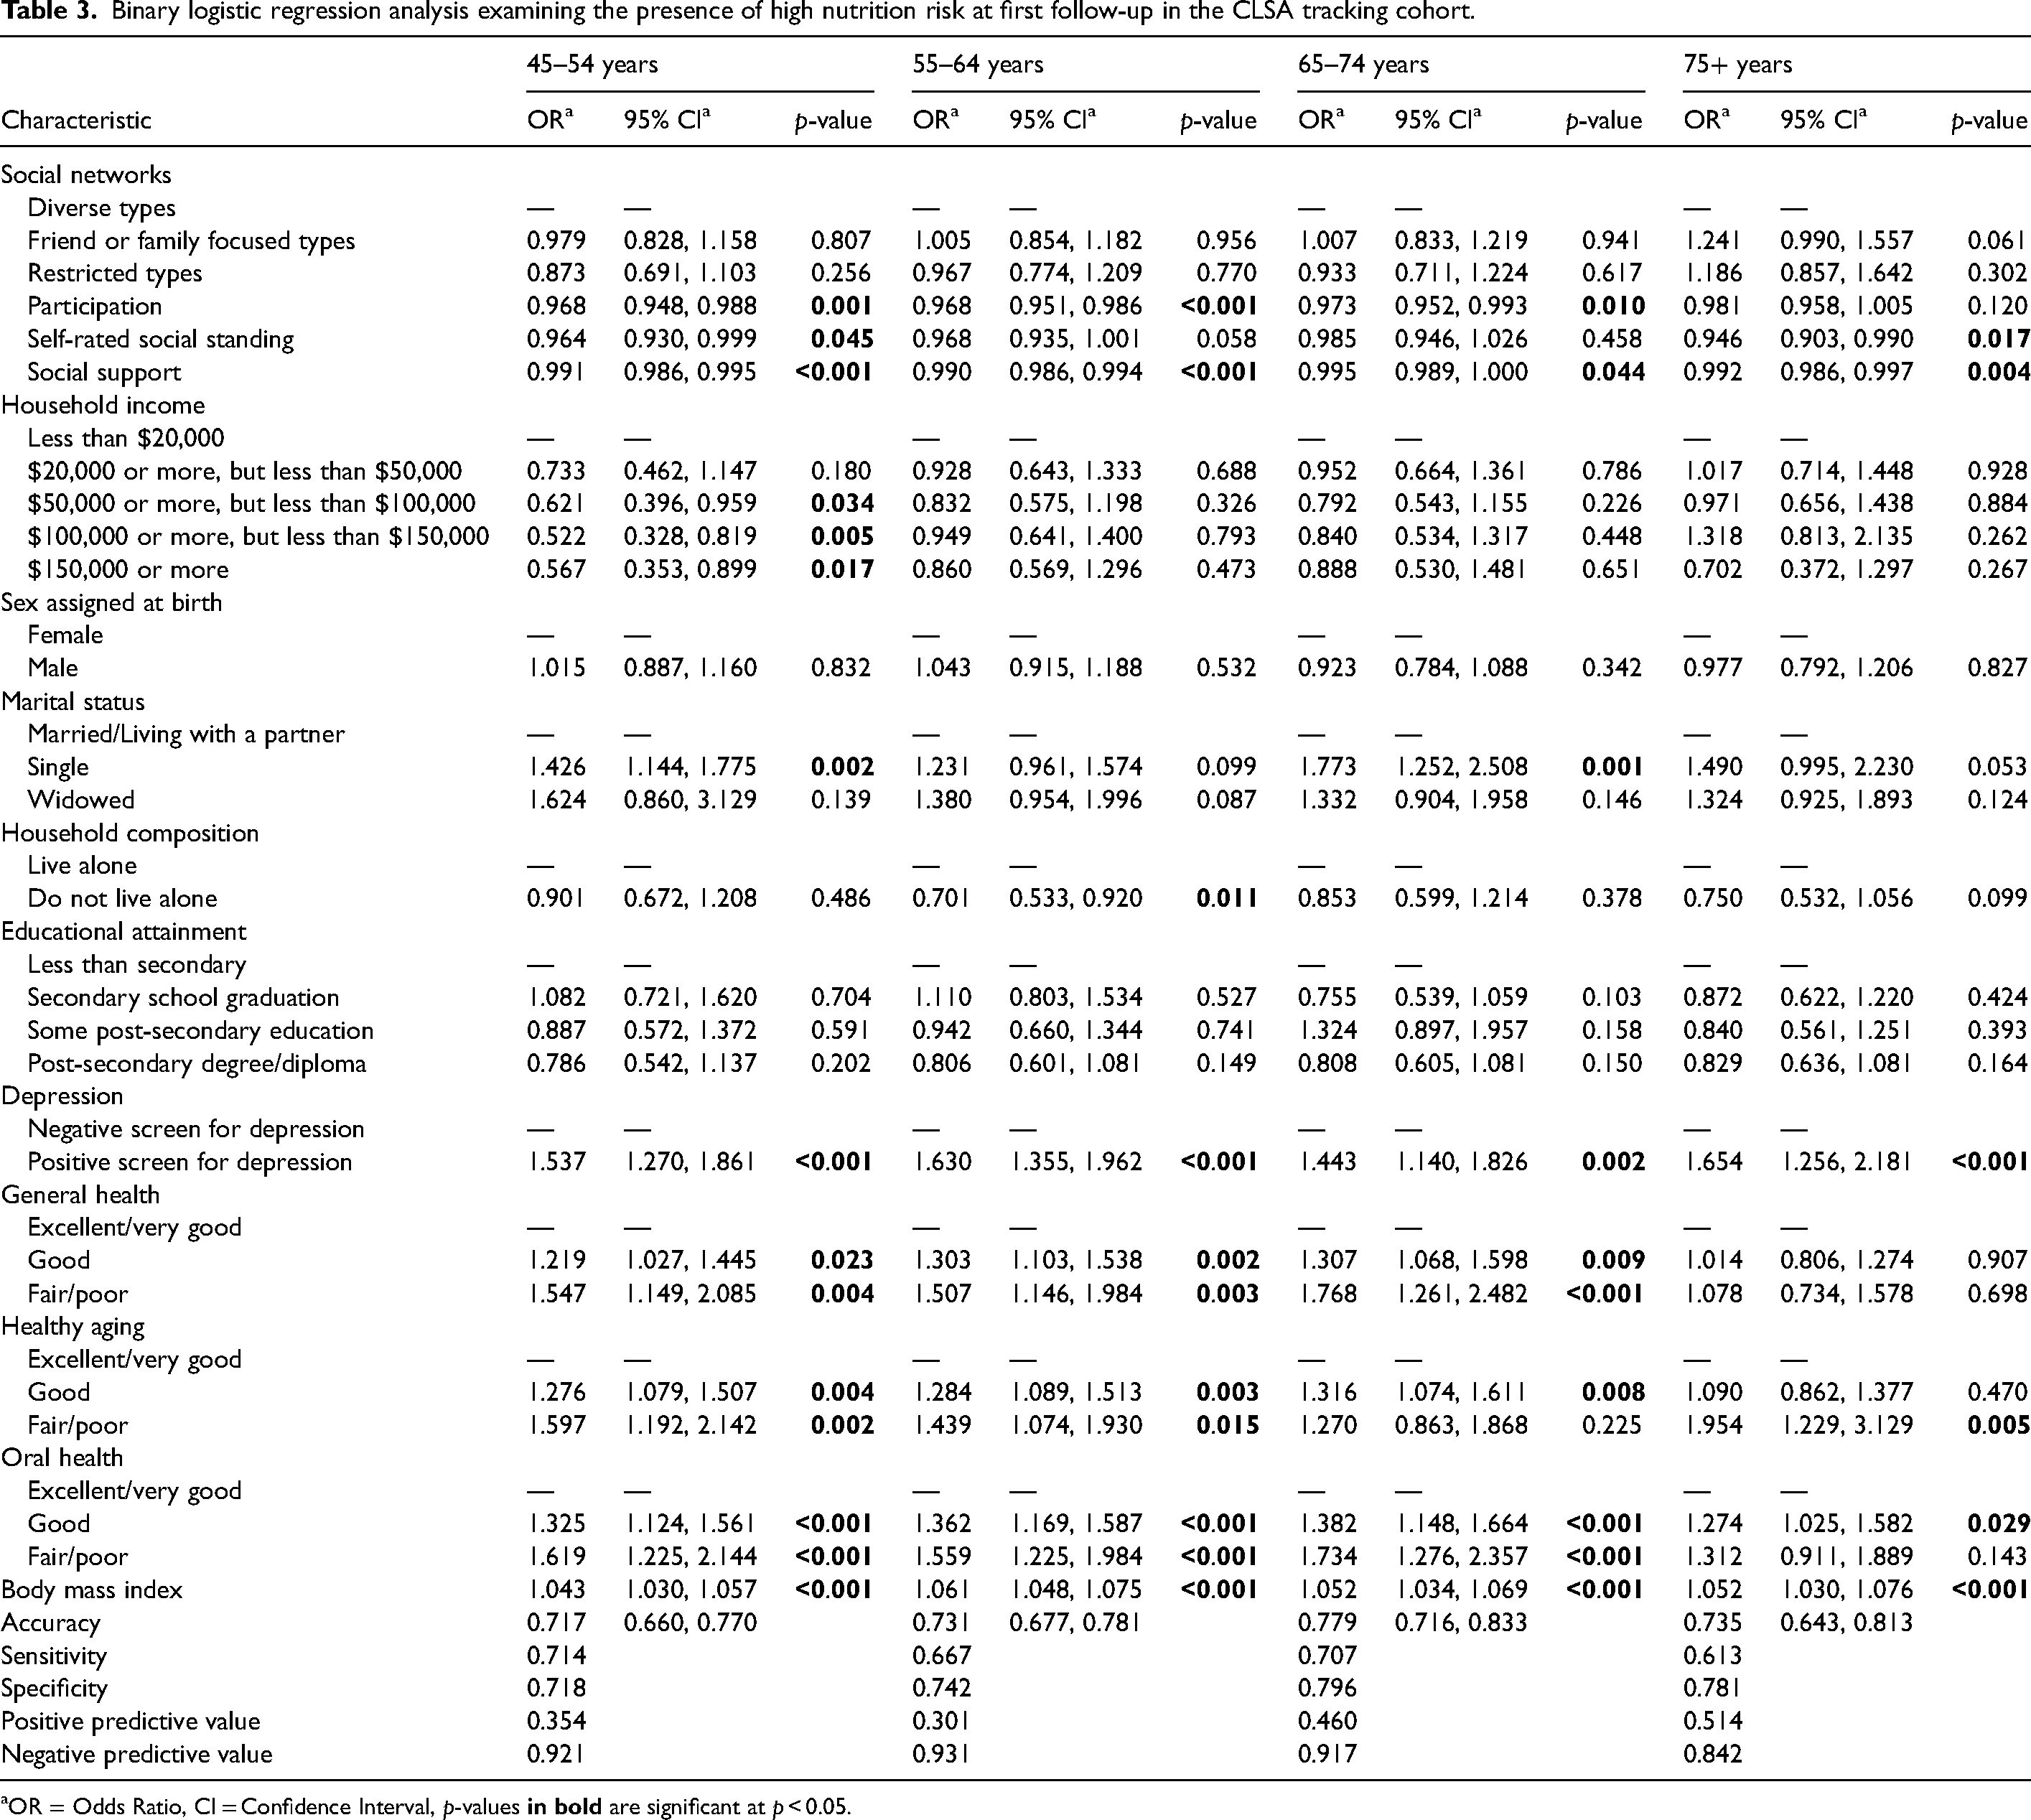
OR = Odds Ratio, CI = Confidence Interval, p-values
For the demographic variables, we found differences between the age groups at baseline and follow-up (Tables 2 and 3). Higher household incomes were associated with lower odds of high nutrition risk only in the youngest age group at follow-up. Sex assigned at birth was only associated with high nutrition risk in this youngest age group at baseline, with those assigned male at birth having lower odds of high nutrition risk than those assigned female. Marital status was associated with high nutrition risk only in the 45 to 54 and the 65 to 75 age groups at both baseline and follow-up, with those who were single, compared to those who were married or partnered, having higher odds of high nutrition risk. Compared to living alone, living with others was associated with lower odds of high nutrition risk in all but the 65 to 74 age group at baseline, and only in the 55 to 64 age group at follow-up.
For the health variables, again, we found both similarities and differences between the age groups. For all age groups, screening positive for depression was associated with higher odds of high nutrition risk at both time points. Lower self-rated health was also associated with higher odds of high nutrition risk in all age groups at baseline and in all but the oldest age group at follow-up. Both lower self-rated healthy aging and lower self-rated oral health were associated with higher odds of high nutrition risk for all age groups at both times. Higher body mass index was associated with higher odds of high nutrition risk in all age groups at both time points.
Discussion
To our knowledge, this is the first study to examine factors associated with high nutrition risk by 10-year age group using a nationally representative Canadian sample. Our study has contributed to the literature on nutrition risk in the community by expanding upon previous research examining nutrition risk using the CLSA. We found that some social, demographic, and health factors associated with high nutrition risk were similar between age groups while others were different, highlighting the importance of examining nutrition risk by age group. Programs and interventions designed to reduce the prevalence of nutrition risk may need to be tailored according to age. Similarly, age group may play a significant role in identifying those who should be screened proactively for high nutrition risk.
Among all age groups at baseline and follow-up, we found that higher levels of social support were associated with lower odds of being at high nutrition risk. Previous studies from Canada (Johnson, 2005; Ramage-Morin and Garriguet, 2013) and the United States (Locher et al., 2005; Locher and Sharkey, 2009), have found that low levels of social support were associated with increased nutrition risk in adults aged 65 and older. Social support may influence nutrition risk through different mechanisms. First, an individual's social support system may encourage compliance with social norms around eating, such as regular meal times (Vesnaver and Keller, 2011). Social support systems may also encourage healthy behaviors, such as consuming adequate amounts of nutrient-rich foods (Locher and Sharkey, 2009). Additionally, if an individual requires assistance with food-related activities, such as grocery shopping or meal preparation, adequate social support can ensure these needs are met (Keller, 2005). Higher social support may also give an individual more opportunities to eat with others. Research has shown that eating with others improves food intake (de Castro, 1994), and eating alone is a risk factor for poor nutrition and food intake (Vesnaver and Keller, 2011).
In our study, higher levels of participation (participation in community activities) were associated with reduced odds of being at high nutrition risk in all age groups at baseline and all but the oldest age group at follow-up. Participation was measured in the CLSA by asking about the frequency of participation in family/friend activities, religious activities, sports or physical activities with others, education or cultural activities, clubs or fraternal organizations, association activities, volunteer or charity work, and other recreational activities with others. Future research should examine which activities are associated with nutrition risk in different age groups, as social roles may vary by age group (Daukantaitė and Thompson, 2014; Evandrou and Glaser, 2004). A previous Canadian study found that infrequent social participation was significantly associated with a higher probability of being at high nutrition risk among community-dwelling adults aged 65 and older, even when demographic and health-related factors were considered (Ramage-Morin and Garriguet, 2013). Similarly, a previous study that used CLSA data found that higher levels of social participation were associated with higher SCREEN-8 scores (Mills et al., 2023b). Also, a cross-sectional study conducted in Brazil found that low social participation was associated with malnutrition risk (Damião et al., 2018).
We found that higher self-rated social standing was only associated with lower odds of high nutrition risk at baseline in all but the 65 to 74 age group and all but the two oldest age groups at follow-up. Previous studies using CLSA data found an association between nutrition risk scores and social standing (Chopp-Hurley et al., 2020; Mills et al., 2023b). Individuals with higher social standing may have more access to resources and material goods than those with lower social standing (Berkman et al., 2000) and may, therefore, have an easier time accessing and affording foods that support nutritional health and well-being.
For all age groups, screening positive for depression was associated with higher odds of being at high nutrition risk at both baseline and follow-up. Previous studies have found an association between depression or poor mental health and increased nutrition risk (Tsai, 2013; Wham et al., 2015, 2022). Depression can lead to a loss of appetite and reduced food intake (de Boer et al., 2013), resulting in nutrition risk. There may also be an increased risk of developing depression among those with fewer social connections and lower social support (Gariépy et al., 2016). Individuals with depression may also engage in fewer social activities and, therefore, have fewer opportunities to eat with others.
We found that lower self-rated health was associated with higher odds of being at high nutrition risk in all age groups at baseline, and in all but the oldest age group at follow-up. We also found that at both baseline and follow-up, for all age groups, poorer self-rated healthy aging and oral health were associated with higher odds of being at high nutrition risk. Self-rated health status has been associated with nutrition risk in previous studies (Lengyel et al., 2014; Roberts et al., 2007), as has self-rated healthy aging (Lengyel et al., 2014). It is well established that nutrition influences health and chronic disease (Lambrinoudaki et al., 2013). Additionally, those in better health may have an easier time consuming a healthy diet or may find food-related activities such as meal preparation and grocery shopping easy to manage. Alternatively, consuming a healthy diet may lead individuals to rate their health and healthy aging as better. Concerning oral health, other studies have also found an association between oral health and nutrition risk (Algra et al., 2021). Poor oral health can lead to difficulties with chewing and swallowing (Touger-Decker, 2014), affecting food and nutrient intake. Decreased food and nutrient intake then lead to nutrition risk.
Despite these similarities between age groups, there were also differences. Sex assigned at birth was only associated with high nutrition risk at baseline in the 45 to 54 age group. Having been assigned female at birth, compared to male, was associated with higher odds of being at high nutrition risk. Previous research has been inconsistent in the relationship between sex or gender and nutrition risk. Some research has found that women or those assigned female at birth are more likely to be at high nutrition risk (Ramage-Morin and Garriguet, 2013; Wham et al., 2015), whereas other research has not found such a relationship (Roberts et al., 2007; Wham et al., 2014). Future research should examine the interaction between sex or gender and age group on nutrition risk.
Unlike our previous work (Mills et al., 2023a), we did not find that social network type was associated with high nutrition risk at either time. Our previous work (Mills et al., 2023a) only controlled for demographic variables when examining the relationship between high nutrition risk and social network type. The effects of social network type on high nutrition risk were likely captured in the other social or health variables. Previous research has found that individuals belonging to more restricted social network types, relative to those with more diverse network types, have less social support, poorer self-rated health, increased mortality, increased risk of depression, and greater functional dependence (Fiori et al., 2006; Harasemiw et al., 2018; Park et al., 2014). Therefore, the social support, depression and self-rated health variables may have captured some of the effects of social network types in our study. We also found that social support and participation were associated with nutrition risk in all age groups. Thus, when social support and social participation are considered, the type of social network is no longer significant. Regarding nutrition risk, it appears that having social support and participating in social activities are more important than the type of social network an individual belongs to. Future research should examine the interaction between social network type, social support, and social participation and how these interactions affect nutrition risk.
Strengths and limitations
One strength of our study is the use of the CLSA data set. The CLSA is a large, national study of the Canadian population aged 45 to 85 at baseline, and its data is generalizable to this aging Canadian population (Raina et al., 2009). As the CLSA will follow participants every 3 years for 20 years or until the participant's death, additional analyses can be completed in the future.
Another strength of the CLSA is its measures. The measures were chosen in collaboration with expert working groups (Kirkland et al., 2015; Raina et al., 2009, 2019), and many factors were evaluated, including feasibility, practicality, and availability of tools in English and French (Raina et al., 2009, 2019). Other considerations included the relevance of the measures across the age groups in the CLSA and the psychometric properties of the measures, including sensitivity, specificity, and responsiveness (Raina et al., 2009, 2019). Validated questionnaires were used when available in both English and French (Raina et al., 2009, 2019). When no validated questionnaire was available, the CLSA used established questionnaires from national surveys such as Statistics Canada's CCHS (Raina et al., 2009, 2019).
Despite these strengths, there are limitations to the CLSA data. While the CLSA is representative of Canadian provincial residents, several groups are not included in the CLSA. Full-time Canadian Armed Forces members, those living in the territories and some remote areas, and those living on First Nations reserves and settlements (Raina et al., 2019) are not included. Additionally, only those who can speak English or French and those with the capability to answer the questions themselves are included (Raina et al., 2019). The CLSA also only included individuals between the ages of 45 and 85 at baseline (Raina et al., 2019). Thus, it was not possible to examine nutrition risk in those older than 85 years, as has been done in previous research (Keller, 2016).
It should be noted that the SCREEN-8 tool has only been validated for use in adults aged 50 and older (Keller, 2016). It is possible that SCREEN-8 does not measure nutrition risk accurately in those younger than 50, and the CLSA sample that we used included adults aged 45 to 49 and those 50 and older. We purposefully included this younger age group so that in the future we can examine how nutrition risk may develop in this younger age group using future waves of CLSA data. However, nutrition risk may present differently in this younger age group. These individuals may still have children living at home, or they may have children moving out of the home for the first time, affecting their food choices (Booth et al., 2009; Chen and Antonelli, 2020). These younger participants may also be working adults, which may affect their food choices during the workday (Booth et al., 2009; Chen and Antonelli, 2020).
Conclusions
High nutrition risk is prevalent in all age groups at midlife and beyond in Canada. Factors consistently associated with high nutrition risk across all age groups included social support, social standing, participation in community activities, depression, and self-rated general health, healthy aging, and oral health. Individuals with low levels of social support, low social standing, low participation in community activities, and those with depression, poor health, poor oral health, or poor healthy aging should be screened proactively for nutrition risk. Providing appropriate treatment for poor health, poor oral health and depression and ensuring individuals have adequate social support may help to reduce nutrition risk. Supporting healthy aging may also reduce nutrition risk.
Despite the similarities, there were differences between age groups, and programs and policies designed to screen for nutrition risk and address nutrition risk should take age into account. The results of our study can help inform such programs and policies aimed at reducing the prevalence of nutrition risk and its consequences among community-dwelling Canadians.
Supplemental Material
sj-docx-1-nah-10.1177_02601060241298348 - Supplemental material for Factors associated with high nutrition risk by 10-year age group: Data from the Canadian Longitudinal Study on Aging
Supplemental material, sj-docx-1-nah-10.1177_02601060241298348 for Factors associated with high nutrition risk by 10-year age group: Data from the Canadian Longitudinal Study on Aging by Christine Marie Mills, Heather H Keller and Catherine Donnelly in Nutrition and Health
Footnotes
Acknowledgements
This research was made possible using the data/biospecimens collected by the Canadian Longitudinal Study on Aging (CLSA). Funding for the Canadian Longitudinal Study on Aging (CLSA) is provided by the Government of Canada through the Canadian Institutes of Health Research (CIHR) under grant reference: LSA 94473 and the Canada Foundation for Innovation, as well as the following provinces, Newfoundland, Nova Scotia, Quebec, Ontario, Manitoba, Alberta, and British Columbia. This research has been conducted using the CLSA Baseline Tracking Dataset—Version 3.7, and Follow-up 1 Tracking Dataset—Version 2.2, under Application Number 2104008. The CLSA is led by Drs. Parminder Raina, Christina Wolfson and Susan Kirkland.
The AB SCREENTM II, rebranded as SCREEN-8, assessment tool is owned by Dr Heather Keller. Use of the AB SCREENTM II assessment tool was made under license from the University of Guelph.
Authorship
CMM planned the study, performed all statistical analyses, completed the data analysis, and wrote the paper. CD and HHK helped to plan the study and revise the manuscript.
Consent for publication
Informed consent for publication was provided by the CLSA.
Data accessibility statement
Declaration of conflicting interest
The authors declared the following conflicts of interest with respect to the research, authorship, and/or publication of this article: HK is past chair/co-chair of the Canadian Malnutrition Task Force (CMTF), currently leads the Primary Care working group at CMTF, and is the creator of the SCREEN-8 tool used in this research. CMM is a member of the Primary Care working group at CMTF. CD declares no conflicts of interest.
Disclaimer
The opinions expressed in this manuscript are the authors’ own and do not reflect the views of the Canadian Longitudinal Study on Aging.
Ethical approval and informed consent statements
This study received ethical approval from the Queen’s University Health Sciences and Affiliated Teaching Hospitals Research Ethics Board (REH-722-18) on April 12, 2021.
Funding
The authors received no financial support for the research, authorship, and/or publication of this article.
Supplemental material
Supplemental material for this article is available online.
References
Supplementary Material
Please find the following supplemental material available below.
For Open Access articles published under a Creative Commons License, all supplemental material carries the same license as the article it is associated with.
For non-Open Access articles published, all supplemental material carries a non-exclusive license, and permission requests for re-use of supplemental material or any part of supplemental material shall be sent directly to the copyright owner as specified in the copyright notice associated with the article.