
Abstract
Keywords
Introduction
A poor vitamin D status has many immediate and long-lasting impacts on the health and well-being of children. Severe and prolonged serum 25-hydroxyvitamin D (s25(OH)D) deficiency (<30 nmol/L)) has been associated with a higher risk of developing rickets (Sempos et al., 2018). Insufficient s25(OH)D concentrations (25–30 nmol/L - 75 nmol/L) have been linked to an increased risk of developing respiratory tract infections (Zisi et al., 2019), type 1 diabetes, rheumatoid arthritis, many common cancers (Holick, 2004), and increased hospitalisation and mortality from COVID-19 (Brenner and Schöttker, 2020; Pereira et al., 2022).
Vitamin D deficiency has reached pandemic levels affecting more than one billion children and adults worldwide (Holick, 2017; Linden et al., 2019). However, limited data exist regarding the vitamin D status of young Canadian Inuit children. To our knowledge, the only study carried out in this population revealed that 78.6% of preschoolers participating in the 2007–2008 Nunavut Child Inuit Health Survey had an insufficient s25(OH)D concentration (<75 nmol/L) during the summer, while this proportion reached 96.8% during the winter (El Hayek et al., 2010).
Many factors increase the risk of having a poor vitamin D status. Inadequate sunlight exposure, darker skin pigmentation, obesity and inadequate vitamin D intakes are important risk factors for vitamin D deficiency. Sunlight exposure is the main source of vitamin D for humans (Holick, 2017). However, several factors affect UVB (ultraviolet B) rays and vitamin D production. For individuals living at latitudes above 37 degrees north, Nunavik lies north of the 55th parallel, the amount of UVB photons reaching the earth's surface during the fall and winter months is reduced making skin synthesis of vitamin D nearly impossible for about 6 months of the year (Holick, 2004; McGee, 2020). During the summer months, Inuit children who likely have skin type IV, on a scale of 1 to VI (El Hayek Fares and Weiler, 2016), require much longer exposure to sunlight to make the same amount of vitamin D than do light-skin people (Holick, 2011). Thus, consumption of vitamin D-rich foods is essential to meet vitamin D recommendations and ensure optimal blood vitamin D concentrations.
To our knowledge, the proportion of Canadian Inuit children meeting the estimated average requirement (EAR) for vitamin D (Institute of Medicine, 2011) has not been determined. Although the positive effect of milk consumption on s25(OH)D concentrations has been shown in Inuit preschoolers from Nunavut (El Hayek et al., 2010), no study has been done in Inuit children residing in Nunavik. Moreover, the association between vitamin D status and seafood consumption (e.g., fish, molluscs and marine mammals), the main source of naturally occurring vitamin D, has not been determined in this population. Finally, breastfeeding without adequate vitamin D supplementation (Almeida et al., 2018) and a higher body weight (Greene-Finestone et al., 2017) have been associated with increased risks of vitamin D deficiency in non-Indigenous children, but no studies have been conducted in Inuit children. Based on the available evidence, we hypothesise that the prevalence of vitamin D insufficiency among Inuit children from Nunavik will be similar to that found over the years in non-Indigenous children and influenced in a similar way by the main determinants of vitamin D status described previously.
In this study, our primary objective was to investigate the prevalence and main determinants (breastfeeding duration, body weight, energy and vitamin D intakes and consumption of several Canada's Food Guide (CFG)) subgroups for insufficient s25(OH)D concentrations in Inuit children attending childcare centres in Nunavik.
Subjects and methods
This cross-sectional study was carried out between 2006 and 2010 mainly to document contaminant-nutrient interactions in Inuit children attending childcare centres in Nunavik (Turgeon O'Brien et al., 2019). Ten of the 14 Nunavik communities were visited during the fall season (October to 1st week December) and 245 children aged 11.6 to 54 months old were recruited. No exclusion criteria were applied in this study. Although our findings cannot be generalised to all Inuit children enrolled in childcare centres of Nunavik due to the convenience sampling technique, our sample included 245 children from 75% of Nunavik childcare facilities. Information on the study was provided individually, orally or through a digital versatile disc (DVD) available in Inuktitut, English, or French. Parents who agreed to let their child participate in the study gave written informed consent. As reported elsewhere (Turgeon O'Brien et al., 2016), the respondent for the child at the time of the interview was the biological mother (78.8%, n = 193) or father (2.8%, n = 7), the adoptive mother (15.5%; n = 38), the foster mother (2.4%, n = 6), or the foster father (0.4%, n = 1). This study was approved by the Research Ethics Board of the Centre Hospitalier de l’Université Laval du Centre Hospitalier Universitaire de Québec (CHUL-CHUQ), Québec (Canada), and was conducted according to the Declaration of Helsinki.
Blood sampling and laboratory analyses
Of the 245 children recruited for this study, a smaller number of participants had a blood test (n = 180) (Figure 1) due to challenges related to drawing blood from young children. Also, the quantity of blood withdrawn was not sufficient in some children to perform all blood tests leaving 152 participants with a s25(OH)D test. A 5-mL red top Vacutainer tube was obtained from each child by venipuncture. s25(OH)D was assayed following each annual data collection at the Institut universitaire de cardiologie et de pneumologie de Québec by radioimmunoassay with a commercially available kit (25-Hydroxyvitamin D 125I RIA Kit; DiaSorin, Stillwater, MN, USA) according to the manufacturer's instructions. First, s25(OH)D and other hydroxylated metabolites were extracted from serum with acetonitrile. Following extraction, the treated samples were then assayed using an equilibrium RIA procedure. Antibody with specificity to 25(OH)D and tracer were incubated for 90 minutes at 20–25°C. Phase separation was accomplished after 20 minutes of incubation at 20–25°C with a second antibody-precipitating complex. A NSB/addition buffer was added after this incubation prior to centrifugation to aid in reducing non-specific binding. The tubes were centrifuged, the supernatant was removed, and the pellet was dried and counted using a gamma counter (1271 LKB-Wallac; Perkin Elmer, Shelton, CT). In addition to quality controls supplied by DiaSorin, internal quality control procedures were used by the laboratory to monitor assay performance. Assay performance measures were in the laboratory's acceptable range. At the time of the study, DiaSorin radioimmunoassay (RIA) test was used in the vast majority of large-clinical studies worldwide to define ‘normal’ circulating 25(OH)D concentrations (Hollis, 2010).
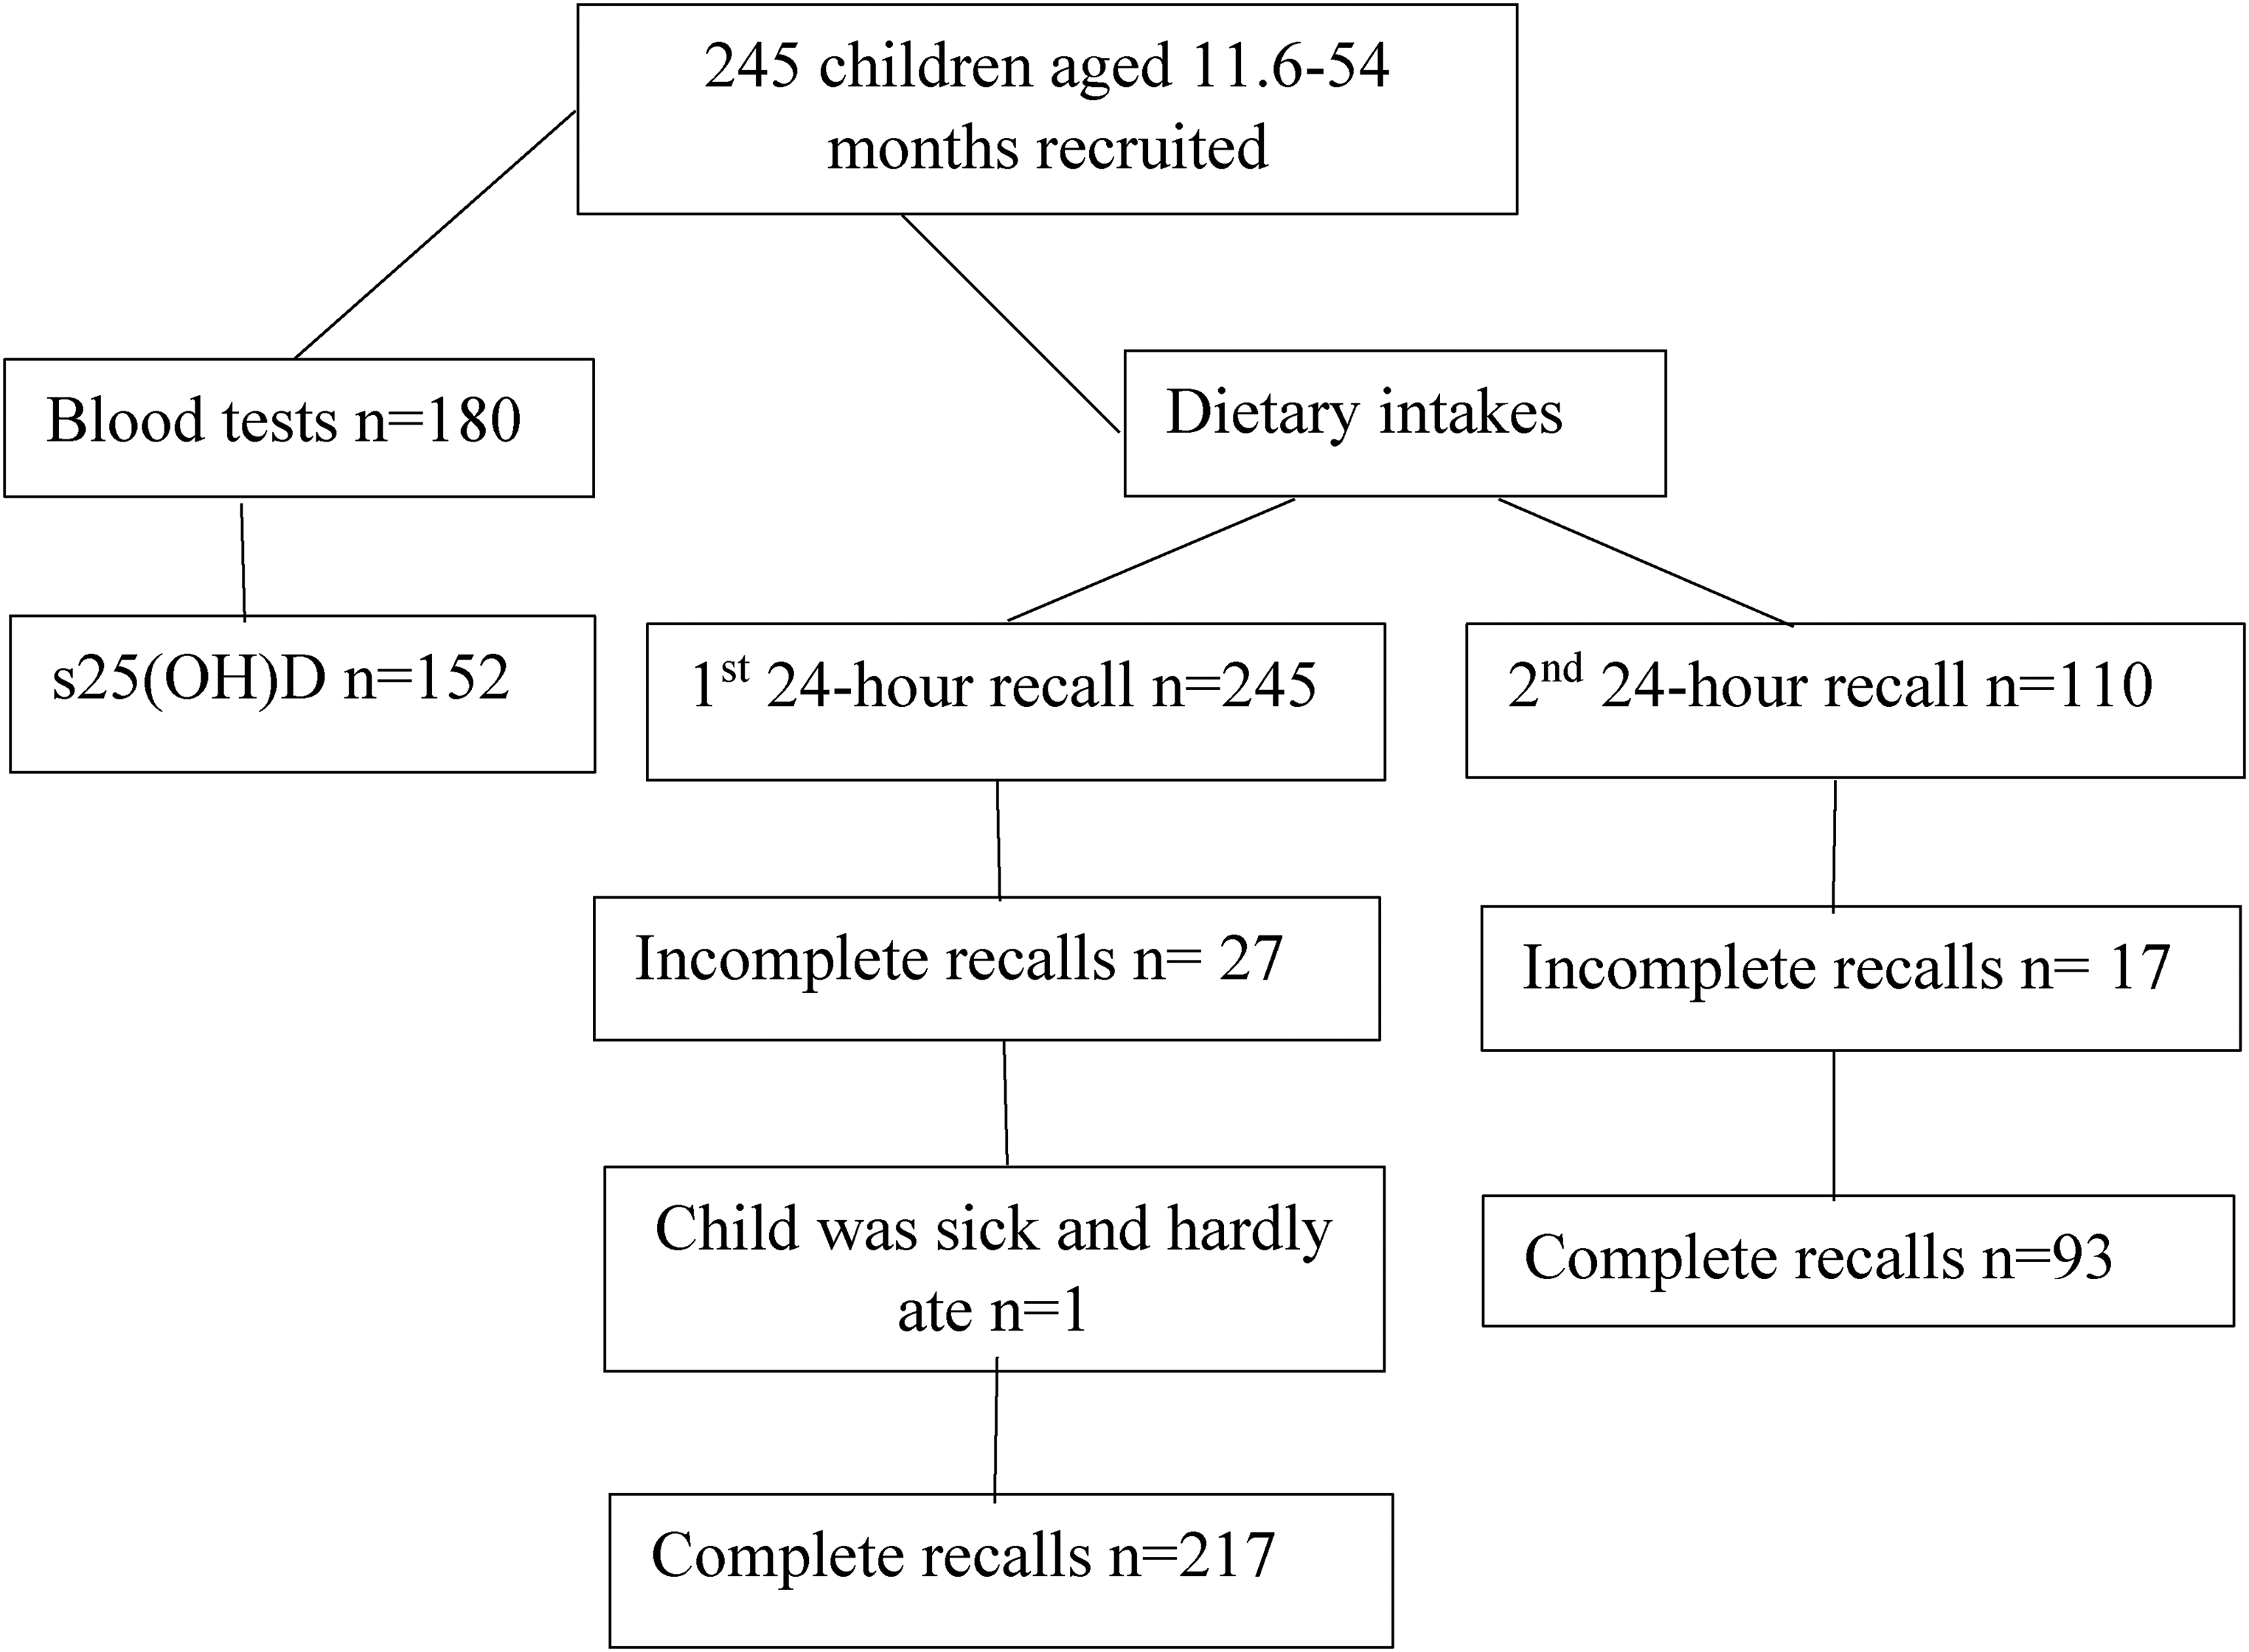
Flow diagram of blood tests and dietary intakes obtained from children.
The Canadian Paediatric Society (CPS) defined in 2007 (reaffirmed in 2017) vitamin D deficiency on the basis of a s25(OH)D concentration <25 nmol/L, insufficiency between 25 and 75 nmol/L, and optimal values between 75 and 225 nmol/L (Canadian Paediatric Society, 2007, 2017).
Dietary assessment
Dietary intakes of children were measured by means of the 24-hour recall method. Recalls were administered by dietitians with the parent or primary caregiver and with the childcare centre's educator(s) and cook if the child had attended childcare centre on the day of the recall. The relative validity of the 24-hour recall using for instance a single one-day weighed recall which can be carried out the day following the 24-hour recall (Gibson, 2005) has not been determined. However, measures were implemented to reduce the limitations of the 24-hour recall (Gagné et al., 2012). For example, information on cooking methods and food brand names were obtained from respondents whenever possible. When necessary, dietitians used information on products available at the local grocery store (e.g., food labels, package size) to complete the 24-hour recalls. Three-dimensional graduated food model kits from Santé Québec were also used to better standardise recalls. Among the 245 children recruited in this study, 27 had an incomplete or no 24-hour recall, while one child was too sick and hardly ate any food, leaving 217 children with a complete 24-hour recall (Figure 1). A second 24-hour recall was available on 110 participants and 17 were incomplete for similar reasons, leaving 93 participants with a second 24-hour recall. Although we attempted not to do so, eight 24-hour recalls were held on consecutive days. The mean number of days between the two 24-hour recalls was 4.5 days. Food intakes were classified according to CFG First Nations, Inuit and Métis food groups (Health Canada, 2007b). The distribution of usual vitamin D intakes was estimated using a mixed-effects model and quantile estimation method developed at the National Cancer Institute (NCI) (Tooze et al., 2010). When data were coded, breast milk was included in the fluid milk category. Due to time constraints and financial limitations, breast milk has not been re-coded in a unique category. Among participants whose 24-hour dietary recall was complete (n = 217), 2.3% (n = 5) did not receive any other type of milk than human milk, while 7.8% (n = 17) received both human milk and either infant formula or vitamin D-fortified cow's milk. It is noteworthy to mention that Canadian cow's milk is required by law to be fortified with vitamin D (≈ 100 IU (2.5 µg) per cup (250 mL)). Non-alcoholic beverages included 100% fruit juice, fruit punch, soft drinks, and tea/coffee/hot chocolate.
Dietary intakes were computerised using the Micro Gesta software package version 1.1.56 (Micro Gesta, Québec, QC, Canada) by dietitians from the Institut national de santé publique du Québec. The nutritional value for foods consumed by participants was determined using the Canadian Nutrient File, version 2007 (Health Canada, 2007a). In this study, 1.2% of respondents (n = 3/245) mentioned that the child took a vitamin D-containing supplement. These supplements were not added to dietary recalls due to the lack of accurate information on the exact amount consumed by children.
The EAR cut-point method proposed by the dietary reference intakes (DRIs) to estimate the prevalence of inadequate intakes in a group was used to assess the nutrient adequacy of vitamin D (Institute of Medicine, 2011). The EAR for vitamin D is 400 IU (10 μg) per day for children aged 1–8 years (Institute of Medicine, 2011). One child aged 11.6 months was included in the 1- to 8-year-old category when assessing nutritional adequacy.
Anthropometric measurements
Anthropometric measurements were carried out according to standard procedures. Body weight was measured with a balance-beam scale or with an electronic digital scale. For children unable to stand unassisted, we measured recumbent length by indicating on a paper the distance from the bottom of the foot to the top of the head and measuring it using a non-stretch tape. Body mass index (BMI) was calculated using the following formula: weight (kg)/height (m)2. The weight-for-length and BMI-for-age were used respectively for children <24 months old (n 121), and for ≥24 months old (n 107). For descriptive purposes, children were then classified into one of the five weight-status categories according to the World Health Organization (WHO) cutoff values (Secker, 2010) (Table 1). However, only body weight was included in the regression models, because the use of BMI for children below 2 years of age is not recommended by the WHO (World Health Organization, 2006). Children measured in the recumbent position resist full extension of their legs and rarely lie still during measurement, which can bring about significant errors due to the fact that length/height is squared in the BMI equation.
Selected characteristics of 245 young Canadian Inuit children from Nunavik according to whether or not they had a s25(OH)D measurement.
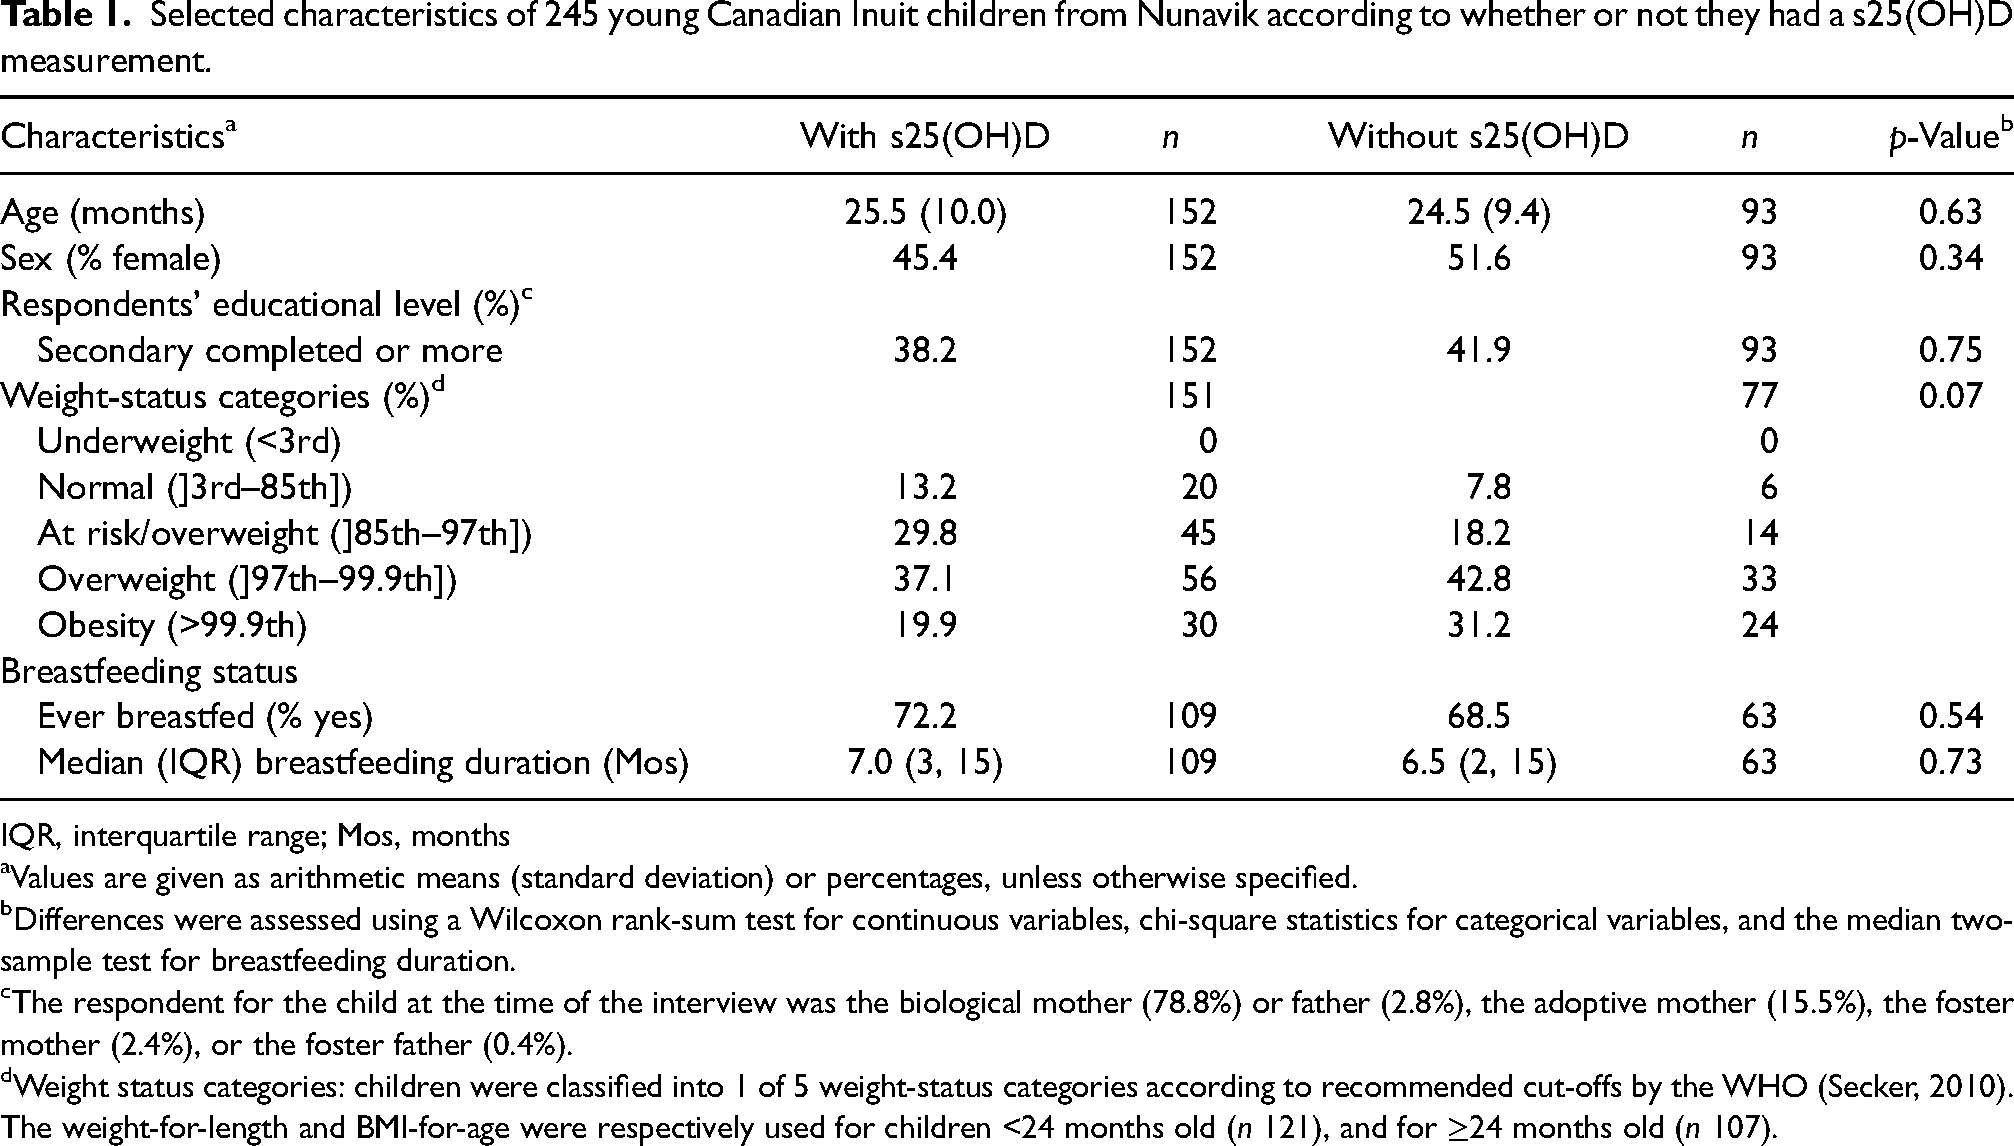
IQR, interquartile range; Mos, months
Values are given as arithmetic means (standard deviation) or percentages, unless otherwise specified.
Differences were assessed using a Wilcoxon rank-sum test for continuous variables, chi-square statistics for categorical variables, and the median two-sample test for breastfeeding duration.
The respondent for the child at the time of the interview was the biological mother (78.8%) or father (2.8%), the adoptive mother (15.5%), the foster mother (2.4%), or the foster father (0.4%).
Weight status categories: children were classified into 1 of 5 weight-status categories according to recommended cut-offs by the WHO (Secker, 2010). The weight-for-length and BMI-for-age were respectively used for children <24 months old (n 121), and for ≥24 months old (n 107).
Data analysis
Statistical analyses were performed by the Service de Consultation Statistique, Université Laval, using the Statistical Analysis System (SAS) (version 9.2; SAS Institute Inc., Cary, NC). The normality of distribution was determined both graphically and with the Shapiro–Wilk test (Razali and Wah, 2011). Because missing data can weaken the validity of results and conclusions (Pedersen et al., 2017), we used a multiple imputation technique to replace missing values in order to perform the two multiple regression models on 245 subjects. We opted for the fully conditional specification multiple imputation technique (van Buuren, 2007) to create 100 full sample data sets. The regression model was fitted on each imputed data set, and parameter estimates were averaged over the imputed data sets. Statistical tests on these parameters were derived using the between-imputation and the within-imputation variance terms, as described by Rubin (2004) in order to build t-statistics with the appropriate degrees of freedom. The following variables were used in the first regression model: child's age, sex, respondent's educational level, breastfeeding duration, body weight, and the number of CFG subgroups servings of seafood (e.g., fish, molluscs, and marine mammals), fluid milk, yogurt and non-alcoholic beverages consumed during the 24-hour recalls. In the second regression model, energy and vitamin D intakes replaced CFG subgroups. Only significant terms were kept in the model at α = 5% level of significance, except for tertiles of age and respondents’ educational level for which the Bonferroni correction was applied with a significance level of p < 0.025.
Results
The mean age of children with a s25(OH)D analysis was 25.5 (10.0) months (Table 1). Nearly 60% of children were classified as either overweight or obese. Nearly 40% of respondents had completed a secondary level of education or more. Also, 72% of children had ever been breastfed, and the median breastfeeding duration was 7 months. No significant differences were observed between the descriptive characteristics of children who had a s25(OH)D analysis (n 152), and those who had none (n 93).
Using the CPS thresholds (Canadian Paediatric Society, 2007, 2017), the prevalence of s25(OH)D < 25 nmol/L was 4.6%, while 64.5% of participants had a s25(OH)D concentration < 75 nmol/L (Table 2). Also, 25.7% of children had a s25(OH)D concentration < 50 nmol/L using the IOM threshold (Institute of Medicine, 2011) (result not shown). The mean energy intake was 1196 kcal ((standard deviation) 217) [5004 kJ (kilojoules) (908)] (result not shown). A high proportion of participants did not meet the EAR for vitamin D intake (78.1%).
Usual vitamin D intakes and s25(OH)D concentrations of young Canadian Inuit children from Nunavik.
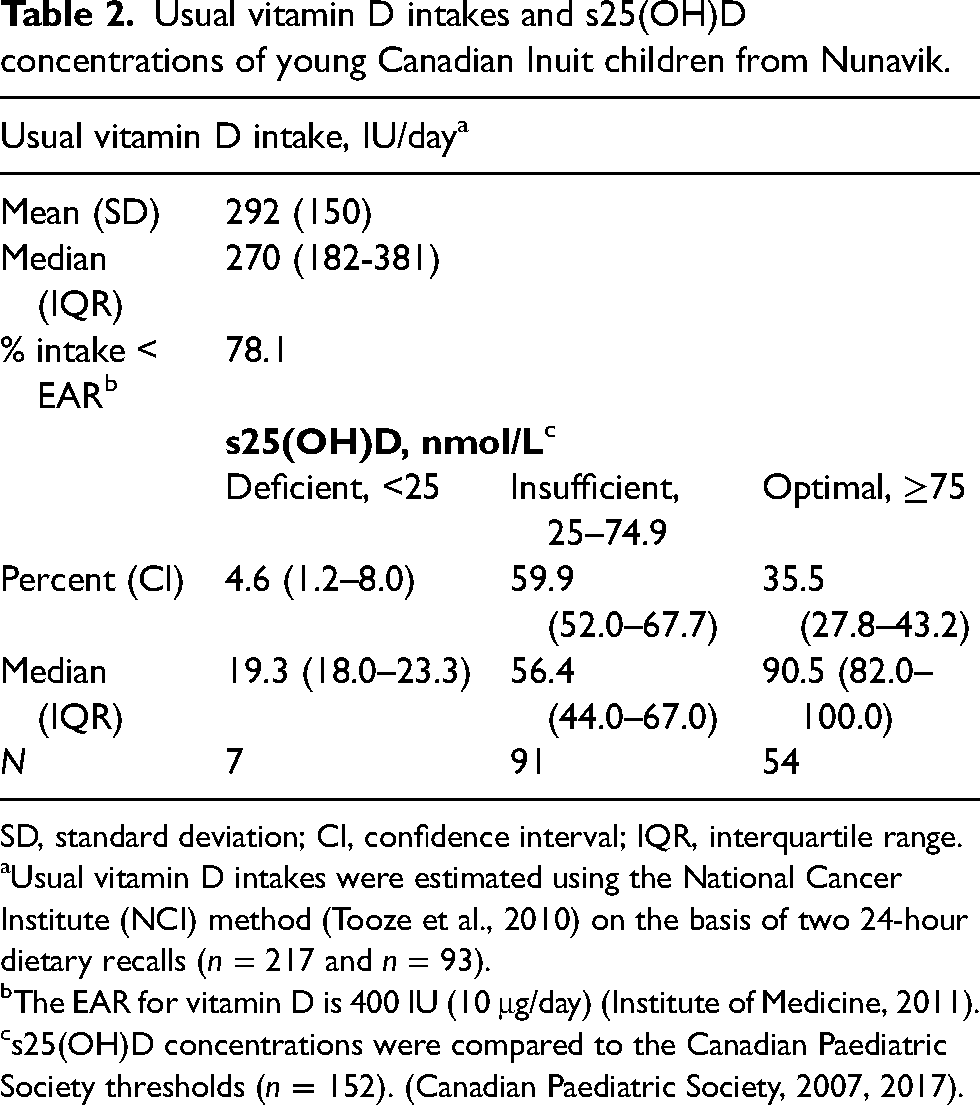
SD, standard deviation; CI, confidence interval; IQR, interquartile range.
Usual vitamin D intakes were estimated using the National Cancer Institute (NCI) method (Tooze et al., 2010) on the basis of two 24-hour dietary recalls (n = 217 and n = 93).
The EAR for vitamin D is 400 IU (10 μg/day) (Institute of Medicine, 2011).
s25(OH)D concentrations were compared to the Canadian Paediatric Society thresholds (n = 152). (Canadian Paediatric Society, 2007, 2017).
In the first regression model, the number of servings of fluid milk was strongly and positively associated with s25(OH)D concentrations (Table 3). Significant and negative associations were observed between s25(OH)D concentrations and non-alcoholic beverage consumption, breastfeeding duration and body weight. No significant associations were found between yogurt consumption, age and sex and s25(OH)D concentrations. However, children whose respondent had some secondary education or had completed a secondary education or more had higher s25(OH)D concentrations than did those whose respondent had an elementary education level. In the second regression model, a strong positive relationship was observed between vitamin D intake and s25(OH)D concentrations, while a negative association was found between vitamin D concentrations and energy intakes. Contrary to Model 1, no significant association was observed between s25(OH)D concentrations and respondents’ educational level. Variables included in the models explained respectively 31% and 34% of the variance in s25(OH)D concentrations.
Multivariate linear regression analyses predicting s25(OH)D concentrations in 245 young Canadian Inuit children from Nunavik.a
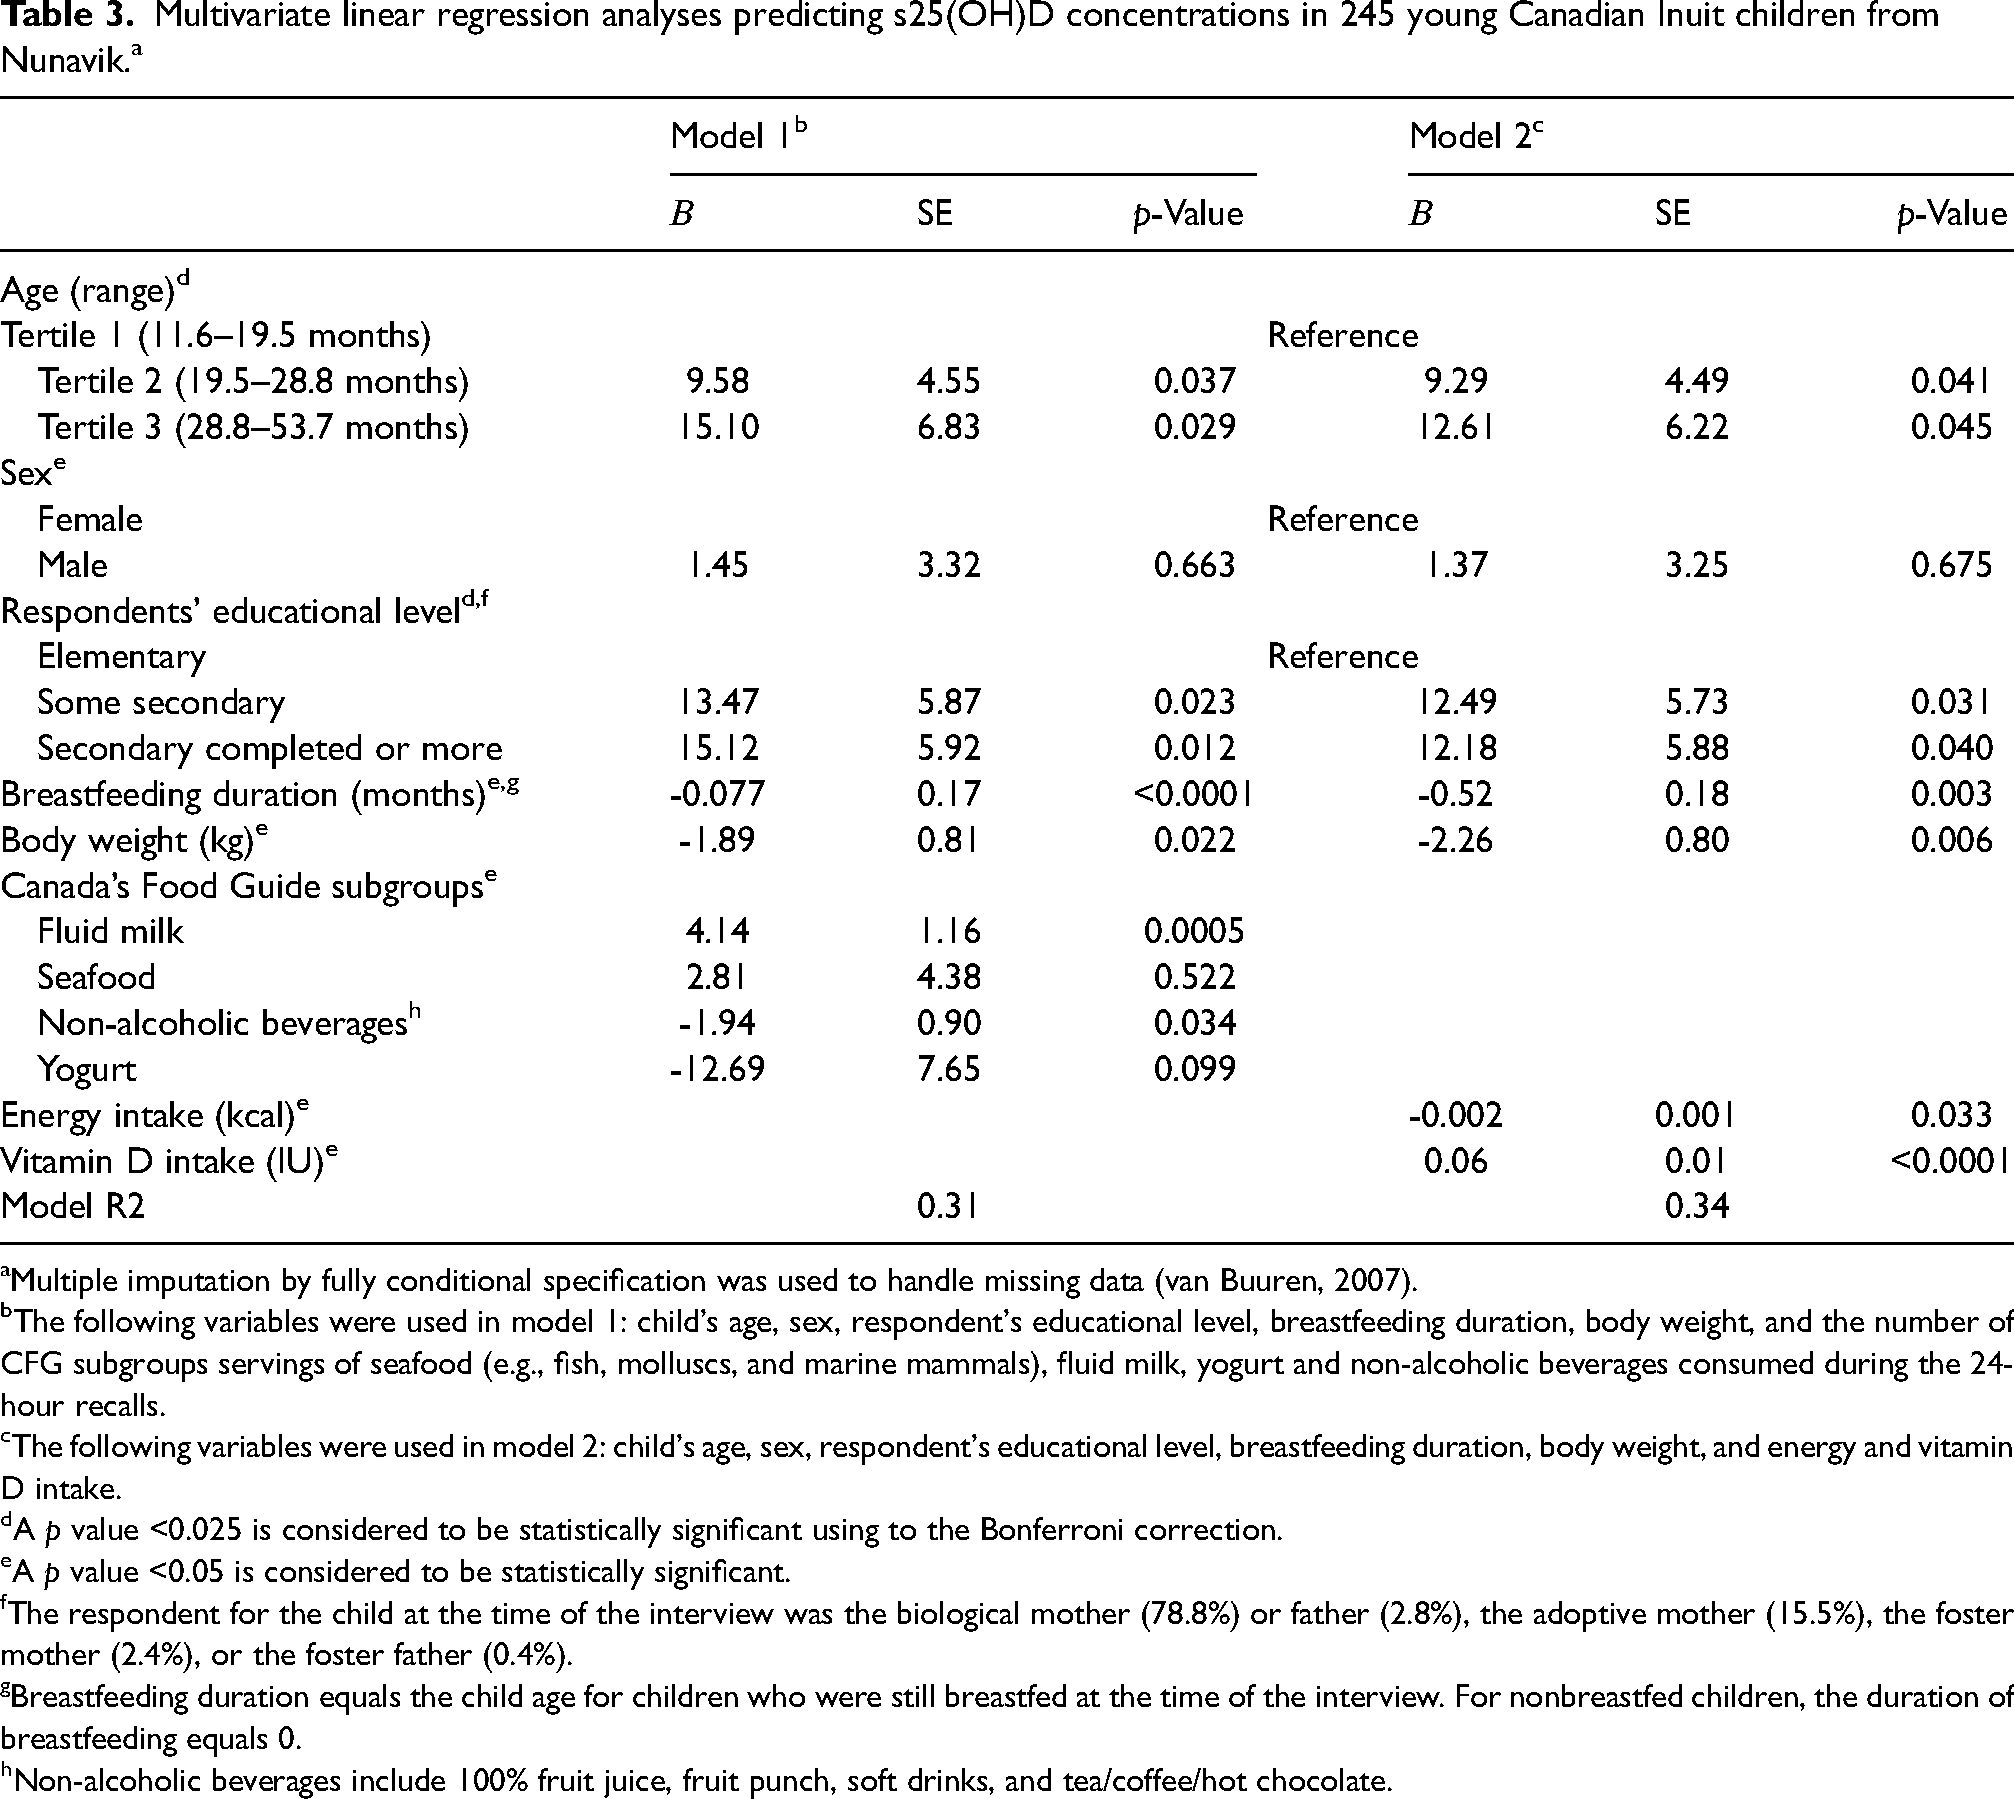
Multiple imputation by fully conditional specification was used to handle missing data (van Buuren, 2007).
The following variables were used in model 1: child's age, sex, respondent's educational level, breastfeeding duration, body weight, and the number of CFG subgroups servings of seafood (e.g., fish, molluscs, and marine mammals), fluid milk, yogurt and non-alcoholic beverages consumed during the 24-hour recalls.
The following variables were used in model 2: child's age, sex, respondent's educational level, breastfeeding duration, body weight, and energy and vitamin D intake.
A p value <0.025 is considered to be statistically significant using to the Bonferroni correction.
A p value <0.05 is considered to be statistically significant.
The respondent for the child at the time of the interview was the biological mother (78.8%) or father (2.8%), the adoptive mother (15.5%), the foster mother (2.4%), or the foster father (0.4%).
Breastfeeding duration equals the child age for children who were still breastfed at the time of the interview. For nonbreastfed children, the duration of breastfeeding equals 0.
Non-alcoholic beverages include 100% fruit juice, fruit punch, soft drinks, and tea/coffee/hot chocolate.
Discussion
In this study conducted in young Inuit children recruited in childcare centres of Nunavik over a decade ago, almost two thirds of children (64.5%) had an insufficient s25(OH)D concentration (<75 nmol/L). High prevalence rates of inadequate s25(OH)D concentrations were also observed in children enrolled in the 2007–2008 Nunavut Child Inuit Health Survey (78.6%) (El Hayek et al., 2010), as well as in non-Indigenous children recruited between 2010 and 2018 in Canada and other countries (50.6%–89%) (Cairncross et al., 2017; Chen et al., 2021; Delshad et al., 2019; El Hayek et al., 2013; Taseen and Beaulieu, 2017). The prevalence of vitamin D intakes below the EAR was also high (78.1%), closely aligning with results obtained in older Canadian children (5th grade) enrolled in the 2011 Alberta (78%) and Nova Scotia (81%) provincial surveys (Colapinto et al., 2014), and the 2016 US Feeding Infants and Toddlers Study (76%) (Bailey et al., 2018). The high prevalence of insufficient vitamin D intake and status observed in the present study likely reflects the vitamin D inadequacy currently affecting young Inuit children from Nunavik. Indeed, over the past several decades, Inuit living in the Canadian Arctic have been undergoing a dietary transition (Little et al., 2021) characterised by a decline in consumption of country foods rich in vitamin D such as fish, whale, and ringed seals (Rosol et al., 2016). In addition, only a limited number of foods contain appreciable amounts of vitamin D, making it difficult for many children to meet the recommended daily allowance for vitamin D. Milk, the main source of vitamin D in children's diet (Maguire et al., 2013; Munasinghe et al., 2017a), provides ≈100 IU per cup (250 mL). The recommended dietary allowance (RDA) for vitamin D in individuals’ ages 1–70 years is 600 IU per day (Institute of Medicine, 2011). It is noteworthy to mention that vitamin D requirements seem to be higher than presently recommended. Indeed, calculation errors in setting RDAs for vitamin D have been discovered (Heaney et al., 2015; Veugelers and Ekwaru, 2014); reanalysis of data showed that ≈ 7000 IU/day from all sources (cutaneous synthesis, foods, supplements) were needed, instead of 600 IU from foods and supplements (Papadimitriou, 2017). Thus, during the fall and winter months, when skin production of vitamin D from sun exposure is quasi inexistent, children need to rely solely on dietary sources of vitamin D and supplements, both of which were inadequate among many Inuit children enrolled in the present study.
The strong positive relationship observed in this study between vitamin D intakes and status is corroborated by results from other studies conducted in children (El Hayek et al., 2013; Vatanparast et al., 2013) and highlights the need to determine the relative contribution of vitamin D-containing foods on s25(OH)D concentrations. Study participants, as residents of the Arctic, likely had access to fatty fish and marine mammals, the best sources of naturally occurring vitamin D. For instance, a standard food guide serving (75 grams) of Arctic char, salmon or seal meat contains 300 IU, 245 IU and 54 IU of vitamin D, respectively. As expected, seafood consumption was higher (22%) in our study than that reported in young children participating in the Canadian Community Health Survey (17%) (Hu and Chan, 2021). However, we found no significant association between seafood consumption and s25(OH)D concentrations, likely due to the small portion size (0.68 ± 0.5) consumed by participants (result not shown).
Fluid milk was the major determinant of vitamin D status in the present study. Similarly, Inuit preschoolers from Nunavut (3–5 years of age) who did not consume milk at all and those who consumed <2 servings of milk per day had significantly lower plasma 25(OH)D concentrations than those who consumed ≥2 servings of milk (El Hayek et al., 2010). Furthermore, the 2012/2013 Canadian Health Measures Survey (CHMS), which was designed to represent the Canadian population, showed that children who consumed cow's milk daily were more likely to have s25(OH)D concentrations ≥50 nmol/L than those who drank milk less frequently (Munasinghe et al., 2017b). The positive association between milk consumption and vitamin D status has also been reported in ten observational studies conducted in children and adolescents from seven countries including Canada and the United States, and published between 2010 and 2017 (Itkonen et al., 2018). In contrast, yogurt consumption was not significantly associated with s25(OH)D concentrations. Few children consumed yogurt with added vitamin D (14.7%) (result not shown), which contains ≈60 IU of vitamin D per food guide serving (175 g) (Health Canada, 2007a). Overall, yogurt consumption was lower in our study than that found in 2–5 years old children participating in the CCHS (33.6% versus 47%), while the serving size was also smaller (0.31 ± 0.30 vs. 0.79 ± .03) (Vatanparast et al., 2019). Considering that yogurt consumers have a higher intake of key nutrients and a better diet quality than non-consumers (Vatanparast et al., 2019), promoting consumption of yogurt made from vitamin D-fortified milk would be an additional benefit.
A higher consumption of non-alcoholic beverages was significantly associated with decreased s25(OH)D concentrations confirming results observed in healthy American adolescents from Boston (Gordon et al., 2004). Although vitamin D can be added to calcium-fortified orange or orange and tangerine juice since 2006 (Government of Canada, 2006), it was not consumed by participants, likely due to a lack of availability in Nunavik. In our study, non-alcoholic beverages most likely replaced fluid milk in some participants’ diet, as indicated by the strong inverse correlation observed between both variables (Spearman's r = -0.44, p ≤ 0.0001 (result not shown)). The 100% fruit juices, although they usually contain less fibre than whole fruits, can help round out fruit intake and are a convenient alternative, especially for Northerners. However, they should not replace milk consumption.
As expected, breastfeeding duration was inversely associated with s25(OH)D concentrations (Almeida et al., 2018; Madar et al., 2017). Breastmilk is one of the few natural foods that contain some vitamin D (≈20 IU/L). To avoid developing a vitamin D deficiency, an increase of vitamin D intake to 800 IU/day has been recommended for breastfed children from October to April for northern Native communities (Canadian Paediatric Society, 2007). However, as mentioned earlier, vitamin D supplementation was almost nonexistent in the current study.
In agreement with findings of studies conducted in school-age children and adolescents (Mark et al., 2008; Zittermann et al., 2014), we found an inverse association between s25(OH)D concentrations and body weight. Vitamin D concentrations (s25(OH)D) were also negatively associated with energy intakes indicating that an energy-dense diet, which has been linked to rising obesity rates (Jessri et al., 2017), led to lower vitamin D intakes and status. It has been suggested that volumetric dilution of vitamin D best explains the low vitamin D status of obesity (Vranić et al., 2019). Vitamin D is distributed into the greater volume of fat, serum, liver, and muscle reducing s25(OH)D concentrations. In agreement with other studies (Greene-Finestone et al., 2017; Pludowski et al., 2018), our results suggest that heavier children require higher doses of vitamin D to achieve optimal s25(OH)D concentrations. The US Endocrine Society recommended in 2011 that obese children and adults (BMI >30 kg/m2) get at least two to three times more vitamin D for their age group than the recommended dose for subjects with normal body weight (Holick et al., 2011).
Finally, a low educational level among respondents was predictive of a low vitamin D status (Model 1), contradicting the results of a study conducted in healthy Alberta children (Stoian et al., 2011). In the previous study, the level of parental education went from high school completion to university graduate, whereas our findings revealed that only 40% of respondents had completed a secondary education or more. Educational success remains unreachable for disproportionately large numbers of Indigenous youth and adults across Canada (Ives and Sinha, 2016).
Study strengths and limitations
The major strength to this study is that, to our knowledge, it is the first study to determine the prevalence and risk factors of low s25(OH)D) concentrations in preschool Inuit children from Nunavik. Also, it is important to note that usual dietary intakes were estimated using a procedure developed at the NCI, while a multiple imputation technique was used in the regression analyses to handle missing data. Our sample included 245 children from 75% of Nunavik childcare facilities. However, because of the convenience sampling technique, results cannot be generalised to all preschool Inuit children enrolled in childcare centres of Nunavik. When interpreting our results, we must also keep in mind that while the 24-hour dietary recall method is useful, it does have limitations (Gibson, 2005). Indeed, food recalls are retrospective, and data depend on the respondent's memory and cooperation (Foster and Bradley, 2018). In the present study, we relied on parents’, educators’, and cooks’ memories and collaboration. Nevertheless, we took measures to reduce these limits such as visits to the local grocery store and childcare centres’ kitchen in order to obtain more information on brand names, package size, and prices.
Conclusion
This study determined for the first time the vitamin D intake and status of Inuit children attending childcare centres in Nunavik. The high prevalence of inadequate vitamin D intakes and insufficient blood vitamin D concentrations observed in this population closely aligns with findings reported in non-Indigenous children up until now. Breastfed children who do not receive vitamin D supplementation, overweight/obese children, and children with inadequate milk consumption are at high risk of vitamin D insufficiency. Nutritional intervention strategies promoting consumption of vitamin D-rich foods such as milk and seafood, as well as vitamin D supplementation for breastfed children and those at risk of low vitamin D intakes are recommended. Families need clear recommendations concerning the amount of vitamin D-rich foods necessary to meet the recommended daily allowance (RDA) for vitamin D, especially given that the 2019 CFG eliminated food groups and portion sizes (Health Canada, 2019).
Footnotes
Acknowledgements
The authors are grateful to the Nunavik parents and children for their participation. They also wish to thank all educators, cooks and directors of childcare centres in Nunavik, who were supportive of the project. They thank the Kativik Regional Government and the Nunavik Nutrition and Health Committee for their constant support. The authors give special thanks to Julie Lauzière for her valuable contribution to grant applications, data collection and database management. They also benefited from the expertise of Hélène Crépeau and Gaétan Daigle (Service de Consultation Statistique, Université Laval) for statistical analysis.
Authors’ contributions
D.G., C.V. and H.T.O. were responsible for the study idea and design; H.T.O. conducted the statistical analyses with the help of two statisticians, Hélène Crépeau and Gaétan Daigle (Service de Consultation Statistique, Université Laval); H.T.O. interpreted the results and prepared the first draft of the manuscript; D.G., R.B. and C.V. contributed in revising the manuscript. All authors read and approved the final manuscript.
Author contact information at present
Huguette Turgeon O’Brien, R.D., PhD, retired full professor, École de nutrition, Faculté des Sciences de l’Agriculture et de l’Alimentation, Université Laval.
Doris Gagné, R.D., MSc, Advisor, Direction du dépistage et de la vaccination, Direction générale de la coordination réseau et ministérielle et des affaires institutionnelles, Ministre de la Santé et des Services sociaux.
Rosanne Blanchet, R.D., PhD, Assistant Professor, École de santé publique de l’Université de Montréal. Researcher Centre de recherche en santé publique (CReSP).
Carole Vézina, RN, BSc, Nurse, Centre intégré universitaire de santé et de services sociaux (CIUSSS) de la Capitale-Nationale, Ministre de la Santé et des Services sociaux.
Declaration of conflicting interests
The authors declared no potential conflicts of interest with respect to the research, authorship, and/or publication of this article.
Ethical approval
This study was approved by the Research Ethics Board of the Centre Hospitalier de l’Université Laval du Centre Hospitalier Universitaire de Québec (CHUL-CHUQ), Québec (Canada).
Funding
The authors disclosed receipt of the following financial support for the research, authorship, and/or publication of this article: This work was supported by the Health Canada, Kativik Regional Government, Government of Canada, Aboriginal Affairs and Northern Development Canada Canada-Northern Contaminants Program.