
Abstract
Introduction
Type 2 diabetes (T2D) is characterized by hyperglycaemia associated with diminished insulin secretion and insulin resistance which leads to increased hepatic glucose output and decreased glucose peripheral utilisation (Guillausseau et al., 2008). Postprandial hyperglycaemia is influenced by several factors including gastric emptying process, intestinal glucose absorption rate, insulin sensitivity in peripheral tissues, glycogenolysis process after meals, hepatic gluconeogenesis and insulin secretion during postprandial period. Current oral treatment for T2D is targeted at reducing hepatic glucose output, improving insulin release, improving glucose absorption and increasing peripheral glucose utilisation (Pathak and Bridgeman, 2010). Physical activity along with a dietary regime have been suggested to be important in regulating blood glucose (BG) levels, thus important for T2D management (Asif, 2014; Russell et al., 2016).
Resistant starch (RS) intake with low glycemic index (GI) properties has been shown to be beneficial in managing postprandial hyperglycaemia (Liu et al., 2022; Rashed et al., 2022). The process whereby RS skips digestion in the small intestinal and is fermented by microbial in the colon prevent glucose spike from occurring (Topping et al., 2008). The more the RS content, the slower the digestion rate and the lower the GI which determines the ability of food to raise the BG level (Kumar et al., 2018). The postprandial BG excursion in people with diabetes can be elevated and prolonged, thus RS intake may help control BG level. The glycaemic effect of food depends on numerous factors affecting the formation of RS such as the amylose/amylopectin ratio and processing factors in processed food, the native environment of the starch granule and others. Thus, the factors affecting the GI values depends on the RS formation (Birt et al., 2013; Jyoshna and Hymavathi, 2017).
Several studies reported significant changes in postprandial BG and the insulin incremental area under the curve (iAUC) in response to RS intake in prediabetes and diabetes adults (Gargari et al., 2015; Mesa García et al., 2017; Peterson et al., 2018; Poquette et al., 2014; Zhu et al., 2019). For in vivo studies, the BG lowering effects by different sources of RS were evident in diabetic (alloxan/streptozotocin-diabetic induced, Goto-Kakizaki (GK), Zucker diabetic fatty (ZDF) rats) and healthy rodents (Wistar rats and Sprague Dawley) (Koh et al., 2016; Lopes et al., 2019; Nakamura et al., 2017; Nugraheni et al., 2017; Olvera-Hernández et al., 2018; Shen et al., 2011; Wahjuningsih et al., 2018; Zhang et al., 2020; Zhu et al., 2020). In terms of pancreatic islets study, Shen et al., 2011 found a significant increase in β-cell density in diabetic GK rats fed with RS (Shen et al., 2011). Dipeptidyl peptidase (DPP)-IV and α-glucosidase inhibitors are two classes of oral drugs used for the hyperglycaemic treatment in T2D (Feingold, 2020) by decreasing the postprandial hyperglycaemia via digestive system (Nakamura et al., 2014). The BG regulating effect of a few types of RS with DPP-IV and α-glucosidase inhibitory activities was previously shown in both healthy and disease models (Gomathi et al., 2020; Keenan et al., 2006; Nakamura et al., 2014; Pinky et al., 2017; Zhou et al., 2008).
In Malaysia, Sarawak produces the world's biggest sago since the 1970s (Abd-Aziz, 2002; Karim et al., 2008) which can be found primarily in nearby river areas of Mukah and Betong divisions. The amylose/amylopectin ratio of sago is reported to be higher (24–31%) when compared to short-medium grain rice (15–18%) and glutinous rice (4%) which are commonly consumed in Asia (Karim et al., 2008; Lim et al., 2019). The RS content of sago native starch was reported to contain up to 68.99% (Zaman et al., 2015). Chemical modifications such as phosphorylation, acetylation and hydroxypropylation are known to increase the RS content of starch (Dupuis et al., 2014). Acetylation has shown to increase the RS content of sago to up to 74% – which is comparable to the commercially available wheat RS from FibersymTM (Zaman et al., 2015).
In Sarawak, various types of food have been produced from sago and widely used in food industries including sago pearls, tabaloi (a traditional delicacy biscuit), keropok (shrimp crackers), puddings and jellies. Sago is also used as a thickener in food products and made into noodles as well as vermicelli (Karim et al., 2008). Starch in food may be classified into three categories, namely rapidly digestible starches, slowly digestible starches and RS based on the results of in vitro digestion (Englyst et al., 1992). Despite many studies have been done on RS, little is known about the beneficial effects of our local RS extracted from sago (Metroxylon sagu Rottb.) in terms of controlling BG. Understanding the therapeutic values of RS is beneficial to narrow the gaps of knowledge in diabetes management, hence reducing the risks of complications. This study was done to investigate the postprandial BG lowering effects of local Malaysian sago native (RS2) and modified (RS4) from Sarawak. The mechanisms involved associated with inhibitory activities of α-glucosidase and DPP-IV in response to the Sarawak sago RS were accessed and may identify the importance of RS in managing postprandial hyperglycaemia.
Materials and methods
Analysis of RS
Sago native starch (Sago RS2) used in the study was obtained from a local supplier. A portion of this native starch was then subjected to further chemical modification to produce sago RS4 which was obtained from a separate project. The modified sago (RS4) starch used in this study was a cross-linked dual modified sago starch, which was obtained by treating the RS2 with sodium trimetaphosphate (STMP) and sodium tripolyphosphate (STPP) (Woo and Seib, 2002). The percentage degree of substitution for sago RS2 and RS4 was 0.008 ± 0.94% and 0.13 ± 0.77%, respectively. RS percentage for Sarawak sago RS2, sago RS4 and Hi-Maize (HM) are 45.53 ± 0.24%, 60.66 ± 0.39% and 41.64 ± 0.89%, respectively. This starch modification (sago RS4) was aimed at increasing the RS content of the native starch. The scanning electron microscope (SEM) images of sago cross-linked dual RS4 and RS2 are shown in Supplemental material I. The HM starch is a commercial HiMaize RS2 starch (LifeSource Resistant Corn Starch 260). The assay for the RS content for these starches was conducted using Megazym RS assay kit (Megazym, UK) adopting AOAC methods 2002.02.
In vivo: One month treatment with sago RS and oral glucose tolerance test (OGTT) in GK rats
Healthy GK male rats aged 8 weeks with a mean body weight (b.wt) of 125.8 ± 8.8 g were purchased from Clea Japan, Inc. The GK rat is a lean model of T2D which develops mild hyperglycaemia early in life due to a defect in β-cell mass (Ostenson and Efendic, 2007). The animals were quarantined for 2 weeks and acclimatised for 5 days prior to start of the study. The animals were placed in individual ventilated cages, supplied with reverse osmosis drinking water (Sartorius, Germany) and a commercial rat pellet (Specialty Feeds, Australia), ad libitum with controlled temperature at (20 ± 2°C), 40–60% humidity under 12 h of light and dark cycle.
The rats reached 11 weeks during the start of the experiment with a mean b.wt of 237.6 ± 13.2 g. The rats were randomly assigned to four groups in individual cages (n = 8). Group 1: Control diabetic (CD) (Vehicle); Group 2: Positive control (HM) (0.07g/kg of b.wt)); Group 3: Treatment (sago RS2)(0.4 g/kg of b.wt); and Group 4: (sago RS4) (0.07g/kg of b.wt). The dosage given to the GK rats was based on the previous study (Robertson, 2012). Treatment was given to the rats once daily for a month by oral gavage. Parameters such as general behaviour, body weight changes, food and water intake were recorded. Fasting BG level for all rats were measured prior to glucose load (0.2 g/kg of b.wt) by tail pricks using a glucometer (Accu-Check Aviva Plus, Roche, USA). BG level was measured at 0, 30, 60, 90 and 120 min using a glucometer (Accu-Check Aviva Plus, Roche, USA). Blood was also collected for insulin content and analyte analysis (ghrelin, glucagon-like peptide (GLP-1) and glucagon) using enzyme-linked immunosorbent assay (ELISA) kit (Elabscience, China).
In vitro: Effects of sago RS on inhibitory activities
DPP-IV inhibition assay
DPP-IV activity was analysed using a DPP-IV inhibitor screening assay kit (Cayman Chemical, USA) which provided a fluorescence-based method for screening DPP-IV inhibitor. This assay was performed based on the standard protocol provided by the kit. The tests consist of 100% initial activity wells, background well (negative control), positive control (Sitagliptin) (100µM) and sago RS2 and RS4 at different concentrations (0.1, 1 and 10 mg/ml). The reagents used for this assay consist of the DPP Assay Buffer (1X) and DPP-IV (human recombinant) enzyme which were added accordingly based on the protocol. The reactions were initiated by adding DPP substrate containing H-Gly-Pro conjugated to amino methylcoumarin (AMC) (100 µM). This mixture was incubated at 37°C for 30 min and the absorbance in fluorescence was measured at excitation wavelength 355 nm and emission wavelength 460 nm using a BMG LABTECH 96 plate reader (Omega series). The DPP-IV IC50 values were determined by plotting the percentages of inhibition as a function of the concentration of test compound. The percentage inhibition was calculated using the following formula:
% Inhibition = [Initial activity – inhibitor α / Initial activity] x 100
α-glucosidase inhibition assay
The α-glucosidase inhibitory activity was done based on the α-glucosidase inhibitors screening kit (BioVision, USA). This assay was performed based on the standard protocol provided by the kit. RS2, RS4 and HM have been tested at different concentrations (0.1, 1 and 10 mg/ml). In a 96-well plate, the reaction mixture containing 80 µl α-glucosidase assay buffer, 10µl α-glucosidase and 10 µl of varying concentrations of samples were preincubated at room temperature for 15−20 min. The α-glucosidase activity was identified by measuring the absorbance at 410 nm in kinetic mode for 60 min at room temperature using a microplate reader (BioTek, USA). Acarbose was used as a positive control of α-glucosidase inhibitor. The results were expressed as relative enzyme activity percentage and calculated using the following formula:
% Relative Activity= Slope of (S)/Slope of (EC) x 100
Histopathology examination for pancreas, kidney and liver
A total of 36 slides consisting of 12 slides each of pancreas, liver and kidneys were examined by a Veterinary Pathologist at Faculty of Veterinary Medicine, University Putra Malaysia, Serdang. The samples were divided into control diabetic (CD), HM, sago RS2 and RS4. Each group consisted of three rats and each rat was presented with a section of pancreas and two sections each of liver and kidney. All organ sections were stained with haematoxylin and eosin (H&E). Examinations of the pancreas sections were focused on the islet of Langerhans, particularly on the appearance of the cells. The liver sections were examined for inflammatory, circulatory and hepatocyte changes while the kidneys were aimed at the changes in glomerulus and convoluted tubules.
The severity of pancreatic lesions is scored as 0 – no lesion (no significant changes in islets); (1) mild (less than 20% of the cells in the islets); (2) moderate (between 20% and 60% of the cells of the islets showed changes); and (3) severe (more than 60% of the islet cells shows degenerative or necrotic changes). The severity of liver and kidney lesions is scored as 0 – no lesion (absence of the lesion that is being described); (1) mild (presence of the lesion involving between 1% and 20% of the organ); 2-moderate (presence of the lesion involving between 21% and 60% of the organ); and (3) severe (presence of the lesion involving more than 60% of the organ).
Statistical analysis
For in vivo studies, the results were presented as mean ± SEM and the statistical analysis was performed using Kruskal–Wallis test, followed by Dunn's pairwise (different groups) and Wilcoxon (differences within same groups). For in vitro inhibitory assays, data were shown as mean ± SD and the statistical analysis was done using One-way ANOVA, followed by Tukey's test for post hoc analysis. For histology examination, statistical analysis was used to compare the severity of histopathological changes between the different groups. Results were presented as mean ± SD and Student’s t-test was used. The p-values<0.05 were considered to be statistically significant. All statistical analysis was done using SPSS 21.0.
Results
In vivo: One month treatment with sago RS using GK rats and OGTT
For mortality and morbidity clinical observations, rats were monitored closely throughout this study for any clinical toxicity signs such as piloerection, diarrhoea, alteration in locomotion, dull fur, emaciation, sedation, soft stool, urination or death. No toxicity signs were observed throughout the experiment. After 1 month, BG levels were significantly reduced when compared to CD at min 30 for sago RS2 (p < 0.01), min 60 for HM (p < 0.05) and sago RS4 (p < 0.001) and min 120 for HM (p < 0.05); sago RS2 and RS4 (p < 0.01) (Figure 1(a)). The iAUC for BG in the CD group was increased significantly after tretment (Figure 1(b)). The sago RS2 treated group showed a significant decrease in iAUC for glucose compared to before treatment (p < 0.05). No significant difference was reported for sago RS4 and HM. The iAUC for insulin was significantly increased by 3.7, 1.2 and 2- fold in HM, sago RS2 and RS4 groups, respectively (p < 0.05) (Figure 1(c)). Table 1 showed parameters recorded after 1 month treatment such as feed intake, water intake and body weight changes. No significant changes were observed between groups for feed and water intake. GK rats treated with both RS consumed lesser feed compared to CD. Sago RS2 group significantly showed the least body weight change (p < 0.01) followed by sago RS4 (p < 0.05), HM and CD.
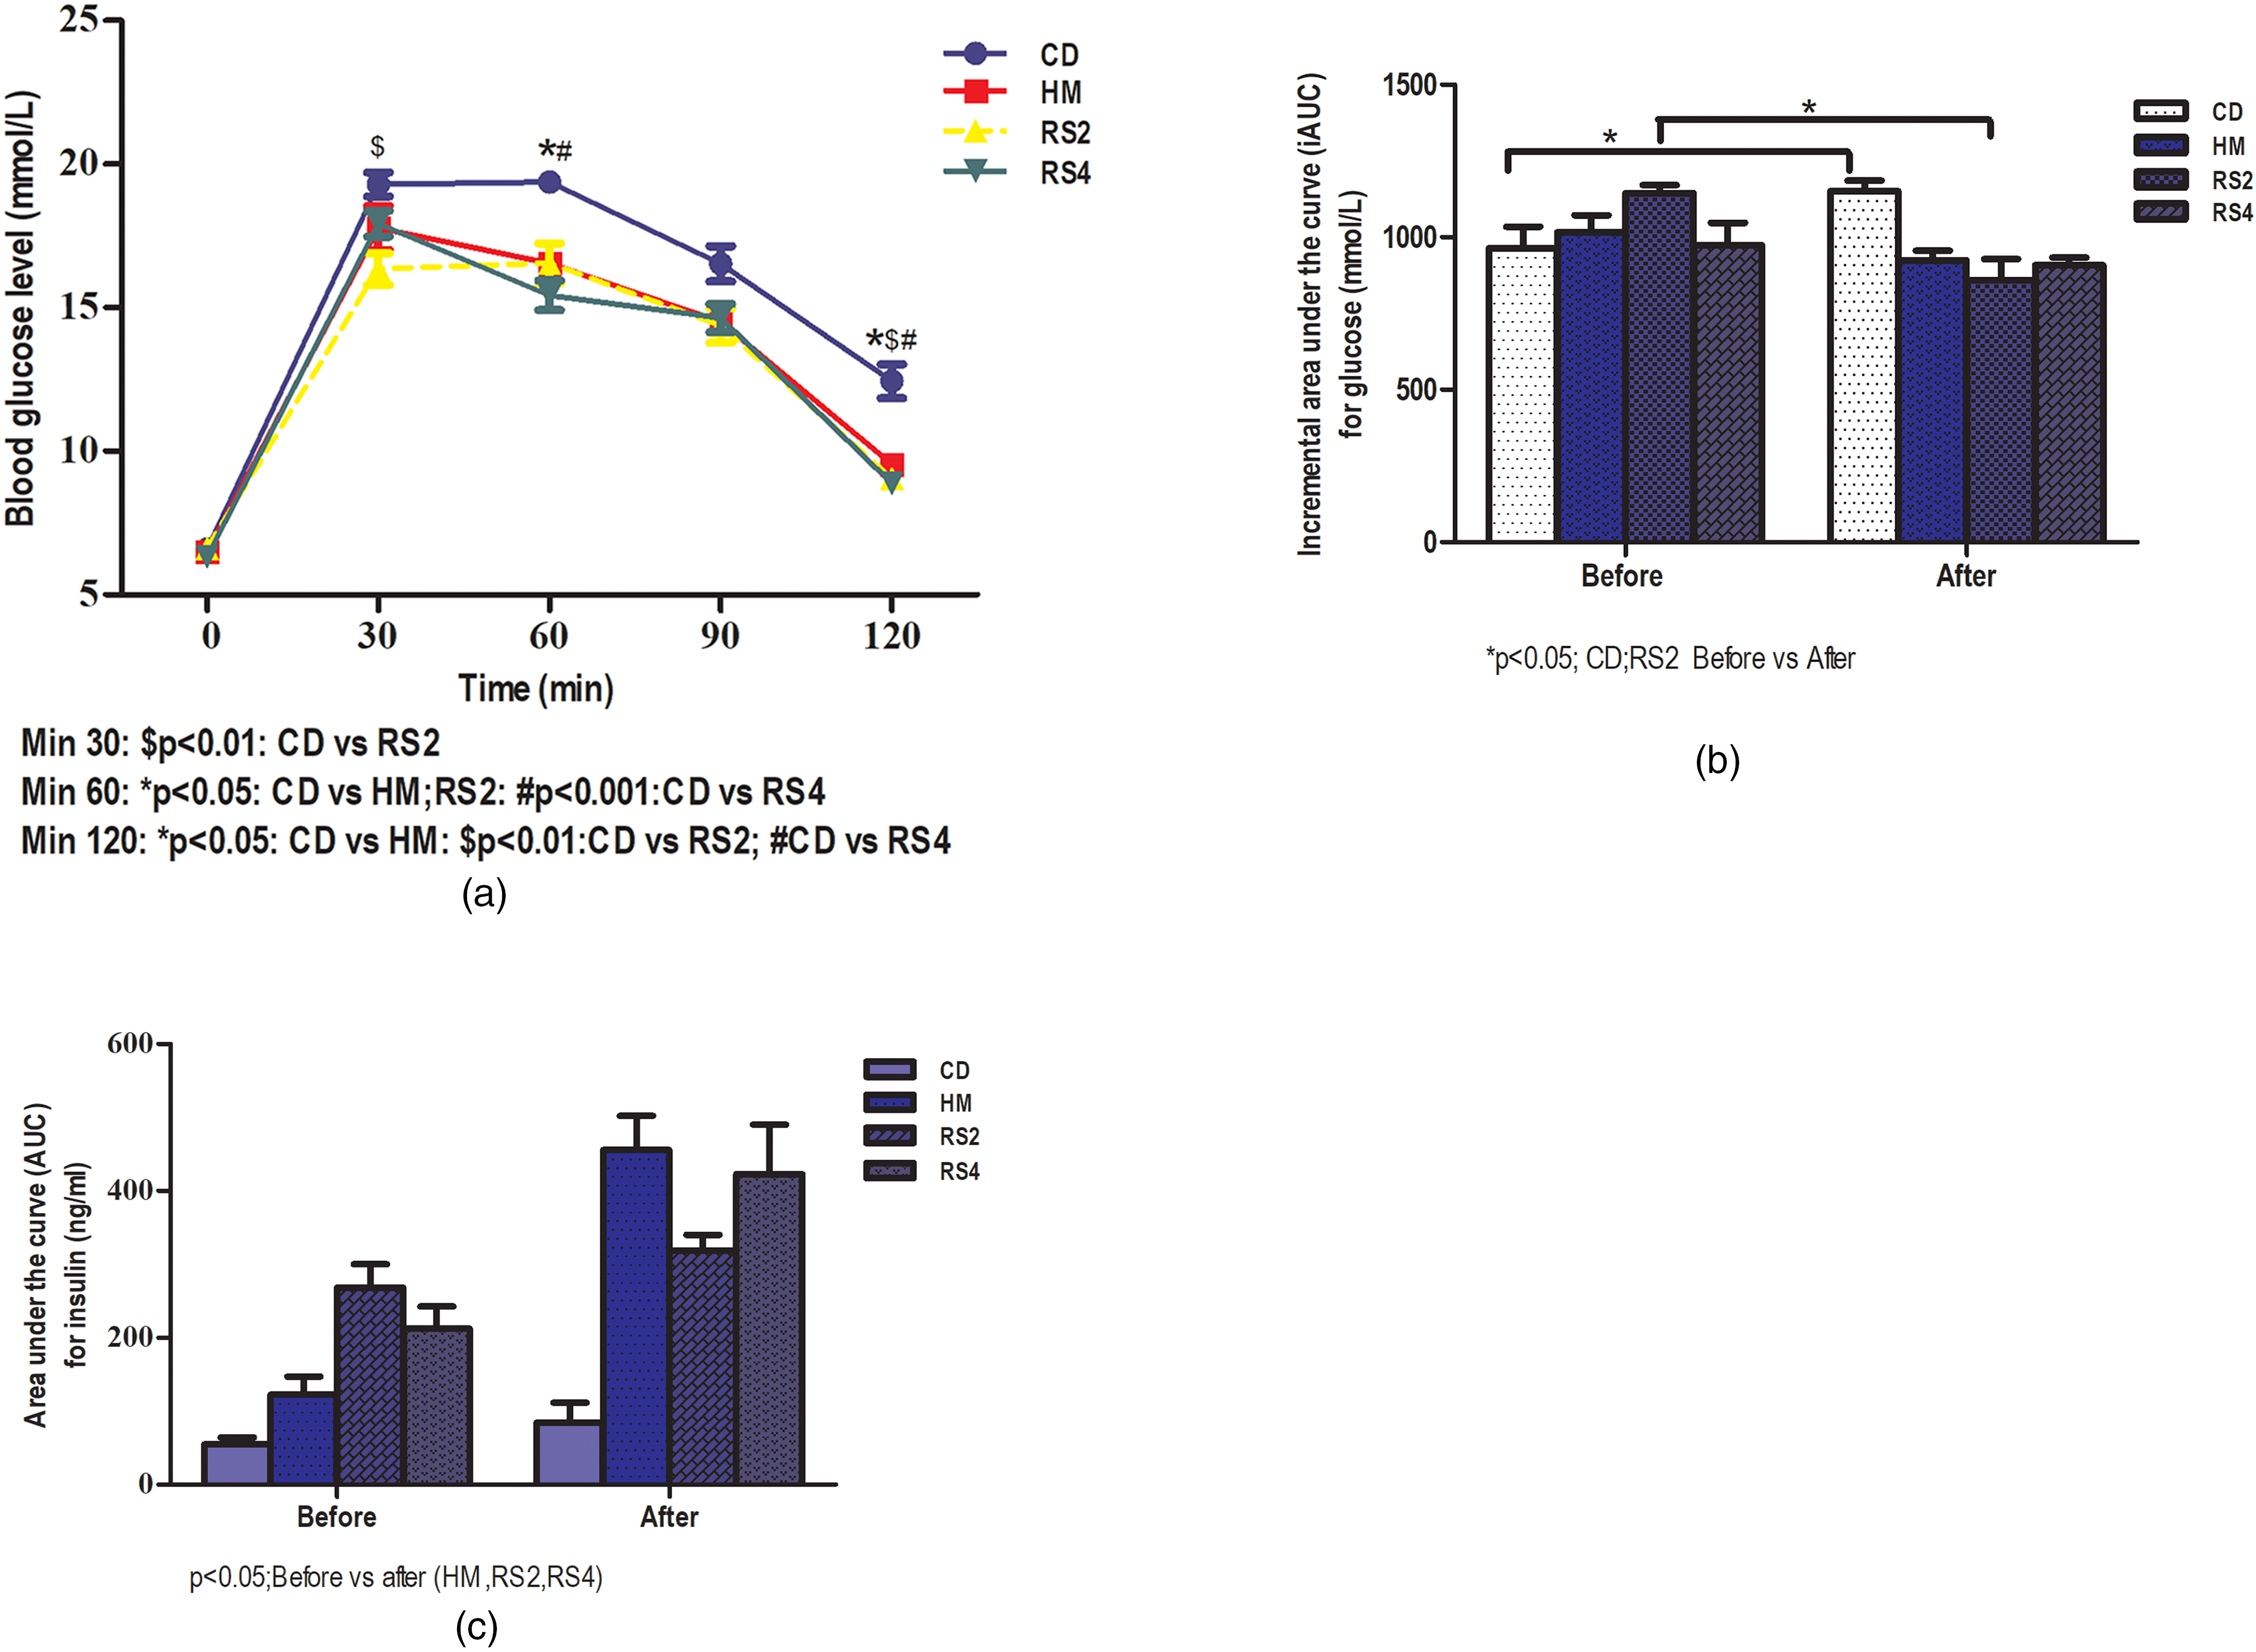
(a) Blood glucose (BG) levels during oral glucose tolerance test (OGTT) after 1 month treatment in Goto Kakizaki (GK) rat, (b) incremental area under curve (iAUC) for glucose before and after 1 month treatment in GK rat and (c) iAUC for insulin after 1 month treatment in GK rat. Results are indicated as mean ± SEM.
Parameters recorded after 1 month treatment in Goto Kakizaki (GK) rat.
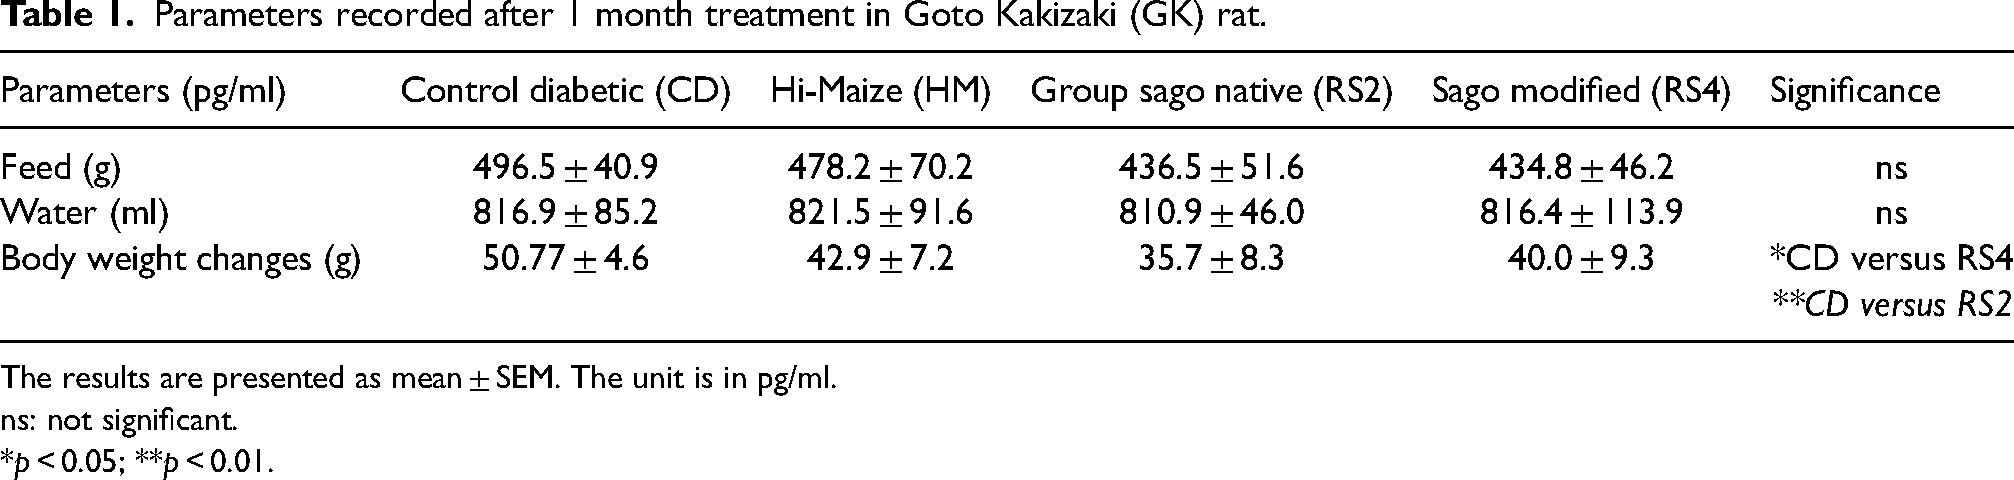
The results are presented as mean ± SEM. The unit is in pg/ml.
ns: not significant.
*p < 0.05; **p < 0.01.
A few hormones were measured using ELISA. GLP-1: GLP-1 level was significantly high (p < 0.05) in rats treated with sago RS2 (879.6 ± 117 pg/ml) when compared to control group (625.8 ± 65.6 pg/ml), followed by HM (37.2 ± 4.4 pg/ml) and sago RS4 (721.35 ± 164.1 pg/ml). Glucagon: No significant difference was observed for glucagon in all groups despite the high level shown in the sago RS2 group (44.7 ± 14.8 pg/ml). Ghrelin levels: Rats treated with sago RS4 showed the highest ghrelin level (25.6 ± 16.7 pg/ml) compared to control (15.1 ± 14pg/ml).
DPP-IV inhibition assay
Figure 2 showed the inhibitory effect of sago RS2 and RS4 on DPP-IV. The DPP-IV inhibitor plays an important role to improve glycaemic control (Pathak and Bridgeman, 2010). The results showed that RS2 at 1 and 10 mg/ml inhibited DPP-IV activity by 87.7 ± 9.7 and 82.3 ± 5.1% respectively. The RS4 only showed DPP-IV inhibitory activity at 10 mg/ml by 87.1 ± 8.9%, whereas HM did not show any inhibitory activity. The DPP-IV inhibitory activity by Sitagliptin at 100µM was 87.6 ± 11.2%. The IC50 values of sago RS2 and RS4 against DPP-IV were 0.2 and 5.9 mg/ml, respectively (Supplemental material II).
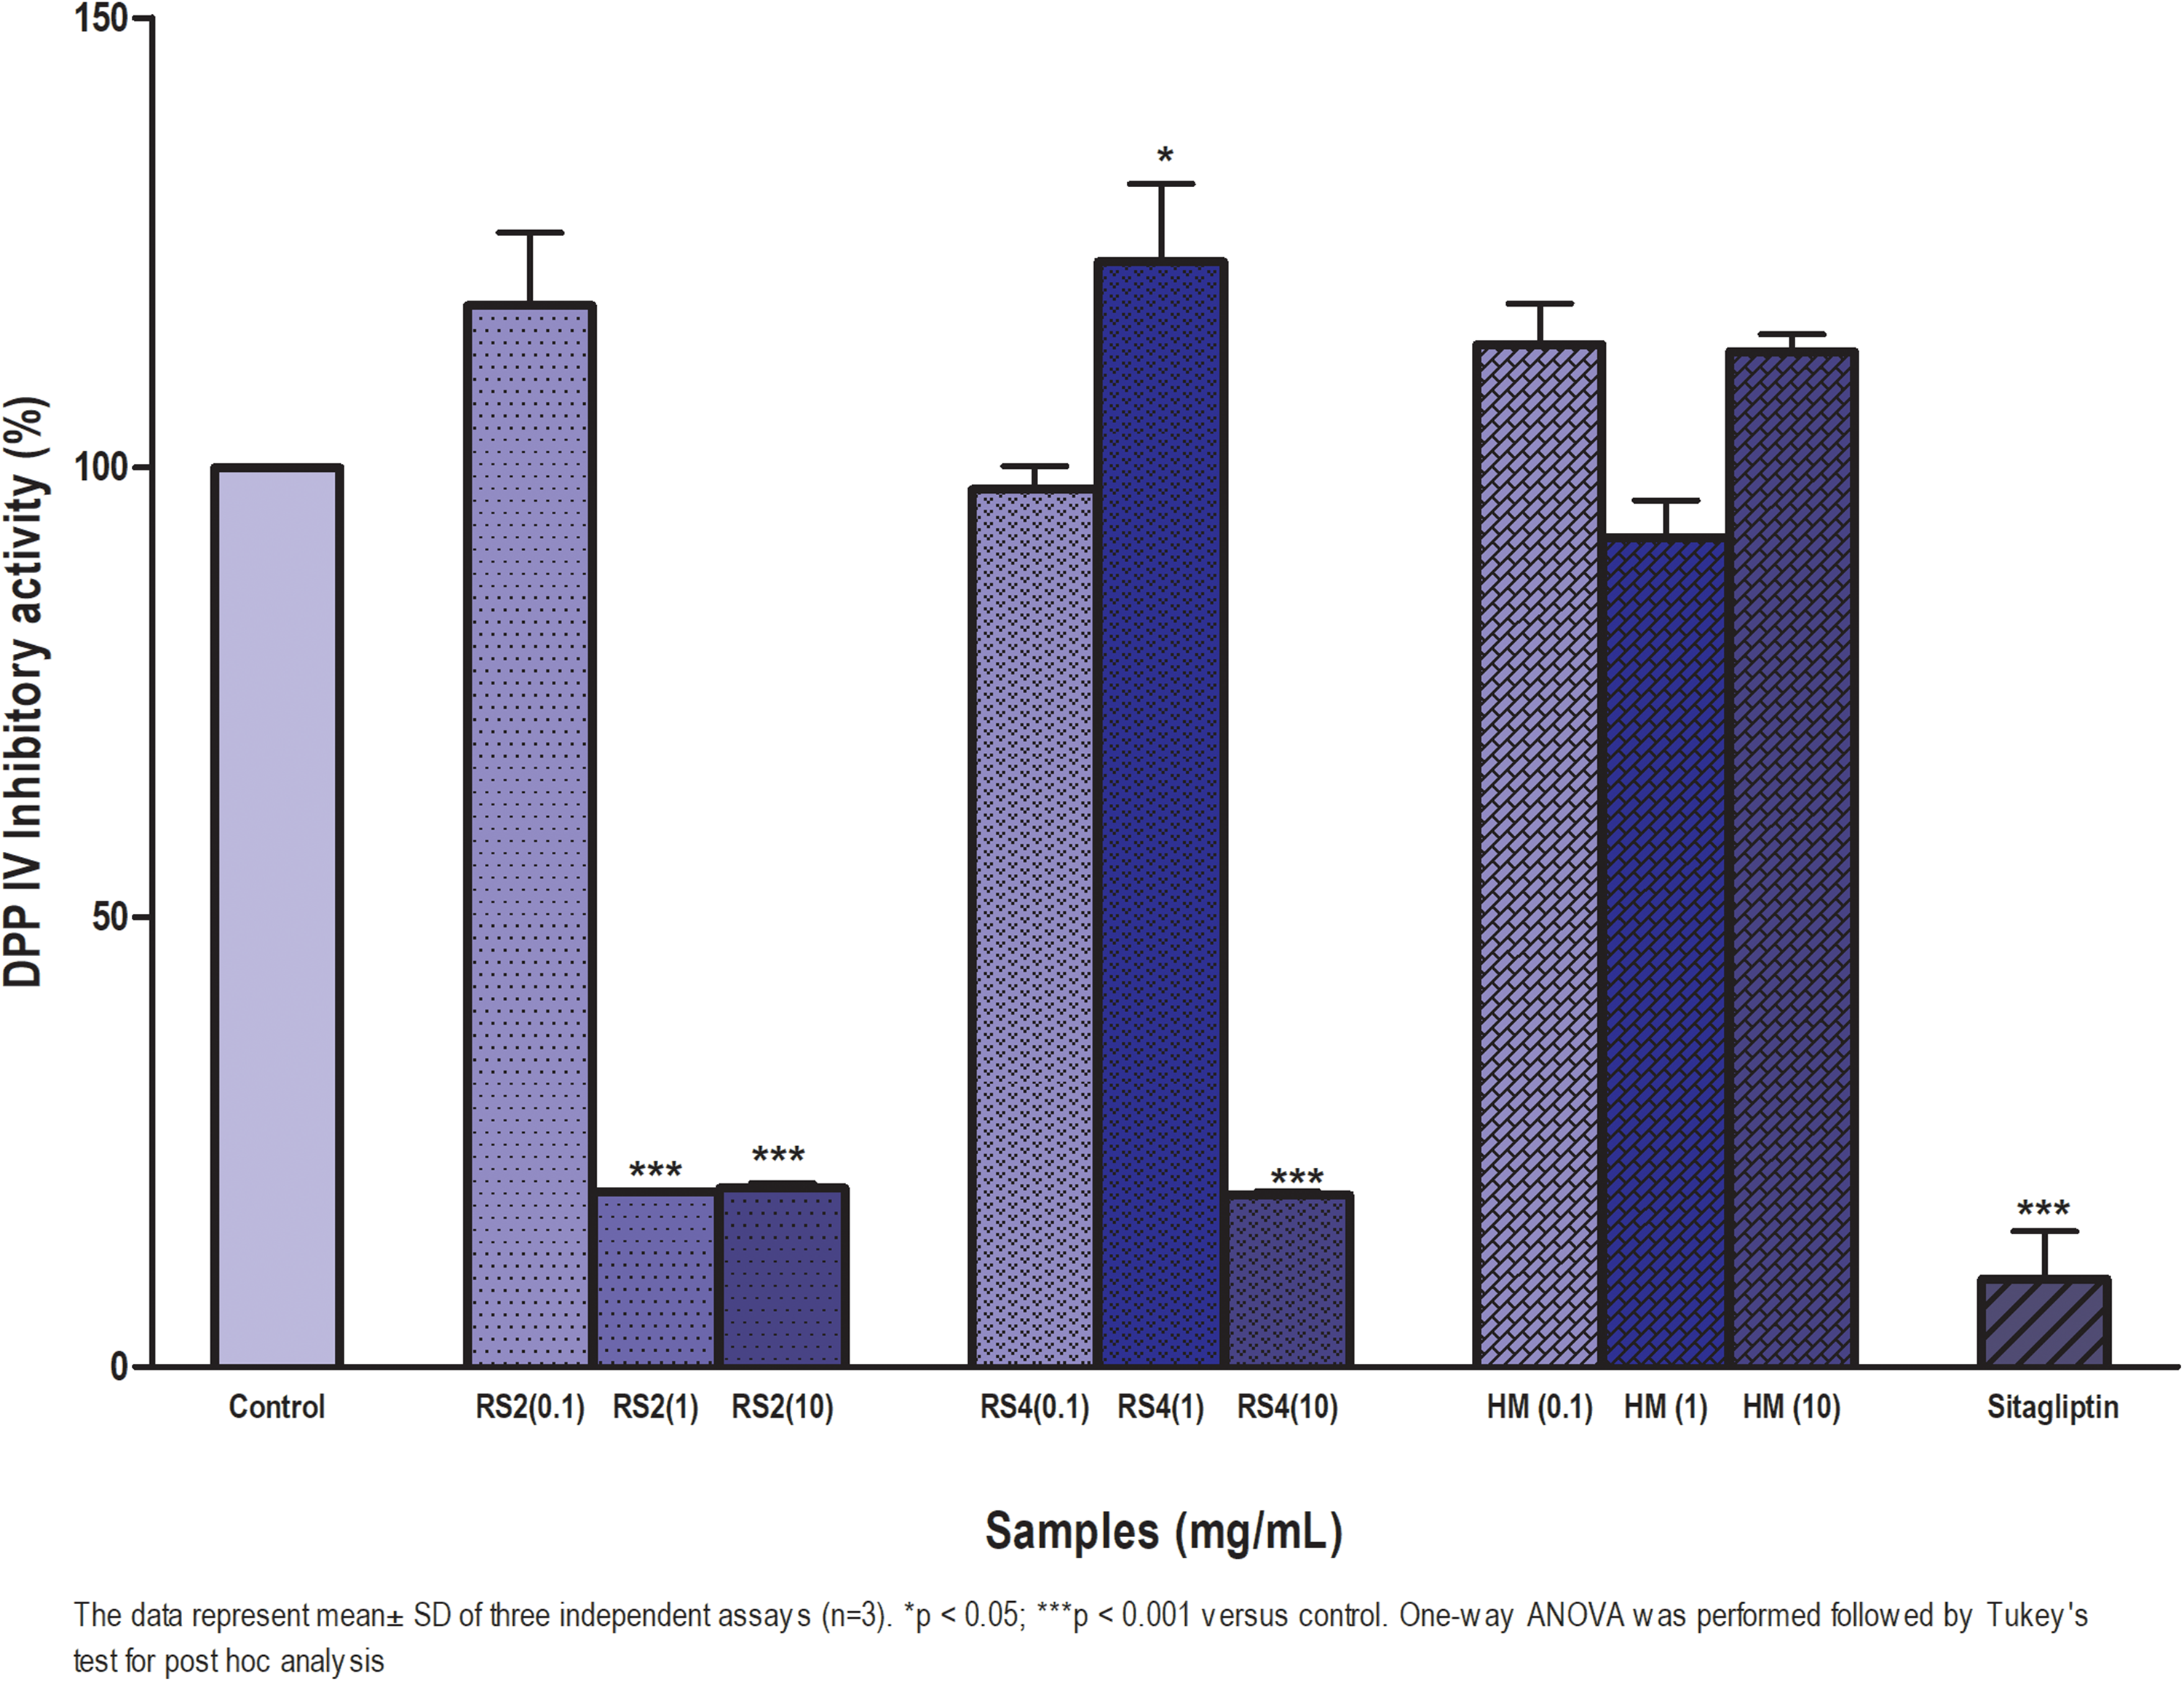
DPP-IV inhibitory activity of sago RS2, RS4 and HM at 0.1, 1, 10 mg/ml. DPP-IV enzyme as a control was set at 100%, and all the other values were normalised to this DPP-IV inhibitor control value, respectively. Sitagliptin was used as a positive control. Results are indicated as mean ± SD.
α-glucosidase inhibition assay
The in vitro α-glucosidase activity of sago RS2 and RS4 is shown in Figure 3. α-glucosidase reduces postprandial hyperglycaemia by delaying the process of carbohydrates hydrolysis and glucose absorption (Ouassou et al., 2018). The RS displayed inhibitory in a dose-dependent manner. At 10 mg/ml, RS2, RS4 and HM exhibited the highest α-glucosidase inhibitory activity at 93%, 95% and 97%, respectively. Acarbose showed complete inhibition against α-glucosidase. Sago RS4 exhibited the lowest IC50 which was 0.6 mg/ml compared to RS2 and HM while IC50 of Acarbose was calculated as 0.48 mg/ml (Supplemental material II).
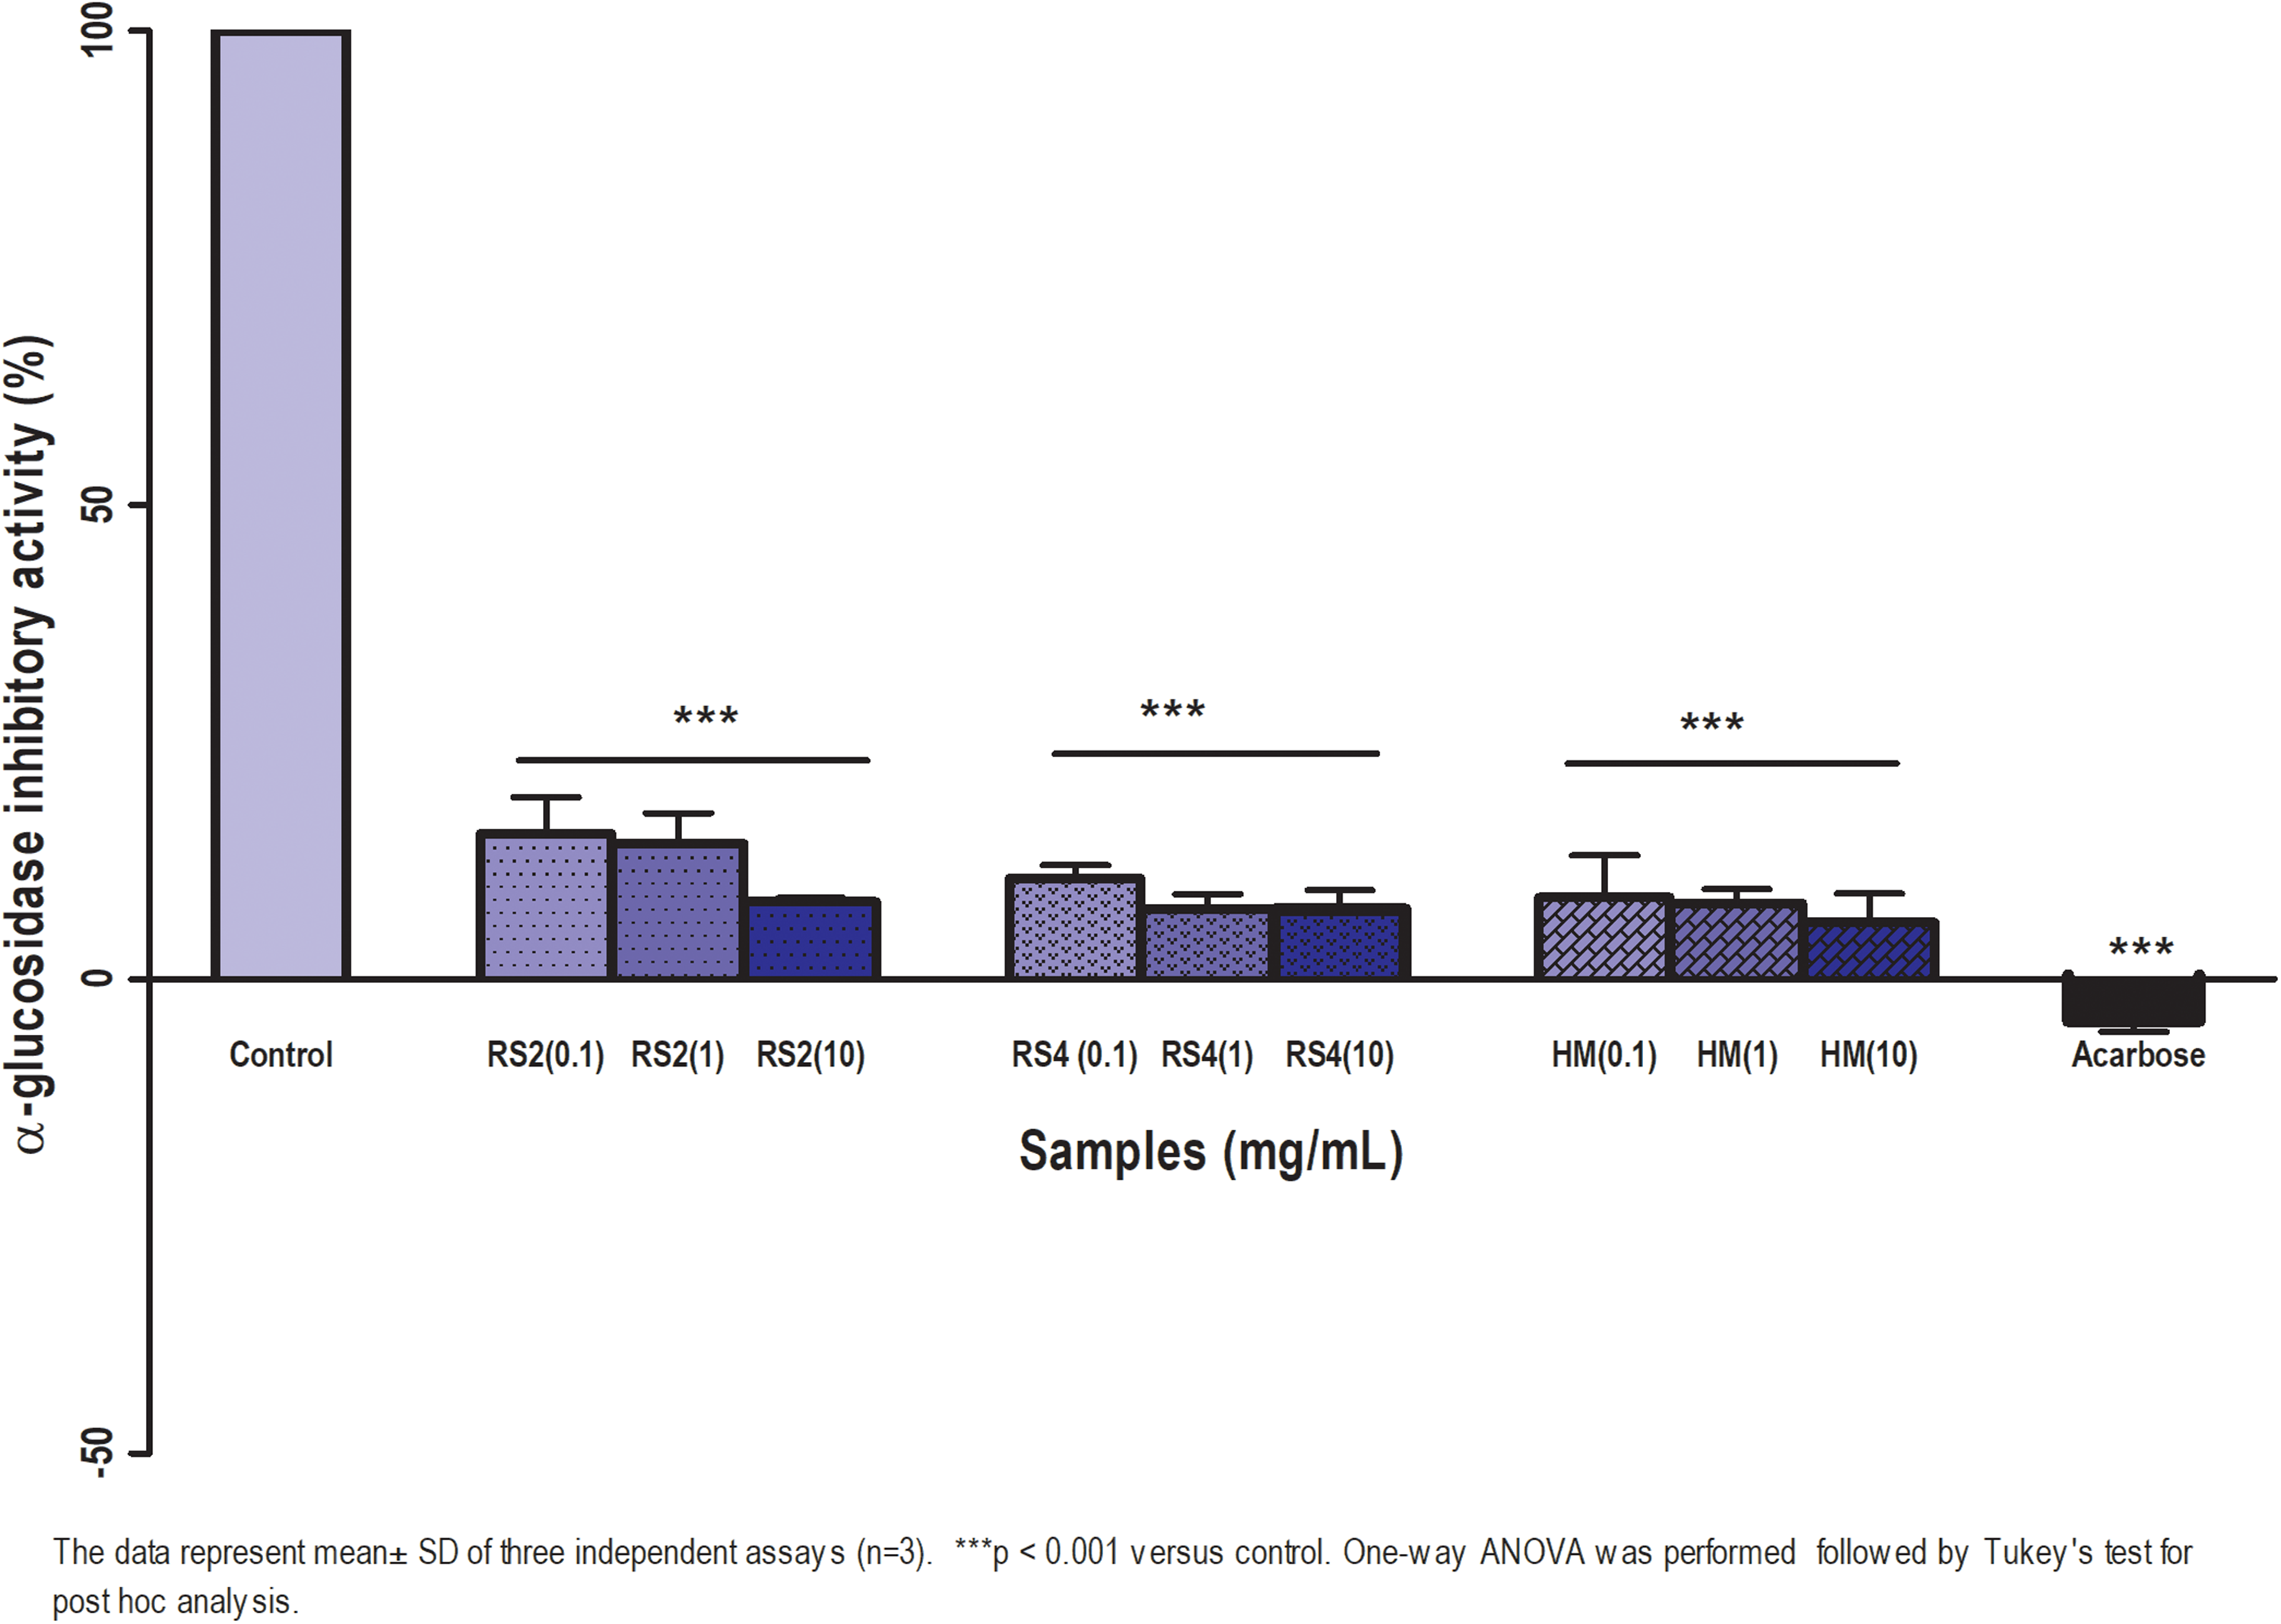
α-glucosidase inhibitory activity of sago RS2, RS4 and HM at 0.1, 1, 10 mg/ml. α-glucosidase as a control was set at 100%, and all the other values were normalised to this α-glucosidase inhibitor control value, respectively. Acarbose was used as a positive control. Results are indicated as mean ± SD.
Histopathology examination description and severity of lesions
Pancreas
The pancreas of CD group showed moderately congested blood vessels, occasionally with thrombus. (Supplemental material III). Many cells (about 50%) in the islets were showing pyknotic nuclei. The blood vessels of group sago RS2 were fairly normal (Supplemental material IV). An average of 20% of the cells was pyknotic. Sago RS4 showed relatively mild congestion of the blood vessels, occasionally with thrombus. All rats showed normal exocrine part of the pancreas
Liver
The liver sections of all groups showed various degrees of congestion and thrombosis in the blood vessels, particularly the minor blood vessels. All rats of CD group showed moderate congestion of blood vessels, especially the small vessels, some with thrombus. Many focal areas with hepatocytes appeared with eosinophilic cytoplasm and pyknotic nuclei (Supplemental material III). There were numerous foci of hepatitis with infiltration of mononuclear cells, particularly surrounding some small blood vessels (Supplemental material III). Approximately 40% of the hepatocytes showed these changes. Similarly, group HM showed moderate congestion of the small blood vessels, some with thrombus. Sago RS2 and RS4 showed slight congestion of small blood vessels with occasional foci of hepatitis around small blood vessels and bile ducts. Lesions of hepatitis and hepatocyte degeneration were significantly (p < 0.05) reduced in groups HM and both sago RS (Supplemental material V). Sago RS4 showed the least extensive hepatocytic degeneration although insignificant (p > 0.05). Both sago RS showed significantly (p < 0.05) less congestion of blood vessels compared to groups CD and HM.
Kidneys
Examinations of the kidneys were focused on the changes in glomerulus, convoluted tubules and blood vessels. In the CD group, between 50% and 70% of the glomeruli appeared moderately congested with moderately thickened mesangium and glomerular basement membrane (Supplemental material III). Most glomeruli of group HM appeared to be fairly normal with approximately 30% showing slightly thickened mesangium and basement membrane. Similarly, groups sago RS2 (Supplemental material III) and sago RS4 had fairly normal glomeruli. Most convoluted tubules appeared normal with 10–20% swollen, eosinophilic and pyknotic nuclei. Renal congestion appeared to be significantly (p < 0.05) more severe in CD group than other groups (Supplemental material VI). Similarly, CD group revealed most severe (p < 0.05) glomerular lesions than both sago RS while HM showed significantly (p < 0.05) least severe glomerular lesions. Group sago RS4 showed significantly (p < 0.05) least severe lesions in the convoluted tubules compared to groups HM and sago RS2 while CD group showed significantly (p < 0.05) most severe lesions.
Discussion
A month treatment with RS in the diabetic GK rat showed a significant reduction in the iAUC for glucose in the sago RS2 treated group. A similar trend was observed in the sago RS4 and HM groups but not significant. Sago RS2 seemed to show better effect in reducing BG when compared to sago RS4 despite its lower RS content and the precise mechanism of this action is unknown. Previous studies indicated that high dose of RS decreased the GI and thus tend to produce additional glucose-lowering benefits compared to the lower RS doses (Hoebler et al., 1999; Li et al., 2010; Ma, 2021). Our conflicting results therefore require further research. The iAUC for insulin in our study showed a significant increase in both RS and HM groups which may contribute to glucose-lowering effects in rats. Similar to a previous study, sago intake decreased BG in diabetic rats and was found to be associated with enhanced insulin production as well as improved insulin sensitivity, glucose inhibitiory activity in the intestine and improved short-chain fatty acids levels (Wahjuningsih et al., 2020).
RS resists digestion in the small intestine and is fermented in the large intestine instead, thus preventing BG spike (Yang et al., 2017). The BG lowering effect by RS mainly involve the digestion system enzymes by delaying glucose absorption (Patel et al., 2017), inhibiting carbohydrate digestion (Ahmed and Urooj, 2015) and slowing down gastric emptying (Pletsch and Hamaker, 2018). Thus, the mechanisms behind the BG lowering effects by both sago RS in the GK rat may be due to α-glucosidase inhibitory activity, which acts by preventing the digestion of starch and glucose release in the intestine (Kumar et al., 2011; Nakamura et al., 2014). In addition, the DPP-IV inhibitory effects as shown by both sago RS may contribute to BG reduction in the GK rat which acts by delaying gastric emptying, stimulating insulin release and reducing glucagon (Langley et al., 2007).
In principal, inhibition of the enzyme DPP-IV promotes the increased activity of incretin hormones including GLP-1 and glucose-dependent insulinotropic peptide (GIP), thereby regulate BG by stimulating insulin secretion and reducing postprandial concentrations of glucagon (Moore and Saudek, 2008). The BG lowering effect by RS mainly involves the digestive system. However, RS may act partly on insulin via GLP-1 activated by DPP-IV inhibitory activity. Our data showed that improved insulin release was observed in vivo in response to both sago RS. This is further supported by the increase of GLP-1 in sago RS2. The increase of DPP-IV inhibitory activity by RS may triggers GLP-1 level and promotes insulin release. GLP-1 plays an important role for BG regulation since the hormone improves insulin level and reduces glucagon (Zhang et al., 2019). DPP-IV inhibitory activity exerts its effects via satiety, improved beta-cell production and prevention of beta cells apoptosis (Langley et al., 2007). However, further study needs to be done to understand the relationship between DPP-IV inhibitory activity and insulin release by RS. Glucagon hormone, however, was not suppressed in response to RS when compared to the control group. A better understanding on DPP-IV inhibition affecting GLP-1 and glucagon hormones in response to sago RS should be further investigated.
Ghrelin which is an appetite-stimulating hormone (Alamri et al., 2016) showed the lowest level in sago RS2 group, which explained the low feed intake. In contrast, high level of ghrelin did not increase the overall feed intake in the sago RS4 group. Both sago RS intake showed a significant reduction in body weight compared to CD which could be due to lesser amount of feed and water intake during the study.
Histological examination of pancreas, liver and kidney between different treatments revealed tissue damage characterised by lesion severity. Defects in the cells of the islet of Langerhans are among the major lesions that lead to diabetes (Kahn et al., 2009). In this study, the defect was in the form of necrosis of the cells in which the cells appeared with small, compact, pyknotic nuclei. CD seemed to show the most severe lesion in the pancreas compared to the treated RS although insignificant. Wahjuningsih et al., 2020 reported that sago analogue rice diet could repair and increase the expression of pancreatic β-cell and although insignificant, our local RS seemed to have similar effects on the pancreatic islets tissue regenerations. Among the consequences of diabetes are hepatitis and degenerative changes of the hepatocytes in the liver (Mohamed et al., 2016) of affected animals and again, CD showed the most severe lesions. One of the most affected organs following diabetes is the kidneys which develop lesions in the glomeruli and convoluted tubules. Sago RS4 was the only group that showed significantly less severe changes in the convoluted tubules, indicating lesser effect of diabetes on the tubules of kidneys. In overall, both sago RS seemed to show lesser cell degeneration in the pancreas, liver and kidney tissues.
To our knowledge, our study is the first to provide and compare in vivo and in vitro findings on the efficacy of Malaysian local sago in regulating glucose in both native (RS2) and modified (RS4) forms. The underlying mechanisms by which sago RS2 and RS4 regulates BG via insulin sensitivity on peripheral tissues (muscle, liver adipocytes), insulin secretion, as well as the production of fermentation-related gases in the large bowel, should be further explored.
Conclusions
The RS2 from Sarawak sago palm consumption improved glucose tolerance in diabetic rats which indicates a preliminary proof on the health benefit in diabetes management and may be potentially developed as a functional ingredient or dietary supplement. The encouraging results justify further evaluation to be carried out in human T2D patients.
Supplemental Material
sj-docx-1-nah-10.1177_02601060231152060 - Supplemental material for Postprandial glucose-lowering effects by sago (Metroxylon sagu Rottb.) resistant starch in spontaneously type 2 diabetes, Goto-Kakizaki rat
Supplemental material, sj-docx-1-nah-10.1177_02601060231152060 for Postprandial glucose-lowering effects by sago (Metroxylon sagu Rottb.) resistant starch in spontaneously type 2 diabetes, Goto-Kakizaki rat by Ezarul Faradianna Lokman, Sal Hazreen Bugam and Aina Shafiza Ibrahim, Nurleyna Yunus, Fazliana Mansor, Vimala Balasubramaniam, Khairul Mirza Mohamad, Rabizah Md Lazim, Awang Zulfikar Rizal Awang Seruji in Nutrition and Health
Footnotes
Acknowledgements
The authors gratefully acknowledge the Sarawak State Government, the Management of CRAUN Research Sdn. Bhd., the Director General of Health, Malaysia, Director of the Institute for Medical Research and Ministry of Health Malaysia for permission to publish the findings of this study.
Author’s contribution
Ezarul Faradianna Lokman and Sal Hazreen Bugam – (concept and design, analysis and interpretation, data collection, writing the article, critical revision of the article, final approval of the article, statistical analysis, obtained funding and overall responsibility); Nurleyna Yunus – (concept and design, analysis and interpretation, data collection, critical revision of the article, final approval of the article, obtained funding and overall responsibility); Fazliana Mansor – (concept and design and final approval of the article); Vimala Balasubramaniam, Aina Shafiza Ibrahim and Awang Zulfikar Rizal Awang Seruji – (concept and design, analysis and interpretation, data collection, writing the article, critical revision of the article, final approval of the article, statistical analysis and overall responsibility); Khairul Mirza Mohamad and Rabizah Md Lazim – (data collection, final approval of the article and overall responsibility).
Declaration of conflicting interests
The authors declared the following potential conflicts of interest with respect to the research, authorship, and/or publication of this article: CRAUN Research is an agency entrusted by Sarawak State Government to spearhead the Sago Research in Sarawak. This project is a joint collaboration with the Institute for Medical Research (IMR) of which IMR has assumed full control on the technical conduct of the study.
Funding
The authors disclosed receipt of the following financial support for the research, authorship, and/or publication of this article: This work was supported by the CRAUN Research Sdn. Bhd. and National Institutes of Health Malaysia (grant numbers DTD-1.2.2 and NMRR-18-3353-45113; 19-013)
Ethical approval
Ethical approval for this study was obtained from the Animal Care and Use Committee, Ministry of Health Malaysia (ACUC/KKM/02(03/2018).
Consent for publication
We confirm that the manuscript has been read and approved by all named authors and that there are no other persons who satisfied the criteria for authorship but are not listed. We further confirm that the order of authors listed in the manuscript has been approved by all of us.
Availability of data and material
The study data used to support the findings are kept by the project team of Downstream Technology Division, CRAUN Research Sdn. Bhd., Sarawak and Endocrine and Metabolic Unit, Institute for Medical Research, Selangor and requests for data will be considered by the data centre.
Supplemental material
Supplemental material for this article is available online.
References
Supplementary Material
Please find the following supplemental material available below.
For Open Access articles published under a Creative Commons License, all supplemental material carries the same license as the article it is associated with.
For non-Open Access articles published, all supplemental material carries a non-exclusive license, and permission requests for re-use of supplemental material or any part of supplemental material shall be sent directly to the copyright owner as specified in the copyright notice associated with the article.