
Abstract
Background
Anaemia is a serious global public health problem with high prevalence (>40%) in children particularly in low- and middle-income countries including Namibia with a current 46.1% prevalence rate.
Aim
This study was aimed at examining the sociodemographic factors influencing the occurrence of childhood anaemia levels in Namibia.
Method
A multivariate ordinal regression model was applied to statistically identify potential sociodemographic factors associated with anaemia levels among children under-5 years old using data collected from the 2013 NDHS.
Results
The odds of having mild anaemia level was lower for sociodemographic characteristics such as mother's age, total children ever born, health insurance coverage, child's residency, child's age and main language spoken at home. The odds of having moderate anaemia level was higher for characteristics such as mother's age, place of residence, highest education level and child's diarrhoea status, while it was lower for characteristics such as age of head of household, total children ever born, health insurance coverage and sex of child. Similarly, the odds of having severe anaemia level was higher for characteristics such as region, place of residence, highest education level, number of household members, wealth index, health insurance coverage, child's residency and child's diarrhoea status, while it was lower for characteristics such as total children ever born and sex of child.
Conclusion
It is therefore recommended that the policies and practices concerning anaemia diagnosis, treatment and prevention in the country be substantially revised by policy-makers, starting with the known prevalent causes and identified sociodemographic factors from this study.
Introduction
Anaemia is a deficiency in the number or quality of red blood cells (haemoglobin) in the body. To be precise, it is a disease in which the number of red blood cells or the haemoglobin concentration within them is lower than normal, with haemoglobin needed to carry oxygen around the body (World Health Organization [WHO], 2022a). If there are too few or abnormal red blood cells, or not enough haemoglobin in the body, there will be a decreased capacity of the blood to carry oxygen to the body's tissues which could result in symptoms such as fatigue, weakness, headache, pale or yellowish skin, irregular heartbeats, chest pain, dizziness and shortness of breath, among others. According to WHO (2022a), anaemia can be caused by (excessive) blood loss, lack of red blood cell production, and high rates of red blood cell destruction, with children and pregnant women most vulnerable to it at an increased risk of maternal and child mortality. It is also a serious health problem that usually results from poor nutrition, infection or chronic disease. As an indicator of both poor nutrition and poor health, anaemia can impact other global nutritional concerns such as stunting and wasting, low birth weight, childhood overweight and obesity due to lack of energy to exercise, and reduced school performance in children and work productivity in adults which could have further social and economic impacts for the individual and their families (WHO, 2022a). Anaemia can be temporary or long term (chronic) and can range from mild to severe based on the concentrations of haemoglobin in the blood. Mild anaemia corresponds to a level of haemoglobin concentration of 10.0–10.9 g/dl for pregnant women and children under the age of 5 years, moderate anaemia corresponds to a level of 7.0–9.9 g/dl, while severe anaemia corresponds to a level less than 7.0 g/dl (Kariyeva et al., 2002). The mild classification can be easily treated, while the moderate to severe classifications can cause potentially serious health complications and even fatality.
Anaemia is a serious global public health problem associated with increased morbidity and mortality that particularly affects young children and pregnant women, with high prevalence particularly in low- and middle-income countries (WHO, 2022a). It is estimated by WHO that about 42% of under-5 children and 40% of pregnant women worldwide were anaemic. In 2019, it was estimated that anaemia affected more than 1.74 billion people around the world, with children, women and people with chronic diseases such as cancer having a higher risk of developing anaemia (Lights and Seladi-Schulman, 2021), while as of 2021, it was estimated to have affected more than two billion people globally (Cleveland Clinic, 2022). The prevalence of anaemia among children varies widely across the regions of the world. In the United States, the highest prevalence of 18.2% among children aged 12 to 17 months were recorded in low-income families in 2011 (Wang, 2016), while in North-Eastern states of India, about 53% of the children were estimated to be anaemic (Dey and Raheem, 2016). Among the WHO regions, around 60% of African children below five years of age had anaemia (Simo et al., 2019), followed by 48% in South-East Asia (Turawa et al., 2021), while a high prevalence of anaemia was reported among children under 5 years old in Central and South Asia, as well as in the Sub-Saharan Africa regions, where some countries like Ghana and Burkina Faso reported an anaemia prevalence of over 70% in the general population (Ntenda et al., 2018; Semedo et al., 2014; Shimanda et al., 2020; Simo et al., 2019; Stevens et al., 2013). The highest prevalence statistics in Africa can be attributed to the high level of poverty and inadequate household food security which is exacerbated by the high burden of the Human Immunodeficiency Virus (HIV) infection, poor nutrition knowledge and inappropriate feeding practices (WHO, 2014). According to the 2020–2021 annual report of the Southern African Development Community (SADC), SADC is one of the regions vulnerable to anaemia, with an estimated 59% prevalence in children under 5 years old in Tanzania (Sunguya et al., 2020), followed by 54% in Mozambique (SADC Secretariat, 2020). In Namibia, the anaemia prevalence among children under 5 years of age was 47.7% in 2000, followed by 46.2% and 46.1% in 2011 and 2019 respectively (The World Bank Group, 2022). According to the WHO criteria, anaemia prevalence above 40% in a population, as is the case in Namibia, is regarded a severe public health problem, causing about a 2.5% reduction in adult wages and elevated medical expenses in the country (World Bank, 2016).
Moreover, various studies have shown varying results regarding the contributing factors of childhood anaemia such as micronutrient deficiencies, acute and chronic inflammation, inherited or acquired disorders that affect red blood cells production or survival as well as nutritional and pathological factors. Other factors such as the maternal, household and community characteristics as well as the child's age, sex, place of residence, maternal education and household wealth status have also been demonstrated to have an impact on childhood anaemia (Ntenda et al., 2018; Shimanda et al., 2020). Analogous to the 1990's United Nations International Children's Emergency Fund (UNICEF) theoretical framework for the causes of undernutrition in developing countries, Siekmans et al. (2014) proposed that a combination of immediate, underlying and basic causes interact to cause childhood anaemia as shown in Figure 1.
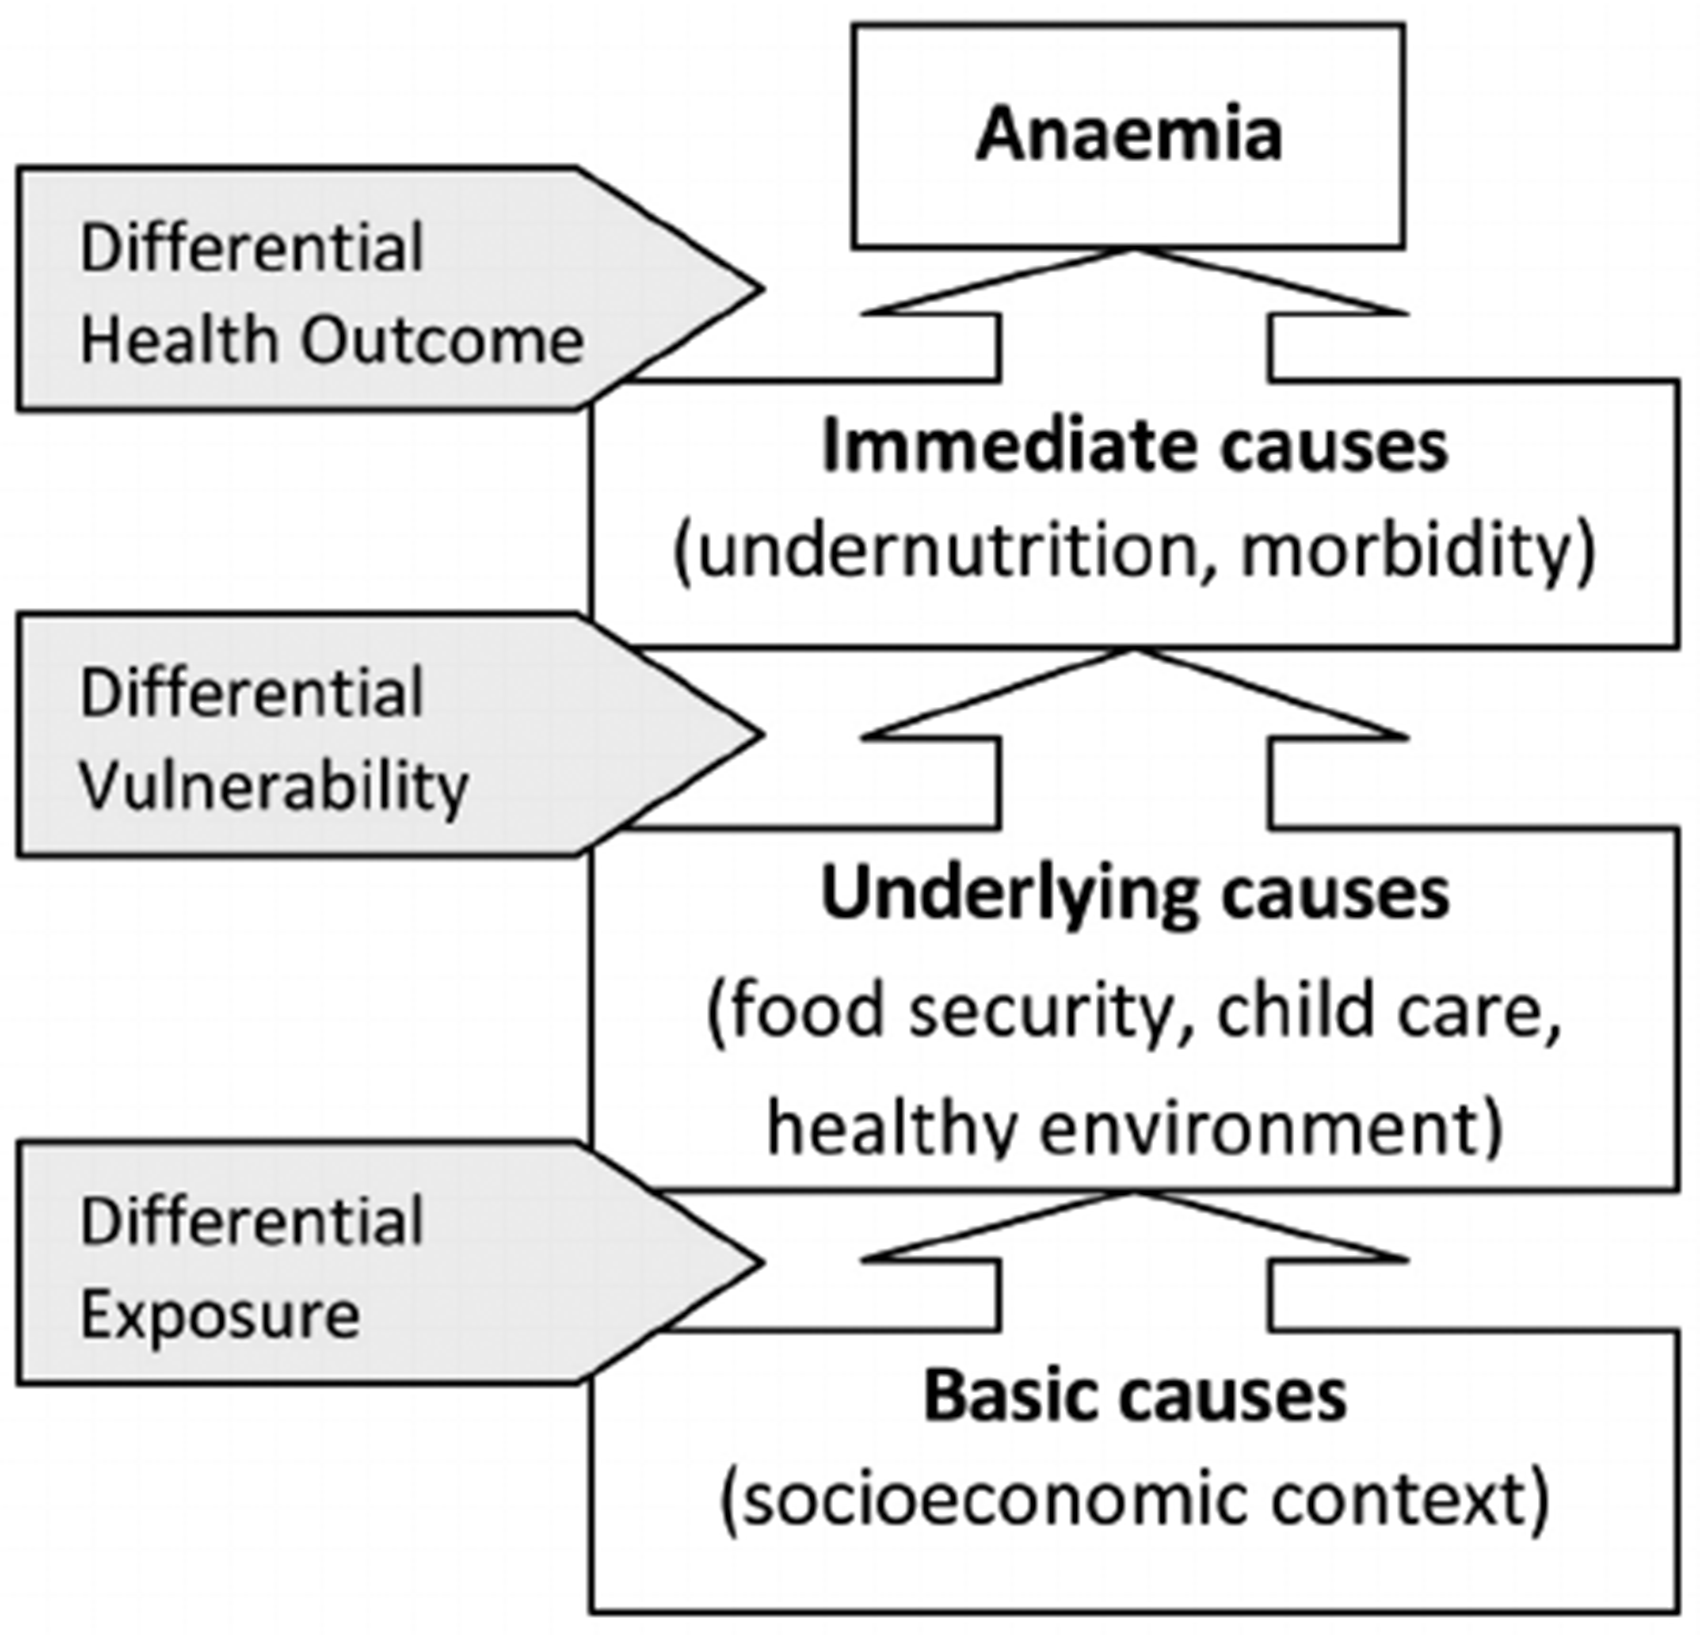
Conceptual model for the causes of child anaemia (extracted from Siekmans et al., 2014).
However, not much is known about the association between socioeconomic and demographic factors and childhood anaemia levels in Namibia. Although anaemia can be treated and preventable, especially the mild ones, it can also be serious and life-threatening as well as fatal. The most common approaches for anaemia prevention include: (i) iron supplementation by tablets, (ii) dietary supplementation, (iii) food fortification and (iv) blood transfusion for severe cases (Shimanda et al., 2020). A simple and low-cost way to achieve these prevention approaches is by eating a healthy, varied diet. That is, a diet with enough foods that provide iron and these vitamins, along with vitamin C food sources to help with the absorption and drinking of enough (clean) water to keep haemoglobin levels up. However, many of these simple and low-cost interventions are far beyond the reach of many households in developing countries, and Namibia is not an exception to this. Furthermore, quite a few studies have been carried out to evaluate and identify factors of anaemia as a whole in Namibia. However, factors contributing and influencing each level of anaemia, especially among under-5 children, still need to be sufficiently explored in the country, with Namibia having a 46.1% prevalence rate among children under 5 years of age. For these reasons, the main aim of this study was to identify the sociodemographic factors influencing the occurrence of childhood anaemia levels among children under 5 years old in Namibia. Identifying these causative factors can ensure effective management and treatment. Thus, findings from this study can provide useful insights for evidence-based health policies and programmes on childhood anaemia among children in the country, thereby further aiding in the effective allocation and utilisation of public health programs and resources in the prevention of childhood anaemia among children within the country.
Methods
Study design and data collection
This study followed a quantitative cross-sectional study design using data obtained from the 2013 Namibia Demographic and Health Survey (NDHS). The Demographic and Health Survey (DHS), funded by the United States Agency for International Development, is part of the worldwide measure DHS programs designed to collect information on fertility, family planning, infant and child mortality, maternal and child health, nutrition, domestic violence and other noncommunicable diseases (Ministry of Health and Social Services [MoHSS] and ICF International, 2014). The 2013 NDHS is the fourth & latest comprehensive, national-level population and health survey conducted in Namibia in collaboration with MoHSS as part of the global DHS programme, with the study initiated in April 2012 and the data collection aspect carried out from May to September 2013 (MoHSS and ICF International, 2014). Furthermore, the 2013 NDHS data were obtained after the author of this study completed the mandatory user's agreement of the DHS program online, via the DHS website. No separate permission was required for the DHS data usage and resulting study publications.
Study population and sampling strategy
The sampling design used in the 2013 NDHS was a stratified sampling design selected in two stages for all the then 13 administrative regions in Namibia. This was done to ensure that the 2013 NDHS provides estimates of most key variables for all the then 13 administrative regions in Namibia. In the first stage, 554 enumeration areas (269 in urban areas and 285 in rural areas) were selected with a stratified probability proportional to size selection from the sampling frame (MoHSS and ICF International, 2014). The size of an enumeration area was ‘defined according to the number of households residing in the enumeration area, as recorded in the 2011 population and housing census of Namibia. Stratification was achieved by separating each region into urban and rural areas, resulting into 26 sampling strata (13 rural strata and 13 urban strata). Samples were later selected independently in every stratum, with a predetermined number of enumeration areas selected’ (MoHSS and ICF International, 2014). In the second stage, a fixed number of 20 households were selected in every urban and rural cluster according to equal probability systematic sampling (MoHSS and ICF International, 2014). More detailed information about the sampling methods and the entire survey can be found in the 2013/14 NDHS report, freely available online on the DHS website. The inclusion criteria for this study were all children under 5 years old whose mothers participated and provided information for them in the 2013 NDHS, while children with incomplete, non-response or missing information were excluded from this study. The individual children considered in this study were identified from the NDHS as per the inclusion criteria for this study.
Statistical analysis
Pearson's chi-square test was performed to examine the association between the sociodemographic characteristics and childhood anaemia levels among children under 5 years old. The sociodemographic characteristics considered in this study were the household wealth index status of household, the mother's age group, region, type of place of residence, highest educational level, number of household members, age of household head, type of cooking fuel used in the household, total children ever born, mother covered by health insurance, mother's occupation, sex of child, child's residency, diarrhoea status of the child, child's age in months and main language spoken at home. The wealth index status of a household interviewed in the 2013 NDHS was a composite measure of the household's cumulative living standard, calculated using the household's ownership of selected assets such as televisions, bicycles/vehicles, materials used for housing construction, as well as dwelling characteristics such as source of drinking water, sanitation facilities, type of flooring materials, types of water access and sanitation facilities. Considering the urban–rural differences in these items and characteristics, the wealth index status was created in three steps. First, a subset of indicators common to urban and rural areas was used to create wealth scores for households in both areas, then using principal component analysis, separate factor scores were produced for households in urban and rural areas using area-specific indicators. Afterwards, the separate area-specific factor scores were combined to produce a nationally applicable combined wealth index by adjusting area-specific scores through a regression on the common factor scores (MoHSS and ICF International, 2014). The resulting combined wealth index had a mean of 0 and a standard deviation of 1 and each household was rated from poorest to richest in the NDHS. The ratings of these households as captured in the NDHS data were used to determine the wealth index status of the households in this study. More detailed information about the construction of the wealth index for the households interviewed and the remaining sociodemographic characteristics considered in this study can be found in the 2013/14 NDHS report, freely available online on the DHS website.
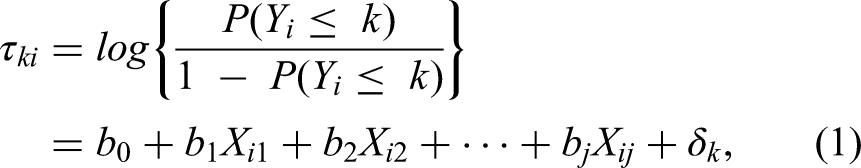
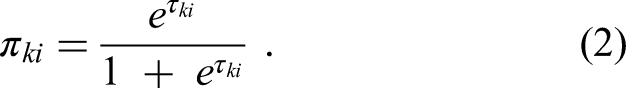
Moreover, during the 2013 NDHS period, each child was subjected to an anaemia test, after consent to perform the test was obtained from their mother, in order to determine their anaemia level. The obtained results were later tabulated under the “Anemia level” variables in the NDHS data. The responses under these variables as captured in the NDHS data were used to determine the children's anaemia category in this study. More detailed information about these “Anemia level” variables can be found in the 2013/14 NDHS report. Considering the ordinal polytomous nature of the childhood anaemia levels (mild, moderate, severe and non-anaemic), a multivariate ordinal regression model was applied to statistically identify their influencing sociodemographic factors. Let
Ethical considerations
As this study was a secondary data analysis of publicly accessible survey data from the DHS program, it did not require ethical approval and participant consent. The 2013 NDHS data that was used in this study is freely available on a public domain and downloadable from the DHS website, after the completion of a user's agreement and the granting of access by the United States Agency for International Development. No separate permission is required for data usage and publication. Additionally, this study followed all ethical standards for research without direct contact with human subjects as there were no names of persons or household addresses recorded in the DHS data.
Results
A total of 2427 children under 5 years old were considered, out of which 570 (23.49%) were mildly anaemic, 452 (18.62%) were moderately anaemic while 19 (0.78%) were severely anaemic as shown in Table 1. Out of the 1041 children who were anaemic, majority were male children aged 13 – 24 months old, living with their mothers, had no diarrhoea and living in household that cooks with woods. Additionally, majority were from unemployed mothers who were aged 20–24 years old, had secondary education, up to 2 children born, lived in a poorest wealth index household with 6 to 8 members headed by a 30–39-years-old person in rural areas, in the Kavango region, with no health insurance coverage and spoke Oshiwambo as their main language in their home. Furthermore, from Table 1, at a 5% level of significance, mother's age (p-value = 0.003), region (p-value < 0.001), type of place of residence (p-value < 0.001), highest educational level (p-value = 0.001), number of household members (p-value < 0.001), age of household head (p-value = 0.021), type of cooking fuel used in the household (p-value = 0.001), wealth index status of household (p-value < 0.001), total children ever born (p-value = 0.006), mother covered by health insurance (p-value < 0.001), mother's occupation (p-value = 0.048), sex of child (p-value = 0.019), child's residency (p-value < 0.001), diarrhoea status of the child (p-value < 0.001), child's age (p-value < 0.001) and main language spoken at home (p-value < 0.001) can be concluded to have a significant association with childhood anaemia levels. Table 2 shows the subsequent results obtained from the fitted multivariate ordinal regression model.
Percent Distribution of Sociodemographic Characteristics and Anaemia Levels.
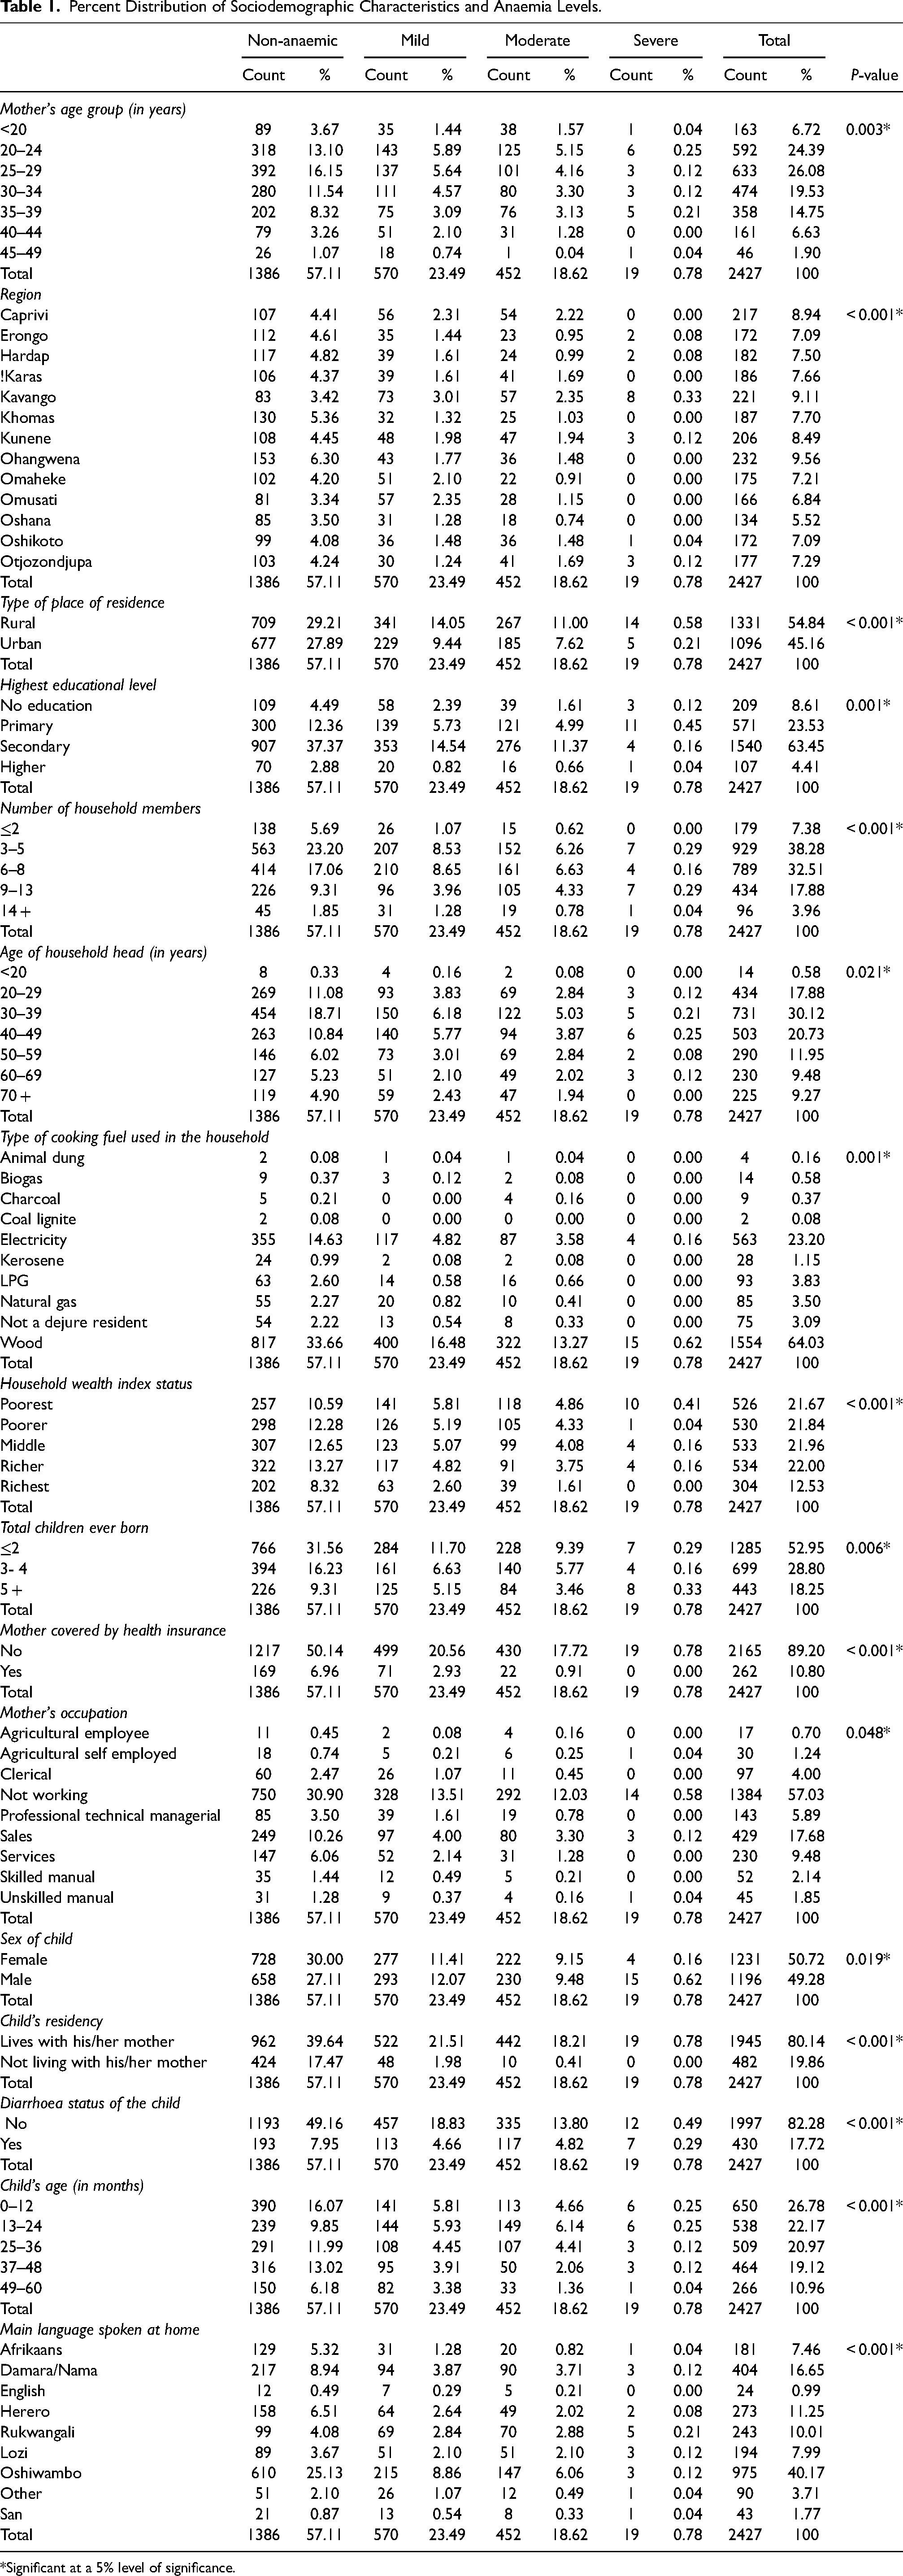
*Significant at a 5% level of significance.
Output From the Fitted Ordinal Regression Model of Sociodemographic Characteristics and Anaemia Levels.
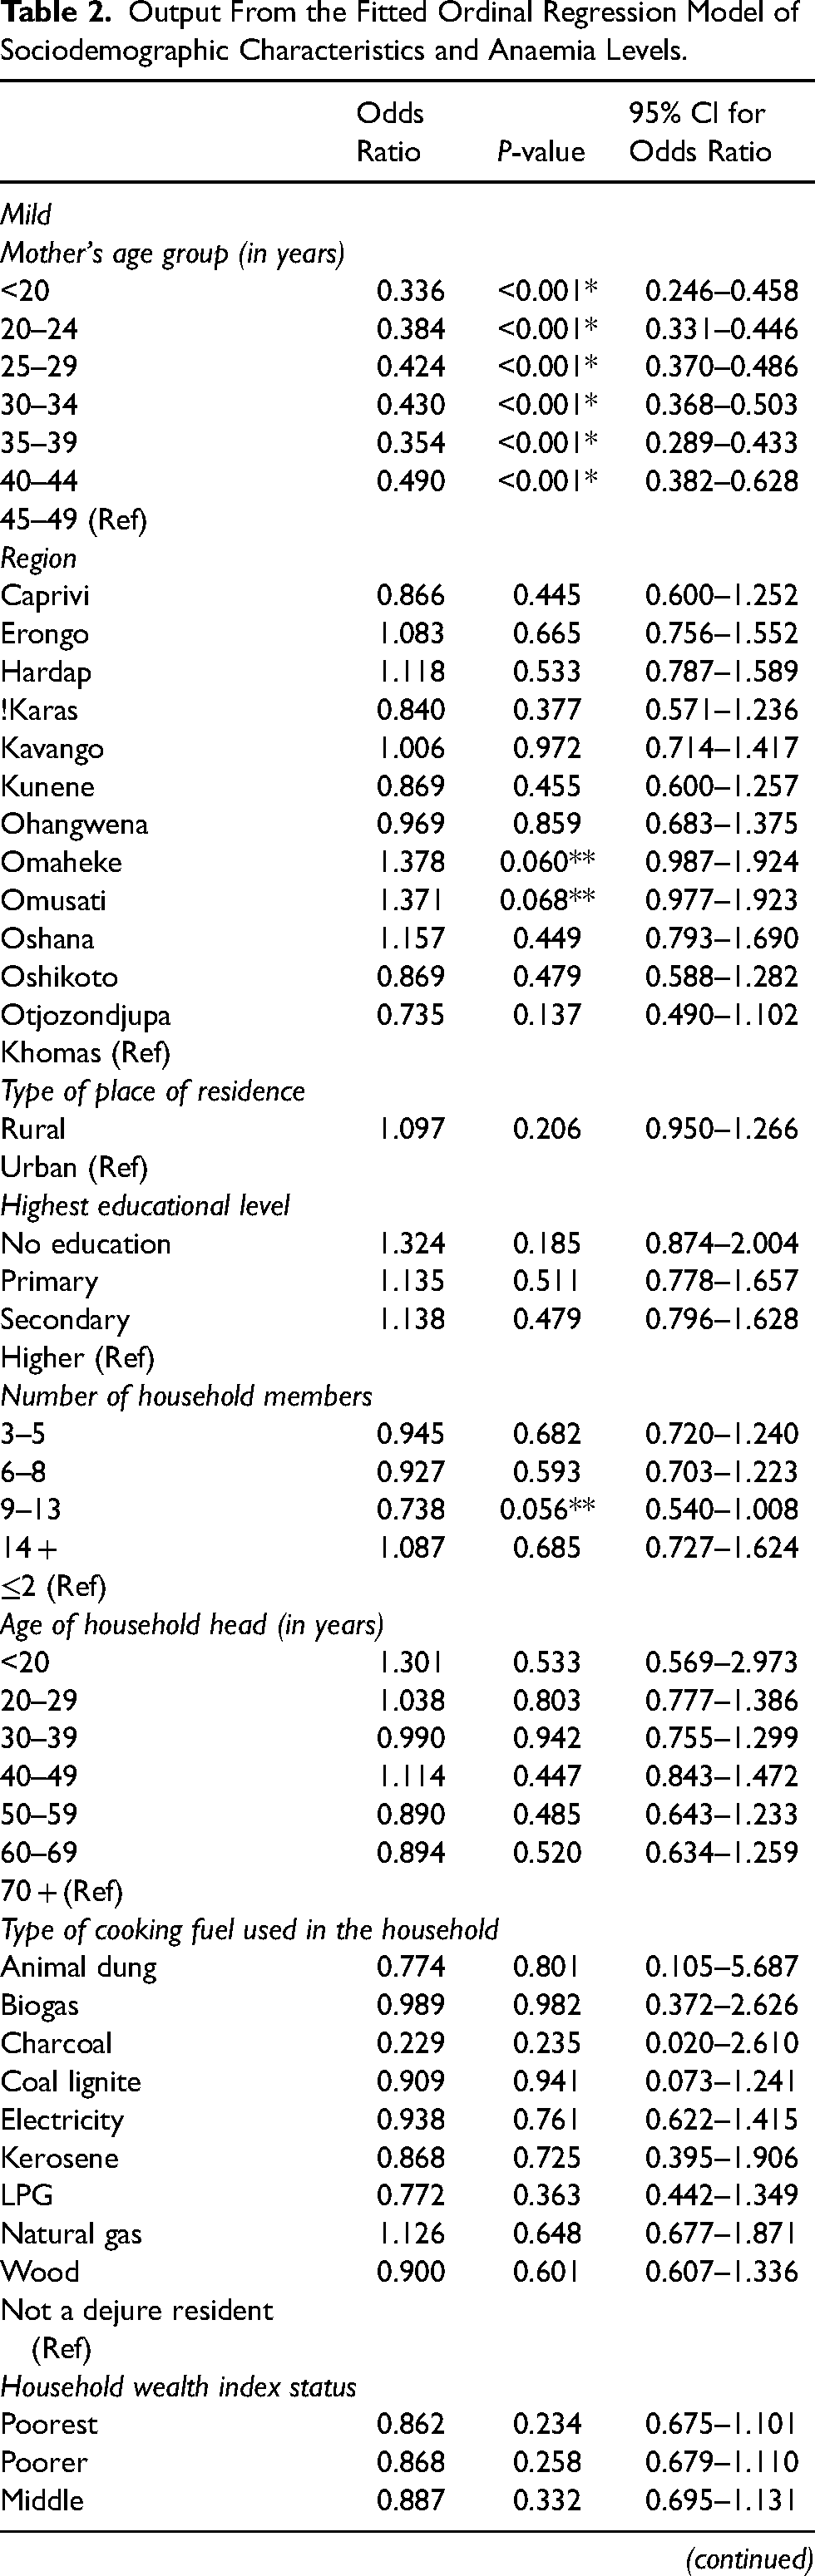
*Significant at a 5% level of significance; **Significant at a 10% level of significance; (Ref) = reference category.
From Table 2, with a significant p-value at a 5% and 10% level of significance and keeping all other variables constant, several deductions can be made.
Mild anaemic
The odds of being mildly anaemic for children whose mothers were aged less than 20 (OR = 0.336; P-value < 0.001; 95% CI: 0.246–0.458), 20–24 (OR = 0.384; P-value < 0.001; 95% CI: 0.331–0.446), 25–29 (OR = 0.424; P-value < 0.001; 95% CI: 0.370–0.486), 30–34 (OR = 0.430; P-value < 0.001; 95% CI: 0.368–0.503), 35–39 (OR = 0.354; P-value < 0.001; 95% CI: 0.289–0.433) and 40–44 (OR = 0.490; P-value < 0.001; 95% CI: 0.382–0.628) years were between 0.3 and 0.5 times lower than the odds of being non-anaemic. The odds of being mildly anaemic for children whose mothers were living in the Omaheke (OR = 1.378; P-value = 0.060; 95% CI: 0.987–1.924) and Omusati (OR = 1.371; P-value = 0.068; 95% CI: 0.977–1.923) regions were 1.4 times higher than the odds of being non-anaemic, while the odds for children living in households with 9–13 members (OR = 0.738; P-value = 0.056; 95% CI: 0.540–1.008) was 0.7 times lower. Similarly, the odds of being mildly anaemic for children who were born to mothers who gave birth to at most 2 (OR = 0.812; P-value = 0.027; 95% CI: 0.676–0.977) and 3–4 (OR = 0.797; P-value = 0.032; 95% CI: 0.647–0.980) children in total were 0.8 times lower than the odds of being non-anaemic, while the odds for children whose mothers were not covered by health insurance (OR = 0.634; P-value < 0.001; 95% CI: 0.531–0.757) was 0.6 times lower. The odds of being mildly anaemic for children whose mothers were not working (OR = 0.719; P-value = 0.015; 95% CI: 0.550–0.938) and worked as sales workers (OR = 0.755; P-value = 0.068; 95% CI: 0.558–1.021) were between 0.7 and 0.8 times lower than the odds of being non-anaemic, while the odds for children who were living with their mothers (OR = 0.798; P-value = 0.007; 95% CI: 0.678–0.940) was 0.8 times lower. Moreover, the odds of being mildly anaemic for children aged 0–12 (OR = 0.674; P-value < 0.001; 95% CI: 0.542–0.839), 13–24 (OR = 0.705; P-value = 0.003; 95% CI: 0.558–0.891), 25–36 (OR = 0.623; P-value < 0.001; 95% CI: 0.490–0.791) and 37–48 (OR = 0.780; P-value = 0.027; 95% CI: 0.626–0.972) months were between 0.6 and 0.8 times lower than the odds of being non-anaemic, while the odds for children who lived in households whose main language spoken in the house were Damara/Nama (OR = 0.660; P-value = 0.020; 95% CI: 0.465–0.936), Rukwangali (OR = 0.611; P-value = 0.013; 95% CI: 0.415–0.900) and Lozi (OR = 0.627; P-value = 0.024; 95% CI: 0.419–0.940) were between 0.6 to 0.7 times lower.
Moderate anaemic
The odds of being moderately anaemic for children whose mothers were aged less than 20 (OR = 1.101; P-value< 0.001; 95% CI: 1.064–1.139), 20–24 (OR = 1.080; P-value < 0.001; 95% CI: 1.043–1.118), 25–29 (OR = 1.094; P-value < 0.001; 95% CI: 1.078–1.110), 30–34 (OR = 1.089; P-value < 0.001; 95% CI: 1.060–1.118), 35–39 (OR = 1.064; P-value = 0.030; 95% CI: 1.006–1.125) and 40–44 (OR = 1.121; P-value < 0.001; 95% CI: 1.120–1.121) years were between 1.0 and 1.1 times higher than the odds of being non-anaemic. The odds of being moderately anaemic for children whose mothers were living in the Caprivi (OR = 1.019; P-value < 0.001; 95% CI: 1.019–1.020), !Karas (OR = 1.014; P-value < 0.001; 95% CI: 1.014–1.015), Ohangwena (OR = 1.004; P-value < 0.001; 95% CI: 1.003–1.004), Omusati (OR = 1.006; P-value < 0.001; 95% CI: 1.006–1.009) and Oshana (OR = 1.001; P-value = 0.061; 95% CI: 0.999–1.002) regions were 1.0 times higher than the odds of being non-anaemic, while the odds for those who lives in the Kavango (OR = 0.885; P-value = 0.041; 95% CI: 0.787–0.995) and Omaheke (OR = 0.999; P-value < 0.001; 95% CI: 0.999–1.000) regions were between 0.9 and 1.0 times lower. Similarly, the odds of being moderately anaemic for children living in rural areas (OR = 1.107; P-value < 0.001; 95% CI: 1.077–1.138) was 1.1 times higher than the odds of being non-anaemic, while the odds for children with diarrhoea (OR = 1.350; P-value < 0.001; 95% CI: 1.286–1.417) was 1.4 times higher. The odds of being moderately anaemic for children whose mothers had no education (OR = 1.278; P-value < 0.001; 95% CI: 1.158–1.411), primary education (OR = 1.270; P-value < 0.001; 95% CI: 1.163–1.387) and secondary education (OR = 1.168; P-value < 0.001; 95% CI: 1.082–1.261) as their highest levels of education were between 1.2 and 1.3 times higher than the odds of being non-anaemic, while the odds for children living in households headed by a person aged 20 (OR = 0.989; P-value < 0.001; 95% CI: 0.989–1.000), 20–29 (OR = 0.965; P-value = 0.023; 95% CI: 0.936–0.995), 30–39 (OR = 0.967; P-value = 0.003; 95% CI: 0.945–0.989) and 40–49 (OR = 0.951; P-value = 0.024; 95% CI: 0.910–0.993) years old was 1.0 times lower.
On the other hand, the odds of being moderately anaemic for children living in poorest wealth indexed households (OR = 0.943; P-value = 0.039; 95% CI: 0.891–0.997) was 0.9 times lower than the odds of being non-anaemic, while those living in poorer (OR = 1.004; P-value < 0.001; 95% CI: 1.004–1.006) wealth indexed households was 1.0 times higher. The odds of being moderately anaemic for children living in households whose cooking fuel were animal dung (OR = 1.024; P-value < 0.001; 95% CI: 1.023–1.025), biogas (OR = 1.006; P-value < 0.001; 95% CI: 1.006–1.008), charcoal (OR = 1.057; P-value < 0.001; 95% CI: 1.057–1.059), LPG (OR = 1.011; P-value < 0.001; 95% CI: 1.011–1.013) and natural gas (OR = 1.002; P-value < 0.001; 95% CI: 1.002–1.003) were between 1.0 and 1.1 times higher than the odds of being non-anaemic, while the odds for those using wood (OR = 0.979; P-value = 0.046; 95% CI: 0.959–1.000), coal lignite (OR = 0.983; P-value < 0.001; 95% CI: 0.982–0.986) and kerosene (OR = 0.994; P-value < 0.001; 95% CI: 0.994–0.997) were 1.0 times lower. The odds of being moderately anaemic for children who were born to mothers who gave birth to at most 2 (OR = 0.865; P-value < 0.001; 95% CI: 0.822–0.910) and 3–4 (OR = 0.898; P-value < 0.001; 95% CI: 0.851–0.947) children in total were 0.9 times lower than the odds of being non-anaemic, while the odds for children whose mothers were not covered by health insurance (OR = 0.985; P-value = 0.061; 95% CI: 0.969–1.001) was 1.0 times lower. Furthermore, the odds of being moderately anaemic for children whose mothers were not working (OR = 0.973; P-value = 0.020; 95% CI: 0.952–0.996), worked as clerical workers (OR = 0.997; P-value < 0.001; 95% CI: 0.997–0.999) and skilled manual workers (OR = 0.994; P-value < 0.001; 95% CI: 0.994–0.998) were 1.0 times lower than the odds of being non-anaemic, while the odds for those working as agricultural employees (OR = 1.017; P-value < 0.001; 95% CI: 1.017–1.019) and services workers (OR = 1.003; P-value < 0.001; 95% CI: 1.002–1.004) were 1.0 times higher. The odds of being moderately anaemic for children aged 0–12 (OR = 0.938; P-value = 0.002; 95% CI: 0.902–0.976) and 37–48 (OR = 0.851; P-value < 0.001; 95% CI: 0.818–0.886) months were 0.9 times lower than the odds of being non-anaemic, while the odds for those aged 13–24 months (OR = 1.258; P-value < 0.001; 95% CI: 1.203–1.317) was 1.3 times higher. The odds of being moderately anaemic for female children (OR = 0.967; P-value = 0.020; 95% CI: 0.940–0.995) was 1.0 times lower than the odds of being non-anaemic.
Severe anaemic
The odds of being severely anaemic for children whose mothers were living in the Caprivi (OR = 1.011; P-value< 0.001; 95% CI: 1.011–1.030), !Karas (OR = 1.007; P-value< 0.001; 95% CI: 1.007–1.009), Kavango (OR = 1.178; P-value = 0.011; 95% CI: 1.038–1.336), Kunene (OR = 1.070; P-value = 0.083; 95% CI: 0.991–1.156), Ohangwena (OR = 1.002; P-value< 0.001; 95% CI: 1.002–1.004), Omaheke (OR = 1.006; P-value< 0.001; 95% CI: 1.006–1.009), Omusati (OR = 1.012; P-value< 0.001; 95% CI: 1.011–1.016) and Oshana (OR = 1.003; P-value< 0.001; 95% CI: 1.003–1.035) regions were between 1.0 and 1.2 times higher than the odds of being non-anaemic, while the odds for children living in rural areas (OR = 1.134; P-value< 0.001; 95% CI: 1.103–1.165) was 1.1 times higher. Similarly, the odds of being severely anaemic for children whose mothers had no education (OR = 1.301; P-value< 0.001; 95% CI: 1.177–1.438), primary education (OR = 1.319; P-value< 0.001; 95% CI: 1.207–1.442) and secondary education (OR = 1.134; P-value = 0.001; 95% CI: 1.049–1.225) as their highest levels of education were between 1.1 and 1.3 times higher than the odds of being non-anaemic, while the odds for children who were living in households with 3–5 (OR = 1.040; P-value = 0.001; 95% CI: 1.017–1.064), 6–8 (OR = 1.035; P-value< 0.001; 95% CI: 1.020–1.049) and 9–13 (OR = 1.082; P-value = 0.006; 95% CI: 1.023–1.144) members were between 1.0 and 1.1 times higher. The odds of being severely anaemic for children living in households headed by a person aged 20 years old (OR = 0.998; P-value< 0.001; 95% CI: 0.997–1.001) was 1.0 times lower than the odds of being non-anaemic, while the odds for those aged 20–29 (OR = 1.023; P-value = 0.146; 95% CI: 0.992–1.055), 30–39 (OR = 1.023; P-value = 0.054; 95% CI: 1.000–1.046), 40–49 (OR = 1.050; P-value = 0.035; 95% CI: 1.003–1.098) and 50–59 (OR = 1.030; P-value = 0.079; 95% CI: 0.997–1.064) years old were between 1.0 and 1.1 times higher.
The odds of being severely anaemic for children living in poorest (OR = 1.090; P-value = 0.003; 95% CI: 1.029–1.155), poorer (OR = 1.013; P-value< 0.001; 95% CI: 1.013–1.015), middle (OR = 1.036; P-value = 0.018; 95% CI: 1.006–1.066) and richer (OR = 1.034; P-value = 0.026; 95% CI: 1.004–1.065) wealth indexed households were between 1.0 and 1.1 times higher than the odds of being non-anaemic. Likewise, the odds of being severely anaemic for children living in households whose cooking fuel were animal dung (OR = 1.012; P-value< 0.001; 95% CI: 1.012–1.013), biogas (OR = 1.004; P-value< 0.001; 95% CI: 1.004–1.005), charcoal (OR = 1.009; P-value< 0.001; 95% CI: 1.009–1.010), electricity (OR = 1.034; P-value = 0.018; 95% CI: 1.006–1.063), LPG (OR = 1.002; P-value< 0.001; 95% CI: 1.002–1.003), natural gas (OR = 1.004; P-value< 0.001; 95% CI: 1.004–1.006) and wood (OR = 1.051; P-value< 0.001; 95% CI: 1.029–1.073) were between 1.0 and 1.1 times higher than the odds of being non-anaemic, while the odds for those using coal lignite (OR = 0.985; P-value< 0.001; 95% CI: 0.984–0.999) and kerosene (OR = 0.992; P-value< 0.001; 95% CI: 0.992–1.000) were 1.0 times lower. Furthermore, the odds of being severely anaemic for children who were born to mothers who gave birth to at most 2 (OR = 0.822; P-value< 0.001; 95% CI: 0.781–0.866) and 3–4 (OR = 0.854; P-value< 0.001; 95% CI: 0.809–0.902) children in total were between 0.8 and 0.9 times lower than the odds of being non-anaemic, while the odds for children whose mothers were not covered by health insurance (OR = 1.041; P-value< 0.001; 95% CI: 1.024–1.058) was 1.0 times higher. The odds of being severely anaemic for children whose mothers were agricultural employees (OR = 0.997; P-value< 0.001; 95% CI: 0.997–1.001), clerical workers (OR = 0.999; P-value< 0.001; 95% CI: 0.999–1.003), services workers (OR = 0.998; P-value< 0.001; 95% CI: 0.997–1.002) and skilled manual workers (OR = 0.996; P-value = 0.001; 95% CI: 0.996–1.001) were 1.0 times lower than the odds of being non-anaemic, while the odds for those not working (OR = 1.045; P-value< 0.001; 95% CI: 1.021–1.069) and those who worked as sales workers (OR = 1.029; P-value = 0.058; 95% CI: 0.999–1.061) were 1.0 times higher.
Moreover, the odds of being severely anaemic for children aged 0–12 (OR = 0.954; P-value = 0.022; 95% CI: 0.916–0.993) and 37–48 (OR = 0.859; P-value < 0.001; 95% CI: 0.825–0.894) months were between 0.9 and 1.0 times lower than the odds of being non-anaemic, while the odds for those aged 13–24 months (OR = 1.282; P-value < 0.001; 95% CI: 1.225–1.342) was 1.3 times higher. The odds of being severely anaemic for female children (OR = 0.931; P-value < 0.001; 95% CI: 0.905–0.958) was 0.9 times lower than the odds of being non-anaemic, while the odds for children who were living with their mothers (OR = 1.062; P-value < 0.001; 95% CI: 1.043–1.083) was 1.1 times higher. The odds of being severely anaemic for children with diarrhoea (OR = 1.406; P-value < 0.001; 95% CI: 1.338–1.477) was 1.4 times higher than the odds of being non-anaemic.
Discussion
In this study, the influencing sociodemographic factors of childhood anaemia levels among children under 5 years old in Namibia was estimated using a multivariate ordinal regression model. Majority of the anaemic children were males aged 13–24 months old, living with their mothers, in a poorest wealth index household with 6–8 members, within rural areas in the Kavango region and spoke Oshiwambo as their main language in their home. In addition, sociodemographic characteristics such as the mother's age group, region, type of place of residence, highest educational level, number of household members, age of household head, type of cooking fuel used in the household, wealth index status of household, total children ever born, mother covered by health insurance, mother's occupation, sex of child, child's residency, diarrhoea status of the child, child's age and main language spoken at home had significant associations with childhood anaemia levels. This finding is consistent with the conclusions made by Ntenda et al. (2018), Shimanda et al. (2020) and Tesema et al. (2021) where it was concluded that the children's characteristics, maternal, household and community characteristics does have an impact on anaemia among children. Moreover, children whose mothers were aged less than 20 and 20–44 years, living in households with 9–13 members and were not covered by health insurance as well as those born to mothers who gave birth to at most 2–4 children in total had lower odds of being mildly anaemic. Likewise, children who were aged 0–48 months, living with their mothers who were not working and worked as sales workers and lived in households whose main language spoken in the house were Damara/Nama, Rukwangali and Lozi had lower odds of being mildly anaemic. However, children whose mothers lived in the Omaheke and Omusati regions had higher odds of being mildly anaemic. This is not surprising as the lower odds among children living in households whose main languages spoken in the house were Damara/Nama, Rukwangali and Lozi can be attributed to the fact that majority of the sponsored health information meant to raise awareness on healthy societal issues were most often written and translated in these popular languages that were already familiar and popular to most communities in Namibia, especially those targeted at mothers/caretakers/guardians in some of these communities. Also, it is believed that less informed people are less likely to take theirs and their children's health and wellness (more) seriously, especially when it comes to illnesses unknown or unfamiliar to them.
Furthermore, children living in households headed by a person aged 20–49 years and using wood, coal lignite and kerosene as cooking fuel in the Kavango and Omaheke regions within the poorest wealth indexed households as well as those born to mothers who gave birth to at most 2–4 children in total and not covered by health insurance had lower odds of being moderately anaemic. Similarly, female children aged 0–12 and 37–48 months, whose mothers were not working, worked as clerical workers and skilled manual workers had lower odds of being moderately anaemic. On the other hand, children aged 13–24 months in the rural areas, whose mothers were aged less than 20 – 44 years, living in households that uses animal dung, biogas, charcoal, LPG and natural gas as cooking fuel within the Caprivi, !Karas, Ohangwena, Omusati and Oshana regions and with primary, secondary and no education as their highest levels of education had higher odds of being moderately anaemic. Likewise, children who had diarrhoea and whose mothers were working as agricultural employees and services workers while living in poorer wealth indexed households had higher odds of being moderately anaemic. This is not surprising as children from households with low wealth status may not have the means to afford foods rich in iron, vitamins and folic acid, which in turn increases their risk of developing anaemia. Children aged 0–12 months are still primarily being fed breastmilk which contains antibodies that helps protect against many common childhood illnesses while providing all the energy and nutrients that the children need, especially, during the first months of their lives (WHO, 2022b). However, the current health statuses and underlining illnesses of the breastfeeding mothers can contaminate the quality of the breastmilk during feeding, especially mothers living with infectious illnesses such as HIV, hepatitis B virus, hepatitis C virus, cytomegalovirus, West Nile virus and human T-cell lymphotropic virus. Through transplacental transmission, these diseases can be easily passed down to the infant children which in turn can interfere with their development of haemoglobin and iron stores making the children more susceptible to anaemia. Also, older children can consume more food rich in iron compared to younger ones. This is similar to the findings made by Dey and Raheem (2016) and Turawa et al. (2021) where it was revealed that as a child ages to 48 months or more, the likelihood of anaemia decreases due to the iron intake which improves with age as a result of a more varied food intakes, including the introduction of meat and other haemoglobin-containing diets. Additionally, it is widely believed that less educated and informed people are less likely to take theirs and their children's wellbeing seriously, especially when it comes to unfamiliar illnesses to them and/or in their communities. Although studies have shown that baby born to younger mothers aged less than 20 years were more likely to be a pre-term and low birth weight resulting in the new-born prone to neonatal infections and malnutrition thereby increasing their risk of anaemia, this study results showed that this was the case for Namibian children with (moderate levels of) anaemia as well as for those with 20–44 years old mothers. Children with a history of diarrhoea had higher odds which might be due to them having a loss of appetite and decreased absorption of necessary nutrients such as iron, folate and vitamins, thereby increasing their likelihood of anaemia. Similarly, the swift growth and development of male children in their first few years of life can lead to an increase in their micronutrient demands, including vitamins, folate and iron, thereby increasing their risk of (moderate) anaemia compared to female children. This finding is similar to those observed in Dey and Raheem (2016) and Tesema et al. (2021) where it was concluded that male children were at greater risk of anaemia than females.
Female children aged 0–12 and 37–48 months born to mothers who gave birth to at most 2–4 children in total, living in households headed by a person aged 20 years and using coal lignite and kerosene as cooking fuel, as well as those whose mothers were agricultural employees, clerical workers, services workers and skilled manual workers had lower odds of being severely anaemic. On the other hand, children whose mothers were living in the rural areas within the Caprivi, !Karas, Kavango, Kunene, Ohangwena, Omaheke, Omusati and Oshana regions, with primary, secondary and no education as their highest levels of education, in households headed by a person aged 20–59 years with 3–13 members and using animal dung, biogas, charcoal, electricity, LPG, natural gas and wood as cooking fuel had higher odds of being severely anaemic. Likewise, children aged 13–24 months with diarrhoea living with their mothers in poorest to richer wealth indexed households, and whose mothers were not covered by health insurance, not working and worked as sales workers had higher odds of being severely anaemic. This can be attributed to the fact that most non-affluent indexed households do not necessarily have the means to afford foods rich in iron, vitamins and folic acid, which in turn increases their risk of developing anaemia. Also, these households are less likely to purchase nutrient-rich foods, secure constant food availability and afford health services during illness for their children. This is similar to the conclusions made by Dey and Raheem (2016) and Tesema et al. (2021) where it was concluded that inadequate intake of nutrients such as iron, folate and vitamins increases the risk of anaemia among children in low and medium wealth households, making them more vulnerable to anaemia compared to those in the affluent and well-off households, and that male children in low-income countries were at greater risk of anaemia than females. Despite the fact that (coal) lignite is the most health-harming form of coal, given the high amount of pollution resulting from its combustion, this study results showed that it does not contribute to greater risk of anaemia among Namibian children. Given that this study was based on a secondary data (NDHS), the limitation of this study is that some factors that may be relevant to childhood anaemia such as mother's anaemia level, dietary intake and history of infectious diseases as well as the children's eating habits, history of infectious diseases, previous hospitalisation and use of nutritional supplements were not captured within the 2013 NDHS data, thus, could not be considered in this study.
Conclusion
With higher odds of having moderate to severe anaemia levels for sociodemographic characteristics such as region, place of residence, highest education level, type of cooking fuel and child's diarrhoea status, it is, thus, recommended that the policies and practices concerning anaemia diagnosis, treatment and prevention in the country need to be substantially revised by policy-makers, program planners, and implementers that seek to reduce childhood anaemia (levels) in order to make a significant impact, bearing in mind the identified sociodemographic factors from this study. This should also include an adequate exploration of cost-effective measures such as nutrition education and food fortification, especially among male children with diarrhoea from mothers aged 20–44 years in rural non-affluent households in the Omusati, Caprivi (now called Zambezi), !Karas, Ohangwena and Oshana regions. In addition, more comprehensive work to linking anaemia (levels) to other infectious diseases such as malaria, hookworms, HIV/AIDS infection, bacteraemia, schistosomiasis, and visceral leishmaniasis in Namibia should be done to devise standard treatment and prevention packages or strategies for early detection and management of childhood anaemia and its levels, starting with the known prevalent causes and identified sociodemographic factors from this study. This can also be extended beyond Namibia to low-income countries in Africa and beyond where there is a lack of resources to conduct a comprehensive investigation and treat patients with difference anaemia levels. Moreover, further studies on this topic is recommended using data from the next NDHS, pending available funding from the funders.
Footnotes
Acknowledgment
The United States Agency for International Development is thanked for availing the 2013 NDHS data.
Authors’ contributions
OO supervised the study, performed the data analyses, wrote the manuscript and critically reviewed the manuscript.
Availability of data and materials
The 2013 NDHS data that was used in this study is freely available on the public domain and downloadable from the DHS website, after the completion of a user's agreement and the granting of access by the United States Agency for International Development. Also, no separate permission is required for the data usage and materials publication.
Consent for publication
The author approved the submission of the manuscript and consented to the publication of the manuscript.
Declaration of conflicting interests
The author(s) declared no potential conflicts of interest with respect to the research, authorship, and/or publication of this article.
Ethical statement
As this study was a secondary data analysis of publicly accessible survey data from the DHS program, it did not require ethical approval and participant consent. The 2013 NDHS data that was used in this study is freely available on a public domain and downloadable from the DHS website and no separate permission is required for its data usage and publication.
Funding
The author(s) received no financial support for the research, authorship, and/or publication of this article.