
Abstract
Background
Results of studies on the effects of plant and animal proteins on lipid profile are controversial. So we aimed to assess the relationship between plant and animal protein intake with lipid profile and novel anthropometric indices in healthy individuals.
Method
In this cross-sectional study, 236 participants have selected from Shiraz medical centers (Iran) through random cluster sampling. Food intakes were assessed using a 168-items food frequency questionnaire (FFQ). Total cholesterol (TC), high-density lipoprotein cholesterol (HDL-C), low-density lipoprotein cholesterol (LDL-C), and triglyceride (TG) were measured. Anthropometric indices including a body shape index (ABSI), abdominal volume index (AVI), buddy roundness index (BRI), and conicity index (CI) were calculated.
Results
In the crude and fully adjusted models, more consumption of plant proteins was associated with TG levels (OR = 2.31; 95% CI: 1.08, 4.95; P = 0.03 and OR = 2.39; 95% CI: 1.03, 5.15; P = 0.04). Also, there was a significant direct association between plant proteins and BRI in the curd model (OR = 3.55; 95% CI: 1.32, 9.54; P = 0.01), and after adjusting for age and energy intake (OR = 3.32; 95% CI: 1.21, 9.14; P = 0.01). More consumption of plant proteins was related to higher CI in the crude model (OR = 3.06; 95% CI: 1.12, 8.31; P = 0.03), but not in the fully adjusted model.
Conclusion
We found that a higher intake of plant proteins was associated with a higher TG level, BRI, and CI index. However, more research is needed to confirm these relations and provide the evidence needed to exert these findings into clinical practice.
Introduction
Dyslipidemia, as seen in obesity, is an important risk factor in the development of many metabolic and atherosclerotic cardiovascular diseases (CVDs) (Pol et al., 2018; Subber et al., 2021), and its prevalence affects more than half of the adult population worldwide. According to studies conducted in Iran, the mean prevalence of hypercholesterolemia (≥200 mg/dl) and hypertriglyceridemia (≥150 mg/dl) in adults was estimated to be 41.6% and 46.4%, respectively (Tabatabaei-Malazy et al., 2014). Large observational studies have shown that high total cholesterol (TC) and low-density lipoprotein cholesterol (LDL-C) levels and low levels of high-density lipoprotein cholesterol (HDL-C) are correlated with a high coronary heart disease (CHD) risk and its mortality rate (Di Angelantonio et al., 2009; Rerksuppaphol and Rerksuppaphol, 2021). Besides prescribing drugs, lifestyle and diet interventions are required to treat or control dyslipidemia (Zhao et al., 2020). Among dietary factors, the amount and type of protein can affect body weight (BW), body mass index (BMI), and blood levels of lipids in patients with metabolic diseases (Zhao et al., 2020).
A recent study has shown that dietary protein quality and amino acids composition of different sources of proteins could affect lipid profile (Teymoori et al., 2019). In animal studies, the amino acid composition of diets has affected serum cholesterol concentrations (Jobgen et al., 2006). Animal proteins contain more branched-chain amino acids (leucine, isoleucine, and valine) and methionine. Leucine is a cholesterol precursor which stimulates the rate-limiting enzyme of cholesterol synthesis (3-hydroxy-3-methyl glutaryl coenzyme A reductase) (Jobgen et al., 2006). Though, plant proteins contain more arginine and asparagine which have cholesterol-lowering effects (Li et al., 2017).
Due to their role in causing hyperlipidemia, obesity and metabolic disorders are known to be risk factors for cardiovascular disease (Ärnlöv et al., 2010). Anthropometric measurements are easy and accurate tools for quantifying body proportions by assessing body length, weight, and circumferences (Pawaskar et al., 2015). Although according to some reports, these indices only include limited data about fat distribution, body roundness index (BRI), a body shape index (ABSI), abdominal volume index (AVI), and Conicity Index (CI) are all novel body geometry indices and strong predictors of visceral fat (Krakauer and Krakauer, 2012; Thomas et al., 2013).
A meta-analysis conducted in 2017 on the adult population, indicated that a diet rich in soy protein in comparison with diets containing animal proteins decreased plasma cholesterol levels (Li et al., 2017). Meanwhile, a study by Levine ME et al. found a positive association between animal protein and mortality rate (Levine et al., 2014). The study by Wang et al. showed a decrease in TC, TG, and LDL-C in the plant protein group (Wang et al., 2004), while in the study of Hermansen et al. the consumption of plant proteins did not improve the lipid profile (Hermansen et al., 2005). Therefore, there is no strong evidence of lipid-lowering effects of plant protein and requires further studies to prove this effect (Li et al., 2017). As the results of studies on the effect of plant and animal proteins on lipid profile are controversial also to the best of our knowledge its relationship with new anthropometric indices has not been assessed, we did this study to investigate the relationship between plant and animal proteins intake with lipid profile and novel anthropometric indices in healthy individuals in Shiraz, Iran. Clarifying this association can help to better regulate the dietary pattern of patients with cardiovascular diseases and those with dyslipidemia, also be effective in preventing CVDs.
Method
Study population
In this cross-sectional study, 236 participants were selected from Shiraz medical centers (Iran) through random cluster sampling. The age limit of the participants was 20–50 years and other inclusion criteria were having no history of any chronic disease and not following a specific dietary regimen. At first, a preliminary interview was conducted with each person, the method of the study and its objectives were explained then a written consent was signed by them (The complete information on participants’ properties and method have been previously published) (Borazjani et al., 2021; Najafi et al., 2020). The study protocol have been approved by Shiraz University of Medical Sciences (IR.SUMS.REC.1394.S146).
Dietary assessment
Information about food intake was collected using a 168-item food frequency questionnaire (FFQ) via face-to-face interviews. The validity and reliability of the FFQ has been assessed among the Iranian population previously (Mirmiran et al., 2010).
After completing the FFQs, total food intakes were converted from the usual household scales to grams, and people were divided into two groups: 1- plant proteins consist of cereals, vegetables, nuts, seeds and legumes; 2- animal protein sources were all type of meats, eggs and dairy products (Camilleri et al., 2013). Finally, NUTRITIONIST IV program version 7 was used to estimate energy and nutrients intakes (First Databank Division, the Hearst Corporation, San Bruno, CA, USA, modified for Iranian foods).
Biochemical assessments
A 5cc blood sample was collected after 12 h fasting and stored at −70 degrees Celsius. Serum Lipids including TC, HDL-C, LDL-C and triglyceride (TG) were measured using commercially available enzymatic regents (Pars Azmoon, Tehran, Iran).
Socio-demographic and anthropometric assessments
Sociodemographic information such as age, sex, alcohol intake, and smoking habits was collected using a questionnaire. Information about Physical activity was assessed by the international physical activity questionnaires (IPAQ) (Biernat et al., 2008). Anthropometric indices were measured by a trained person based on the relevant standards. Weight was measured by SECA digital scale 813 (Seca, Hamburg, Germany) with 100 g accuracy in light clothing. Height was measured barefoot by a non-stretchable tape to the nearest 0.5 cm. Waist circumference (WC) was measured at the upper area of the iliac crest ABSI was calculated as 1000*WC*Wt−2/3*Ht5/6 (Krakauer and Krakauer, 2012). AVI was calculated using this equation: (2*(WC*100)2 + 0.7 (WC*100 − HC*100)2) (Guerrero-Romero and Rodríguez-Morán, 2003). Buddy roundness index BRI was estimated as 364.2 − 365.5 √1 − (WC/(2π))2/(0.5Ht)2, the resulting number was between 0 and 1, 1 represents the most linear state possible and 0 represents the roundest state (Thomas et al., 2013). CI was calculated using the following formula :WC / 0.109 √Wt / Ht (Martins et al., 2015; Valdez, 1991). In all equations weight was in kilograms, height and WC were in centimeters.
Statistical analysis
Participants were classified based on tertiles of plant and animal protein intake. To assess the normality of the data, Kolmogorove-Smirnov test was used. We used chi-squared and One-way analysis of variance (ANOVA) test to compare categorical and continuous variables across the tertiles of plant and animal protein intake. To determine the relations between plant and animal protein intake and odds of anthropometric indices and lipid profile, multivariable logistic regression was used in two different models (crude and adjusted). We controlled age and energy intake in the first model, and sex, BMI, waist–hip ratio (WHR) and physical activity were added in the second model. Statistical analyses were carried out using SPSS version 20.0 (SPSS Inc, Chicago IL). P-value < 0.05 was considered statistically significant.
Results
In this cross-sectional study, 236 persons (97 men and 139 women) with mean age of 45.97 ± 11.75 years and mean BMI of 28.26 ± 4.66 (kg/m2) participated. Participants who consumed more animal proteins, were taller than those who consumed less (P = 0.01), also participants with higher plant proteins intake, were shorter than those with less intake (P = 0.01). In terms of waist circumference in the tertiles of plant protein, those who were in the highest tertile had higher WC than the lowest tertile (P = 0.03), but this difference was not significant for animal protein (Table 1).
Basic characteristics of participants across the tertiles of plant and animal protein.
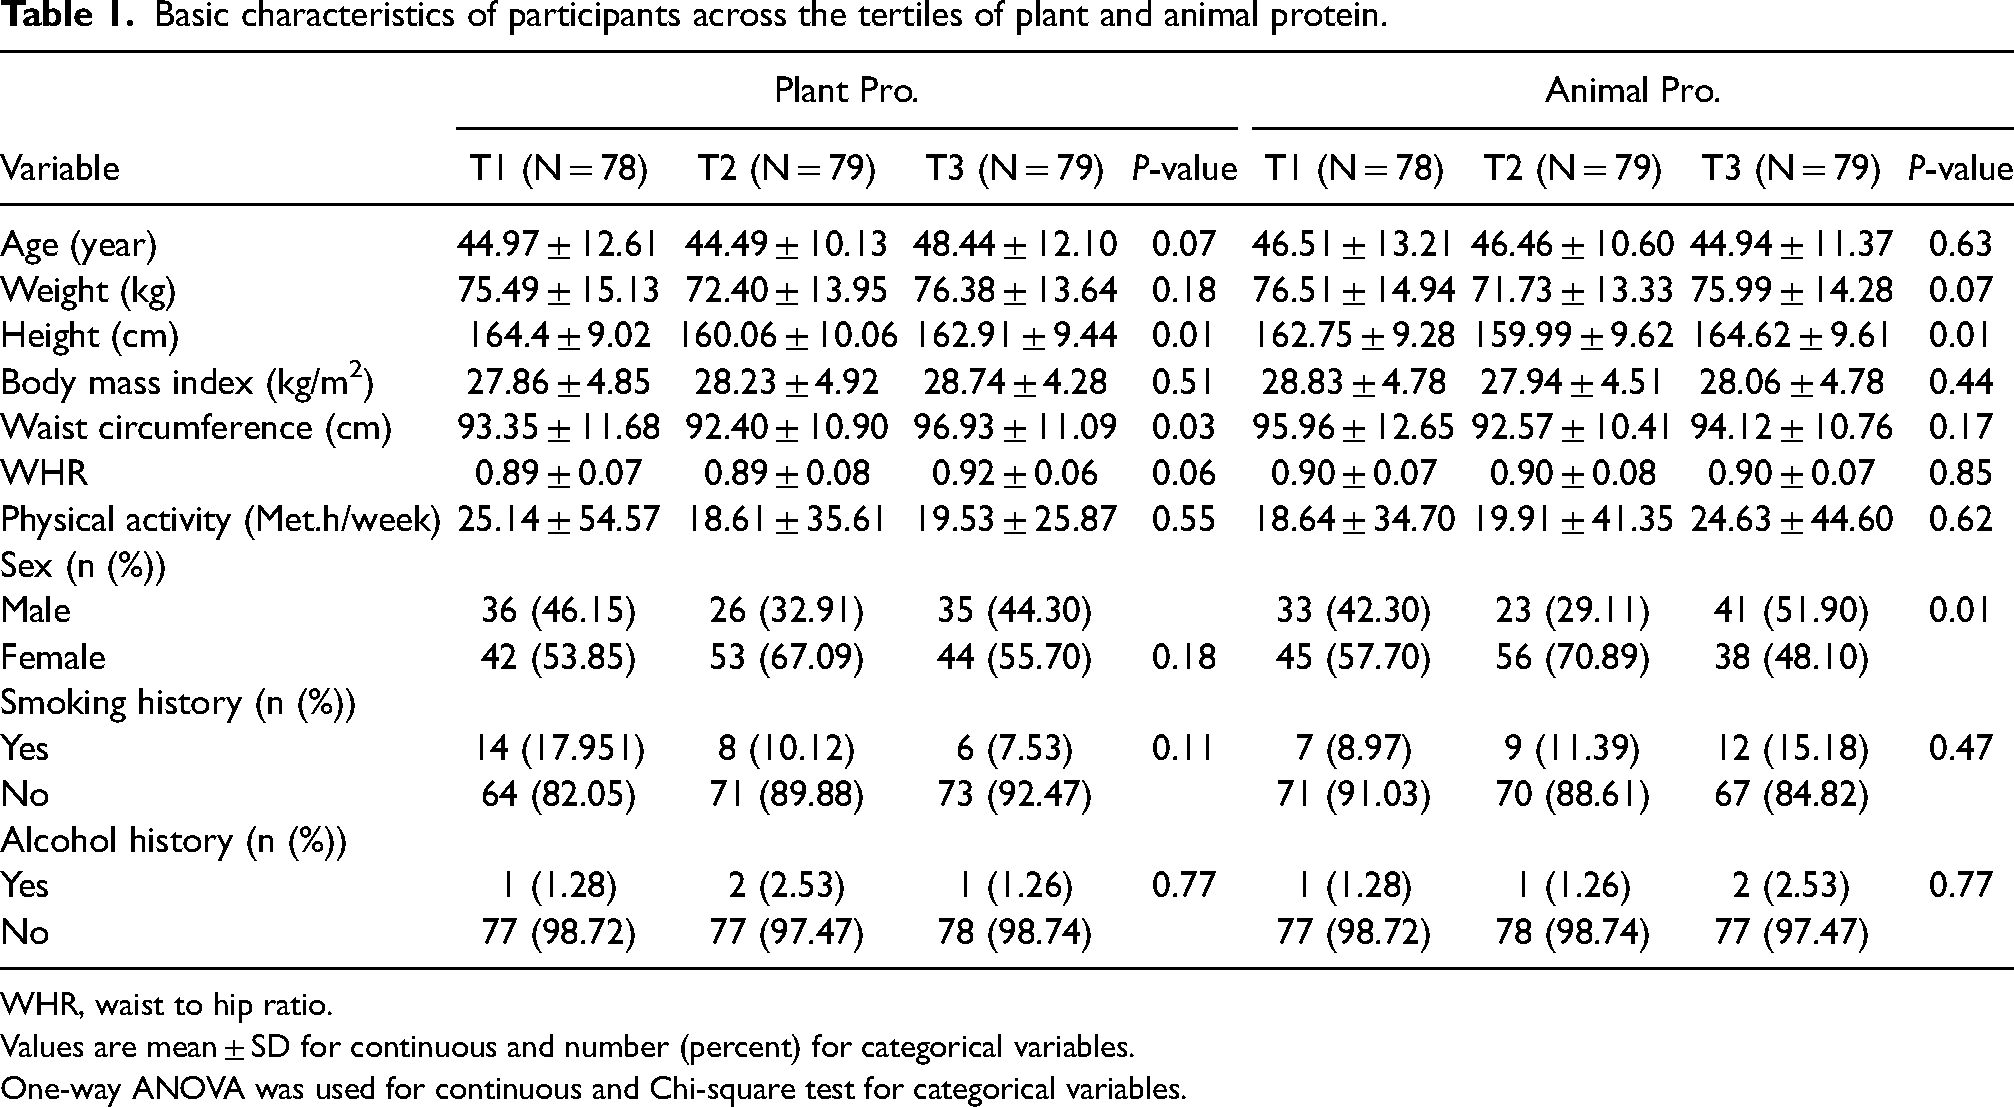
WHR, waist to hip ratio.
Values are mean ± SD for continuous and number (percent) for categorical variables.
One-way ANOVA was used for continuous and Chi-square test for categorical variables.
According to Table 2, participants in the highest tertile of plant proteins consumed more carbohydrates, proteins, fiber, vitamin B6, vitamin B9, magnesium, selenium, cereals, vegetables, nuts, and legumes, but had lower intakes of energy, fat, saturated fatty acids (SFA), monounsaturated fatty acids (MUFA), polyunsaturated fatty acids (PUFA), cholesterol, vitamin E, dairy and meat compared to the lowest tertile (P-value < 0.05). Also, lower intakes of energy, carbohydrate, fiber, vitamin B6, vitamin B9, cereals, nuts, legumes and more intakes of protein, SFA, cholesterol, calcium, dairy, and meat in the third tertile of animal proteins compared to the first tertile were seen (P-value < 0.05).
Dietary intakes of participants across the tertiles of plant and animal protein.
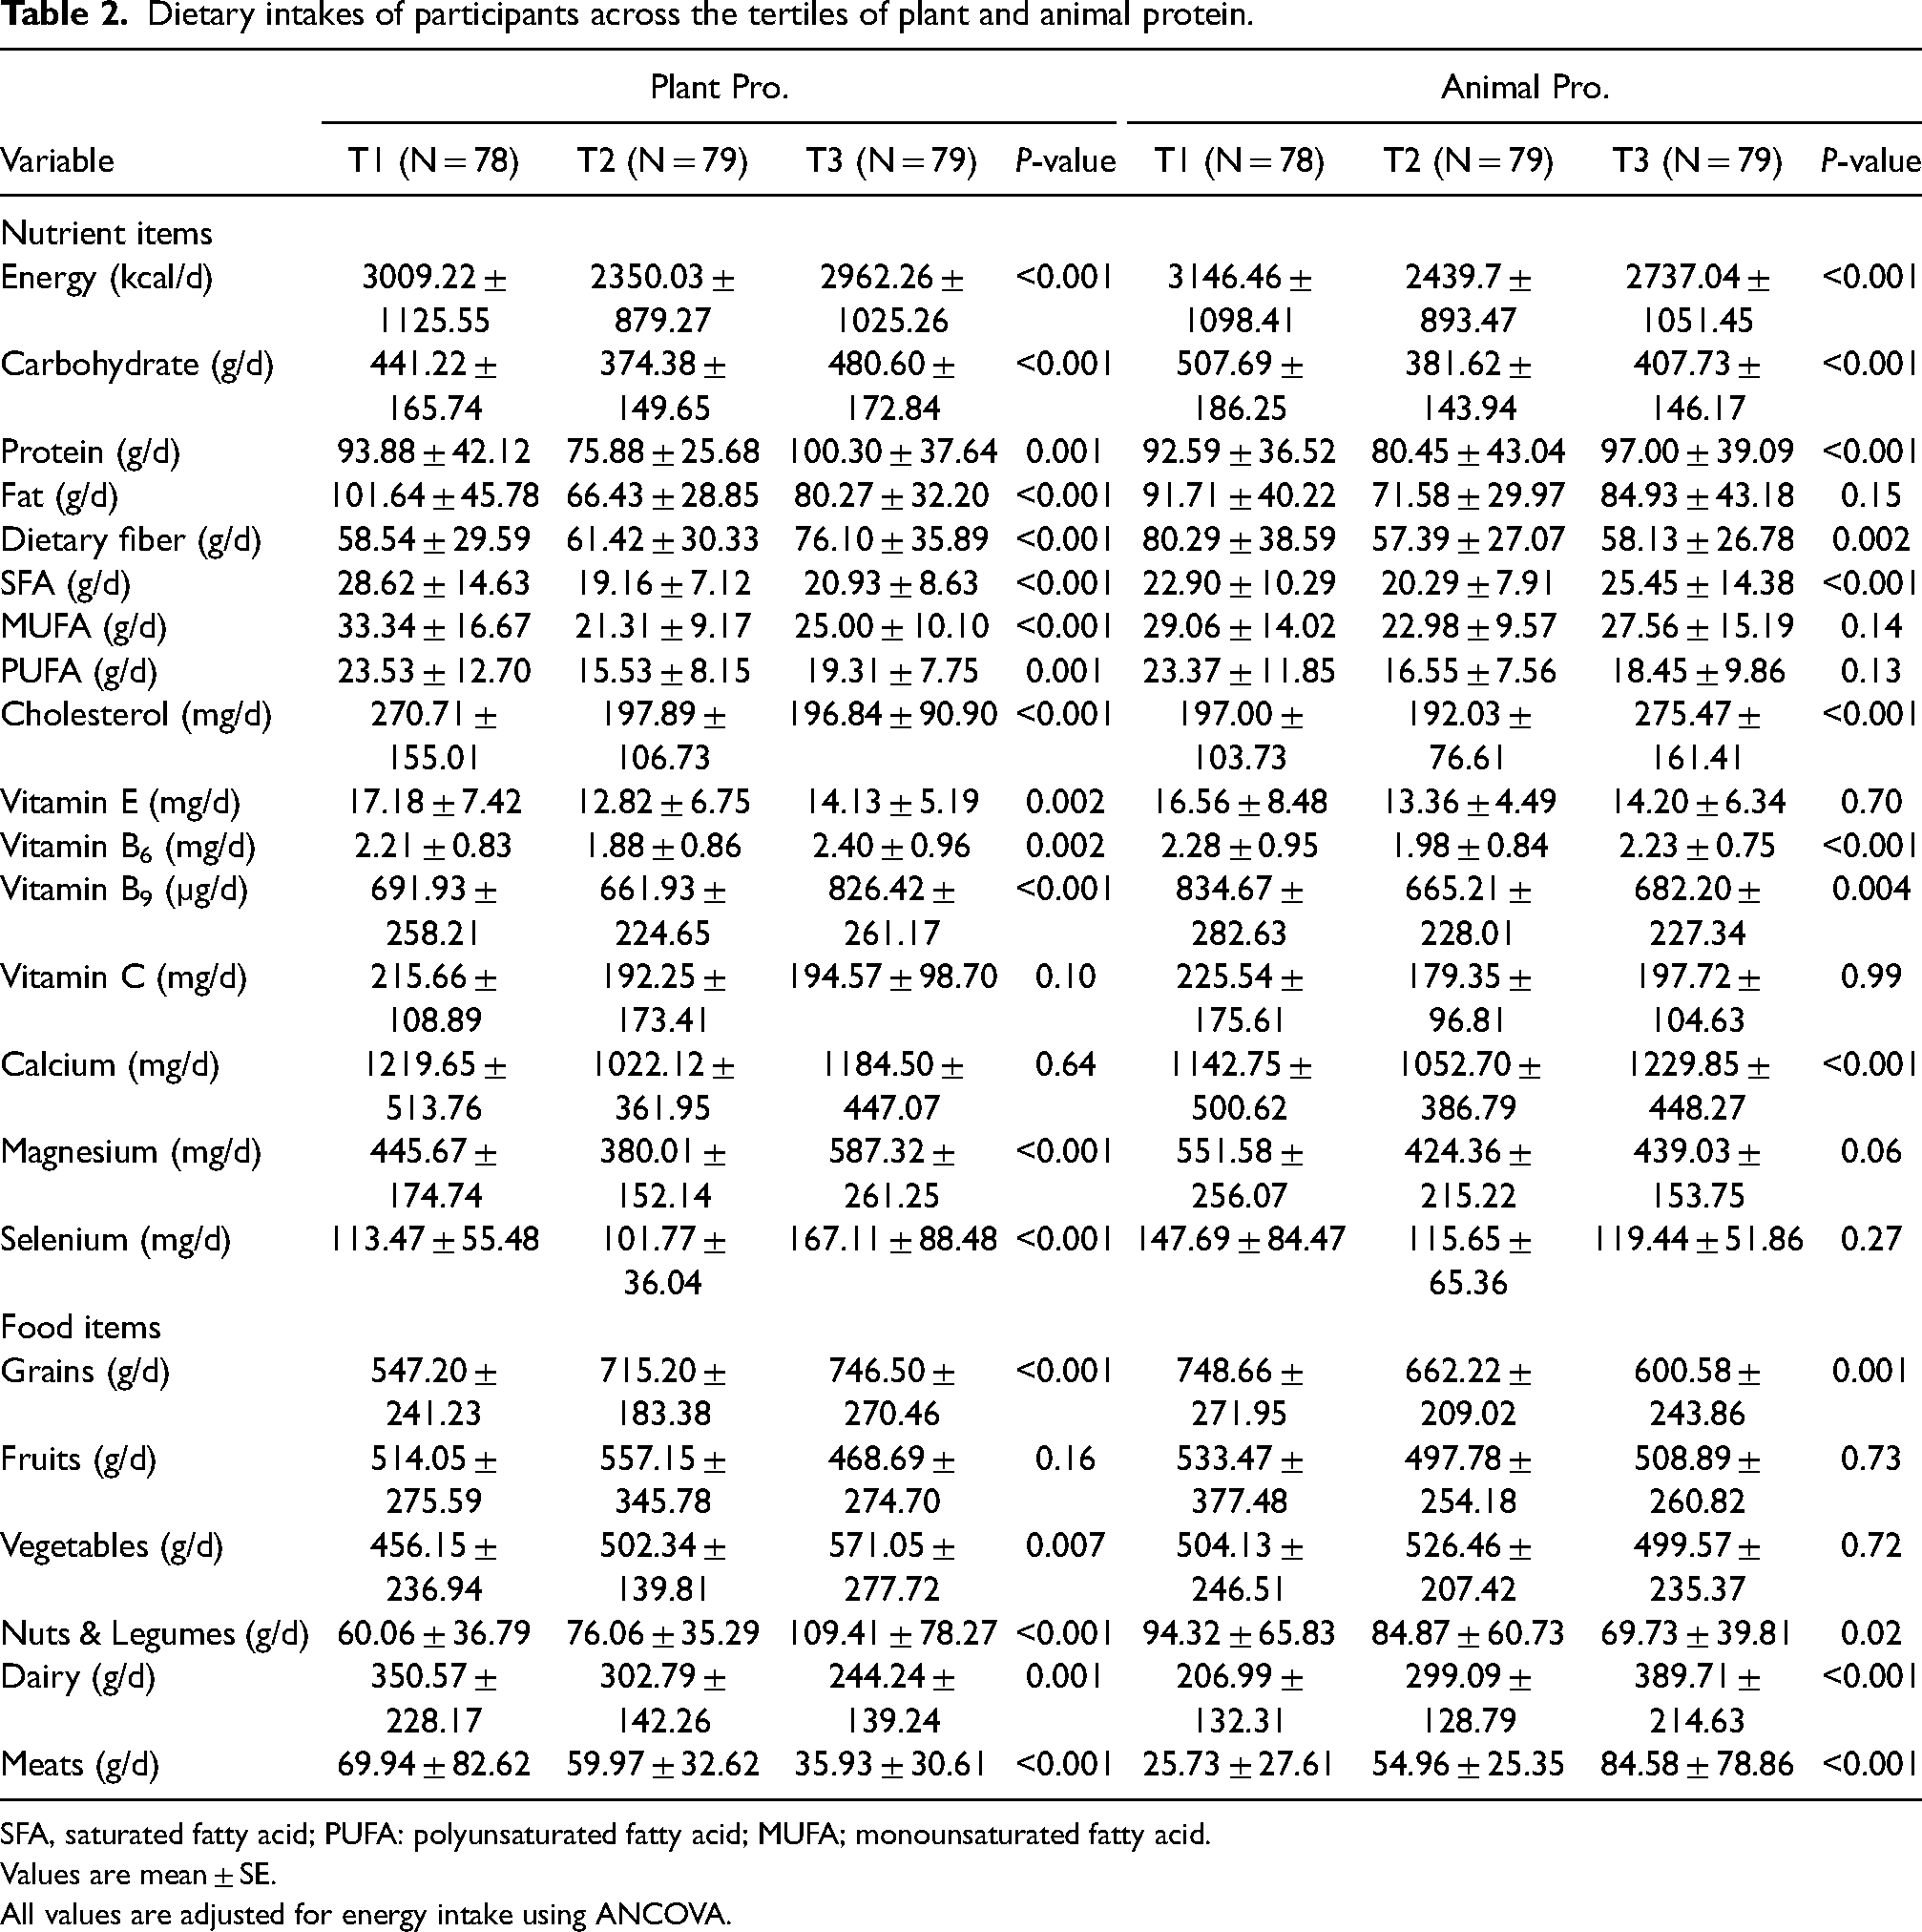
SFA, saturated fatty acid; PUFA: polyunsaturated fatty acid; MUFA; monounsaturated fatty acid.
Values are mean ± SE.
All values are adjusted for energy intake using ANCOVA.
In the highest tertile of plant proteins, AVI was higher than those in the lowest tertile in crude and fully adjusted models. Also, the CI of participants in the highest tertile was more than those in the lowest tertile, but after adjustment, it was no longer significant. There was no difference between various tertiles of plant protein in any model in terms of TC, LDL-C, HDL-C, ABSI, and BRI, also no significant difference between TG, TC, LDL-C, HDL-C, ABSI, AVI, BRI, and CI among the different tertiles of animal protein intake (Table 3).
Mean lipid profile and anthropometric indices across tertiles of plant and animal protein.
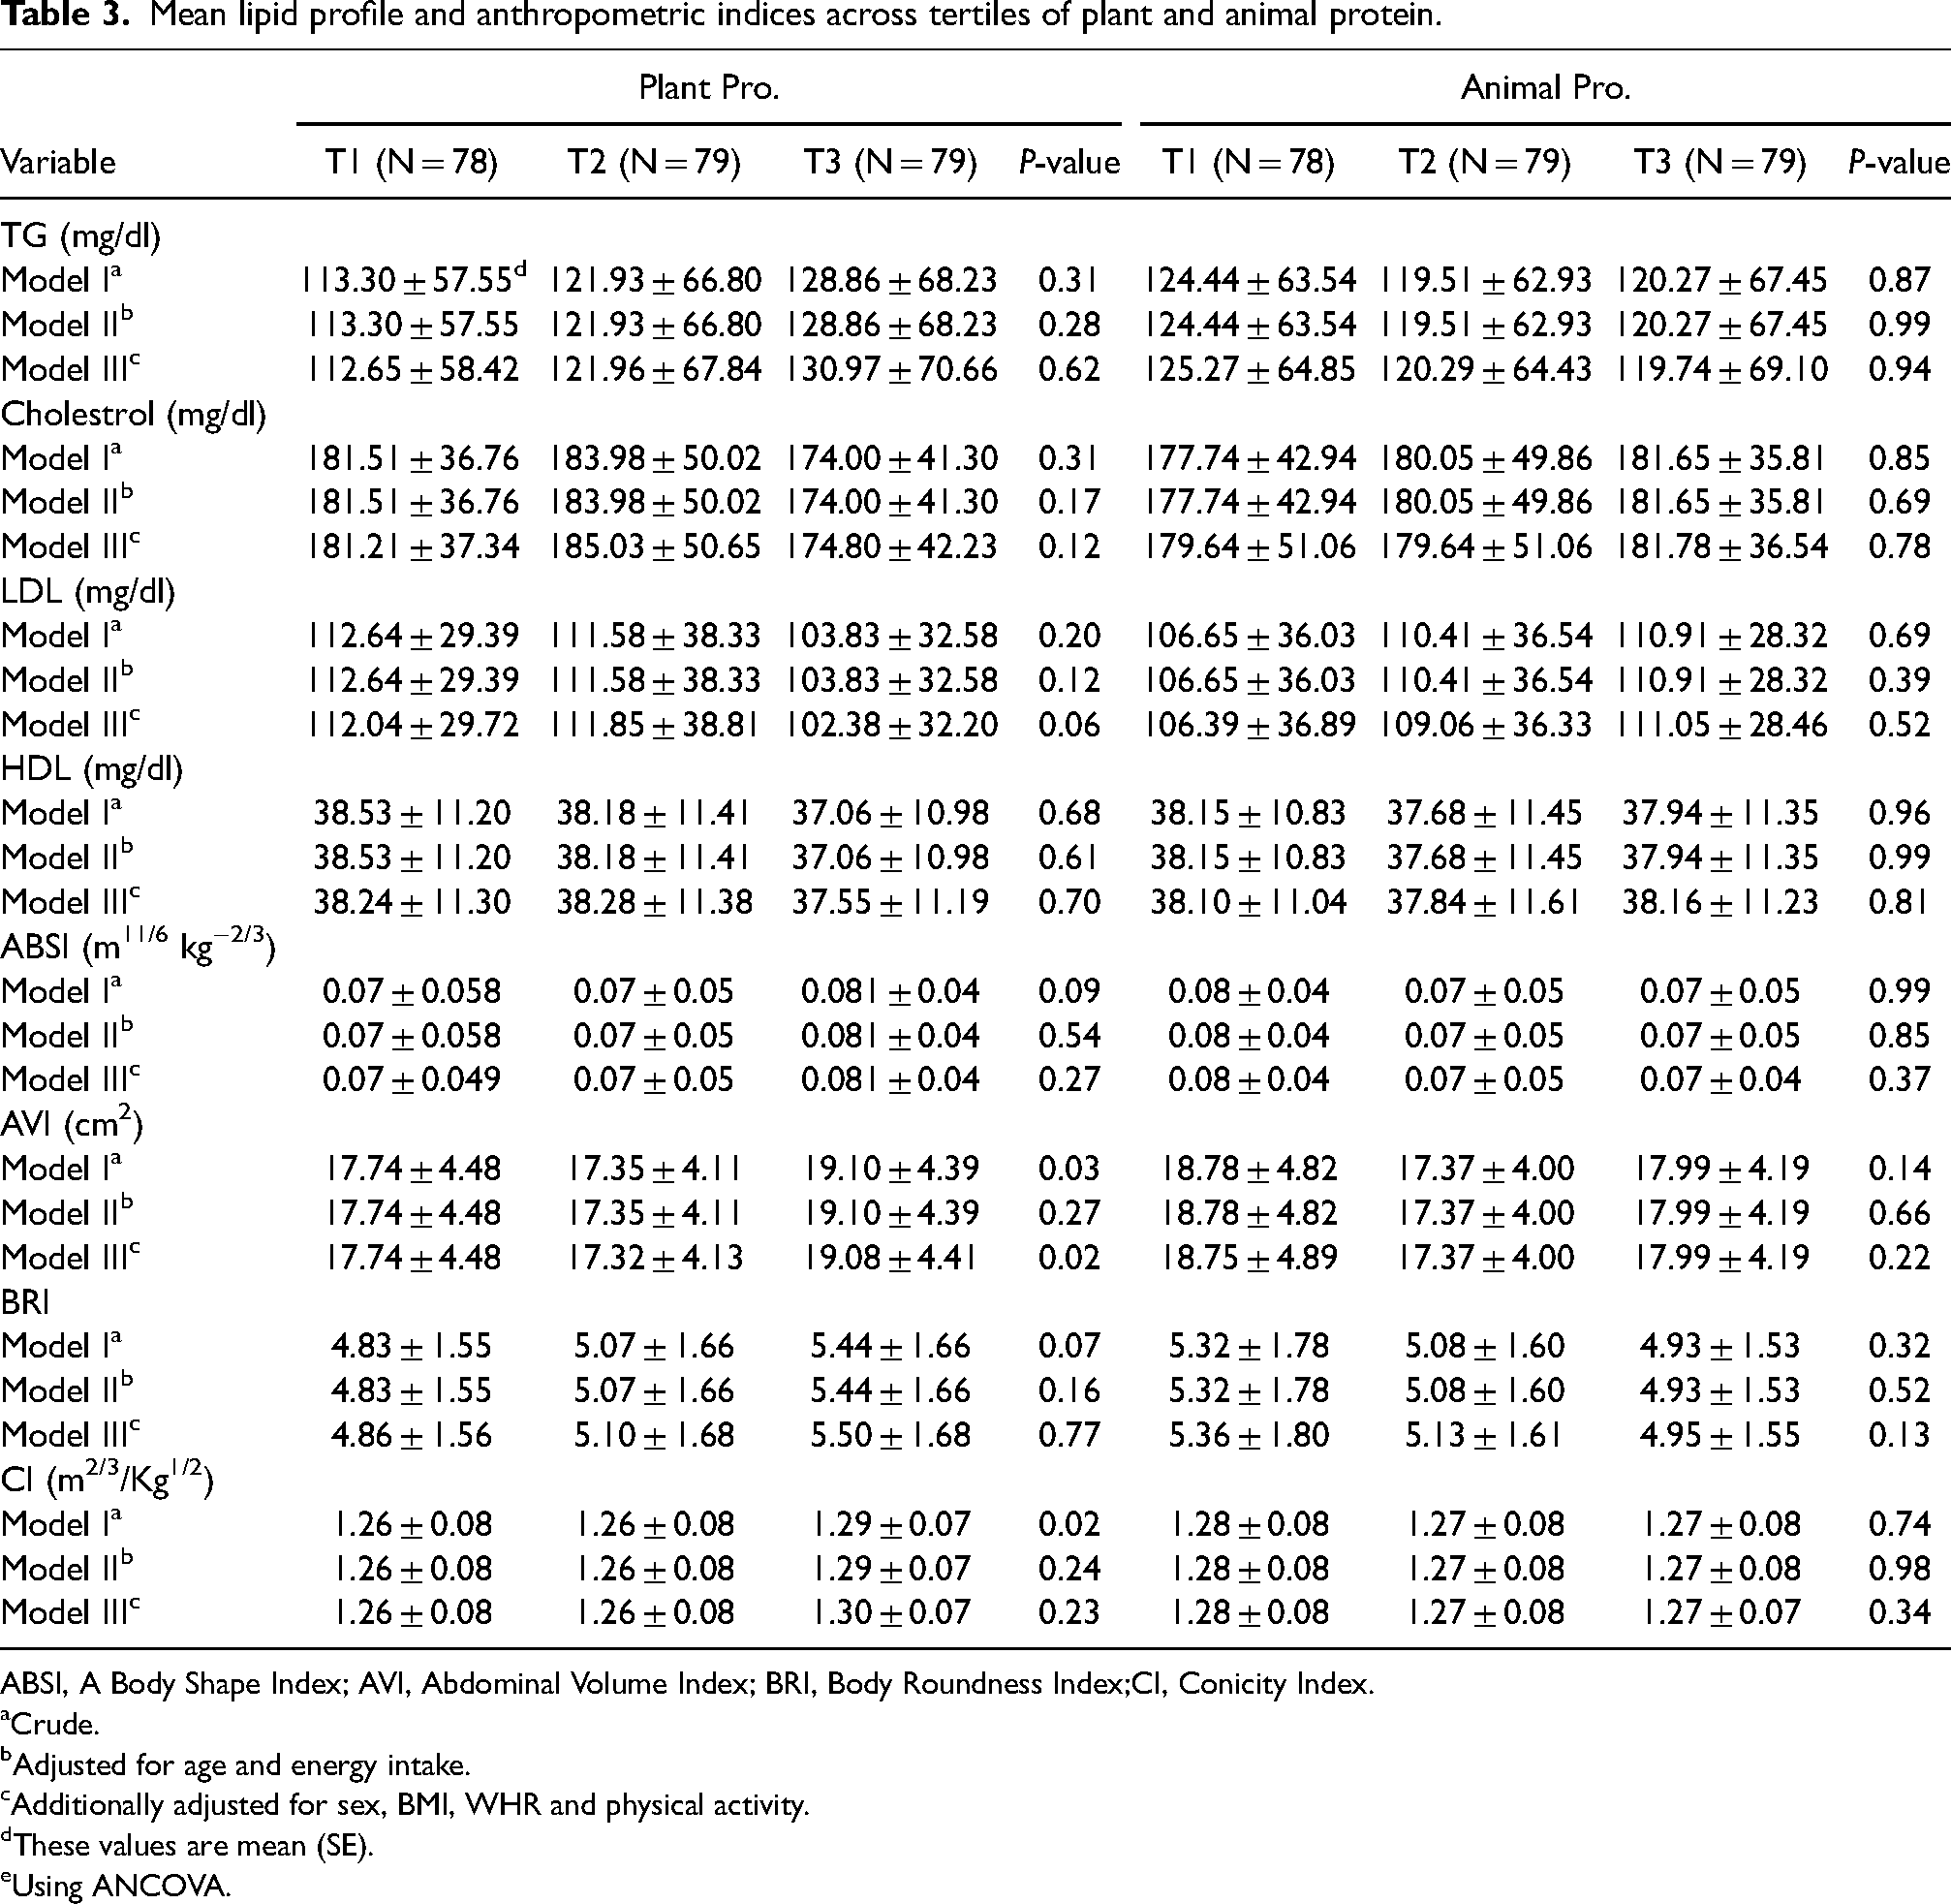
ABSI, A Body Shape Index; AVI, Abdominal Volume Index; BRI, Body Roundness Index;CI, Conicity Index.
Crude.
Adjusted for age and energy intake.
Additionally adjusted for sex, BMI, WHR and physical activity.
These values are mean (SE).
Using ANCOVA.
As presented in Table 4, in the crude model and fully-adjusted model, more consumption of plant proteins was associated with higher risk of having abnormal serum TG (OR = 2.31; 95% CI: 1.08, 4.95; P = 0.03 and OR = 2.39; 95% CI: 1.03, 5.15; P = 0.04) which faded away after adjusting for confounders (OR = 2.20; 95% CI: 1.01, 4.75; P = 0.05).
Crude and multivariable-adjusted odds ratios and 95% CIs for lipid profile and anthropometric indices across tertiles of plant and animal protein.
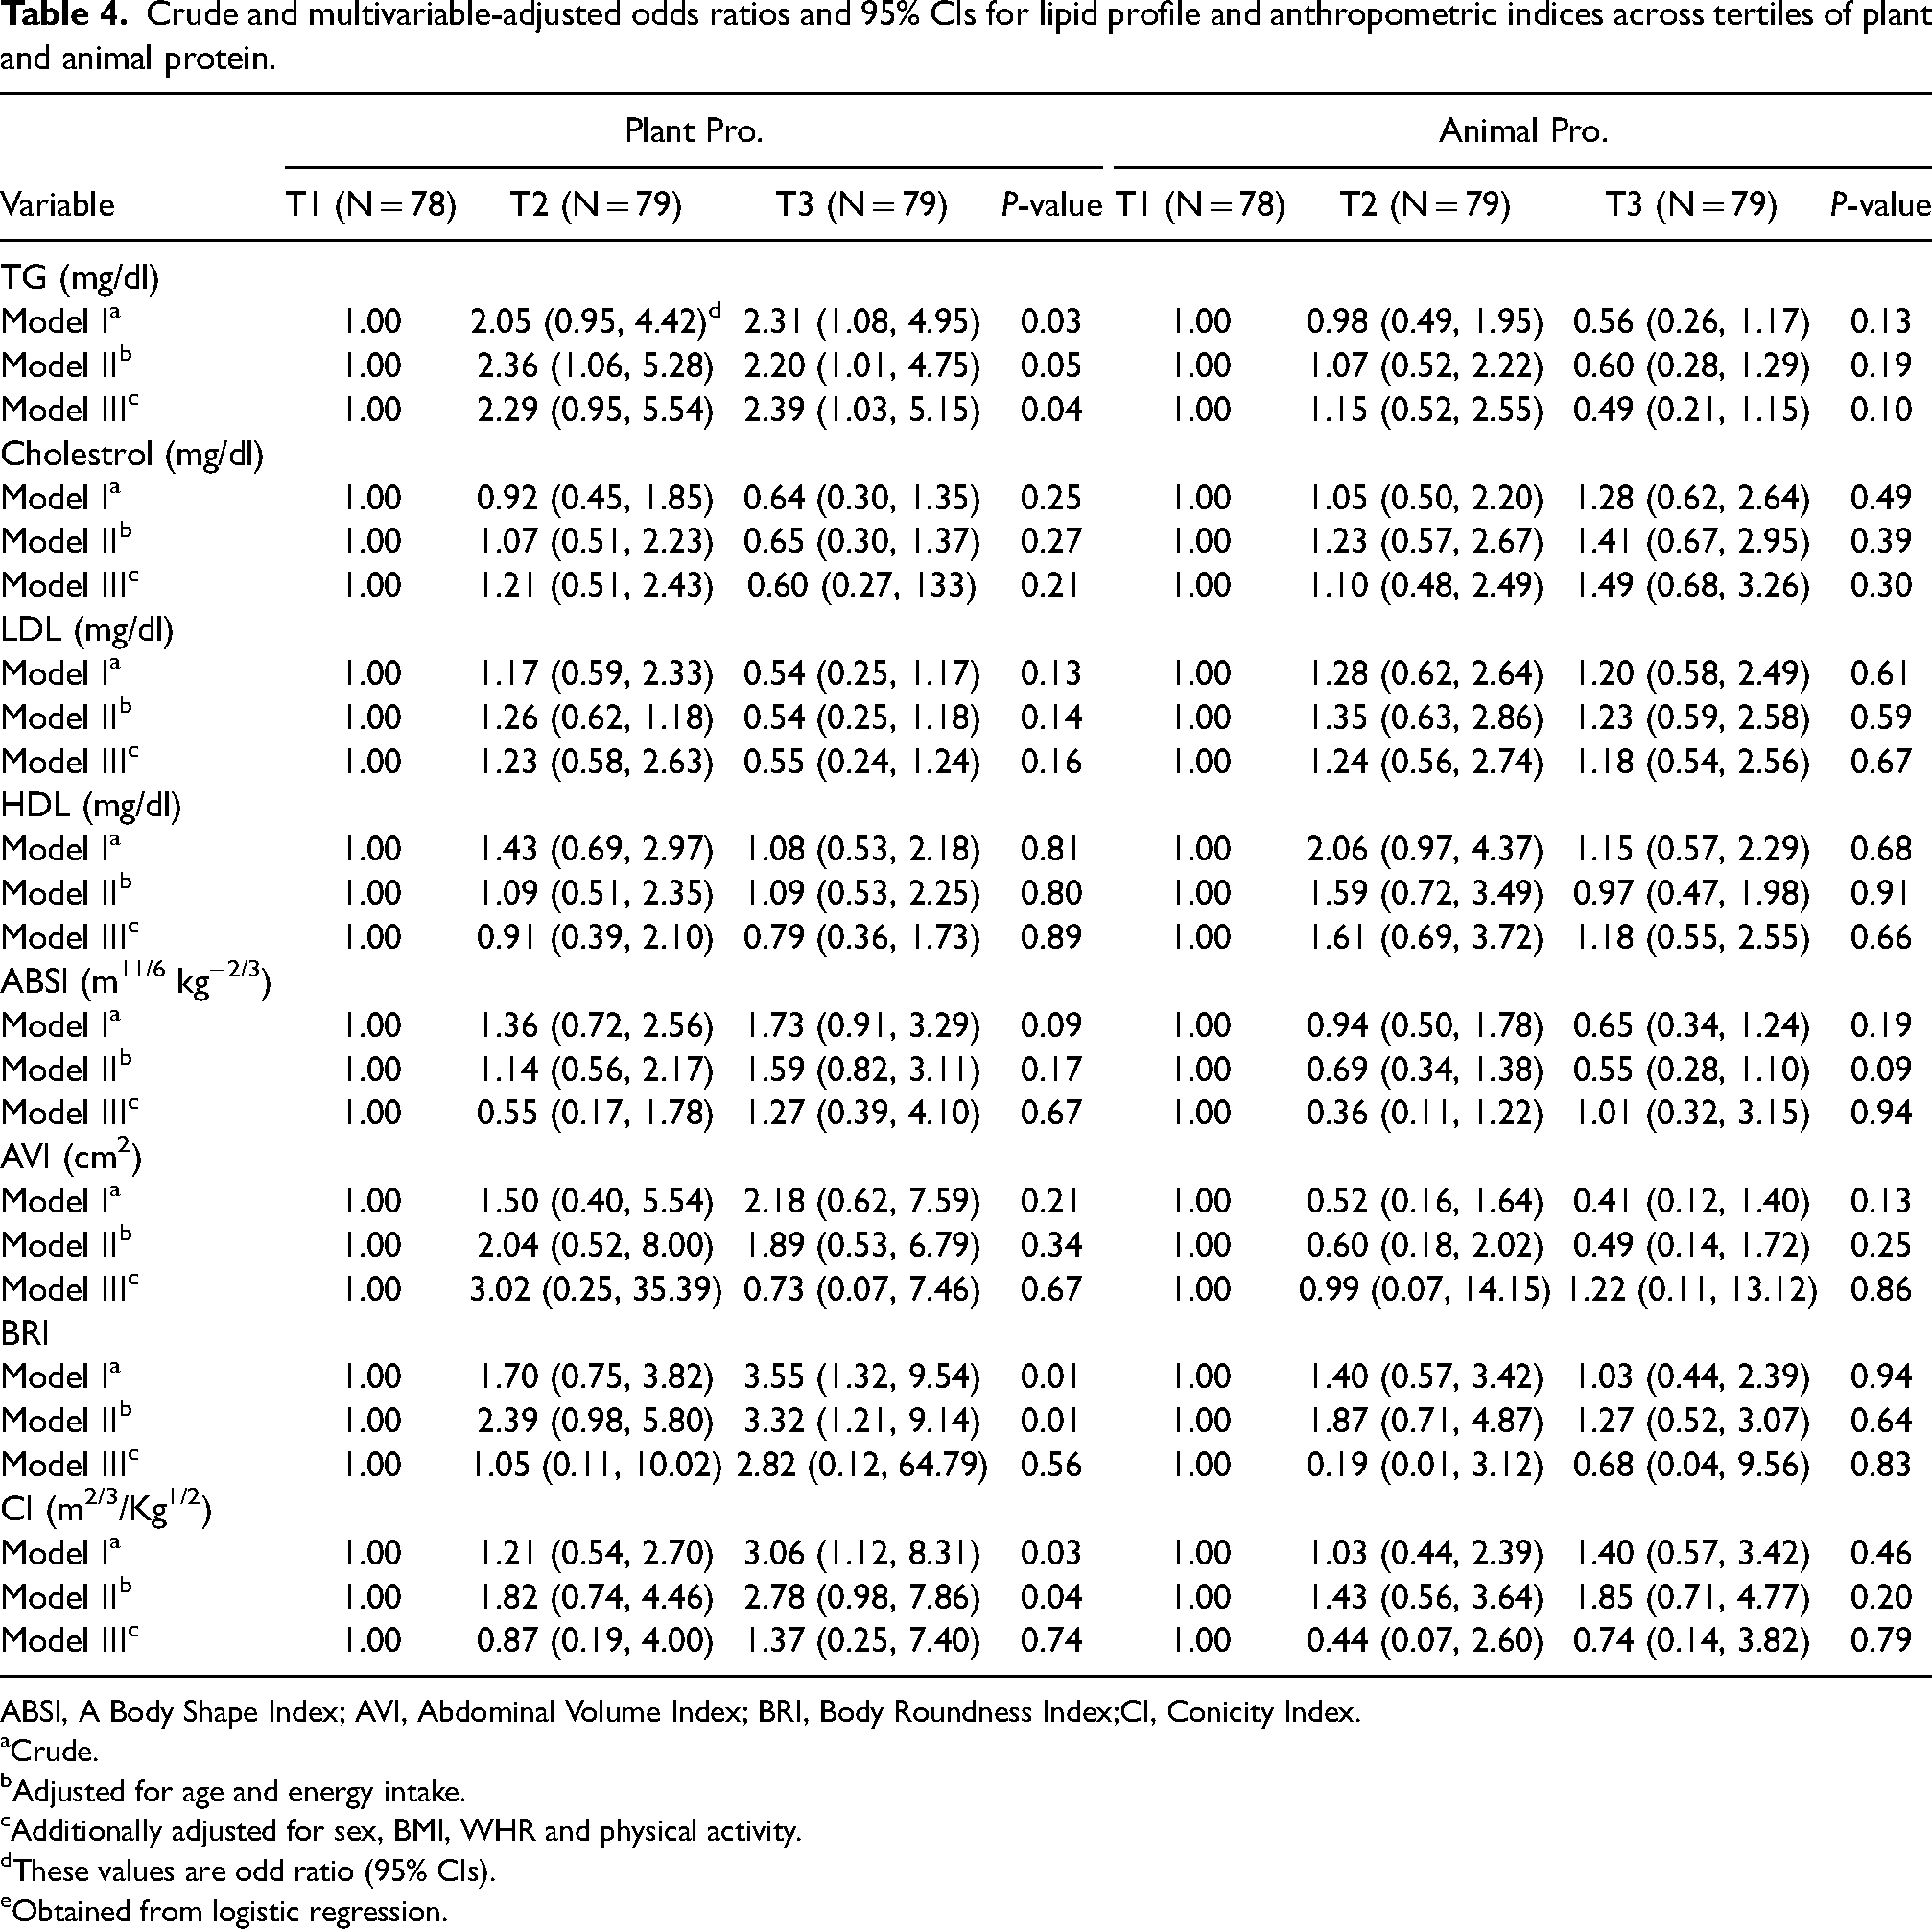
ABSI, A Body Shape Index; AVI, Abdominal Volume Index; BRI, Body Roundness Index;CI, Conicity Index.
Crude.
Adjusted for age and energy intake.
Additionally adjusted for sex, BMI, WHR and physical activity.
These values are odd ratio (95% CIs).
Obtained from logistic regression.
There was a significant direct association between plant proteins intake and BRI in the curd model (OR = 3.55; 95% CI: 1.32, 9.54; P = 0.01) and after adjustment for age and energy intake (OR = 3.32; 95% CI: 1.21, 9.14; P = 0.01), but not after additionally adjustment for sex, BMI, WHR and physical activity (OR = 2.82; 95% CI: 0.12, 64.79; P = 0.56). Also, those with the last tertile of plant proteins had higher CI compared to the first tertile in the crude model (OR = 3.06; 95% CI: 1.12, 8.31; P = 0.03) and after adjusting for age and energy intake (OR = 2.78; 95% CI: 0.98, 7.86; P = 0.04). But this difference was not significant in fully-adjusted model (OR = 1.37; 95% CI: 0.25, 7.4; P = 0.74). No difference was observed among the tertiles of animal proteins for TG, TC, HDL-C, LDL-C, ABSI, AVI, BRI and CI.
Discussion
In our study, more intake of plant proteins was associated with higher AVI, CI, and BRI. Most of the previous investigations are not consistent with our results and reported a negative association between intake of plant proteins and obesity (Lin et al., 2011; Park et al., 2018). Yi Lin et al. observed that the inverse association between plant protein intake with BMI z-score and body fat percentage (BF%) was stronger compared to animal protein intake, and also there was a direct relationship between BMI and BF% with energy intake from animal proteins (Lin et al., 2015). A justification for these findings is that more consumption of protein from plant sources is connected to a lower intake of total fat, saturated fat, cholesterol, and energy (Berkow and Barnard, 2006; Gardner et al., 2005). On the other hand, the probable reason for increasing obesity index with more intake of plant proteins could be that more intake of plant protein is along with more consumption of carbohydrates, and these excess amounts of carbohydrates can be converted into fat in the body and accumulate in different areas, especially the abdomen and increase the amount of BRI index (Adhikari et al., 2016; Febriani et al., 2019).
According to our findings, association of animal protein intake and any of the ABSI, AVI, BRI and CI was not significant, which could be due to the variety in culture or even quantity of protein intake in different populations. For example, Laura Pimpin et al. reported that more intake of dairy products can cause more weight gain compared to other protein sources (Pimpin et al., 2018).The results of other studies on the effect of animal proteins on obesity have also been very contradictory. Berryman et al. showed that more intake of animal proteins could reduce the risk of obesity and weight gain (Berryman et al., 2016). Another study by Umesawa et al. reported no relationship between animal protein intake and BMI, while there was negative correlation between consumption amount of protein and BMI (Umesawa et al., 2009). An increase of animal protein intake for seven years caused a rising risk of obesity in Bujnowski et al. cohort study (Bujnowski et al., 2011). Some other studies demonstrated that animal protein intake was significantly related with fat mass and even could increase abdominal obesity (Alkerwi et al., 2015; Segovia-Siapco et al., 2020). It is suggested that high amount of protein intake from animal sources could enhance energy consumption, and therefor increase the risk of obesity (Arango-Angarita et al., 2019; Rouhani et al., 2014). Another mechanism is the positive connection between animal protein and stimulation of insulin and insulin-like growth factore-1 (IGF-1) (Voortman et al., 2016), and their roll in human growth and reproduction of adipocytes (Wabitsch et al., 1995).
In the current study being in the highest tertile of plant protein was related to more TG level. But most previous studies were about benefits of plant protein sources on lipid profile are stronger, and recommended consumption of them for prevention and control metabolic syndrome (Anderson et al., 1995; Bederova et al., 2000; Esmaillzadeh et al., 2006). A systematic review and meta-analysis study that evaluated 112 randomized controlled trials, concluded that replacement of plant protein for animal protein could reduce level of LDL-C by 0.16 mmol/L and non–HDL-C by 0.18 mmol/L (Li et al., 2017). Several different mechanisms can play roll in lipid-lowering effects of plant proteins, one of them is that plant proteins can transport antiatherogenic compounds (fiber, sterol and stanols) in blood (Katan et al., 2003; Mensink et al., 2003), also proteins from plant sources are rich in arginine that has shown some effects in cholesterol level via nitric oxide pathway in animal studies (Park and Liepa, 1982; Sánchez et al., 1988).
In our study Information about the effects of animal proteins on lipid profiles was not significant. According to previous studies, European countries concluded animal protein consumption had an inverse relationship with TG, TC, and very low-density lipoprotein cholesterol serum concentration (Lin et al., 2015). But Shuangli Meng et al. in their recent study observed a direct relationship between animal proteins intake and LDL-C, non-HDL-C, and TC levels (Meng et al., 2021). Animal proteins are usually a good source of methionine and lysine amino acids, which have hypercholesterolemic in animal studies (Giroux et al., 1999). Another cause can be the change intestinal microflora in response to animal proteins, which ultimately produce compounds such as trimethylamine-N-oxide (TMAO), which is directly related to the increased risk of cardiovascular disease (Basciani et al., 2020; Richter et al., 2015).
Limitations and strengths
This study has some important strengths, first, we applied a valid FFQ for collecting dietary information that was appropriate for the Iranian population and according to their food habits. Second, we evaluated all of the data in two cured and adjusted model that helps reduce biases and increase the validity and reality of the results. Some of the limitations of this study are that we had no access to enough population, we had some difficulty completing a questionnaire for some people with weak memory and finally, the design of this study was cross-sectional and unable to confirm a causal relationship. Also, the results of the body composition analysis by bioelectrical impedance analysis (BIA) or dual x-ray are more accurate and reliable than what we have done, but we could not afford it.
Conclusion
In conclusion, we found that there is direct association between tertiles of plant protein and some anthropometric indexes such as AVI, CI and BRI. More consumption of plant proteins can be associated with higher blood triglyceride levels and further investigations are needed in future.
Footnotes
Acknowledgements
This work was supported by the Deputy of Research and Technology, Shiraz University of Medical Sciences, Shiraz, Iran.
Authors contributions
M.N designed the study protocol; A.K, M.N, K.L and S.G contributed to the data collection, data analysis, interpretation of results and and manuscript drafting; S.F contributed to the editing and revision of the manuscript. All authors read and approved the final version of the paper.
Availability of data and materials
Data available on request from the authors.
Declaration of conflicting interests
The author(s) declared no potential conflicts of interest with respect to the research, authorship, and/or publication of this article.
Ethical approval
The present study was approved by The Research Ethics Committee of Shiraz University of Medical Sciences, Shiraz, Iran (IR.SUMS.REC.1394.S146)
Funding
The author(s) received no financial support for the research, authorship, and/or publication of this article.