
Abstract
According to the information efficiency view, stock price synchronicity reflects the degree of integration of firm-specific information with market-level information. Stock price synchronicity is higher (lower) when there is a higher (lower) level of integration between the firm and the overall market information. As the disclosure of environmental, social and governance data provides more firm-specific, non-financial, value-relevant information to the market, stock prices reflect such information efficiently. It leads to more information efficiency and lower synchronicity of stock prices. Against this backdrop, the present study examines the relationship between ESG and its component scores and stock price synchronicity using a sample of 163 Indian companies reporting their ESG scores through the Thomson Reuters database from 2011 to 2021. The findings of the study confirmed that the ESG score and the scores of its components (except the governance score) have a significant negative impact on stock price synchronicity and a significant positive impact on idiosyncratic volatility. This is consistent with the information efficiency viewpoint, implying that ESG disclosure has value relevance in the capital market and that investors in the Indian market consider ESG information when making investment decisions.
Introduction
This study investigates the association between environmental, social and governance (ESG) scores and stock price synchronicity. Stock price synchronicity measures the proportion of systematic volatility compared to idiosyncratic volatility. In other words, synchronicity between stock prices and the overall market indicates how much firm-specific information is reflected in the market stock prices. As environmental, social and governance issues are considered important, investors pay attention to the ESG data of companies. ESG investment offers lower volatility (Torre et al., 2020), long-term wealth creation (Vinodkumar & Alarifi, 2022), fewer capital constraints (Cheng et al., 2014) and more. In sustainability reporting, India has joined other nations in emphasizing transparency and holistic presentation. The authors have shown an interest in studying a rapidly expanding market like India.
Due to the value-relevance of non-financial information, firms that publish their sustainability practices have more informative stocks than others (Chauhan & Kumar, 2018). Thus, when firm-specific, value-relevant information is disclosed, their stock prices respond differently than their peers. These shares have less market synchronization. The current study suggests that ESG score (a proxy for sustainable performance) and stock price synchrony are inversely related.
ESG is made up of three parts: environmental sustainability, social sustainability and governance sustainability. The market has information on the value of the ESG components. The present study examines the association of ESG and its components with stock price synchronicity. This increases the scope of the study to analyse the value-relevance of sustainability disclosures at a granular level. This is relevant when businesses prioritize environmental protection; they increase their market value and gain credibility as ethical companies. More and more businesses are becoming socially conscious by striving to create a stakeholder ecosystem with greater respect for human rights, emphasis on the improvement of health and safety measures and diversity at the workplace, following ethical business practices like producing high-quality goods and services, ensuring customer health and safety, data privacy, and so on.
In recent years, there has been a marked rise in the importance placed on social sustainability by investors. It is also well-established in the literature that better corporate governance improves transparency and lowers information asymmetry (Ajinkya et al., 2005; Chung et al., 2010; Karamanou & Vefeas, 2005; Leuz et al., 2003). Our research suggests that the market gets more valuable information and hence observes less stock price synchronicity if companies have higher corporate governance scores. We hypothesize a negative relationship between ESG and its components and stock price synchronicity because ESG information is value relevant.
The study of relevant literature reveals that no research has investigated the effect of ESG investment on the synchronization of stock prices. There are studies on ESG investment in emerging countries such as South Africa, Taiwan, Saudi Arabia and India. Previous research studied the ESG implications of the stock market by using beta (Lueg et al., 2019); stock return, market model’s alpha (Chen & Yang, 2020); market value (Bodhanwala & Bodhanwala, 2019; Chauhan & Kumar, 2018); credit rating (Bhattacharya & Sharma, 2019); CAPM returns and historical volatility (Bhattacharya & Sharma, 2019; Meher et al., 2020).
This is the first study to examine how ESG issues affect stock price synchrony. Analysing the relationship between ESG factors and stock price synchrony can help determine whether the market can effectively communicate a company’s sustainability practices. Empirical studies proved that developing markets are more synchronized than developed markets (Khandaker & Heaney, 2008). The authors are encouraged to explore this avenue of research in India, one of the fastest-growing marketplaces in the world.
There are 163 Indian companies that have provided ESG data through the Thomson Reuters database between 2011 and 2021. These companies make up the sample of this study. Stock price information and other firm-specific data were obtained from the CMIE Prowess database. ESG SCORE, along with the age of the firm, the volume of stock trading, standard deviation, kurtosis of stock returns, market capitalization and price-to-book value are the predictor variables used in this study. All these factors have a statistically significant impact on synchronicity. However, the governance score is non-significant. Voluntary disclosure of ESG information has been shown to indicate market information efficiency (Beatty & Ritter, 1986; Beatty & Welch, 1996). Thus, ESG ratings provide additional firm-specific information, which helps efficient stock price discovery.
Alternative definitions of stock price synchronicity have been used to assess the robustness of baseline regression findings. The ESG score and its components improve idiosyncratic volatility, except for governance. As firm-specific information increases, so does idiosyncratic volatility. ESG disclosure makes market price-sensitive and firm-specific information available, increasing information efficiency. It also suggests that non-financial information is also crucial to investment decisions.
The study has implications for multiple stakeholders. Market players should consider the negative association of ESG with synchronicity and the positive association with idiosyncratic volatility. Investors prefer such stocks for portfolio diversification. Reduced emissions, resource efficiency and product development can influence investment decisions. A firm that employs people from the local community invests in local infrastructure, utilizes locally produced resources and supports diversity at the workplace is more likely to attract investment. Companies with a human rights abuse track record see larger stock price discounts. Stock prices may be made to reflect information related to sustainability due to the information efficiency of the capital markets; as a result, authorities should endeavour to strengthen company disclosure rules in this area.
The rest of the article is organized as follows: the second section discusses the theoretical background and develops the hypotheses; third section is devoted to the literature review; fourth section shows the identified research gaps and the motivation for the study; fifth section highlights the objectives of the study; the sixth section outlines the research methodology; seventh section presents the findings of the analysis and the eighth section concludes and states the implications of the study.
Theoretical Background and Hypothesis Development
Sustainable Performance of a Firm and Its Stock Price Synchronicity
The degree to which stock market prices can diverge from one another reflects the extent to which markets are integrated (Durnev et al., 2004). So, the degree to which firm-specific information is reflected in market stock prices may be measured by observing the degree of synchronization between stock prices. Investors are paying more attention to the firms’ ESG information, possibly due to the growing significance of ESG considerations. It has caused investors to focus on the significance of firm ESG information, leading ESG to gain momentum in financial markets.
The benefits of ESG investment include lower volatility (Torre et al., 2020), long-term wealth creation (Vinodkumar & Alarifi, 2022) and fewer restrictions on capital (Cheng et al., 2014), among other benefits. Consequently, empirical evidence suggests that firms with higher ESG ratings have more robust investment prospects (Meher et al., 2020). There is a rising need for ESG reporting. External stakeholders’ analyses state the enormous potential that ESGs provide for risk-return trade-offs and sustainable growth. Investor interest in ESG data is primarily motivated by stakeholder pressure, especially from non-governmental organizations and growing government regulation (Grewal et al., 2017). In recent years, India has joined other countries in prioritizing transparency and integrity in its sustainability reporting. In this context, the authors are interested in researching a growing market like India.
Compared to other stocks in the market, stocks of the companies that report their sustainability practices provide more information because of the value-relevance of non-financial information (Chauhan & Kumar, 2018). Thus, when additional firm-specific information with value significance is released, stock prices behave in a way that is different from the stocks in the peer group. As a result, there is less market harmony among these equities. In light of this, the current study suggests an inverse relationship between the ESG score (a proxy for sustainable performance) and stock price synchronicity.
H1: ESG Scores of firms are negatively associated with stock price synchronicity.
ESG is made up of three parts: environmental sustainability, social sustainability and governance sustainability. The market has valuable information on ESG components in their individual capacity also. By regressing synchronicity on each of the three components of ESG, this study further examines the validity of the findings regarding the relationship between the overall sustainability score and stock synchronicity.
Environmental Sustainability and Stock Price Synchronicity
Thomson Reuters’ environmental pillar score evaluates the sustainability of companies. This score addresses resource use, product innovation and emission reduction. The score also measures an organization’s commitment and effectiveness in decreasing its production and operational environment impact. Environmentally sustainable operations improve the companies’ public image and reputation as responsible firms, helping them increase market share and income. The firm’s environmental sustainability efforts can also save operating costs and boost efficiency. Thus, stocks react positively to corporations’ environmental sustainability performance (Jacobs et al., 2010). India emits CO2 third after China and the US. 1 The next expansion phase must be sustainable as the country rises in the world order and becomes one of the fastest-growing economies. Today, sustainability is discussed in boardrooms across companies, and the common belief is that sustainability and profitability can coexist. In a recent Oxford Economics and SAP (NYSE: SAP) research, 62% of Indian companies said it is easy to be sustainable and profitable. Against this background, gauging the capital market’s response to a company’s environmental sustainability performance becomes more important. We argue that the ‘environmental score’ diminishes stock price synchronization because it has value relevance in the market.
H2: The environmental component score of ESG is negatively associated with stock price synchronicity.
Social Sustainability and Stock Price Synchronicity
More firms are taking social issues seriously. ESG concerns include diversity, equality and inclusion, health and safety, employee engagement and happiness, corporate ethics, labour rights and the organization’s social impact. Investor perception of the criteria necessary for social sustainability is becoming increasingly significant. Publishing a social sustainability score can potentially strengthen the market signal of social sustainability positively. A higher social sustainability score indicates that more information is being disclosed than is typically found in financial statements. Reports on a company’s social sustainability practices are indicators of the company’s dedication to sustainable development goals (Dhaliwal et al., 2011). It improves the investors’ understanding of the firm, reducing uncertainty over the company’s future prospects. More often than not, social sustainability initiatives are left to the top management’s discretion and usually require a surplus of resources. Hence, the public release of a company’s social sustainability score may send investors a positive message about its financial standing and the management’s outlook, thereby increasing its stock price (McGuire et al. 1988).
The aforementioned discussion motivates us to propose the value-relevance of social sustainability:
H3: Social component score of ESG is negatively associated with stock price synchronicity.
Sustainable Corporate Governance and Stock Price Synchronicity
Governance scores include strategy, management quality and shareholder satisfaction. A company’s strategy score indicates how much it actively supports economic (financial), social and environmental factors in its daily operations and decision-making. Management scores measure how well an organization follows corporate governance practices. The shareholders’ score measures the extent to which a company respects its shareholders’ rights and defends itself from takeovers. Managers in organizations with excellent governance may not feel the need to withhold information. Thus, improved governance should reduce information asymmetry and increase corporate transparency (Chung et al., 2010; Leuz et al., 2003). Research suggests that more robust governance leads to more disclosure (Ajinkya et al., 2005; Karamanou & Vefeas, 2005). Against this backdrop, we propose that the better the corporate governance score, the lower the stock price synchronicity. The corporate governance score provides more value-relevant information to the market.
H4: The governance component score of ESG is negatively associated with stock price synchronicity.
Hypothesized Relationship of Controlling Variables with Stock Price Synchronicity
The age of the business affects the stock returns’ systematic and unsystematic risks (Fink et al., 2004). Empirical evidence suggests that mature firms demonstrate more market synchronization, acquire a better market reputation and a competitive advantage over time, and tend to attract more passive funds from investors. Young businesses are riskier; thus, the market discounts heavily on any firm-specific negative information. The volume of transactions increases the liquidity of the stocks in the market. Like institutional investors, large-scale investors prefer to invest in stocks with more liquidity. Liquidity enables an easy entry base for investors and is, thus, most suitable for short-term investors. Hence, we hypothesize a positive association of liquidity with stock price synchronicity.
Standard deviation, skewness and kurtosis characterize the distribution of stock returns. Stock standard deviation indicates the extent to which investment returns differ from the mean of the probability distribution of investments. Investors might expect frequent small profits and a few huge losses with equities that show negative skewness. For investors, high kurtosis of the return distribution curve indicates price movements (positive or negative) away from the average investment returns. Thus, high-kurtosis investments may have extreme price volatility. Standard deviation, skewness and kurtosis have also been studied for investing implications (Corrado & Su, 1996; Jondeau & Rockinger, 2003; Kim & White, 2004; Mills, 1995;). So, the empirical model of the present study uses standard deviation, skewness and kurtosis as controlled variables to examine the link between ESG and stock price synchronicity.
Large-sized companies are more liquid and thereby attract more investors. Institutional investors favour large-cap funds. Due to stock liquidity, passive funds prefer large-cap funds. (Huang & Masulis, 2003; Sadorsky, 2008) Thus, the market capitalization may positively affect stock price synchrony. Price-to-book value (PBV) ratio reflects either undervaluation or overvaluation relative to the intrinsic value or book value (Penman et al., 2007). Company fundamentals drive intrinsic value. High PBV stocks attract value investors, thus reducing information asymmetry. Because of the volume of trade in these stocks, they tend to move in tandem with the market. Thus, PBV may positively affect stock price synchronicity (Penman et al., 2007).
Review of Literature
There are three parts to the review of the literature. Literature from developed markets is covered in Part 1, literature from emerging markets in Part 2, and literature from the Indian market in Part 3.
Literature from Developed Markets
From the developed market, a literature review has identified three studies that examine the stock market implications of ESG. These studies are those by Amel-Zadeh and Serafeim (2018) from the US market, Schiehll and Kolahgar (2021) from the Canadian market and La Torre et al. (2020) from the European Union. Amel-Zadeh and Serafeim (2018) examined the benefits of ESG-based investing decisions in the US market. They found that ESG is better at assessing risk. According to the study, investors tend to apply ESG for positive stock screening in combination with a holistic company valuation methodology. In the literature review by Schiehll and Kolahgar (2021) from Canada, the value, relevance and economic importance of information on ESG were argued. The findings support the claim that ESG components have different effects, with the social component having the greatest impact. La Torre et al. (2020) examined how ESG factors impact stock performance. Using a two-step approach, the research examined Eurostoxx50 firms’ ESG performance from 2010 to 2018. Eurostoxx50 includes 50 stocks from 11 Eurozone countries. The study uses monthly quantitative evaluations, scorings and qualitative judgments to classify companies based on ESG commitments. The study found no correlation between Eurostoxx50 firms’ ESG commitments and stock performance.
Literature from Emerging Markets
The literature review has also identified three studies from emerging markets examining the stock market implications of ESG score disclosure. Lueg et al. (2019) from South Africa, Chen and Yang (2020) from Taiwan, and Vinodkumar and Alarifi (2020) from the Saudi Arabian market.
Lueg et al., (2019) examined the bidirectional link between sustainability disclosure and risk in 59 publicly listed South African companies from 2012 to 2016. Sustainability, especially social sustainability, decreases the systematic risk in subsequent periods, according to fixed effects panel regression, statistical modelling and the Granger causality test. In addition, companies with higher overall, systematic and idiosyncratic risk tend to report on social concerns more often. The systematic risk reduces governance transparency. Lueg et al., (2019) employed stock beta to measure the overall risk using a standard deviation of annualized monthly returns. Our study applies the CAPM model to measure synchrony instead. CAPM predicted returns are the function of alpha, beta and risk premium. Synchronicity is a statistically more reliable indicator of stock price sensitivity compared to beta.
Chen and Yang (2020) found that Taiwanese investors overstate ESG information and respond differently to company news based on ESG rankings. According to the findings, investors are more optimistic about favourable news from firms with higher ESG rankings. Findings also reveal that investors tend to exaggerate environmental success compared to social or governance performance. Stock return, CAPM alpha and Fama-French three-factor alpha have been considered proxies for stock return performance by Chen and Yang (2020). In contrast, our research considers CAPM’s R-squared value. Basically, unsystematic risk is what Chen and Yang (2020) consider. On the other hand, our model considers a measure of stock-return synchronicity (a proxy of systematic risk).
Vinodkumar and Alarifi’s (2022) research examines the ESG scores of all the stocks in the Saudi Arabian market’s Tadawul All Share Index (TASI) using various ranking systems. ESG investment is a way for socially responsible investors to generate investment returns. The findings prove that ESG metrics are reliable, consistent and relevant indicators that foster the stock market’s sustainability in the long run.
Literature from the Indian Market
The Indian literature review has identified four studies relating to the stock market implications of ESG (Bhattacharya & Sharma, 2019; Bodhanwala & Bodhanwala, 2019; Chauhan & Kumar, 2018; Meher et al., 2020)
Chauhan and Kumar (2018) analysed data from a sample of Indian firms between 2007 and 2016 to determine how non-financial disclosure affected firm value. The non-financial disclosure is proxied in this study by the Bloomberg score presenting the extent to which a company discloses information on its environmental, social and governance practices. The study finds that non-financial disclosure results in a favourable valuation impact. Our research intends to investigate how ESG factors influence the synchronization of stock prices. The Tobins’ q index is a market measure of the performance of stock prices, while the synchronicity index measures the exposure of equities to systematic risk.
Bhattacharya and Sharma (2019) examine how ESG disclosure affects Indian company credit ratings. ESG scores and credit ratings are examined in 122 BSE-500 Index companies. Credit rating was regressed on the ESG score and a set of control variables. ESG performance and individual components (environment, social) were positive indications of creditworthiness. Governance scores positively and insignificantly affected credit rating. This unique study examines ESG reports and credit ratings. Our study analyses how ESG affects market risk via synchronicity. This study investigates ESG and credit rating risk, which, in turn, measures financial risk.
Bodhanwala and Bodhanwala (2019) aim to experimentally investigate whether corporate sustainability (CS) affects market value. The link is explored using Indian non-financial company panel data from 2010 to 2015. CS is positively associated with market value. The association between ESG and market value has been proved in the study by Chauhan and Kumar (2018) by evaluating the relationship in many contexts, including public and private sector enterprises, group affiliated firms and standalone firms, accounting measures of performance (such as ROA) and cost of capital. Chauhan and Kumar (2018) also controlled endogeneity with 2SLS regression.
Using panel regression, Meher et al. (2020) explored the relationship between ESG scores, CAPM returns and historical volatility. Only those companies that feature in the NIFTY100 Enhanced ESG Index are included in the sample. Among the 48 firms that comprise the NIFTY 100 Enhanced ESG, 43 were used from April 2014 through December 2018. The study regressed CAPM returns on ESG and its components in the same model without incorporating the controlling variables in the panel data regression. The findings are not statistically significant.
Research Gap and Motivation of the Study
The literature review proves that none of the studies have examined the ESG investment implications on stock price synchronicity. However, there are studies in emerging markets like South Africa, Taiwan and Saudi Arabia and some in the Indian market that suggest/support/investigate market implications of ESG investment. Previous studies examined stock market implications by applying measures like beta (Lueg et al., 2019), stock returns, market model’s alpha (Chen & Yang, 2020), market value (Bodhanwala & Bodhanwala, 2019; Chauhan & Kumar, 2018;), credit rating (Bhattacharya & Sharma, 2019), CAPM returns and historical volatility (Meher et al., 2020).
This is the first study in the research field to explore the consequences of environmental, social and governance factors on stock price synchronicity. In order to determine whether or not a market efficiently conveys information about a company’s unique sustainability practices, it is crucial to analyse the association between the ESG elements and the synchronicity of stock prices. Empirical research conclusively showed that emerging markets have a higher level of synchronicity than developed markets (Khandaker & Heaney, 2008). This is because emerging markets have lower information efficiency than developed markets. According to earlier research findings, incorporating information relevant to firms into stock prices is often insufficient in emerging markets (Durnev et al., 2004). In light of these findings, the authors of this study are inspired to examine whether the Indian market is efficient in sharing firm-level information on sustainability practices.
Objectives of the Study
This study aims to investigate the effect of ESG on the stock market. While controlling a set of factors that are unique to stock returns performance, the study aims to determine whether an ESG score and the scores of its components are associated with stock price synchronicity in the market. This study employed an alternate measure of stock behaviour known as idiosyncratic volatility, and its association with ESG and its three constituents has been examined.
Methodology of the Study
Data and Sample
Secondary data have been sought because of the nature of the study. The sample of the study is 163 Indian companies that have been reporting ESG data through the Thomson Reuters database from 2011 to 2021. The data on stock prices and other firm-specific variables have been collected from the CMIE Prowess’s database.
Synchronicity and its Determination
The current research employed stock price synchronicity as a dependent variable and measured R2 using the methodology of Roll (1988), Morck et al. (2000), Durnev et al. (2004) and Dai et al. (2018).

In the above equation, Rit shows the stock returns; Rft is the risk-free rate of return and Rmt is the market return represented through the Nifty-50 index. The difference between market return and risk-free return indicates the risk premium. The difference between stock return and risk-free return indicates the excess return expected by the investors for taking a risk by investing in the stock market.
Stock price synchronicity is computed from the R2 value derived from Equation (1). According to Piotroski and Roulstone (2004) and Morck et al. (2000), the following logarithmic procedure was used to determine price synchronicity:
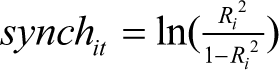
The logarithmic transformation has a distinct benefit over the R2 transformation. The finite range of R2 is 0 to 1, whereas the logarithmic transformation changes R2 into an unbounded continuous variable.
Description of ESG and Its Components
The ESG score is a combination of three pillars: environmental score, social score and governance score. The environmental score measures performance on three fronts: emissions, resource use and innovation. The emission reduction score reflects a company’s dedication and efficacy in lowering environmental emissions in production and working operations. Its resource use score reflects a company’s ability to improve its supply chain management and minimize its material, energy and water usage. A company’s ability to lower environmental costs and burdens for its consumers, thereby opening new market prospects, is reflected in its innovation score. This is accomplished through the development of novel environmental technologies and processes or the introduction of eco-designed goods.
The community score, human rights score, product responsibility score and worker score are the building blocks of the social score. How well a corporation does in terms of community involvement, environmental responsibility and ethical practices is reflected in its community score. The human rights score evaluates the efficiency with which a corporation complies with internationally recognized standards protecting basic human rights. A company’s ability to develop high-quality goods and services that consider its customers’ health, safety and privacy is reflected in its product responsibility score. The workforce score evaluates how well an organization meets the needs of its employees in terms of job security, workplace health and safety, diversity and inclusion, and professional growth.
CSR strategy, management quality and shareholder satisfaction contribute to a company’s overall governance score. A company’s CSR strategy score shows how much it actively promotes the idea that economic (financial), social and environmental considerations are factored into its day-to-day operations and decision-making. The management score quantifies how dedicated and successful an organization is in best adhering to corporate governance principles. How well a corporation treats its shareholders and how well it protects itself from takeovers are both factors that contribute to the shareholders’ score.
Econometric Modelling
Four empirical models were created to examine the proposed association between the ESG score and its components and synchronicity.
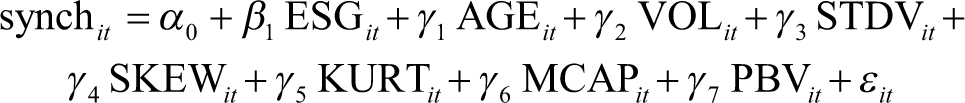
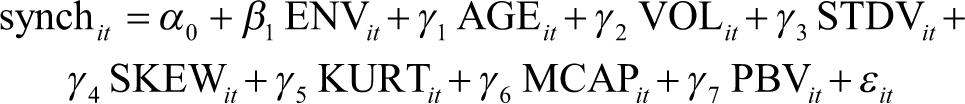

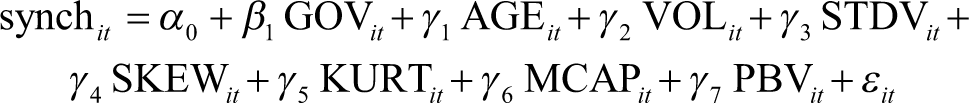
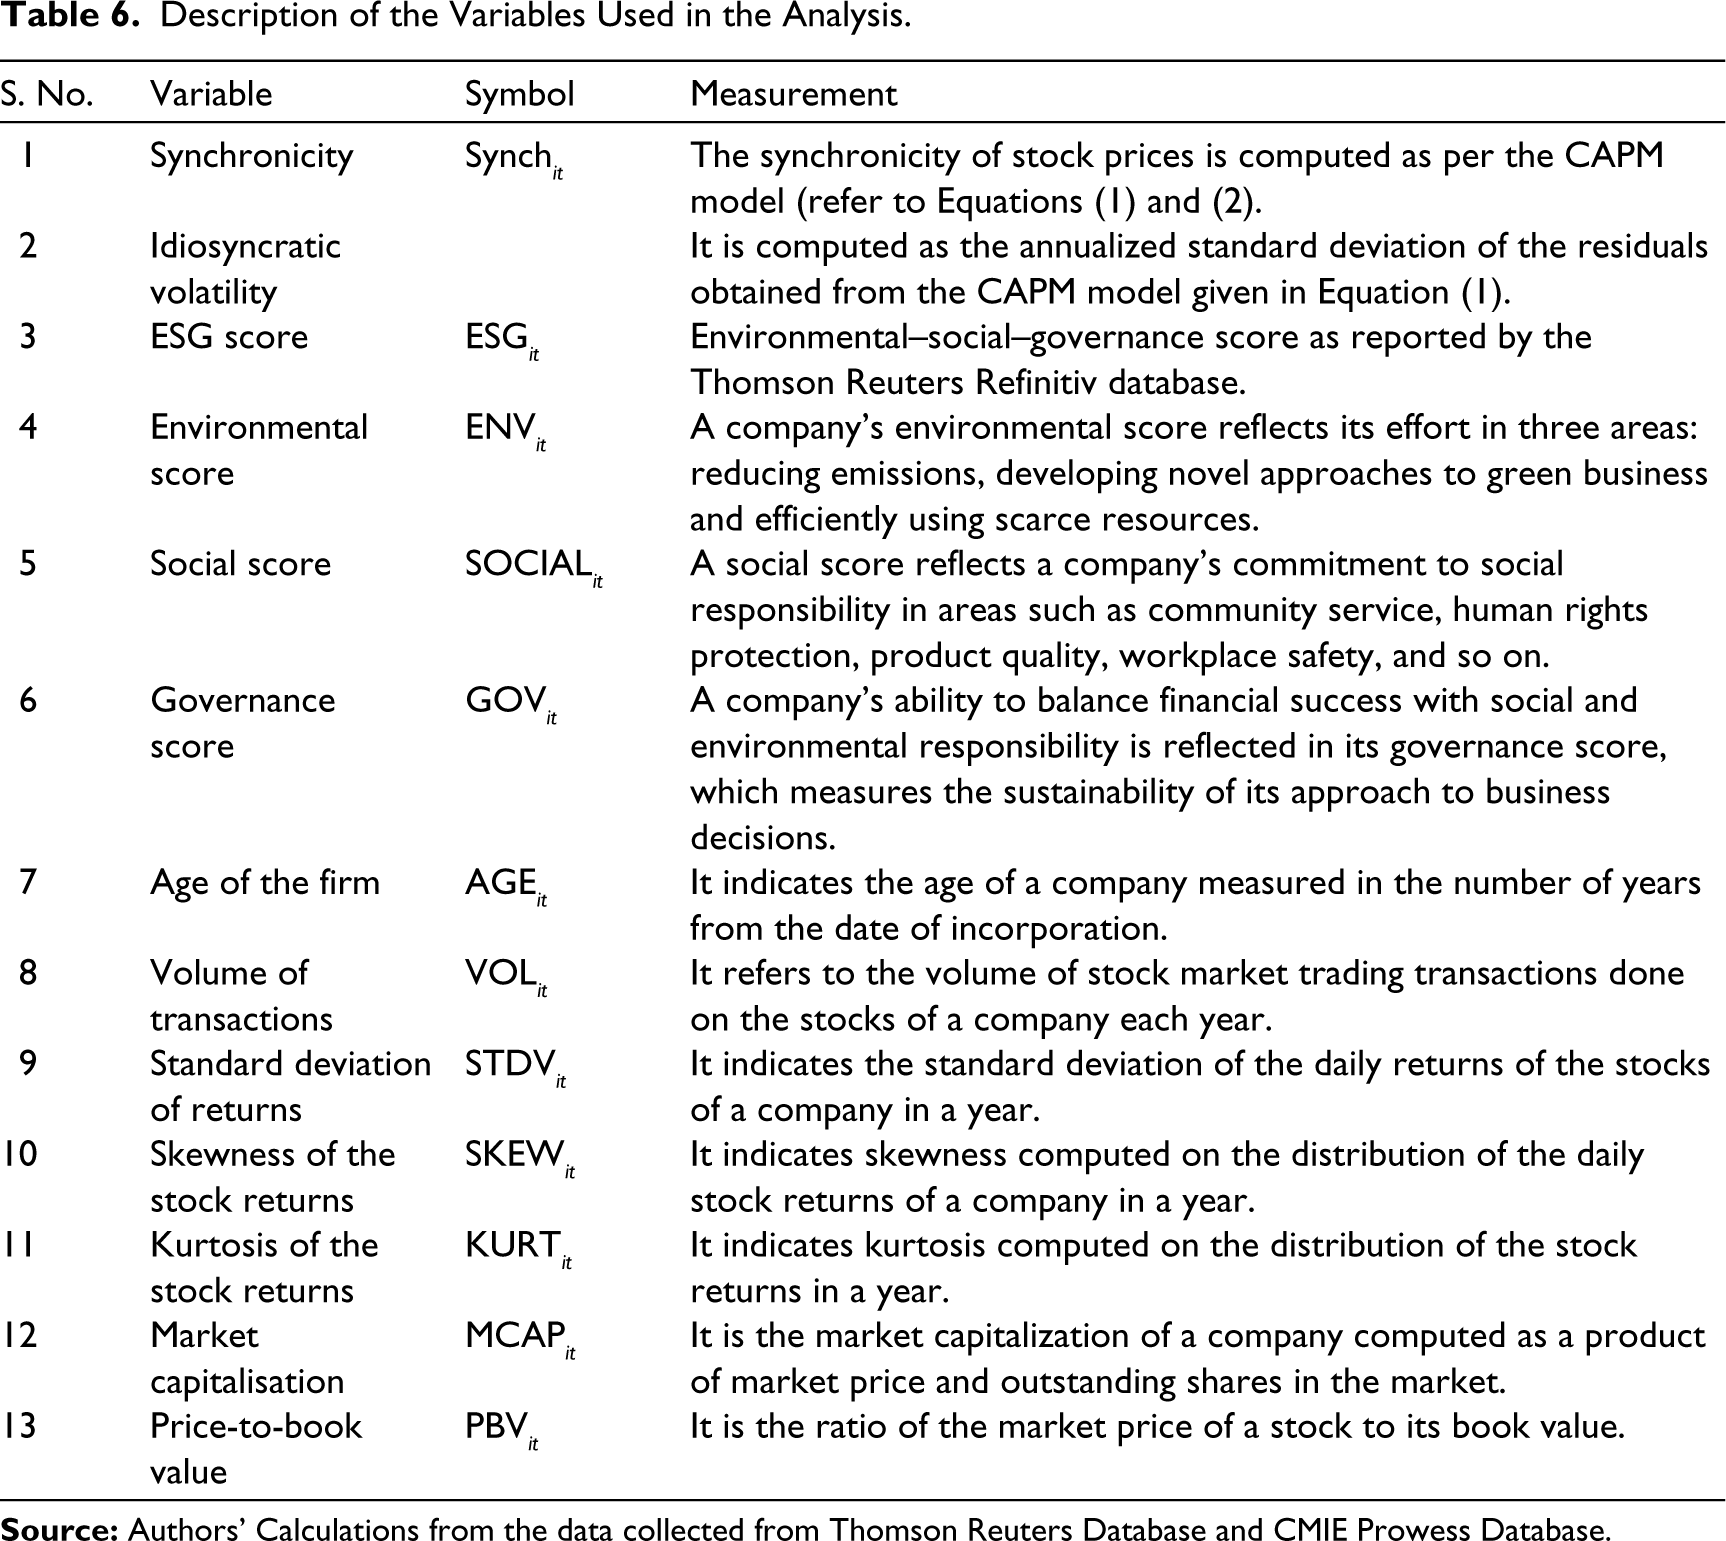
Synch it is the measure of synchronicity derived from Equation (2); ESG it indicates the environment–social–governance score as reported by Thomson Reuters Refinitiv; and AGE it , VOL it , STDV it , SKEW it , KURT it , MCAP it and PBV it are the model’s control variables. ENV it , SOCIAL it and GOV it are the three independent measures of EGG elements, respectively, in Equations (4), (5) and (6).
AGE it indicates the age of the firm from its year of incorporation, VOL it refers to the volume of transactions traded on a particular ESG stock; STDV it is the standard deviation of stock returns; SKEW it is the skewness of the stock returns; KURT it is the kurtosis of the stock returns; MCAP it is the market capitalization of the firm; and PBV it is the PBV ratio of the firm.
Empirical Results and Discussion
Descriptive Statistics and Correlation Analysis
Descriptive statistics of the variables employed in the regression model are presented in Table 1. Synchronicity has a mean value of −1.276 and a standard deviation of 0.881. Sample companies had an average ESG score of 48.48, with a standard deviation of 18.443. With a mean of 52.30 and a standard deviation of 21.395, the social score is the greatest of the three ESG metrics. The firms’ low performance in environmental sustainability is reflected in the low mean value of the environmental score, which is 38.39, with a standard deviation of 26.00. The log value of the trade volume in a company’s shares is represented by variable VOL in the stock market. Its mean is 14.81, and the standard deviation is 1.57.
Descriptive Statistics.
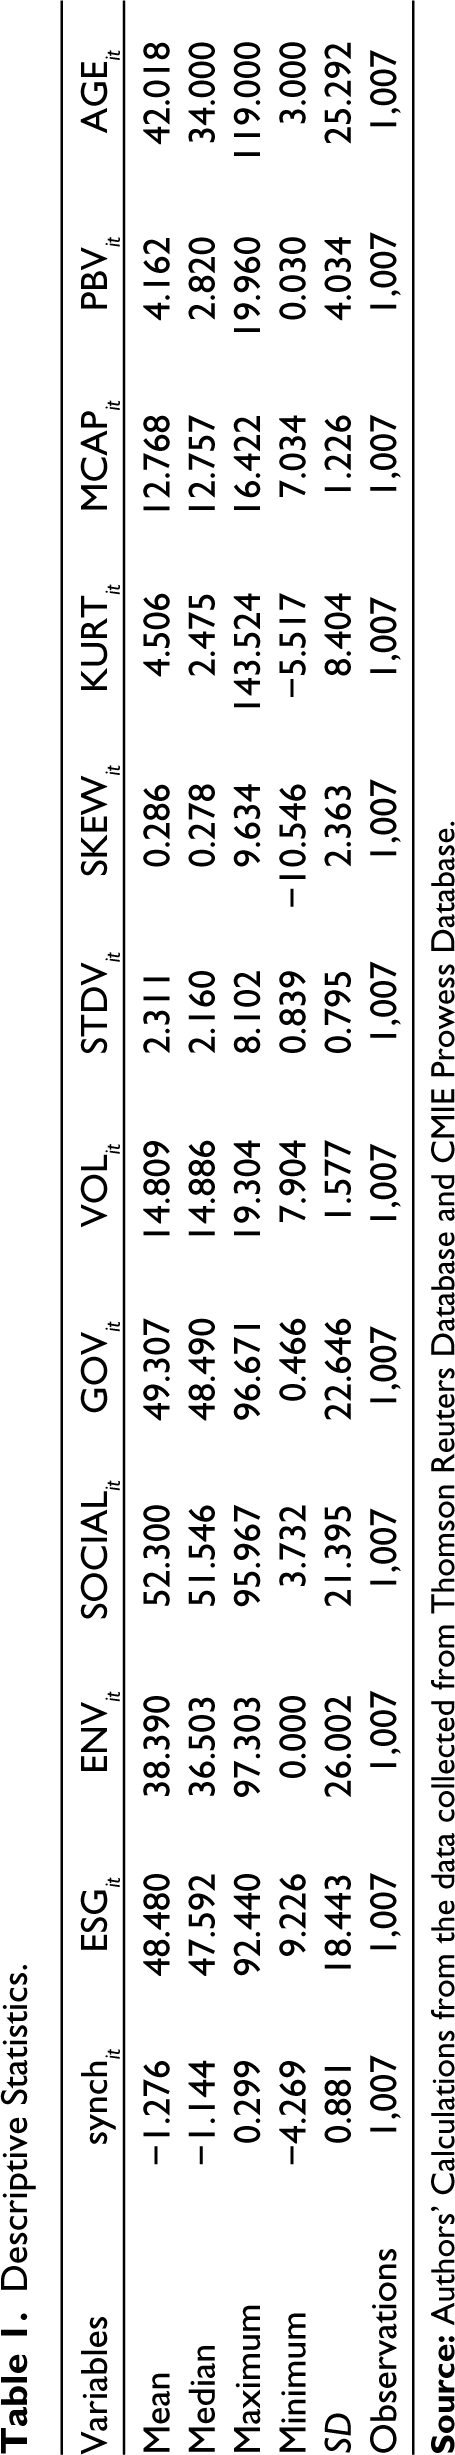
Standard deviation, skewness and kurtosis are all measures of scatter that may be applied to stock returns using variables STDV, SKEW and KURT. These values are calculated based on each company’s stock returns that are included in the sample for each year. A skewness of 0.286 is small on average. The big-size positive skewness of 9.634 indicates that the distribution’s right tail is exceptionally long for some stocks. In contrast, the high-size negative skewness of some stocks indicates that the left tail is exceptionally long. The average kurtosis of the sample businesses is 4.506. This shows that stock returns follow a leptokurtic distribution. The kurtosis median score is 2.475, which means that roughly half of the businesses in the sample do not have any influential outliers. Contrarily, the greatest value suggests that kurtosis is exceptionally high in some organizations.
Market capitalization (MCAP) is the log of the total market value of all publicly traded companies. The average MCAP score is 12.768, with a deviation of 1.226. As measured by PBV, the average company in the sample has a PBV of 4.162, with a standard deviation of 4.034. Statistics show that the sample companies had an average age of 42 years, with a standard deviation of 25 years. However, the sample also includes century-old businesses.
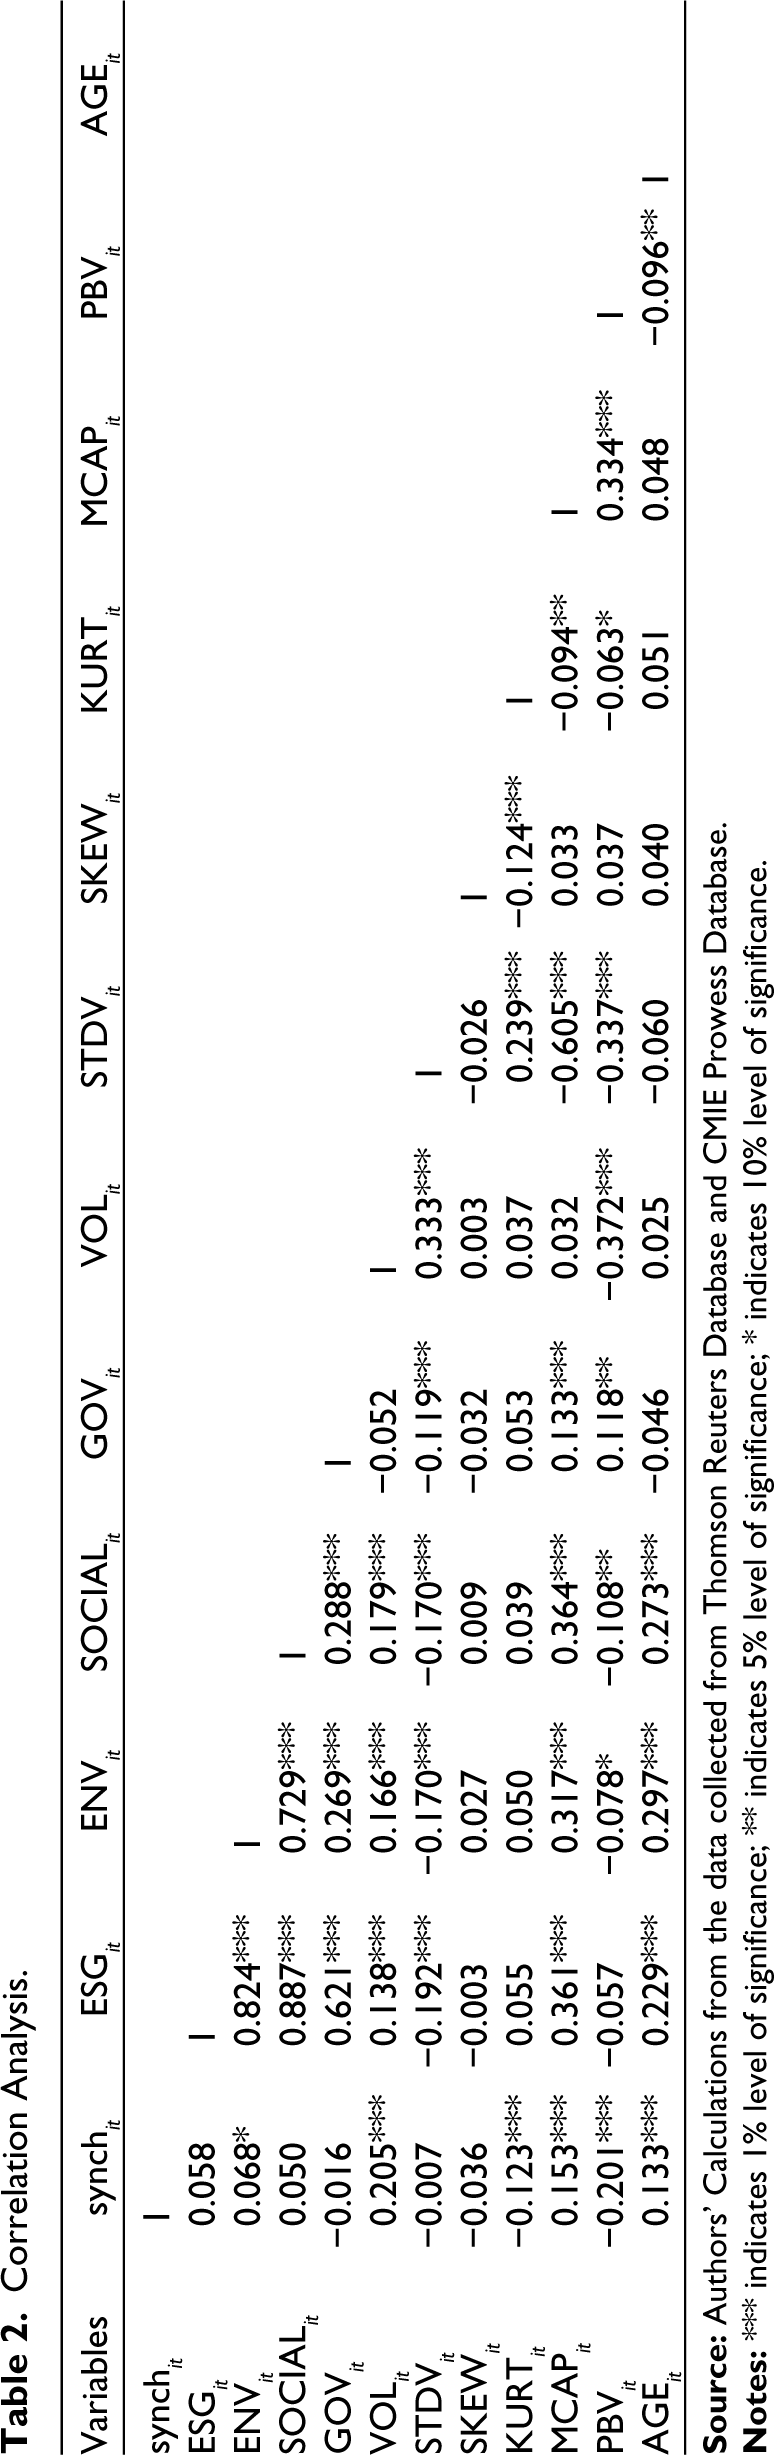
The study attempted to understand the nature of the data set before engaging in regression analysis. Before performing the regression analysis, the correlation between variables was verified to eliminate errors caused by the multi-collinearity of variables. The correlation analysis findings are shown in Table 2. Synch it has a weak negative relationship with GOV it , STDV it , SKEW it , KURT it and PBV it , which shows that all these variables have the opposite effect on Synch it . On the other hand, the remaining factors show a favourable relationship with Synch it . The ESG components have a strong correlation; they are integrated separately into three independent regression models to prevent the problem of multicollinearity.
Correlation Analysis.
Baseline Regression Results
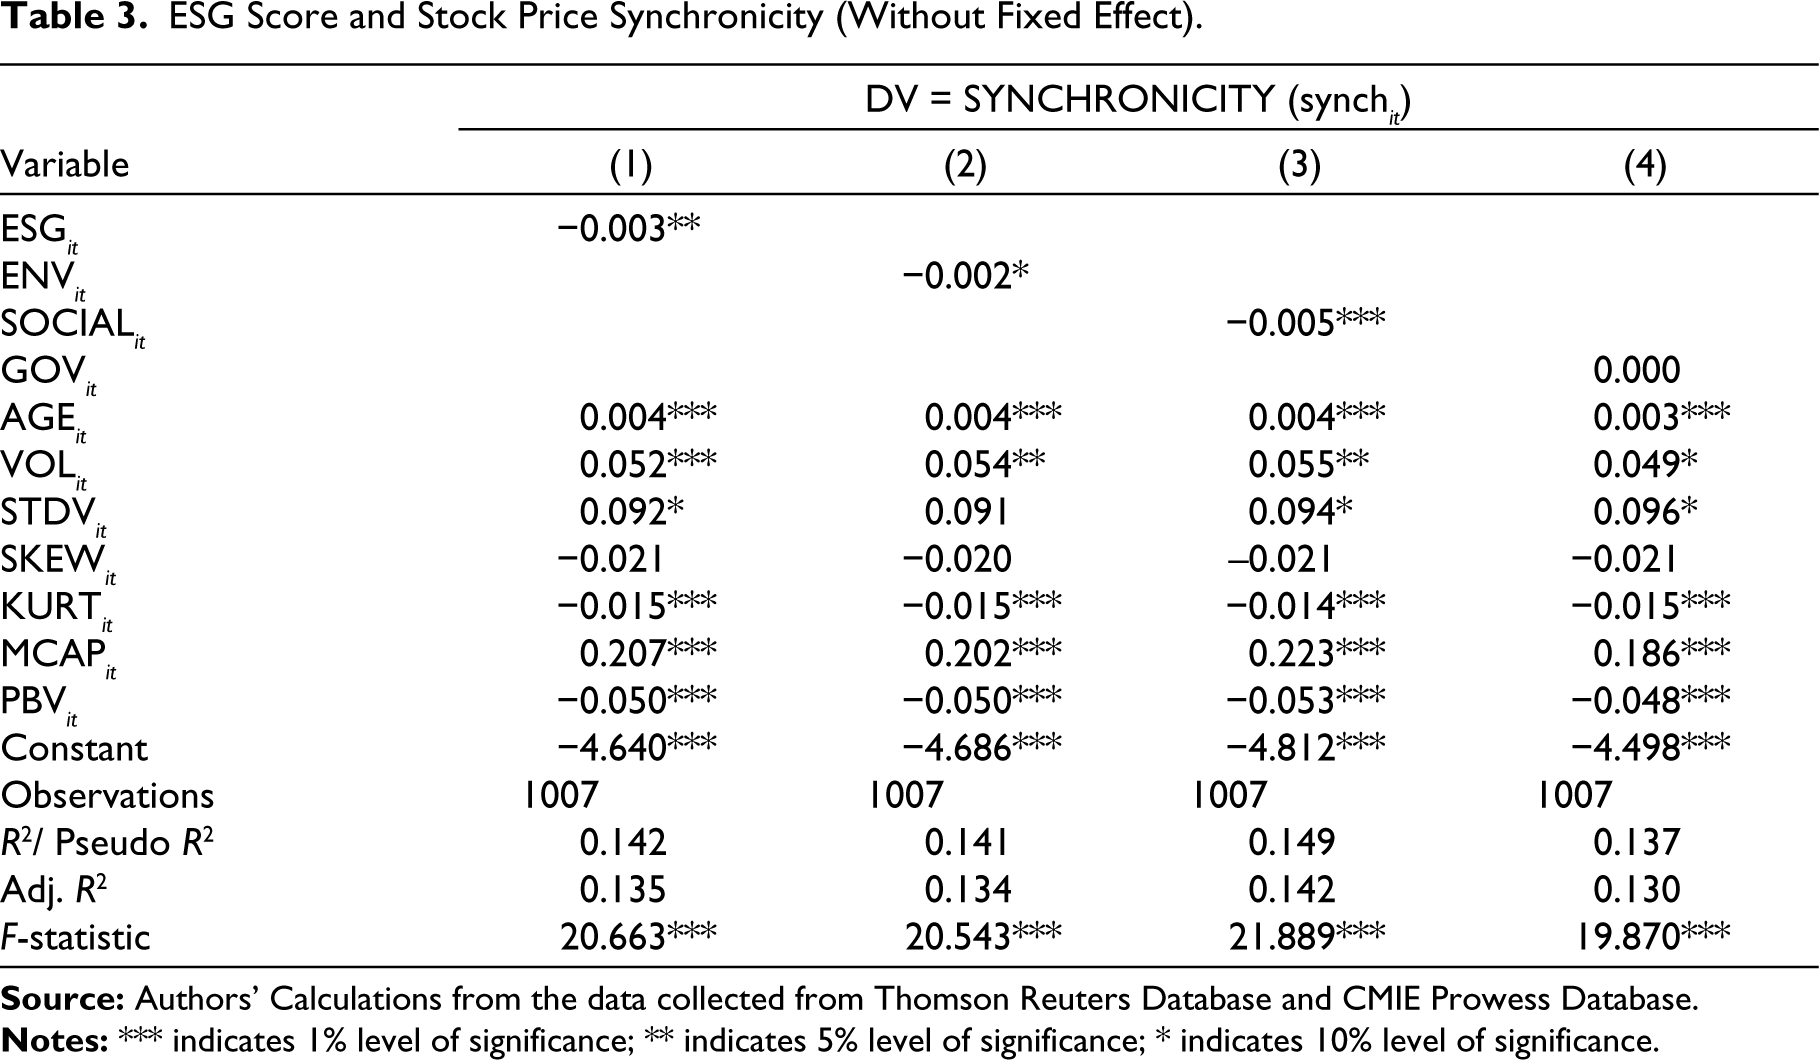
The results of a panel least squares regression without a fixed effect are shown in Table 3. The impact of ESG it on synch it revealed that ESG it , AGE it , VOL it , STDV it , KURT it , MCAP it and PBV it are statistically significant. However, SKEW it is statistically negligible. As the above-mentioned factors account for 14% of the variation in SYNCHRONICITY (synch it ), the model is fit. The findings also revealed that the ESG score and SYNCHRONICITY have a negative association. The stock price SYNCHRONICITY fell by 0.003 points, as the ESG score was enhanced by one unit. The findings are consistent with previous research by Dai et al. (2018). The negative impact of ESG on synchronicity shows that firms that excel on the ESG front have a higher degree of integration of firm-specific information into stock prices, causing such equities to behave differently from their peer group (Durnev et al., 2004). It reduces systematic risk, lowering the chance of a stock price drop caused by common market conditions (Lueg et al., 2019; Pereira da Silva, 2020). The significant negative relationship between ESG and stock price synchronicity highlights the increasing informational efficiency of the Indian market. However, column 4 indicates a negligible impact of the Governance (GOV it ) score on SYNCHRONICITY (synch it ).
ESG Score and Stock Price Synchronicity (Without Fixed Effect).
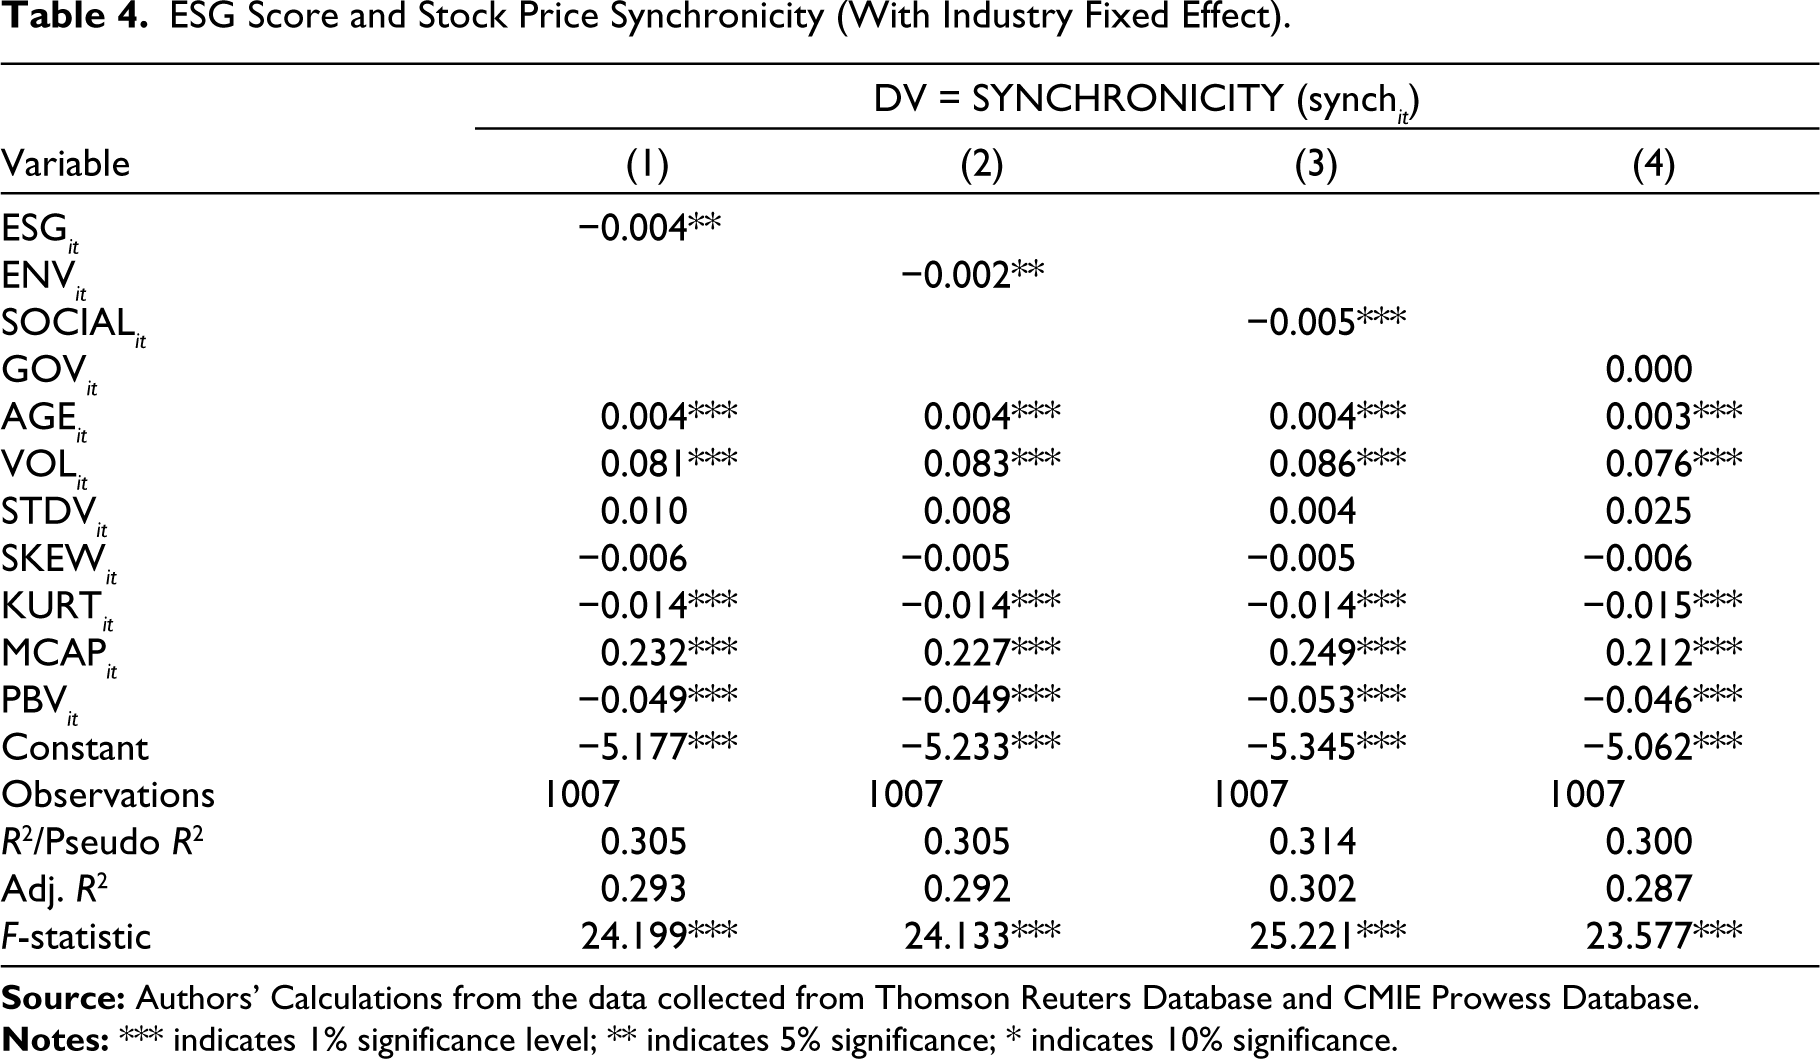
The results of panel least squares regression with fixed effect are shown in Table 4; the authors found that the ESG SCORE (ESG it ), along with AGE it , VOL it , KURT it , MCAP it and PBV it , is statistically significant when analysing the impact of independent variables on SYNCHRONICITY (synch it ). The model is suited because the above-mentioned parameters account for 30% of the variation in SYNCHRONICITY (synch it ). The results are qualitatively comparable to those obtained from panel least squares regression without a fixed effect. In addition, Governance (GOV it ) is statistically non-significant. The previous literature in the Indian context also demonstrated that ESG has a major impact on the firm’s market value and credit ratings (Bhattacharya & Sharma, 2019; Bodhanwala & Bodhanwala, 2019; Chauhan & Kumar, 2018). The growing importance of ESG in investment decision-making could be due to its impact on the market value or credit rating. It may also contribute to ESG momentum in the capital market in India. Apart from that, increasing government laws in emerging economies such as India, in terms of environmental pollution and governance quality, among other things, may encourage investors to consider the ESG performance of prospective companies when making investment decisions (Grewal et al., 2017). Based on their research, Chen and Yang (2020) concluded that environmental-friendly factors are more important for Taiwanese investors than other factors. The findings of our study are inconsistent with Chen and Yang (2020). Even though the environment score is strongly associated with synchronicity, it is less important than the other ESG components. Investors place maximum emphasis on the social score when making investment decisions of the three components. Companies that care about their community respect human rights, make quality goods and prioritize their employees’ working conditions. Such companies stand apart from their competition.
ESG Score and Stock Price Synchronicity (With Industry Fixed Effect).
Investors in India are now also paying attention to environmental considerations. Companies have recently placed greater emphasis on factors such as decreasing greenhouse gases, carbon emissions, solid waste, toxic emissions and water pollution, improving energy efficiency and implementing renewable energy solutions.
Testing the Robustness of the Findings to Alternative Measures of Stock Price Behaviour
In addition to the risks inherent to the market, a particular company may also face idiosyncratic risks. These risks are exclusive to this company. It has been demonstrated that voluntary disclosure of ESG information has a signalling effect that increases market information efficiency (Beatty & Ritter, 1986; Beatty & Welch, 1996). ESG disclosure (Eccles et al., 2011) and ESG scores provide investors with more confidence that business activity is reasonable or appropriate within the context of societal norms. This factor supports the firm’s strategic goal to retain or restore societal legitimacy (Suchman, 1995).
Therefore, ESG scores offer more information specific to the firm, which contributes to the efficient discovery of prices in the market by tying the information that is special to the firm to stock prices. Regarding market risk, the idiosyncratic fraction of the total risk will increase proportionally as the influence of firm-specific information grows. The baseline data show that synchronization, also known as market risk measurement, negatively affects ESG. However, this also suggests that ESG has a positive correlation with stock price volatility than other factors that cannot be explained. Simply put, companies that perform well on the environmental, social and governance front offer more significant opportunities for portfolio diversification through the active management of funds because common factors less influence such stocks in the market.
Against this backdrop, the present study hypothesizes a positive association between ESG and idiosyncratic volatility.
H5: ESG and its components’ scores are positively associated with the idiosyncratic volatility of stock prices.
Measurement of Idiosyncratic Volatility
We apply the CAPM model as given in Equation (1) on all the ESG stocks in the sample for every year from 2011 to 2021. The CAPM regression model provides residuals that indicate the difference between market-expected returns and actual returns. The residual indicates the idiosyncratic behaviour of the stock prices. We compute the standard deviation of the residuals for each year from 2011 to 2021, which is taken as a proxy for the idiosyncratic volatility of stock prices (Hasan & Habib, 2017).
Econometric Model


Idioaynch it is the measure of idiosyncratic volatility. In Equations (7)–(10), the variables on the right-hand side are the same as those mentioned in Equations (3)–(6).
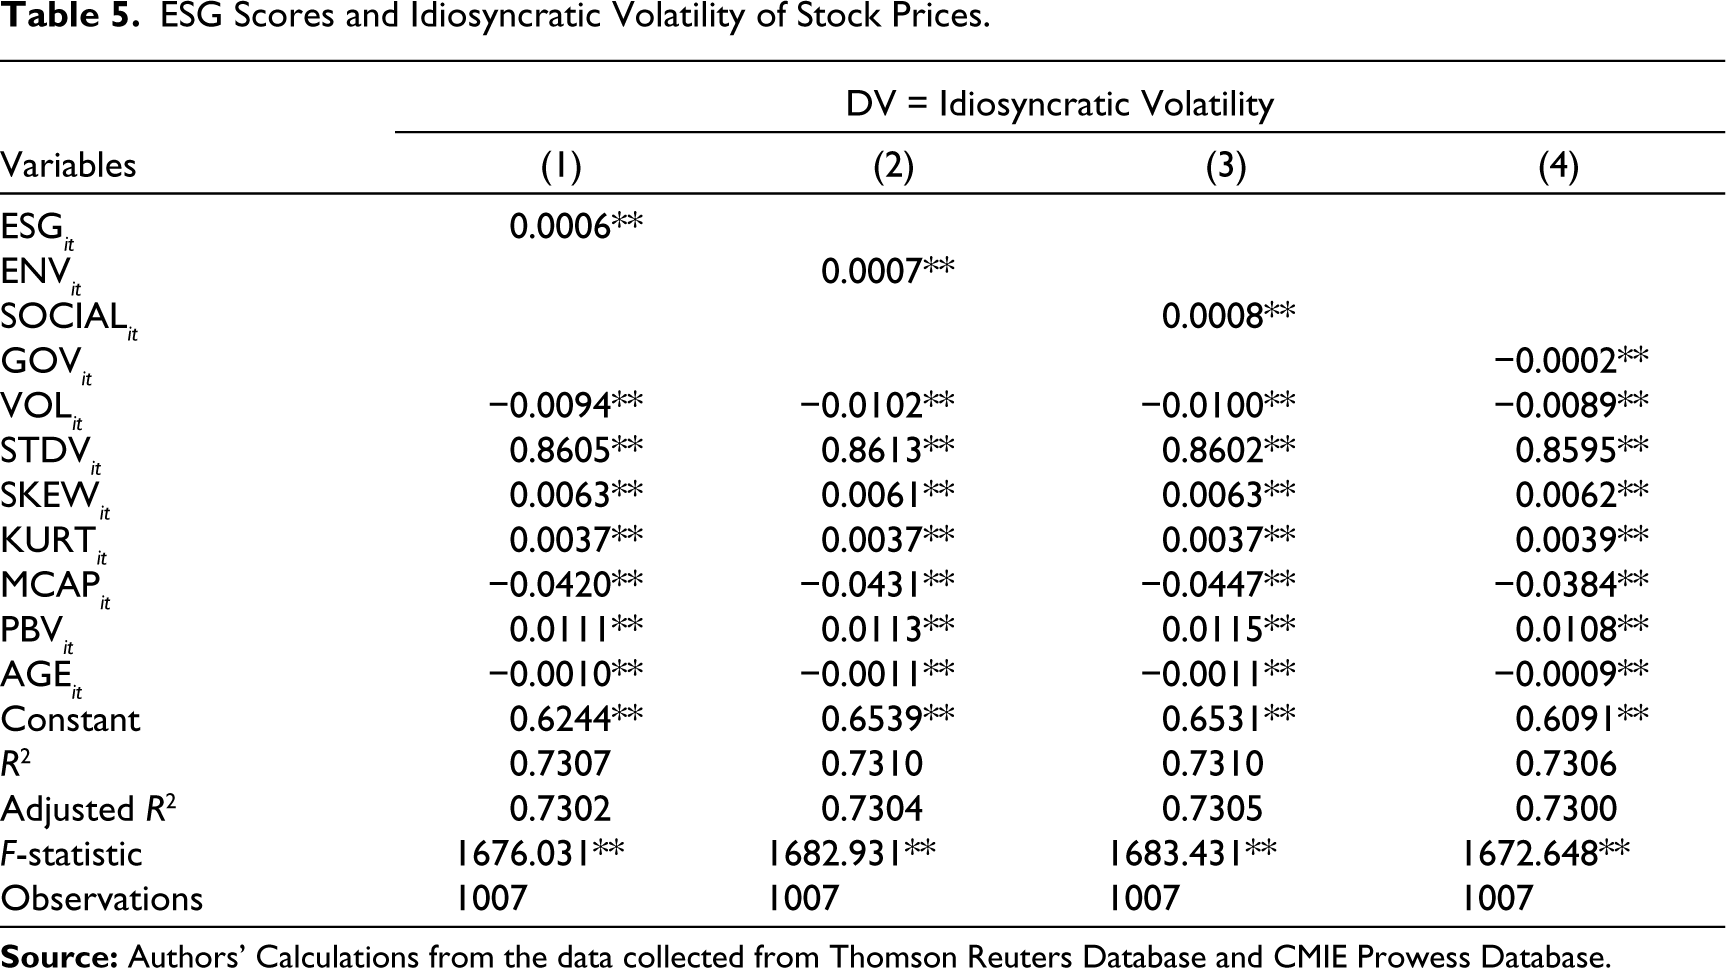
The results are consistent with the information efficiency of the stock markets, as demonstrated in Table 5, which shows that the ESG score and its components, except for the governance score, have a considerable beneficial impact on idiosyncratic volatility. The reliability of the baseline results is improved due to these findings. Idiosyncratic volatility is another component of the total risk of stock returns that is unique to the company, while synchronization measures the market risk of a stock’s returns. Both measures are components of the total risk of a stock’s returns. Given the sizeable beneficial influence of ESG scores on idiosyncratic volatility, one might deduce that ESG disclosure makes available market information that is more price sensitive and firm-specific, contributing to increased information efficiency. It also implies that disclosing non-financial information is relevant in making investment decisions.
ESG Scores and Idiosyncratic Volatility of Stock Prices.
Description of the Variables Used in the Analysis.
The volume of transactions, market capitalization and firm age significantly reduce idiosyncratic volatility. Except for the firm’s age, the other two factors are market indicators. Companies with high market capitalization and a high volume of transactions are more vulnerable to market risk than firm-specific risk. A possible explanation is the high volume of short-term trading in equities.
Conversely, idiosyncratic volatility is positively affected by the stock market’s skewness, kurtosis and PBV and the stock market’s standard deviation of stock returns. Indicators of the equities’ inherent risk are their standard deviation, skewness and kurtosis. In this way, they positively affect the risk of individual stocks. Value stocks may be more sensitive to firm-specific information than market-wide information, which may explain why PBV positively affects idiosyncratic volatility.
There is a high degree of consistency in the results across all models. It places a strong emphasis on being consistent in the modelling of the relationship that exists between the variables. All models have a significant F-statistic, suggesting a robust model fit.
Conclusion and Implications
Conclusion
The current study not only makes a significant contribution to the existing body of literature on how firm-specific information, especially ESG information, influences the behaviour of stock prices, but it also offers valuable insights into the process of identifying the financial impact of ESG. According to the findings of the study, a substantial negative link exists between ESG and two of its components (environment and social) and the synchronicity of stock prices. The fact that there is a significant negative association between ESG and synchronization suggests that investors differentiate firms that are demonstrating sustainable performance from other stocks that are traded on the market. Because the environmental score has such a significant impact, investors are more likely to pay attention to the stocks of those companies that lower their emissions, efficiently use scarce resources and innovate to develop cost-cutting solutions, among other things. Similarly, a significant influence of the social score emphasizes that investors show interest in stocks of companies that maintain business ethics, have concern for public health, safeguard the rights of employees, integrate customer health and safety with product design and maintain a pleasant working environment. The significant impact of the social score highlights these factors. So, it may be concluded that sustainable performance is gaining more weightage in investment decision-making than the simple financial performance of the companies.
Implications
The findings of the study provide implications for multiple stakeholders. Market players should consider the negative association of ESG with synchronicity and the positive association with idiosyncratic volatility. It indicates that stocks are performing well on the ESG front. It signifies that such stocks are more attractive for investors in creating efficient portfolios. The lower synchronicity of high-score ESG stocks also indicates that such stocks are more resilient to market shocks. Hence, efficient portfolio diversification can be achieved with stocks having higher ESG scores.
A significant environmental score has two major effects. Investors can consider factors like reducing emissions and more efficient use of company resources and product development when making investment decisions. From the companies’ standpoint, it is also pertinent to state that environmental sustainability should not increase the company’s expenditure as that would result in a drop in profits and issues with liquidity and solvency. Therefore, strategic planning ought to incorporate environmentally sustainable practices that are also economically viable.
The following vital implications may be drawn from the social score having a significant impact. Investors are more likely to endorse a company that values and promotes workplace diversity, creates new jobs, boosts community infrastructure and uses locally sourced material. The financial market is beginning to discount corporations that violate human rights heavily. Investors are looking for businesses that consistently provide quality goods and services. When employees are happy with their jobs, there will be less employee turnover, more productivity and so on adding value to the company in the long run.
The information efficiency of the capital market makes it possible for stock prices to reflect information linked to sustainability; thus, regulators should work to improve corporate disclosure norms in this area. To that effect, SEBI has recently released its Business Responsibility and Sustainability Report’. However, there is still a significant amount of work to be done in order to improve the transparency, reliability and relevance of sustainability reporting.