
Abstract
Mobile payment is gaining prominence worldwide, from consumers to vendors as a substitute to using money, debit or credit cards. This study intends to examine the significant and insignificant factors determining actual usage of m-payments among the unorganised retail vendors. The data was collected from 281 vendors using a structured questionnaire and SEM analysis explained 64.8% of actual usage. The study found that certain psychological beliefs and sentiments of vendors hinders the m-payment adoption. For researchers this study would provide a much deeper understanding of vendor adoption model as mostly all the studies have focused on customer adoption model.
Executive Summary
Transformations regarding the digitization of India have remarkably impacted its monetary transactions, with mobile payment (m-payment) systems becoming instrumental in facilitating cashless business. However, within the unorganized retail sector, which includes small general stores, street vendors, paan and beedi shops, handcart hawkers, and so on, adoption is fragmented due to longstanding behavioural and cultural norms. This research analyses both significant and insignificant factors that affect m-payments usage amongst unorganized retail vendors in India. Despite m-payments being a focal point of India’s digital transformation agenda, their adoption within this specific segment remains diverse on account of strong behavioural and cultural factors. A structured questionnaire was issued to 281 vendors, and data collected were analysed using structural equation modelling (SEM), which explained 64.8% variance in actual usage. The research found that certain psychological attitudes held by the vendors, which include technological anxiety, security concerns and cash dominance, negatively impact m-payment utilization. On the opposite side, usage, trust, ease of access and social influence positively contribute towards it. While many studies have concentrated on consumer research within this context, this study seeks to fill the gap by concentrating on vendor perspectives from the unorganized retail sector. The study makes theoretical contributions by incorporating behavioural and cultural aspects into existing technology adoption models frameworks. The results provide essential strategic considerations to assist policymakers, digital payment service providers and financial institutions in designing appropriate awareness campaigns, training sessions and mechanisms for trust-building. In addition, the study indicates the need for more simplified interface vernaculars for m-payment systems as well as confidence-building measures to encourage vendor-friendly policies. The focus on unorganized vendors aids in advancing the construction of encompassing digital systems and promotes fiscal inclusion while reinforcing grassroots realization of the Digital India initiative.
India’s digital transformation by is characterized by 821 million internet users, that is, 55% of the total population and 1.12 billion mobile connections, that is, 78% of the total population, signifying a virtual revolution (Behera, 2024; Kemp, 2024; Raj & Aithal, 2018). Basically, a deeper comprehension of digitalization is driving change rather than technology or computers (Song et al., 2023). Digitalization is evident in every aspect of society and continues to develop, as seen by the extensive usage of smartphones, the expansion of internet accessibility, the development of e-commerce apps and the provision of e-government services (Dufva & Dufva, 2019). The transformation from a monetary system to a cashless system by designing reliable and secure networks, flawless payment solutions and assured extensive transactions at ‘lightning speed’ (Sobti, 2019). Of late, payment methods have developed from simple currency or card transactions to diverse kinds of mobile payment (m-payment) methods (De Luna et al., 2019). This transformation has occurred because of developments in the financial system, technological upgradations in cyberspace, penetration of community platforms and accelerating usage of cell phones. As more and more cell phone users are enjoying the convenience and comfort of paying for economic consumption through a simple payment application, thereby resulting in an accelerated m-payment system. M-payment methods have adjusted not only to virtual payments but also to an advanced trading environment, making possible the business transactions universal and for all (De Luna et al., 2019). M-payment is described as a payment mode using a cell phone to commence, permit and authenticate a transaction (Au & Kauffman, 2008). M-payment has led to an increase in e-payments, thereby permitting achievable and appropriate mobile trade transactions (Mallat, 2007). M-payment services carried out through a mobile phone have been a major factor in socioeconomic development (Kshetri & Acharya, 2012) in growing economies. Aspects such as developments in technology, socioeconomic environment and intense penetration rate of cell phones are navigating m-payment growth in developing markets (Kshetri & Acharya, 2012).
The Indian retail sector accounts for approximately 90% of the unorganized retailers (Sanghmitra, 2023) and comprises the local kirana 1 shops, paan and beedi shops, handcart hawkers, pavement vendors and so on (Venkateswarlu & Kotni, 2022). In India, with a population of more than 1.4 billion (Silver et al., 2023), the unorganized retail industry is the most popular and dominant form of retailing and avenue of consumption. It lays the cornerstone for the Indian retail industry and displaces the country’s entrenched, firmly held market system, which has existed for a very long period. The unorganized retail sector is primarily made up of small-scale businesses that have little to no stability and sell goods and services in small quantities to nearby consumers. Rising consumer and merchant interest in using m-payments has made it a strategic instrument that promotes successful business results (Congdon, 2016). This cutting-edge payment method is regarded as a foundation for superiority in the marketplace, productivity and expansion, giving companies a path to efficiency (Hsiao, 2019). Experts have categorized m-payments as the possible payment of choice due to their reachability and convenience of usage (Liébana-Cabanillas et al., 2016; Liébana-Cabanillas & Lara-Rubio, 2017). However, the subconscious habit of using cash, the anxiety associated with using new payment technologies, worries about the costs, security and safety of digital payments make it challenging to use m-payments (Thanh, 2023).
Understanding the behavioural and cultural implications on m-payment acceptance in India’s unorganized retail sectors indicates a substantial research gap. Though m-payment technologies are widely used, little study has been done to examine how adoption rates are impacted by ingrained cultural norms, conventional business processes and social dynamics within unorganized retail communities (Karthik Ram & Selvabaskar, 2023; Xi & Ng, 2020). An analysis of these components may shed light on the obstacles and facilitators to the integration of m-payments in this sector. Addressing this gap is necessary for creating unique strategies that align with the beliefs and customs of India’s unorganized retailers. This gap serves as the basis for the current study, which is necessary because the majority of previous research papers focused on consumers’ intention to adopt m-payments and limited studies are available on unorganized retail vendors in particular (Kumar & Yadav, 2024). In addition, there is a gap between academic research and real-world application when it comes to comprehending the merchant’s perspective and experience with these new information technologies (Dahlberg et al., 2015). The following research questions will be addressed by this study:
What effect do behavioural and cultural aspects have on the adoption of m-payments in unorganized retail sectors?
What effect do external forces like market competition, government regulations and technology breakthroughs have on the significance of the variables influencing m-payment usage?
This research would provide an in-depth understanding of the vendor adoption model to future researchers, as most of the earlier studies have concentrated on the customer adoption model. This study would benefit policymakers, government and other stakeholders in implementing the vision of digital India and accelerating financial inclusion. The findings of this study would assist stakeholders and policymakers in developing community-focused and effective approaches towards m-payments usage by the unorganized retail sector in India. This would lead to increased adoption rates, financial inclusion and encourage prosperity. Hence, awareness of the distinct cultural dynamics and business practices, stakeholders can lower regulatory hurdles, promote confidence and provide safe m-payment solutions.
REVIEW OF LITERATURE AND HYPOTHESES DEVELOPMENT
A number of factors, such as the increased usage of smartphones, the growing acceptance of digital financial transactions, demand for quicker and more effective payment methods, have contributed to the drive behind this shift towards m-payment options. Appendix A provides a theme-based review of the existing literature on vendor adoption of m-payments.
The technology acceptance model (TAM), which was developed by Davis, is the most widely used framework for predicting information technology adoption (Legris et al., 2003). According to Lee and Jun (2007), TAM should go beyond convenience and usefulness perceptions to analyse factors that influence adoption intentions. Though there has been tremendous support for TAM (Yang, 2005), it emphasizes on how useful or convenient we perceive the technology in relation to its adoption intention (Lai & Zainal, 2015; Luarn & Lin, 2005). Consequently, it is advantageous in terms of novel technologies like single-platform e-payment systems. Nevertheless, TAM has been extensively tested with different samples in various settings as a valid and reliable model for understanding IS acceptance and use (Davis & Venkatesh, 1996; Mathieson, 1991). According to Nandwani and Khan (2016) and Afshan and Sharif (2016), the unified theory of acceptance and use of technology (UTAUT) still stands among one of the most complete models, even though UTAUT has been criticized before. This is so because it has been built upon eight other technology acceptance models (Venkatesh et al., 2003).
However, many factors affect the actual usage of m-payment among the unorganized retail vendors in this study. These factors (see Appendix B) and their direct connection to actual usage are discussed below:
Perceived Risk and Actual Usage
Perceived risk might arise from uncertainty about the possibility of negative consequences (Bauer, 1967). Undoubtedly, one of the main indicators of whether or not m-payments will be adopted is perceived risk (Al-Saedi & Al-Emran, 2021; Kalinic et al., 2019; Lara-Rubio et al., 2021; Liébana-Cabanillas et al., 2015, 2020; Yang et al., 2015). Perceived risk in this study refers to how much vendors are concerned about potential losses brought on by the unknowns of implementing m-payments. Any bad effects on vendors, such as loss of money, privacy violations, performance issues, psychological discomfort or anxiety and time wastage, are included in the losses.
The major impediment to acceptance and use of m-payment services is perceived risk since potential users may be hesitant due to security concerns, privacy issues, loss of money, as well as performance issues. According to Kim et al. (2008) and Lu et al. (2011), perceived risk can negatively affect adoption intentions. Widyanto et al. (2022) and Park et al. (2019) found that PR has an insignificant effect on intention to use m-payments. Also, higher levels of perceived risk have been found to result in lower intentions to accept the use of other forms, such as m-payments, by studies such as Huang and Benyoucef (2013), Almaiah et al. (2022) and Alrawad et al. (2022). However, this relationship is not always direct when it comes to actual usage levels. While there are some studies, including Liébana-Cabanillas et al. (2018) and Slade et al. (2015), which suggest that perceived risk might initially hinder adoption, it does not significantly affect actual usage once individuals have overcome the initial barrier. Additionally, research by Leong et al. (2003) and Pavlou (2003) suggests that coping mechanisms or trust-building strategies can develop over time in order for users to address risks associated with their perceptions about using m-payments, thereby reducing its impact on reduced usage patterns, thus indicating that it does not necessarily lead to decreased usage rates by customers in all situations.
The present study aims to quantify the intricate connection between perceived risks and actual use of m-payments. It also intends to measure individuals’ risk perception towards m-payment adoption and its influence on their actual usage behaviour. Thus, the following hypothesis has been formulated:
H1: Perceived usefulness has a negative effect on actual usage of m-payments.
Perceived Usefulness and Actual Usage
The level to which users consider that utilizing a technology would magnify their performance is known as perceived usefulness (Davis, 1989). Consumers carefully consider all the advantages of new technology before implementing it. Kim et al. (2010) discovered that perceived usefulness has a firm optimistic influence on the usage of m-payments. Perceived usefulness has been empirically confirmed as a notable predictor of propensity to embrace new technologies (Apanasevic et al., 2016; Arvidsson, 2014; Chen, 2008; Duane et al., 2014; Keramati et al., 2012; Kim et al., 2010).
Perceived usefulness is continuously recognized as a strong forecaster of usage intention and behaviour. Schierz et al. (2010), Altounjy et al. (2020) and Koenig-Lewis et al. (2015) have substantiated this relation by indicating that greater levels of perceived usefulness result in higher intentions to adopt and use m-payments. Liébana-Cabanillas et al. (2017) and Altwairesh and Aloud (2021) have supported the positive association between perceived usefulness and actual usage, showing that users are more likely to take up or utilize m-payment services if they consider them as useful or beneficial. In addition, Singh and Sinha (2020) and Haritha (2022) also found that perceived usefulness is positively related to users’ intentions to use m-payments due to its value and ease of use. However, there are contradicting findings pertaining to perceived usefulness’s implications on user attitude towards technology acceptance, such as those by Chong (2013) and Wu and Wang (2005), who discovered that perceived usefulness is not always related with actual use. This implies that other factors, such as habit or environmental restrictions, may affect perceived usefulness and actual usage. Also, another study conducted by Venkatesh and Davis (2000) showed the TAM, which argues that people’s intention to use a certain technology is directly determined by their perceived usefulness, that is, if someone believes something useful, then he or she will definitely utilize it. While TAM has frequently been employed in analysing patterns of technology adoption, certain investigations, such as those done by Hong et al. (2002) and Gefen and Straub (2000), have indicated mixed results on the existence of a positive relationship between perceived usefulness and actual usage. Despite being widely used for studying tech adoption processes, there have been conflicting findings regarding the connection between perceived usefulness and actual usage behaviour. These studies, which yielded contradictory outcomes, highlight how challenging it may be for us to comprehend the connection between our expectations and reality. Therefore, further research is required on this subject so as to better understand its mechanics and determine when they are most likely to occur. Hence, the following hypothesis:
H2: Perceived usefulness has a positive effect on actual usage of m-payments.
Performance Expectation and Actual Usage
This is the degree to which people recognize the value of a system, like the internet or mobile technology, in performing their daily duties (Venkatesh et al., 2003). Studies on m-payment adoption show that stronger performance expectations are correlated with increased behavioural intentions to utilize the service (Slade et al., 2014). Improved mobile application speed, validation and network consumption could all have a favourable effect on how satisfied users are with their usage.
According to some research, performance expectation and actual usage of m-payment services are positively correlated. Saputri et al. (2022) and Aligarh et al. (2023) show that users tend to adopt and use m-payment if they think that such payments are efficient in facilitating transactions. Nguyen et al. (2022) and Jung et al. (2020) found that performance expectancy, which is perceived by consumers on how convenient and effective m-payments can be, positively increases their inclination to use them. There are also conflicting outcomes in the literature, whereby Venkatesh et al. (2003) discovered that intentions for adopting new technology were greatly predicted by performance expectancy, but this did not always translate into behaviour of using those technologies. Similarly, Davis et al. (1989) and Cheung and Limayem (2005) observed some situations where performance expectancy did not significantly affect actual usage behaviour, but other factors like habit or external constraints may come into play between them, too. Thus, the following hypothesis was proposed:
H3: Performance expectation has a positive impact on actual usage of m-payments.
Mobile Payment Knowledge (MPK) and Actual Usage
Knowledge aids people to exchange commodities (García-Murillo & Annabi, 2002). Customers with a high degree of understanding would use services well, more effectively and manage hazards as opposed to customers who have a lesser comprehension. According to Schreier and Prügl’s (2008), users who have a remarkable knowledge of creativity are more probably to anticipate market trends, have high expectations for the benefits of change and adopt new commercial products more quickly and enthusiastically than they would with conventional ones. The knowledge of the vendor can assist them in understanding what m-payment can accomplish for them and why the goods and services are crucial to them.
Studies by Zhang et al. (2018) and Khan et al. (2021) support the positive relationship between MPK and actual use. It shows that people who understand how these systems work are more likely to use them in their transactions. Kim et al. (2010) and Li et al. (2014) found that higher levels of vendors’ intention to accept m-payments are driven by a greater understanding of this technology. However, there have been some different results in other studies too. Moghavvemi et al. (2021) argue that adoption intention may be influenced by knowledge about m-payment but not necessarily translate into usage behaviour. In addition, perceived usefulness or ease of use could intervene between MPK and actual usage when there is no significant relationship found between them (Kim et al., 2010). Moreover, Hassan et al. (2022) revealed that although individuals need awareness of m-payment systems, their actual usage can be affected by subjective norms and perceived behavioural control. Thus, this study hypothesizes the following:
H4: MPK has a positive effect on actual usage of m-payments.
Trust and Actual Usage
Trust has the biggest effect on individuals’ intentions to use their mobile phones to make payments (Duane et al., 2014). This is in accordance with earlier research by Xin et al. (2013), which indicated that trust is a prime element that influences customers’ intention to use m-payment systems. Additionally, Daştan and Gürler (2016) noted the beneficial effects of perceived trust on m-payment acceptance, which was also supported by Mahad et al. (2015), who stressed the good effects of perceived trust on users’ intention to use mobile banking.
Many studies have shown that trust and actual usage go together. Yeboah et al. (2020) found that concerns about technology and safety make vendor trust a critical factor for the acceptance of m-payments. Hayashi and Bradford (2014) discovered that trust in the security of m-payment systems is important when it comes to users’ adoption decisions and subsequent usage behaviour. Similarly, Aligarh et al. (2023) showed that real use by customers increases with greater trust levels from them in service providers of m-payment. With regard to merchants, Yeboah et al. (2020) and Gupta et al. (2023) studied this population specifically because trust in service providers as well as technology were significant determinants of their acceptance and adoption of m-payments. According to He et al. (2023), vendors cannot accept the use of m-payments due to technological fears and insecurity reasons, fearing that their money might be stolen. Saha et al. (2022) and Jameel et al. (2022) also found that high degrees of trust result in intentions to adopt the m-payment system becoming stronger until actual usage outcomes occur.
However, Alfani et al. (2023) found that although trust is a significant predictor of users’ intention to adopt m-payments, it might be influenced by perceived usefulness or ease of use. Similarly, Chandradasa and Liyanapathirana (2021) discovered that perceived risk negatively affects m-payment adoption among businesses, not due to technology fears but due to transaction security issues. Similarly, Lafraxo et al. (2018) noted that trust is one of the significant determinants of users’ adoption, but it may not directly lead to actual usage owing to intervening variables like perceived risk and compatibility. Considering these, the study therefore hypothesized:
H5: Trust has a positive effect on the usage of m-payments.
Anxiety and Actual Usage
Fear of losing data or making a significant mistake when utilizing technology is referred to as anxiety (Venkatesh & Davis, 2000). Several studies on the adoption of information systems have emphasized the effect of anxiety on attitude, behavioural intention and adoption (Celik, 2016; Igbaria, 1990; Korobili et al., 2010; Rana et al., 2016; Yang et al., 2020). Anxiety has a negative influence on how consumers feel about utilizing m-payment systems. In other words, lowering their concern would enhance consumers’ positive perception of m-payment.
Several studies have supported a negative association between anxiety and actual usage. Anxiety related to technology and safety concerns has been noted to hinder vendor acceptance for m-payments (Ariffin et al., 2020). Similarly, higher levels of anxiety about security and privacy issues can discourage people from using m-payment systems, leading to decreased actual use (Cavus & Atanda, 2022). Anxiety due to security concerns was found by Behera et al. (2023) to impede users’ intentions of adopting and using m-payment systems. Moreover, Apaua and Lallie (2022) showed that anxiety over privacy and security concerns undermines the propensity of users towards adopting m-payment services.
The literature also reveals contradictory results. As Pavlou and Fygenson (2006) found, anxiety may not always lead to a decrease in real use behaviour due to coping mechanisms that people employ or assurance they seek in order to overcome their fears and keep on using it. Equally, research by Bailey et al. (2017) indicated that anxiety might affect adoption intention, but its influence on actual usage behaviour can be weaker than expected, which implies that there are other variables mediating this relationship. Thus, the following hypothesis was proposed:
H6: Anxiety has a negative impact on the actual usage of m-payments.
Financial Performance and Actual Usage
The extent to which using a system enhances the performance of the job financially is referred to as financial performance. Increased cash flow and turnover influence the usage of m-payments, thereby increasing the rate of adoption. When people consider adopting m-payment systems, they usually focus on its financial aspect. M-payments also help users with better financial planning and budgeting because they can record the transactions and keep track of them in real time. Hence, the perceived benefits in terms of finance offered by these systems are key drivers to their adoption by users who use them. The more users realize that their financial situation may be improved if only they made use of m-payments, then it becomes likely that such persons will readily embrace this technology into their lives, thereby making it a part and parcel of their daily routine transactions, depending on one’s needs. Therefore, the following hypothesis was formulated:
H7: Financial performance has a positive impact on the actual usage of m-payments.
COVID-19 Risk and Actual Usage
It is the degree of fear caused by the pandemic in using the conventional payment method which triggered the new system. The fear of the pandemic created an optimistic impact on the minds of people. In other words, this fear enhanced the adoption intention among the individuals.
The COVID-19 pandemic has expedited a move towards contactless payment systems as customers look to minimize their interactions with other people in order to lower the chances of getting infected. Some researchers, such as Peters and Rose (2023) and Li et al. (2023), have supported this relationship and concluded that heightened fears about disease transmission have resulted in more adoption and utilization of contactless payment methods in places. Additionally, Hardiyanto et al. (2023) discovered that those who are concerned with a higher risk for COVID-19 are more likely to use a safe m-payment system instead of traditional ones. Sreelakshmi and Prathap (2023) found out that consumers’ priority on safety and hygiene during the COVID-19 period significantly increased the adoption and usage of m-payments services. Moreover, Yu and Chen (2022) posited that it was because of concerns over viral transmissions that led to an increase in the number of users actually using contactless payments after its implementation increased over the years.
However, the literature also contains contrasting results. According to Mamčenko et al. (2023), the risk of infection is likely to initially push people into adopting contactless payments but may not continue with the same trend in the long run as individuals may revert to their normal payment habits after the pandemic has subsided or after they have healed off from its effects. Again, Arora et al. (2023) discovered that there is a likelihood that coronavirus affects intent to use them, although other aspects like convenience level, perceived trust and familiarity with technology as potential threats to adoption play a key role in influencing this behaviour. Equally, studies by Tan et al. (2022) and Hardiyanto et al. (2023) have found that intentions of using these mobile phone applications cannot be solely explained from how much risk they pose towards COVID-19 alone but can be linked with elements such as convenience, anticipated trust levels for products and personal inclinations among others. Thus, the study established the following hypothesis:
H8: COVID-19 risk has a positive effect on the usage of m-payments.
Perceived Ease of Use (PEOU) and Actual Usage
This is notably the prime criterion in the adoption of a system, according to TAM. According to Davis (1985), PEOU refers to how much a user thinks they will not have to apply any effort when utilizing a certain system. In other words, users’ interest in utilizing a system increases in direct proportion to how many users consider it to be accessible. The main principles of the TAM are that a person’s usage of technology is determined by their approval of it, which is in turn governed by different psychological criteria, namely actual usage and PEOU.
Many studies have shown that a positive relationship exists between ease of use and its perception. Venkatesh et al. (2003) discovered that PEOU has a great impact on the intention of users to adopt and use technology, which in turn affects their actual usage behaviour. Similarly, Haritha (2022) showed that high levels of PEOU have an effect on vendors’ adoption and acceptance of m-payment systems. Johnson et al. (2018) also found that PEOU was a significant predictor of user intentions to adopt and utilize m-payment systems, leading to increased actual usage. Again, Chen (2008) and Tan et al. (2024) found that PEOU directly influences users’ intention to use m-payments, which ultimately affects actual usage. According to Venkatesh and Davis (2000), people’s intention to use a device is influenced by PEOU, and this directly affects its actual use.
Meanwhile, some researchers have found contradicting evidence for direct impact between PEOU and actual usage (Chairina, 2021; Gefen & Straub, 2000), even though TAM has been heavily used in explaining technology acceptance behaviours. While the findings of Zhou et al. (2021) support the idea that PEOU has a positive effect on adoption intention, their study also shows that it may have insignificant effects on actual usage behaviour. Similarly, Mahboob and Khaskhely (2022) showed that PEOU does not always directly lead to an increase in actual usage as users tend to consider other aspects such as perceived usefulness or external constraints. Thus, the study formulated the following hypothesis:
H9: PEOU has a positive impact on actual usage of m-payments.
Subjective Norm and Actual Usage
This factor refers to how much a person weighs the viewpoint of people who are valuable to him while deciding whether to accept a system or conduct any course of action (Venkatesh & Bala, 2008). Two fundamental sets of underlying elements make up this social construct. The consumers’ perceptions of the reference group members come first, followed by their motivation to act in accordance with their expectations (Herrero et al., 2005).
The subjective norm and actual usage relationship of m-payment systems is one important aspect of understanding the vendor’s adoption behaviour. Venkatesh et al. (2003) reveal that subjective norm significantly predicts users’ motivation in adopting a technology, which subsequently affects their real use of the same. In like manner, Mushi (2022) found that higher levels of subjective norm positively influence vendors’ intentions to accept and embrace m-payments, spurring increased actual usage behaviour. According to Becirovic et al. (2023), subjective norm significantly predicted user intent for acceptance and utilization of m-payment services, resulting in increased actual usage behaviour for such services. Similarly, Gupta et al. (2021) showed that higher degrees of subjective norms can positively affect users’ intention with regard to adopting m-payments, thereby leading to real purchase and consumption activities. Besides, Venkatesh and Davis (2000) also proposed TAM, whereby it was argued that subjective norms had a direct influence on the intention to use, which in turn influenced actual use by consumers themselves. Even though TAM has been frequently employed in the study of technology adoption behaviours, few studies have revealed mixed results on whether there is a direct connection between the subjective norm and actual use (Jermsittiparsert et al., 2023).
In addition, there are also findings that oppose the above. Aji, Berakon and Riza (2020) found that subjective norm influences intention to use but does not affect usage behaviour to a great extent. Moreover, Pavlou and Fygenson (2006) showed that subjective norm may not lead to increased actual usage behaviour since it may be affected by other factors like perceived usefulness or individual preferences of users. Thus, the following hypothesis was proposed:
H10: Subjective norm has a positive impact on the actual usage of m-payments.
Bohni and Actual Usage
Bohni, a colloquially used word from the local language, is also known as the seller’s luck. Bohni relates to the conviction of the user that a particular belief brings the vendor luck and enhances the performance of the business for the day. Following a customary tradition may limit the usage of m-payments. Vendors who believe in the practice of bohni might resist m-payments since they think that not accepting cash for their first sales may bring bad luck to their businesses. Thus, bohni’s impact on actual usage may lead to resistance or hesitation among users, which makes m-payments not widely accepted among the traditional marketplaces. Therefore, we formulated the following hypothesis:
H11: Bohni has a negative effect on the actual usage of m-payments.
THEORETICAL BACKGROUND AND CONCEPTUAL MODEL
Based on the observations and the literature, it was noticed that many researchers have emphasized various factors, namely speed, security, cost, trust and compatibility, which influence vendors’ adoption intention of the m-payment system (Altwairesh & Aloud, 2021; Anuradha, 2020; Mahanta & Kalita, 2021; Yeboah et al., 2020). It can also be inferred from the literature that vendors primarily focus on the functional and technical facets of a technology. The current study explores a few factors that are pertinent in the Indian context and aims to look at the psychological aspect of vendor adoption. With this understanding, the conceptual framework was developed.
Several models and frameworks are found in the theoretical background of m-payment usage. These come from technology adoption, consumer behaviour and economics. This study is a combination of TAM and UTAUT theories. TAM (Davis, 1989) is one of the most powerful technology acceptance models with two main factors that influence an individual’s intention to use new technology, namely PEOU and perceived usefulness. The TAM, an information systems theory by Davis (1989), explains how users can be persuaded to accept and employ new technologies. According to Puspitasari et al. (2019), the UTAUT is among the recent models used in investigating user acceptance of information technologies, which have been developed based on prior theories. UTAUT provides a comprehensive tool for assessing technology acceptance and use (Venkatesh et al., 2003, 2007). Each of these earlier theories provides some understanding about different aspects of human behaviour as well as decision-making processes regarding the adoption or utilization of new technological devices like m-payment systems. In summary, this study’s variables include a mix of cognitive, behavioural, social and economic theories, showing that it takes diverse dimensions to understand technology adoption and usage contexts.
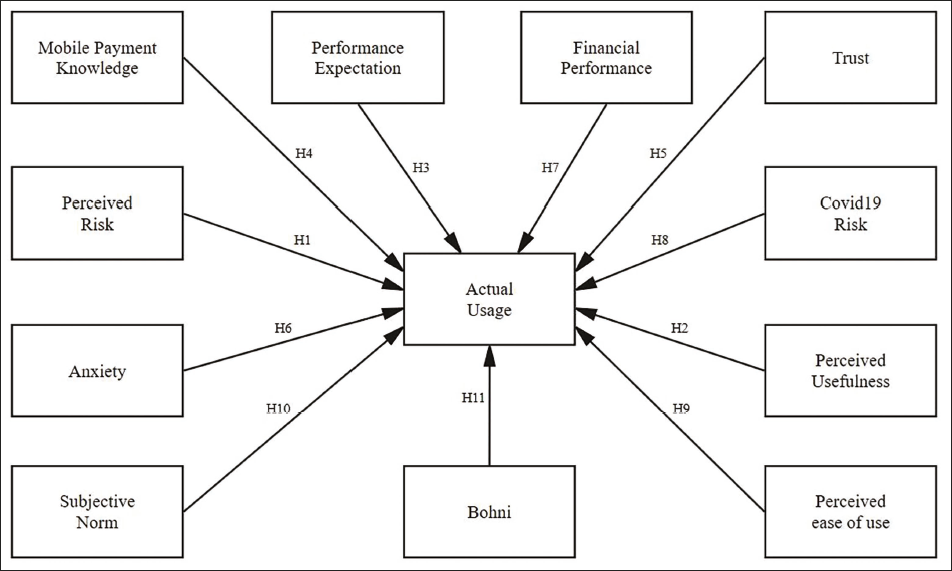
The proposed model comprises 12 variables, out of which 11 variables are independent and one variable is dependent. These 11 variables are the critical factors influencing the actual usage of the m-payment system. Nine exogenous variables (perceived risk, perceived usefulness, performance expectancy, MPK, trust, anxiety, covid risk, PEOU and subjective norm) are considered from the TAM and UTAUT models, while the other two exogenous variables (financial performance and bohni) were incorporated into the model. The model consists of one endogenous variable (actual usage), which is also a part of both the TAM and UTAUT models. Every factor in this representation directly contributes to actual usage. Each of these factors affects the possibility or degree to which a person actually uses m-payment services. The relationships that exist between each aspect and real-world usage serve as a representation of the different psychological, social and contextual factors that influence the adoption and use of m-payment technology. Figure 1 illustrates how these factors contribute to the direct prediction of usage behaviour.
Proposed Model of M-payment Usage.
OBJECTIVE
The aim of this research is to analyse the significant and insignificant factors influencing actual usage of m-payments among the unorganized retail vendors.
RESEARCH METHODOLOGY
Instrument Development
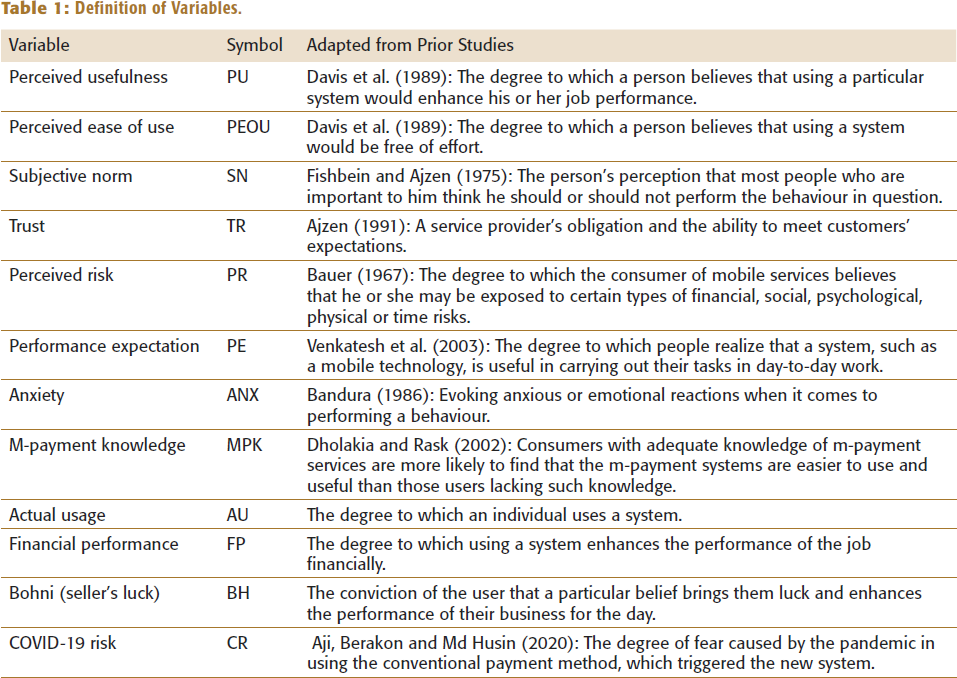
This study had 12 constructs: perceived usefulness (PU), PEOU, trust (TR), subjective norm (SN), performance expectation (PE), anxiety (ANX), MPK, COVID-19 risk (CR), bohni (BH), perceived risk (PR), financial performance (FP) and actual usage (AU). All the constructs and the items required to determine a vendor’s actual usage are provided in Appendix B. To achieve the above objective, a 5-point Likert scale questionnaire was designed (where 1 = strongly disagree and 5 = strongly agree) to collect information from the unorganized retail vendors. The variables of this study are based on the existing literature related to m-payments. The questionnaire was designed depending on the key variables proposed by relevant studies on m-payment adoption. Measurement variables for PU and PEOU are adapted from Davis et al. (1989); variables for TR are adapted from Ajzen (1991); variables for PR are adapted from Bauer (1967); variables for MPK are adapted from Rieh (2004); variables for SN are adapted from Fishbein and Ajzen (1975); variables for PE are adapted from Venkatesh et al. (2003); variables for ANX are adapted from Bandura (1986); variables for CR are adapted with little modifications from Aji, Berakon and Md Husin (2020), CC and Prathap (2020) and Daragmeh et al. (2021). Variables for AU are adapted from Patil et al. (2020) and Wei et al. (2021), and variables for FP and BH constructs were included by the authors after validation of the questionnaire. Table 1 displays the definition of constructs and the prior studies from which each was adapted.
Definition of Variables.
Sample Selection
The population of the study includes local kirana shops, general stores, petty shops, handcart vendors and pavement vendors in the unorganized retail sector from Ernakulam, Kerala. Ernakulam is the major financial and commercial hub of Kerala and is noted for its quick-paced growth and development. In 2012, Ernakulam emerged as the first district in India with 100% banking or complete ‘meaningful financial inclusion’ (Kumar, 2012). Purposive sampling, a non-probabilistic sampling approach, was adopted because there was no obtainable sample frame.
Using the structured questionnaire, primary data were collected personally from 380 unorganized retailers from August to November 2022. We received responses from 355 vendors, and 281 reliable survey responses were used for this research after eliminating incomplete and invalid responses. Given that the ratio of sample size to item count (281/42) is 6.69, the present sample of 281 was deemed adequate to do the analysis. According to Bentler and Chou (1987), this is above the minimal requirement of 5:1.
The study used a quantitative approach to explore the factors of m-payment usage. First, a preliminary literature analysis was conducted, and a questionnaire that included all the important variables identified in both older theories and contemporary studies on m-payments was created. The first draft of the questionnaire was developed through a series of in-person interviews and conversations with scholars and a few vendors in the m-payments and fintech sectors. After gathering the information, the questionnaire was checked and amended accordingly. Some statements were rephrased for easy understanding without compromising on the content. The questionnaire’s English (original version) and Malayalam (translated version) versions were distributed. The respondents chose between the Malayalam and English versions of the survey instrument. The Bulmer and Warwick (1993) back-translation approach was used. The English questionnaire was translated into Malayalam by a linguist with professional credentials. To determine whether the translations were accurate, the Malayalam version of the questionnaire was translated back into English. The questionnaire consisted of two sections, each with a series of closed-ended questions. The initial part of the survey instrument covered demographic factors, such as age, gender, educational qualification, nature of work, monthly earnings, modes of payment used, frequency of usage and duration of usage. The second part focused on the critical factors of actual usage and their corresponding scales. Respondents were informed that the data would be used only for research work.
Sample Characteristics
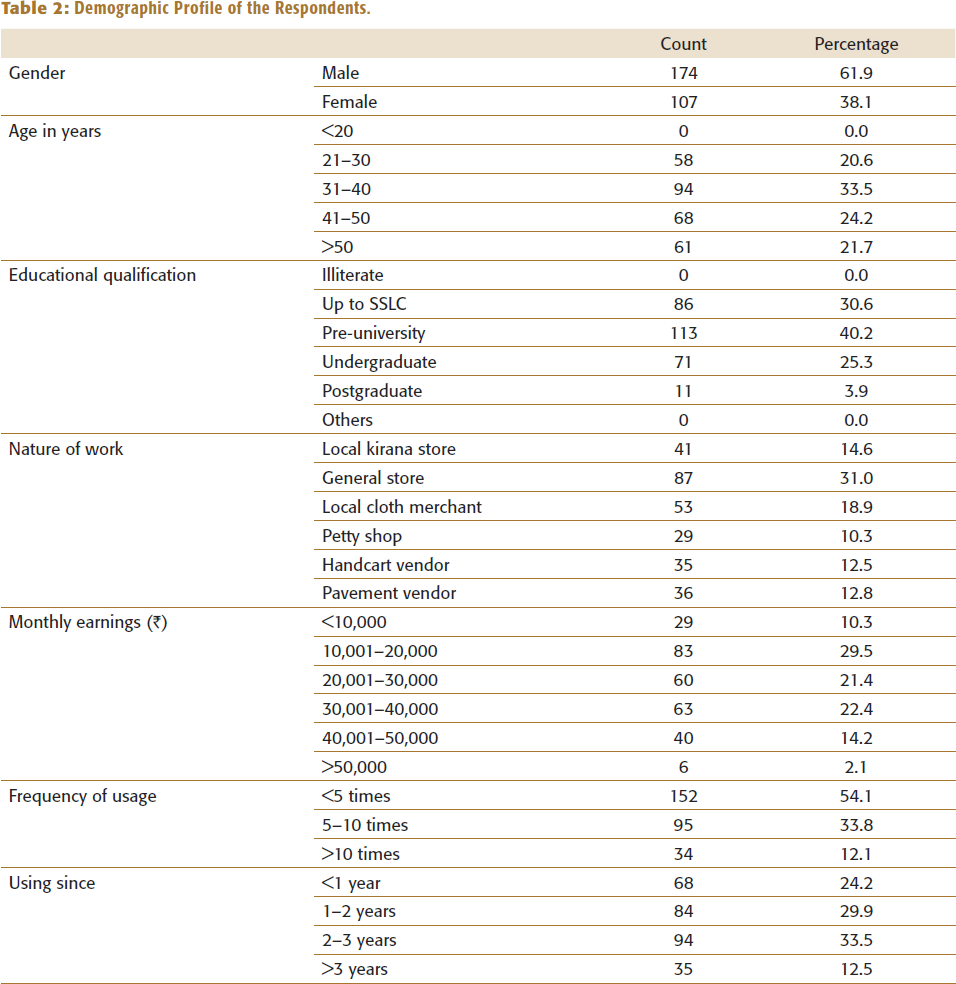
Table 2 exhibits the demographic characteristics of respondents. From Table 2, it is evident that 61.9% were male and 38.1% were female. The majority of respondents belonged to the 31–40 (33.5%) age group, followed by 41–50 years (24.2%), above 50 years (21.7%) and 20–30 years (20.6%). With reference to educational qualification, most of the respondents are pre-university qualified (40.2%), followed by SSLC (30.6%), undergraduates (25.3%) and postgraduates (3.9%). Regarding nature of work, the majority (31.0%) of the respondents run a general store, followed by local cloth merchant (18.9%), local kirana store (14.6%), pavement vendor (12.8%), handcart vendor (12.5%) and petty shop (10.3%). Further, in monthly earnings, 29.5% earn between ₹10,001 and ₹20,000; 22.4% earn between ₹30,001 and ₹40,000; 21.4% earn between ₹20,001 and 30,000; 14.2% earn between ₹40,001 and 50,000; 10.3% earn less than ₹10,000 and just 2.1% earn above ₹50,000. Regarding frequency of usage, most of the respondents (54.1%) use m-payments less than 5 times a day, 33.8% of them use m-payments 5–10 times a day and 12.1% use more than 10 times a day. Finally, 33.5% of the respondents are using m-payments for 2–3 years, 29.9% from 1–2 years, 24.2% have been using m-payments for a period of less than a year and 12.5% of them have been using m-payments for more than 3 years.
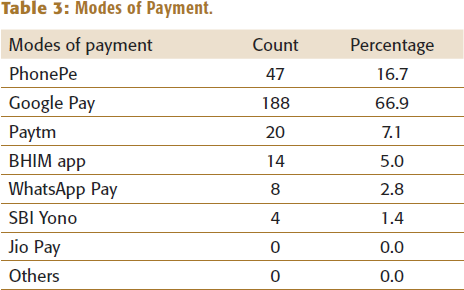
In the modes of payment used, the majority of the respondents used Google Pay (66.9%), followed by PhonePe (16.7%), Paytm (7.1%), BHIM app (5.0%), WhatsApp Pay (2.8%) and SBI Yono (1.4%). Table 3 exhibits the modes of payment used by the respondents.
Demographic Profile of the Respondents.
Modes of Payment.
Pre-testing of the Instrument
Once the questionnaire (see Appendix B) was finalized, a trial study was carried out on 30 vendors in Ernakulam district (Kerala) in India. The primary goal of the pilot test was to evaluate the level of acceptability, flexibility, reliability and validity of the suggested behavioural scales. In total, 42 items from the original set of 49 items were retained, while the remaining were eliminated due to their repetition and irrelevance.
The validity test was carried out using Pearson’s correlation coefficient. The Pearson’s correlation value derived through the test was higher than the value given in Pearson’s correlation table of critical values (>0.113). There is a perfect positive correlation among variables. The two-tailed significance value was less than 0.05, indicating that the questionnaire and the statements are valid.
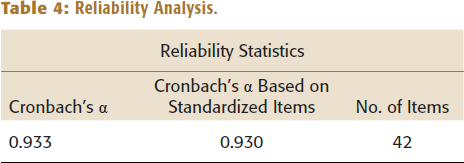
The reliability of variables was evaluated using Cronbach’s α, which is regarded as an indicator of scale reliability. The internal coherence of the indications is shown by Cronbach’s α (Hair et al., 2019). A reliable measurement is one in which Cronbach’s α value is more than 0.7 (Henseler et al., 2009; Nunnally, 1978). Table 4 exhibits Cronbach’s α value which is more than 0.7, signifying scale reliability.
Reliability Analysis.
DATA ANALYSIS
The hypothesized theoretical model was tested using structural equation modelling and maximum likelihood estimation. The model fitness and causal relationships between the latent components were evaluated using a two-step modelling approach, as proposed by Anderson and Gerbing (1988). First, the relationship between the observed variables and the relevant constructs was established using a confirmatory factor analysis (CFA) applied to the measurement model. The following phase involved evaluating the proposed causal connections between the constructs (structural model). A thorough confirmatory evaluation of the construct validity is presented by the measuring model and the structural model (Anderson & Gerbing, 1988; Bentler, 1978).
Exploratory Factor Analysis
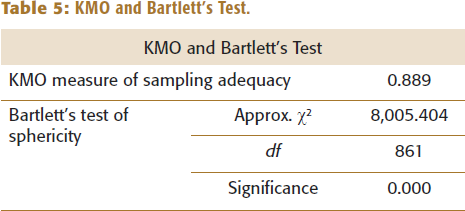
To explore the extent of scale unidimensionality, an exploratory factor analysis (EFA) was performed using the PCEM. All items are loaded on their own constructs. The Kaiser–Meyer–Olkin (KMO) test was performed to determine the appropriateness of conducting EFA (Table 5).
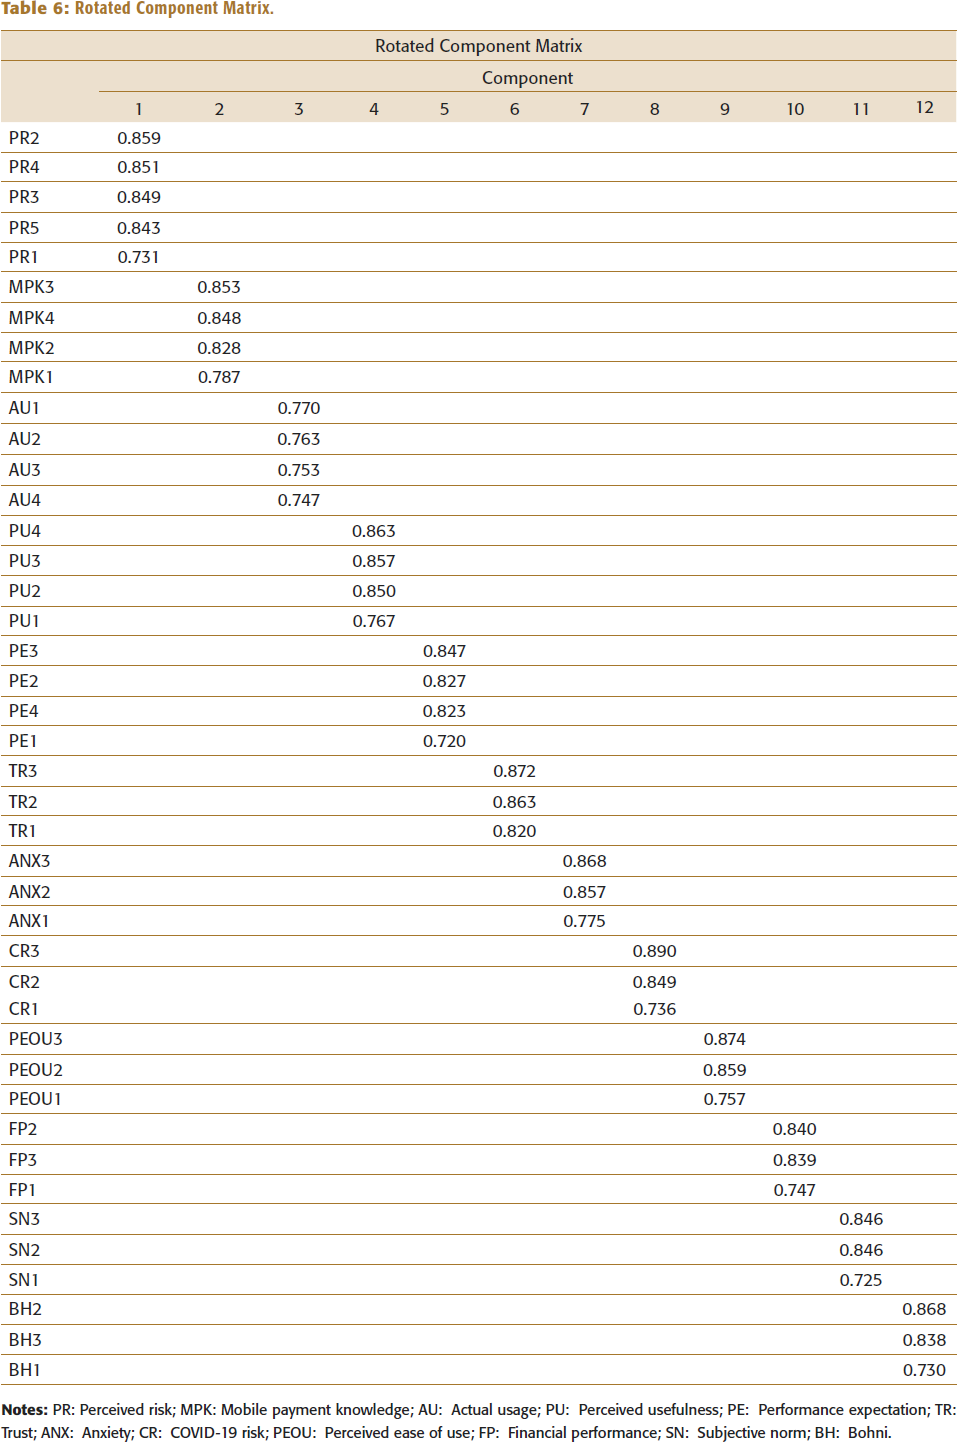
From Table 5, it is seen that the KMO value is 0.889, which implies that the sample size was acceptable. Bartlett’s test of sphericity with an estimated χ2 value is 8,005.404, and p = 0.000 is statistically significant at the 5% level. Therefore, it can be inferred that the variables considered for factor analysis form a normal distribution. A total of 42 factors were reduced to 12 factors using the PCEM and varimax rotation methods (Table 6), explaining 79.318% of variance.
KMO and Bartlett’s Test.
Rotated Component Matrix.
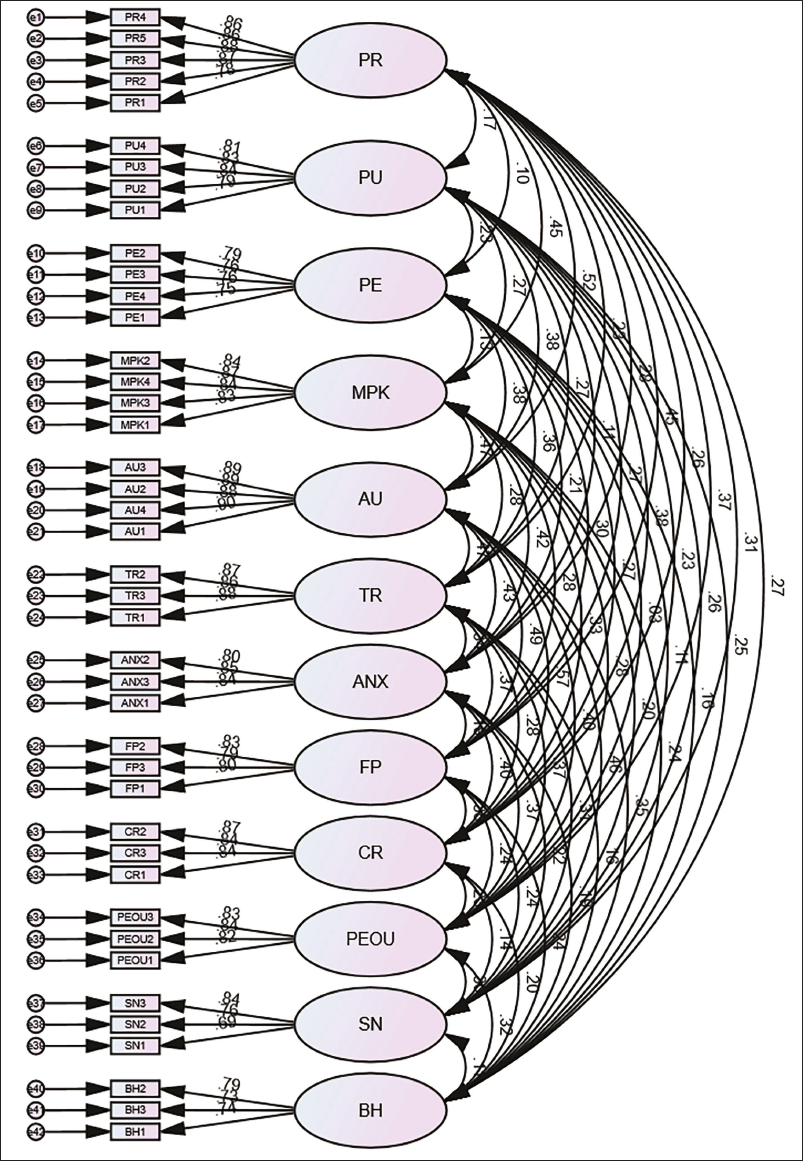
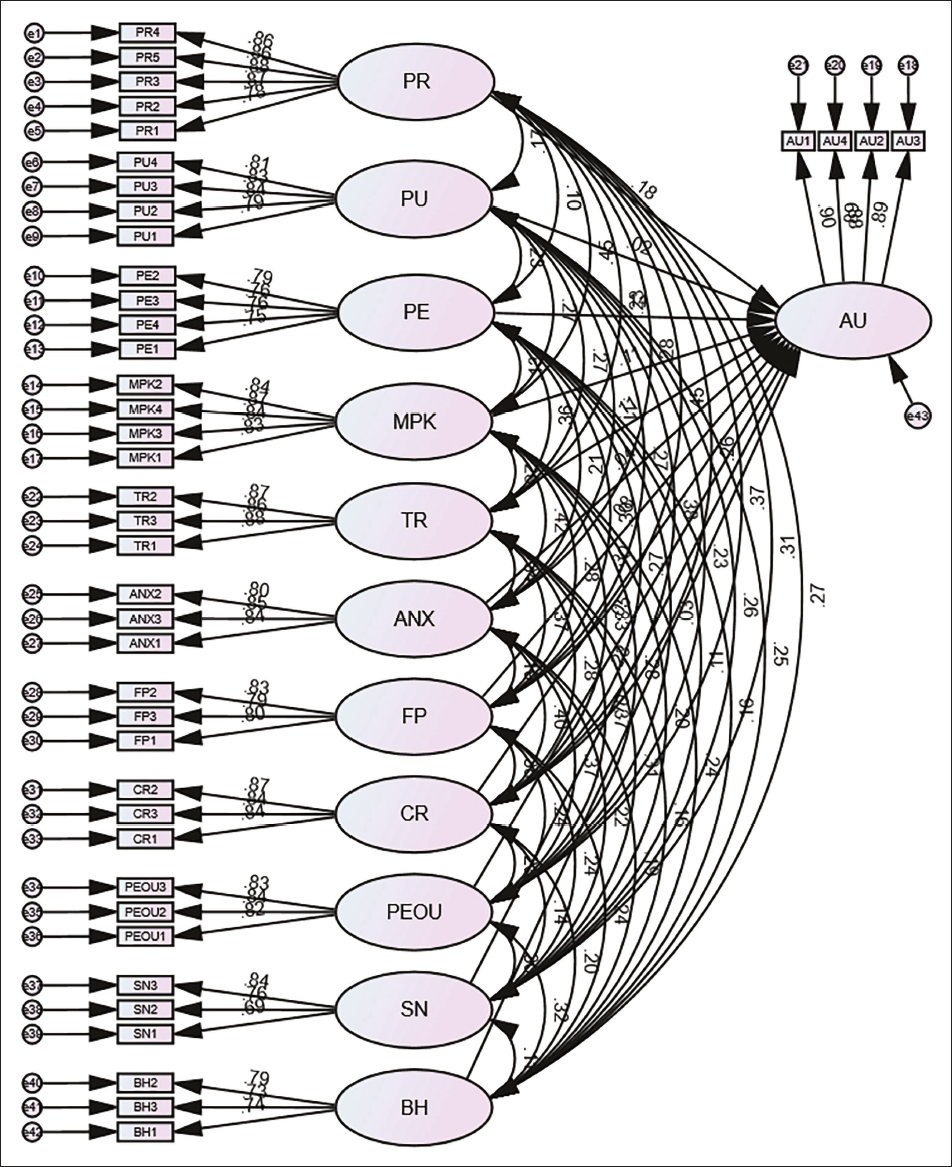
Measurement Model
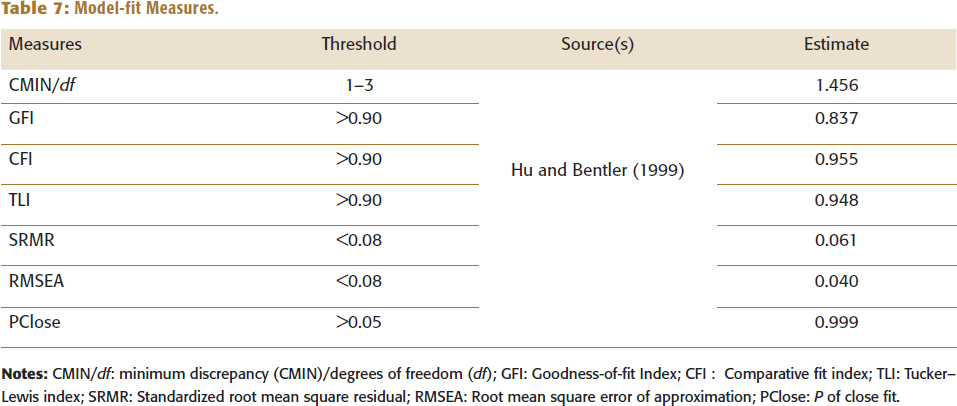
CFA was evaluated using AMOS version 24 to test the measurement model (Figure 2). Factor loadings were evaluated for each item as part of CFA. The model fit was calculated using the model-fit metrics (CMIN/df, GFI, CFI, TLI, SRMR and RMSEA), and all values remained within their corresponding common acceptability levels (Hu & Bentler, 1999). The 12-factor model yielded a good fit for the data: CMIN/df = 1.456, GFI = 0.837, CFI = 0.955, TLI = 0.948, SRMR = 0.061 and RMSEA = 0.040 (Table 7). The goodness-of-fit statistics (χ2 = 944.406, df = 753, p = 0.0001) confirm that the proposed measurement model successfully fits the data. The χ2 value divided by the degrees of freedom was 1.25, lying within the advised range of 1–3 (Carmines & McIver, 1981).
Model-fit Measures.
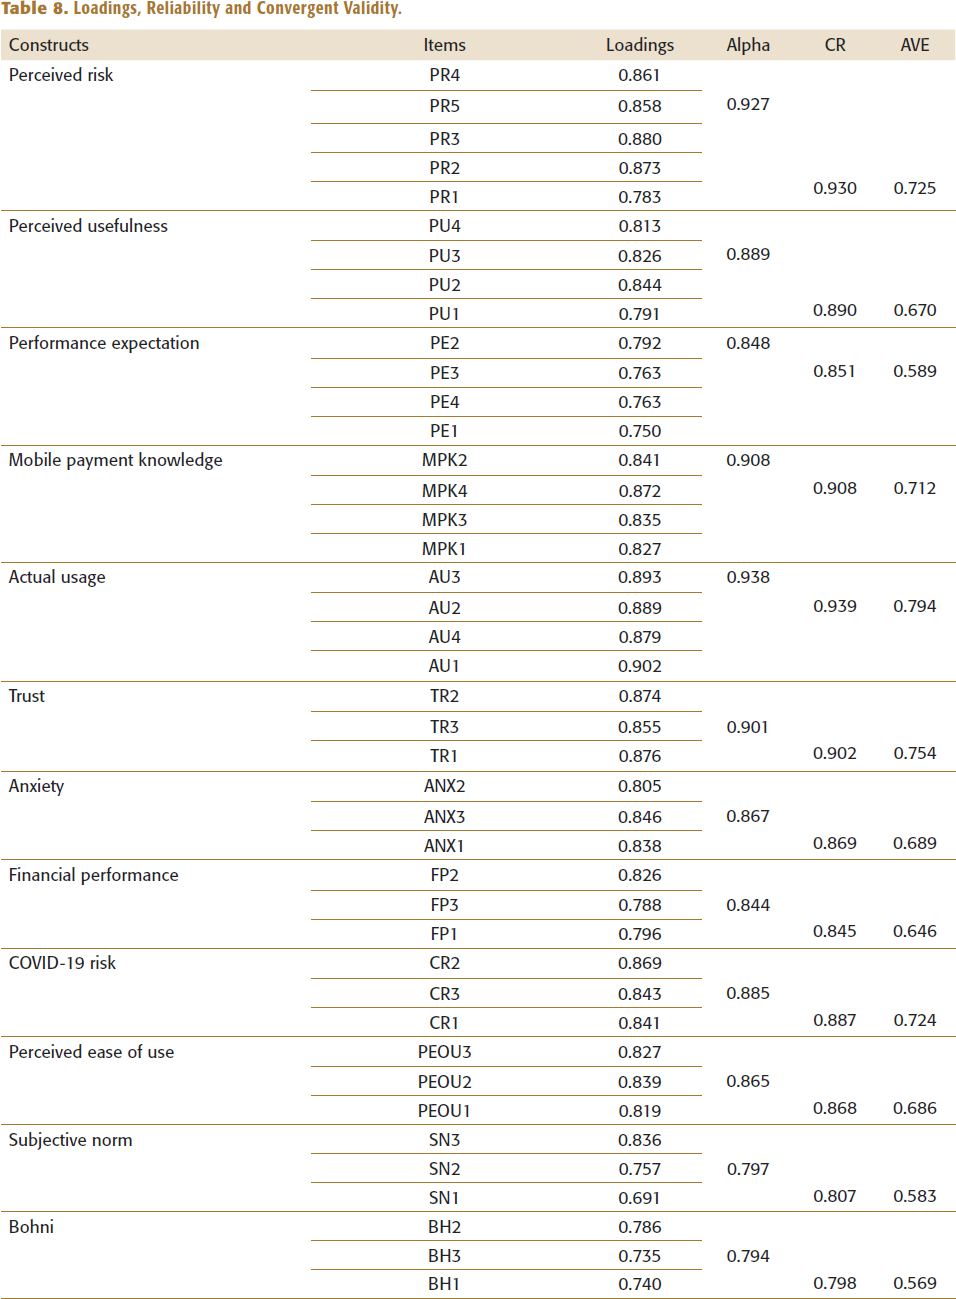
Construct reliability was calculated using Cronbach’s α and composite reliability. Each construct in the analysis had a Cronbach α that was more than the necessary threshold of 0.70 (Nunnally & Bernstein, 1994). Composite reliability ranged from 0.79 to 0.93, greater than the 0.70 benchmark (Hair et al., 2010). Hence, construct reliability was determined for each construct in the study (Table 8).
Convergent validity was calculated using average variance extracted (AVE). The AVE values were greater than the recommended value of 0.50 (Fornell & Larcker, 1981). Thus, the scales utilized for the study exhibit the necessary convergent validity (Table 8).
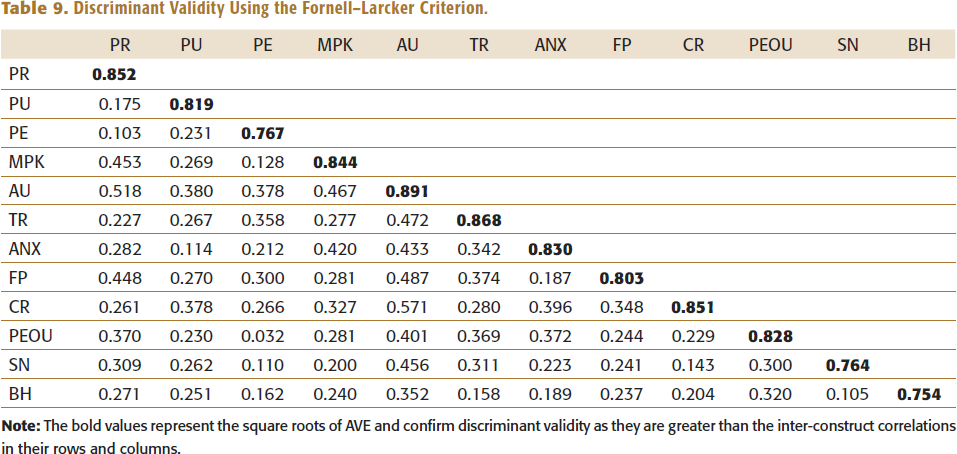
Discriminant validity was calculated using the Fornell–Larcker criterion. The square root of the AVE of a construct is higher than the corresponding inter-construct correlation estimates, indicating discriminant validity (Fornell & Larcker, 1981). Table 9 displays the squared AVE and the correlation estimates.
Loadings, Reliability and Convergent Validity.
Discriminant Validity Using the Fornell–Larcker Criterion.
Structural Model
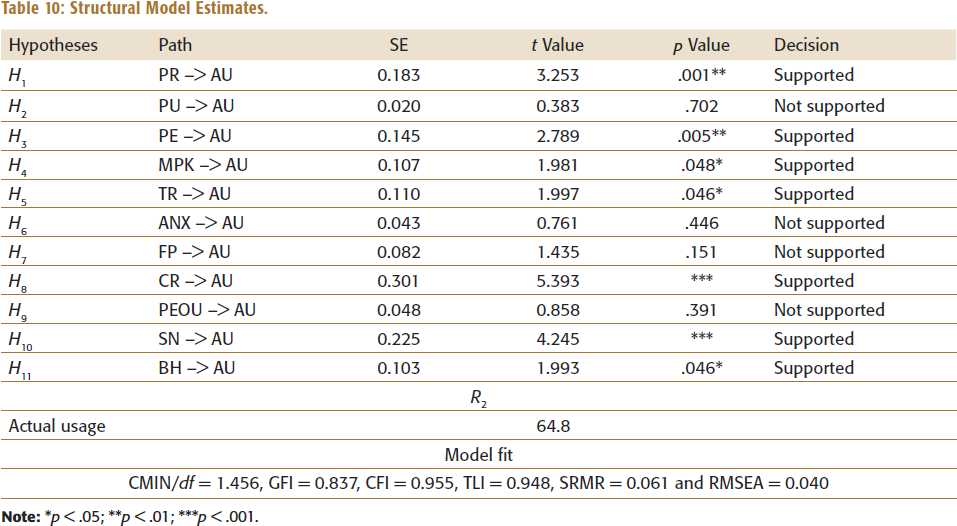
Before the assessment of the structural model (Figure 3), the tolerance and variance inflation factor (VIF) values of the study were tested. The tolerance values must be greater than 0.2, and the VIF values must be <5 based on the criteria to confirm that the model is functional and does not deal with collinearity issues. The tolerance values ranged from 0.27 to 0.49, and the VIF values ranged from 2.0 to 3.9 in this study. Hence, this study does not have a multicollinearity issue. Table 10 displays the model-fit summary, which is within the acceptable level: CMIN/df = 1.456, GFI = 0.837, CFI = 0.955, TLI = 0.948, SRMR = 0.061, and RMSEA = 0.040 and PClose = 0.999.
The R2 derived in this study is 0.648, signifying that the structural model can describe 64.8% of the actual usage. Additionally, the path coefficients exhibit a positive relationship between PR, PE, MPK, TR, CR, SN and BH and a negative relationship between PU, ANX, FP and PEOU. Model-fit indices and hypothesis results are displayed in Table 10. Therefore, the most significant construct is CR, with a value of 0.301, followed by SN, with a value of 0.225, PR (0.183), PE (0.145), TR (0.110), MPK (0.107) and BH (0.103). However, after evaluating the t value and p value at a 95% confidence interval, only PR, PE, MPK, TR, CR, SN and BH are considered significant towards AU. Hence, H1, H3, H4, H5, H8, H10 and H11 are supported by the model.
Structural Model.
Structural Model Estimates.
RESULTS
A hypothetical model was used to explore the connection and impact of PU, PEOU, SN, PE, FP, TR, MPK, CR, BH, ANX and PR on AU of m-payments by unorganized vendors in Kerala. The model output and inferences from the measurement model and structural model were developed using AMOS software. As a result, the model was supported by 7 out of 11 hypotheses: PR, PE, MPK, TR, CR, SN and BH.
H1 evaluates whether PR negatively affects AU of m-payments. The results revealed that PR has an insignificant impact on AU (β = 0.813, t = 3.253, p < .01). Hence, H1 was not supported. This result supports the hypothesis that customers’ desire to adopt and use new technology might be hindered by their perception of risk. This perception of risk may result from many issues about safety, privacy or usage. H2 assesses whether PU has a significant effect on AU. The results show that PU does not have a significant impact on AU (β = 0.020, t = 0.383, p > .05). This variable does not support the decision to use m-payments. People no longer feel that m-payment systems improve their job performance and increase their productivity. H3 evaluates if PE has a positive impact on AU. The results revealed a strong positive impact between PE and AU (β = 0.145, t = 2.789, p < .01). Hence, H3 is supported. This finding confirms that vendors believe the usage of m-payment accelerates their total ability in the business. H4 assesses whether MPK has a positive and significant effect on AU. The results revealed a significant positive relation between MPK and AU (β = 0.107, t = 1.981, p < .05). People’s understanding of how and where to use m-payment services plays a pivotal part in the adoption intention of m-payment. H5 evaluates whether TR has a positive effect on AU of m-payments. The results show that TR has a positive and significant effect on AU (β = 0.110, t = 1.997, p < .05). Trust plays a vital part in the adoption and usage of m-payments. H6 assesses if ANX has a negative impact on AU. The results revealed an insignificant relation between ANX and AU (β = 0.043, t= 0.761, p > .05). This study does not support anxiety as a factor, creating a negative effect on the actual usage of m-payments. H7 evaluates whether FP has a significant effect on AU of m-payments. The results show there is an insignificant effect between FP and AU (β = 0.082, t = 1.435, p > .05). Perceived financial benefits of m-payment are not a primary motivator for the unorganized retailers to adopt the m-payment system. H8 assesses whether CR has a significant and positive effect on AU. The results revealed a significant impact between CR and AU of m-payments (β = 0.301, t = 5.393, p < .001). The COVID-19 risk instilled a fear in the minds of the people, thereby influencing the adoption decision. H9 evaluates if PEOU has a significant and positive impact on AU. The results show that PEOU is not a significant determinant of AU of m-payments (β = 0.048, t = 0.858, p > .05). Vendors believe that with the knowledge and experience of any technology, PEOU is not considered an important determinant of AU. H10 assesses whether SN has a positive and significant impact on AU. The results revealed that there is a positive and significant impact between SN and AU of m-payments (β = 0.225, t = 4.245, p < .001). SN plays a vital part in influencing the adoption and usage of m-payments. This is because individuals often look to others in their social group for cues on how to behave, especially when it comes to adopting new technologies. H11 evaluates whether BH has a negative effect on AU. The results show that there is a negative impact of BH on AU of m-payments (β = 0.103, t = 1.993, p < .05). Since bohni holds a strong cultural significance, it limits the usage of m-payments among vendors.
DISCUSSION
The present study aims to analyse the significant and insignificant factors influencing the actual usage of m-payments among unorganized retail vendors. Results showed that perceived usefulness, anxiety, financial performance and PEOU were not significant, whereas perceived risk, performance expectancy, MPK, trust, COVID-19 risk, subjective norm and bohni were found to have a significant relationship with AU. The findings show a strong, significant negative association between PR and AU. This finding is similar to Liébana-Cabanillas et al. (2019) and Almaiah et al. (2022), who found that PR and security are crucial determinants of customers’ inclination to adopt near-field communication m-payment methods. People are less likely to use m-payments when they believe there are greater risks associated with them. These dangers can be linked to concerns over safety, privacy, fraud or loss of money. Vendors are unlikely to make any transactions at all if they believe that using m-payments could result in fraud or that their personal information could be disclosed or leaked without their authorization. This hesitation impacts the behaviour by encouraging people to continue with traditional payment methods like cash or cards. Research on this has been undertaken across a variety of inventions and technologies, and the results have consistently shown a negative impact of PR on people’s intentions to adopt new technology (Almaiah et al., 2022; Alrawad et al., 2022; Yang et al., 2015).
The TAM has been proposed as applicable to the adoption of m-payment technologies by several authors (Denaputri & Usman, 2019; Kim & Kim, 2022). Contrary to the theory, perceived usefulness is not significant. The vendors have started using m-payment because of the convenience it offers and due to more customer adoption. Users place a higher value on convenience and ease of use than on prominent gains in output or usefulness. This is especially true in retail settings where users perceive m-payments as a means of streamlining transactions rather than increasing productivity.
Performance expectancy has a favourable and considerable effect on actual usage, which is previously predicted by the UTAUT theory. This is in line with earlier studies by Oliveira et al. (2016), Morosan and DeFranco (2016) and Moorthy et al. (2020). Efficiency and customer contentment are critical to survival in the highly competitive world that unorganized retailers frequently compete in. Retailers are more likely to implement and maintain these systems if they think that m-payments may simplify transactions, minimize cash handling, enhance record-keeping and ultimately improve customer service. Actual usage is driven by this expectation of performance improvement, which retailers have as they look to gain a competitive edge, improve consumer experiences and reduce the potential risks involved with traditional cash transactions.
MPK is a crucial determinant of m-payment adoption. This finding is further supported by Jung et al. (2020). Knowledge of m-payments and usage is strongly correlated; the more individuals understand this technology, the more they utilize it. When people are more knowledgeable about how m-payment systems operate (such as security features or user-friendliness), they are more likely to utilize them since it gives them the confidence to use these services. Furthermore, those who understand how m-payments work also benefit from other features like enhanced security via tokenization and encryption, quicker transactions and the ease of going cashless.
This study proves a significant optimistic connection between trust and actual usage, meaning that vendors are more likely to utilize m-payment systems if they have a greater trust in them. Without it, users may be hesitant to adopt the technology, regardless of its potential benefits. This includes aspects such as security, privacy, reliability and ease of use (Chin et al., 2022; Daştan & Gürler, 2016; Mondego & Gide, 2018). Trust comprises several aspects, such as trusting in transaction security; feeling assured that the system will protect money and personal information; and understanding that it will function properly and without mistakes. People are more likely to utilize m-payments if they are satisfied and safeguarded, as m-payments are perceived as more reliable and convenient than conventional payment methods like cash or cards.
An insignificant relation between anxiety and usage suggests that while some users may experience anxiety about using m-payments, this anxiety does not significantly impact their overall usage of these services. When using m-payment services, some users may be concerned about technology, security or privacy, but this does not appear to have an impact on how they actually utilize the service. Despite the perceived risk, m-payments remain a popular choice among people because of their convenience in this era of digitalization and quicker transactions. Consequently, other factors such as the ease of using these payment systems and the necessity of conducting digital transactions might outweigh any anxiety-based concerns.
An insignificant effect between financial performance and usage contradicts the hypotheses. Thus, it can be inferred that m-payment is designed to be used for convenience. So, the perception of m-payment influencing and increasing turnover no longer represents a variable.
COVID-19 risk has a significant effect on AU of m-payments. Thus, fear of touching notes and more customer adoption has positively impacted the vendors in using the m-payment systems (Daragmeh et al., 2021). Unorganized retailers decided to accept m-payments instead of cash due to safety and in accordance with health regulations. This shift reduced the amount of in-person interactions with buyers while simultaneously enabling cash-free transactions, which increased security for both sellers and customers. Due to their ease of use and flexibility, m-payment systems were readily adopted by those with limited technical knowledge, making them essential for small businesses to survive during the pandemic.
The findings by Koufaris (2002) and Wu and Wang (2005) related to m-payment systems are confirmed by the insignificant connection between PEOU and actual usage. It is predicted that as users gain more experience with any technology, the impact of PEOU will diminish with time (Venkatesh, 2000; Venkatesh & Davis, 1996). First, most of the young people believe they have extensive knowledge and experience with smartphones, and they routinely use them for a variety of activities like installing apps, playing games online and utilizing mobile internet. This provides a strong argument in favour of our findings that PEOU is not a significant determinant of AU of m-payments. Second, the impact of ease of use may be negated by cultural factors, individual habits or conventional preferences.
Subjective norm has a positive impact on actual usage. Social influence plays an essential role in the acceptance and usage of m-payments. If people in their social circle are using m-payments and find it beneficial, individuals are more likely to adopt it as well. This is supported by various studies in the field (Flavián et al., 2020; Valencia et al., 2021). Unorganized sellers depend heavily on their relationships with customers, other vendors and community members in the local markets or street stalls where they operate. The expectation or preference of peers, consumers or community influencers regarding m-payments will lead them to adopt this technology.
The findings further reveal that bohni has a negative effect on the actual usage of m-payments among the vendors. Since bohni is a customary belief that accepting cash for the first business of the day brings luck and increases sales, vendors are reluctant to use m-payments. This belief has led to the restriction of m-payment usage.
To answer RQ1, the adoption of m-payments in unorganized retail sectors is highly influenced by behavioural and cultural factors. In these sectors, businesses are influenced by social norms, local conventions and traditions. The degree to which unorganized businesses accept m-payments can be influenced by cultural norms and behavioural patterns, such as a preference for in-person encounters, a distrust of digital technologies and faith in cash transactions. It can be difficult to transition to digital alternatives in some cultures where cash transactions are deeply valued as a sign of transparency and confidence. Also, m-payments might face aversion in communities with lower technology adoption rates because of unfamiliarity, fraud concern or a lack of technical know-how. In terms of behaviour, unorganized retail is frequently driven by long-lasting connections and personal bonds. This may lead to hesitation to accept m-payments since they are thought to be impersonal or at variance with traditional business practices. But behavioural and cultural aspects can also be used to encourage m-payments. To create a sense of acceptability and trust, community leaders and influencers can be extremely important in promoting digital payment systems. Targeted education and awareness initiatives that emphasize the advantages of m-payments—like simplicity, security and financial inclusion can eliminate concerns.
RQ 2: The significance of variables determining the actual usage (AU) of m-payments among unorganized retailers is impacted by external forces such as market competition, government policies and technological improvements. These variables interact as follows:
The acceptance of m-payments can be strongly impacted by incentives and regulatory frameworks (Qasim & Abu-Shanab, 2016). Policies that require or promote cashless transactions may raise the perceived risk of non-compliance and hence affect usage (Datta & Roy, 2022). On the contrary, policies that are helpful, like digital infrastructure subsidies, can lower perceived risk and raise performance expectancy (Yuan et al., 2023).
The degree of market rivalry has the potential to stimulate innovation and impact the perceived value of m-payments (Alhallaq et al., 2019; He, 2015). A competitive market can influence variables like trust and performance expectancy since it frequently produces better, more user-friendly payment systems. To keep their competitive edge, retailers in highly competitive markets may embrace m-payments more quickly (Esawe, 2022).
The knowledge of m-payments and their ease of integration into merchants’ current systems might be impacted by the rate of technical advancement (Vatalaro & Vizzarri, 2016). The perceived usefulness and ease of use, which are crucial for actual usage, may improve or deteriorate as technology develops. Technological advancements can also reduce perceived risks by improving security features (Jameel & Karem, 2022; Kumari & Biswas, 2023).
THEORETICAL AND PRACTICAL IMPLICATIONS
The findings of this research could help in the development of both theories and policies. The study establishes a connection between various factors and the usage of m-payments among unorganized retailers. This study’s findings will help formulate policy with special reference to unorganized retailers, where cultural and psychological factors are considered by the m-payment service providers, thereby promoting adoption and usage.
The theoretical implications of the article encompass an array of concepts. In keeping with well-established frameworks like the TAM and the UTAUT, the inclusion of traditional variables related to technology adoption, such as perceived usefulness, trust, PEOU and subjective norms, has been implemented. A deeper comprehension of technology adoption is indicated by the introduction of new constructs like bohni. This emphasizes the need to expand existing models and include more contextual and cultural factors.
Vendors’ fears and beliefs impact m-payment adoption, highlighting the importance of cultural factors and aligning with theories like the diffusion of innovations. The adoption of technology may be influenced by cultural beliefs and superstitions, according to constructs such as BH, which highlights the need for behavioural models that take these factors into account. The study’s emphasis on perceived risk and anxiety has implications for comprehending fear and uncertainty in the adoption of technology, suggesting that psychological barriers must be considered.
These findings extend beyond the theoretical framework in research and have applications for stakeholders and policymakers who wish to witness an upsurge in the use of m-payments among unorganized retailers. The research indicates that effective approaches should include contextually informed policy frameworks, community education and awareness campaigns and technical usability in addition to addressing underlying cultural attitudes and anxieties. This holistic approach can encourage m-payments to be more widely accepted and used in unorganized retail sectors.
LIMITATIONS AND FUTURE RESEARCH
This article outlines critical factors that influence the adoption of m-payments; however, it has certain limitations. Only the users of m-payments were surveyed for this study. Future research can be done on both adopters and non-adopters to discover factors determining the usage and non-usage of m-payments. The results of this research reveal that PU and anxiety have no significant impact on vendors using m-payments. As this finding is at variance with the earlier studies, it is suggested that further research can be conducted to study the impact of these variables on different demographic variables using m-payment systems. India is the most populated country in the world with a large rural and urban gap, thereby the findings cannot completely disclose the situation of vendors in different areas. Hence, it is suggested that more places may be considered to gain an extensive knowledge of the situation of using m-payment in India, along with variation in the factors regarding the usage of m-payment systems. Another constraint of this study is that some factors that are considered crucial for the adoption of m-payments are not included. Further studies can include factors such as compatibility (Moore & Benbasat, 1991), perceived transaction convenience (Chen, 2008) and insecurity (Parasuraman, 2000). This study is confined to unorganized retailers. Furthermore, a comparative study can also be carried out between organized and unorganized retailers.
CONCLUSION
This article aimed to explore the significant and insignificant factors of m-payment usage among the unorganized retailers in Kerala. The authors considered variables related to this subject from the existing literature. These variables were perceived usefulness, trust, PEOU, subjective norm, performance expectancy, MPK, perceived risk, COVID-19 risk and anxiety. The other variables, like financial performance and bohni, were found by the authors. Though the variables taken from the literature play a considerable role in the acceptance of m-payments, bohni (seller’s luck) plays a vital role in the m-payment usage. In other words, certain beliefs and fear in the minds of vendors create both positive and negative impacts on the usage and continuance intention of m-payments. For researchers, this study provides an addition to existing literature for a much deeper understanding of the vendor model of adoption. This study further benefits the policymakers and other stakeholders who are working towards the intense penetration of retail digital payments and retail market penetration.
Footnotes
DECLARATION OF CONFLICTING INTERESTS
The authors declared no potential conflicts of interest with respect to the research, authorship and/or publication of this article.
FUNDING
The authors received no financial support for the research, authorship and/or publication of this article.
NOTE
E-mail:
E-mail: