
Abstract
The article aims to estimate the relationship between synergy gains and deal size of mergers & acquisitions for Indian firms by examining deals that took place between 2005 and 2015. The paper employs principal component analysis to create a composite variable representing operating and financial synergy, followed by instrument variable 2SLS regression to estimate the relationship. The results suggest that small dealsize transactions do considerably better than large deals. The magnitude of financial synergy increases with deal size . However, large companies suffer substantial operating synergistic erosion.
Keywords
Considering the contradictory predictions about the association between the size of merger and acquisition (M&A) deals and synergy benefits, we use a sample of 120 Indian-listed public acquisitions confirmed between 2005 and 2015 to empirically analyse its trajectory. From 2002 to 2018, the data span a seven-year period for each transaction. Since synergy is a complex principle with several sub-indicators, principal component analysis (PCA) was used to create a composite operating and financial synergy measure. The association between deal size and synergy benefits is then estimated using instrument variable 2SLS regression. The uniqueness of the research is that it proposes a method for analysing M&A phenomena employing a composite synergy component that correctly represents the complex phenomenon.
In this study, we find that smaller firms do considerably better than large organizations. As per the results, deal size has been found to have a positive and significant association with financial synergy but is negatively associated with operating synergy. It has been observed that as the deal size increases, the magnitude of financial synergy gain also increases. This indicates that with an increase in the size of the acquisition deal, the financial synergy is realized more in the case of Indian M&As. However, the relationship between deal size and operating synergy is contradictory. When large companies disclose the acquisitions of public entities, they suffer substantial operating synergistic erosion, regardless of how the merger is funded. We discovered that this size effect is robust. This contrasts existing studies, which suggest that operating synergies are more realized than financial synergy.
An interesting observation from the research is that small M&A deals (under 500 million) offer acquirers significant operational and financial benefits, while larger companies face higher acquisition costs and less favourable operating synergies in their deals.
Organizations seeking to increase wealth creation use strategic partnerships and mergers and acquisitions (M&A) as their primary corporate policies. Deepening competition has fuelled the increasing trend of M&As worldwide. In addition to augmenting profits for shareholders, there is a need to control prices, grow globally, take advantage of economies of scale, raise technological spending for competitive advantages and expand industry into emerging sectors. The size differences between the bidder and target firms impact merger performance, and big acquisitions have a greater convergence capacity (Kitching, 1967).
Prior research examining short-term returns uses an event-study methodology or residual analysis. Some acquiring companies saw large positive benefits as a result of the merger announcement (Asquith et al., 1983; Canina, 2001); others reported substantial losses (Asquith, 1983; Goddard et. al., 2012; Hsu & Jang, 2007; Kumar & Panneerselvam, 2009; Sheel & Nagpal, 2000). As a result, the acquiring organizations’ performance on the announcement was uneven.
Mixed results have also been reported when it comes to the relationship between acquisition benefits and deal attributes, including transaction size and payment process (Alexandridis et al., 2013; Gupta & Misra, 2007; Moeller et al., 2004). This article concentrates primarily on deal size and addresses the key issue: Do comparatively big mergers produce greater value? Merger proposals may be made by managers seeking to optimize profit or by managers with non-synergistic intentions, which are usually classified as organizational hubris (Roll, 1986). The aim of corporate strategy is to maximize profit. The association between total merger synergies, both operating and financial synergies, and the size of the deal is investigated and validates our forecasts using a broad sample of Indian corporate mergers.
Considering that the market divides M&As into value-enhancing and value-reducing categories, the predicted association between acquisition benefits and deal size has insightful ramifications. Bigger mergers, by definition, are riskier than smaller mergers, but they can also deliver greater value benefits. What is the predicted association between the size of the deal and the increase in value? This depends on whether the bid originated with the motivation of value-enhancing or value-reducing. Large mergers would be undertaken by value-maximizing managers if they are assured that the risk–return barter is favourable. Merger synergies can thus be strongly linked to deal size for such a group of bidders. Value-reducing managers, on the other hand, might be less worried about shareholders’ wealth and are more likely to engage in risk-return barter that is less favourable (Gupta & Misra, 2007).
Considering the contradictory predictions about the association between the synergy benefits and size of M&A deals, the present paper has used a sample of 107 Indian-listed public acquisitions confirmed between 2005 and 2015 to empirically analyse its trajectory. From 2002 to 2018, the data span three years before the transaction, the year of the transaction, and three years after the transaction, with a total of seven years of data for each transaction. Since synergy is a complex principle with several sub-indicators, PCA was used to create a composite operating and financial synergy measure. The association between deal size and synergy benefits is then estimated using instrument variable 2SLS regression. The remainder of the present paper is laid out as follows. The literature analysis of established research is discussed in the next section. The study’s objective follows the literature review. Thereafter, a research design describing the data and methodologies used in our investigation is presented. Results are discussed in the next section with final concluding remarks and policy implications.
LITERATURE REVIEW
According to the Boston Consulting Group (2007), large deals worth more than $1 billion lost roughly twice as much wealth as smaller deals (Cools et al., 2007). According to research, acquiring firms lose greater equity when they make large acquisitions. Acquirers spend more money in large transactions, which offer less value to them. This happens if overconfident managers overestimate the potential of the deal to reap acquisition gains (Hayward & Hambrick, 1997; Malmendier & Tate, 2008). Furthermore, managers can overpay for big targets because they usually come with many private paybacks (Grinstein & Hribar, 2004; Harford & Li, 2007). However, the difficulty in merging large companies will make potential synergies from a merger less likely, resulting in a smaller deal acquisition size. Since large companies appear to have lower managerial control (Demsetz & Lehn, 1985), they can consider smaller deal sizes, resulting in lower profits for their stakeholders (Bauguess et al., 2009).
Different assumptions for the anticipated association between the size of the transaction and merger synergies have been suggested in the literature. As per Gorton and Rosen (1995), financial acquisitions are motivated by expansionism, and value maximization is not the driving force behind mergers. It induces the illusion that larger mergers will result in larger value reductions. Size maximization could be a favourable course of action for certain financial firms due to the prospect of obtaining potential regulatory subsidies depending on firm size (O’Hara & Shaw, 1990). The relation of target to bidder size is favourably linked to aggregate gains in financial mergers, according to Houston et al. (2001) and DeLong (2001). In a broad sample of non-financial M&As, Moeller et al. (2004) found a consistent size impact on declaration time unexpected returns. Regardless of the type of funding or whether the purchased company is public or private, the announcement return on acquiring-firm owners is about 2% higher for minor acquirers. The size effect is unchanged by organization or transaction characteristics, and it lasts for a long time.
Given the contradictory claims about the relationship between M&A deal size and takeover premiums, Alexandridis et al. (2013) found that size tends to be inversely associated with offer premiums, and the possibility for overpaying in large deals seems to be lower. Although acquirers pay smaller premiums and are less inclined to overpay for larger targets, larger firm acquisitions deplete greater wealth for acquiring shareholders. This is consistent with the notion that the increased complexity related to large targets makes achieving the expected economic advantages more challenging for acquirers.
OBJECTIVE OF THE STUDY
The present study looks at 107 M&A deals between 2005 and 2015. The primary goal of this study is to explore (a) the impact of the size of the deal on operating synergies generated post-merger and (b) impact of the size of the deal on financial synergies generated post-merger. Here, the size of the deal is defined as the announced total value (in millions).
RESEARCH DESIGN
This section presents the methodological model, which includes data sources, factors and the quantitative method used to characterize factors determining synergies obtained for M&A companies in India.
DESCRIPTION OF DATA
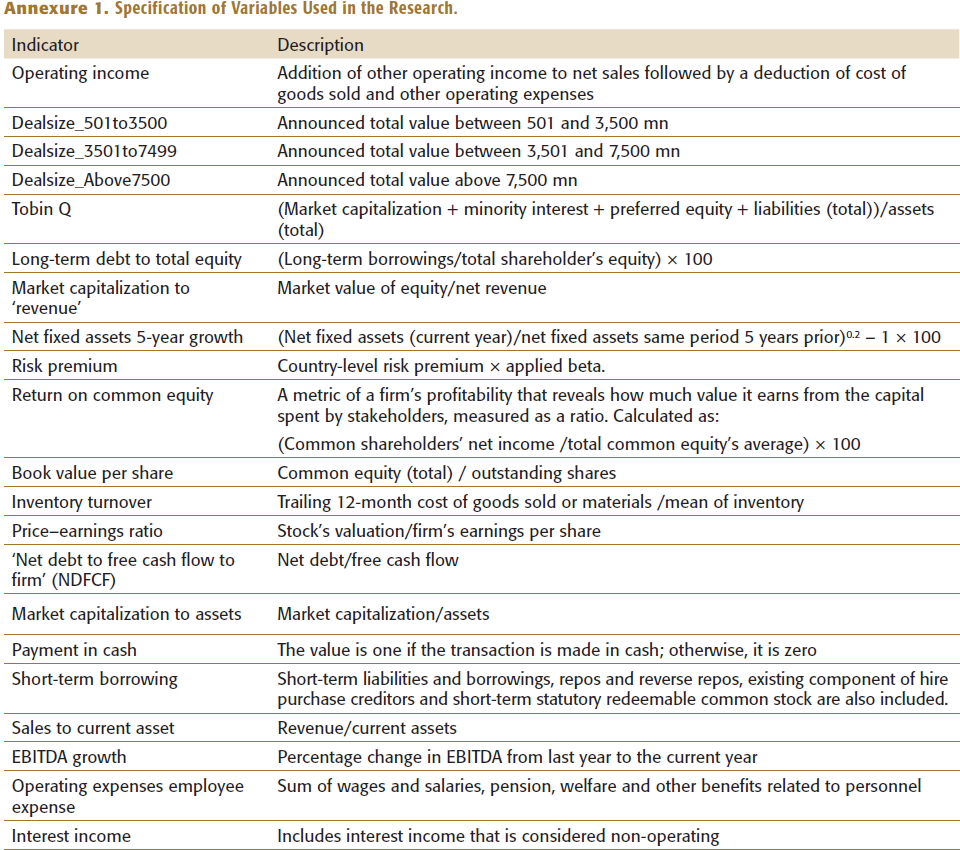
The research uses unbalanced panel data of 107 M&A in India between 2005 and 2015. Each transaction was given seven years of data (three years after the assimilation, three years before the assimilation and the year of the assimilation). As a result, the study’s data span 2002 to 2018. Non-listed acquirer companies and financial and banking firms were excluded from the study due to their distinct accounting, operating and risk-based characteristics. The accounting and financial data considered in the research were collected using the Bloomberg terminal database. Annexure 1 lists the variables considered in the study. For this analysis, the consolidated entity’s post-merger output was contrasted to that of the target and acquirer (A+T) entities in the pre-merger period. Every variable is deflated by the tangible assets of the considered firms for appropriate analysis, eradicating the size effect (Healy et al., 1992).
For the deal size, we have categorized the deals into four categories: deal size less than 500 million (mn), deal size between 501 and 3,499 mn, deal size between 3,500 to 7,499 mn and deal size above 7,500 mn. We have used three dummy variables to indicate these categories to avoid the dummy variable trap.
METHODOLOGY
Principal Component Analysis (PCA)
PCA is used to construct a composite measure that integrates multiple factors into a single variable to represent a dynamic framework such as ‘synergy’ as it is a complex idea involving a vast range of strongly associated parameters. PCA is aided with (a) compression of data and (b) de-correlation of the dependent variable. PCA aims to lower the variance. Inter-correlated metrics are divided into orthogonal parameters, or principal components, by PCA. This technique has two purposes. Using the variables of a regression scheme in this context is difficult due to multicollinearity. Second, since there are so many affected variables, according to Jha and Murthy (2006), they can all be combined into a single dependent variable. PCA makes data compression easier. In the reduced dataset, all the variables considered dependent variables would have the most information. The reduced data collection contains variables that are not related to one another since the principal components are ‘orthogonal’ (perpendicular) to one another (Jha & Murthy, 2003).
To test for stationarity for an unbalanced panel, Fisher type (Choi, 2001) is implemented for all the variables. The bulk of the variables in the sample were considered to be stationary. It is vital to recognize that scale problems have little bearing on the composite variable. By normalizing the variables, the scale problem was resolved. The next move was the development of a composite index. This is one of the study’s defining features.
Since the objective is to formulate a composite ‘financial synergy’ (FS) and ‘operating synergy’ (OS) variable, the most relevant variables must be chosen and relative weights determined before these variables can be combined into a single factor. PCA condenses a substantial array of correlated parameters into a few uncorrelated parameters that hold the bulk of the information:
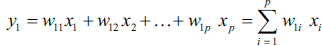
The initial principal component is chosen to maximize the variance of y1. The sum of the squared correlation is increased as the variance of y1 is increased. PCA was used to find the optimal weight vector (w11,w12,w1p) and the corresponding variance of y1.
The correlation matrix is used to convert a set of uncorrelated (orthogonal) fundamental variables (dubbed principal components) from a set of related original variables. Each new parameter attempts to account for as much residual total variance as possible in the actual data. All of the novel factors alone account for 100% of the variance. PCA measures the correlation matrix’s eigenvalues and related eigenvectors. The cumulative residual variance that the resulting new variable produces is represented by each eigenvalue. Finally, we will use the PCA technique to build a composite index. The central idea behind this method is to use a single composite index to represent a complex phenomenon like synergy, which can act as a single dependent variable. Many other considerations may impact synergy, but our approach guarantees that the variables used to create the synergy composite variable correctly represent the effect of all synergy components.
Method for Construction of the Composite Variable
A data reduction procedure must be used to pick the main parameters and determine relative weights in order to integrate the variables into one single variable.
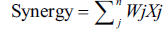
where Xj indicate variables that were retained, and Wj are weights, i.e., component scores.
The weights were determined using the Joliffe criteria (Jolliffe, 1972). Using this method, the principal variables with the maximum factor scores in reference to the preserved components were kept. Starting with the maximum score in the first component, the process involves choosing variables and their scores in ascending order, beginning with the highest score in the first component and advancing to the following component and marking the variable with the highest score and so on.
Construction of the Composite Variables of Operating Synergy and Financial Synergy
Operating Synergies: The difference in net earnings after taxation and the variation in capital spending measure operating synergies. The number of changes in capital expenditures equals the number of changes in capital spending and networking capital investments (Elgemark, 2014).
Financial Synergies: It is the amount of improvements between the interest tax shield and the depreciation tax shield. It may include variations in interest rates and depreciation tax shields as a consequence of an M&A. Alterations in the depreciation and interest tax shields are vital because they mark net revenue, taxes paid and thereby free cash flow (Elgemark, 2014).
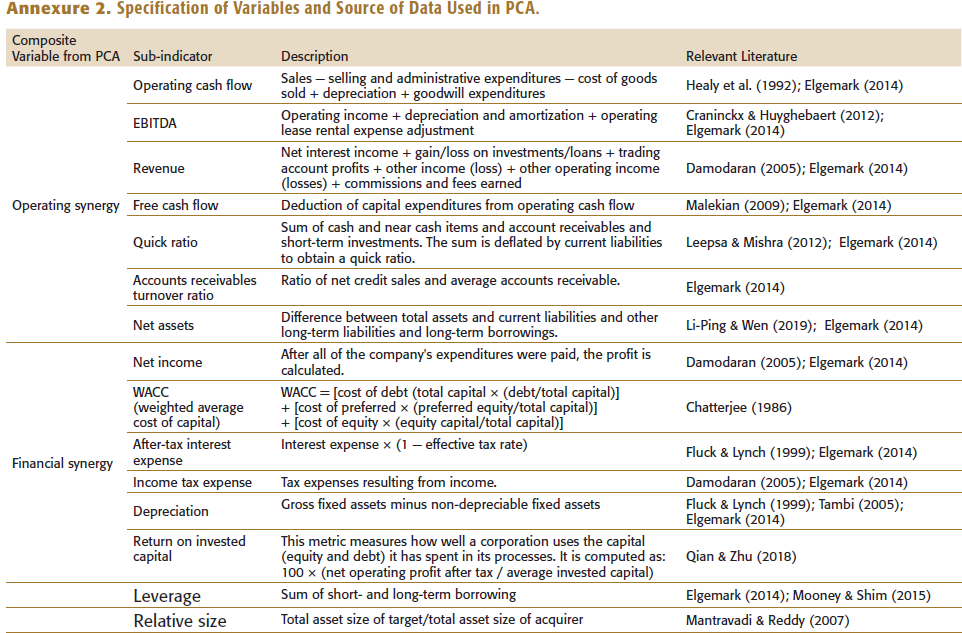
Both synergy types listed above have their own set of sub-measures (refer to Annexure 2). After normalization, the correlation matrix is formed. The data set’s adequacy for PCA is then calculated using the Kaiser–Meyer–Olkin (KMO) and Bartlett’s sampling adequacy test. Bartlett’s test of sphericity checks the theory that the correlation matrix is an identity matrix, implying that the factors are inconsistent and consequently ineffective for structure recognition. The KMO sampling suitability test is an indicator that shows how much of a variable’s variance can be clarified by underlying factors. High values (near 1.0) specify that factor analysis may benefit the findings (Child, 1990). The data set is sufficient for PCA since the p-value for Bartlett’s test is 0.00, and KMO is greater than 0.68. PCA is carried out in stages after these tests.
For each composite variable to be produced in this phase, PCA is steered on the specified sub-indicators. The derived components are rotated using the varimax rotation procedure, which improves the orthogonality of sub-indicators and portrays a uniform sequence of loadings (Issah & Antwi, 2017). Specific variance contributions greater than 10% of the total explained variance are used in principal components with more than one eigenvalue.
Two-stage Least-square Instrumental-Variables Regression (IV-2SLS)
One of the advantages of the two-stage least squares approach is the ability to deal with endogenous obstacles (Brueckner, 2003). Since the usage of the ordinary least squares (OLS) estimator in regression models is impractical due to endogeneity, the IV-2SLS is the recommended regression method. The panel data autocorrelation results verified the data set’s possible endogeneity. The IV-2SLS assessment approach is well adapted for analysing structural equations with endogeneity caused by reverse causality, missing variable bias and/or approximation errors. The selection of instruments is important when evaluating the results of regression calculations. The instruments are used to change the error term’s endogenous regressor, which is problematic. A real IV in a regression model must be an exogenous variable with a slight influence on the outcome variable while having little effect on the endogenous variable. The IV-2SLS assessment method is divided into two stages. In the first step, the instruments are utilized to convert the endogenous regressor and estimate its expected value.
Formally, the model fit by IV regress is


The dependent variable for the ith observation is zi. The endogenous regressors are represented by Zi, the included exogenous regressors are represented by x1i, and the omitted exogenous regressors are represented by x2i. The instruments are x1i and x2i put together. The similarities between ci and the elements of ei are probably non-zero since ci and ei are zero-mean error words.
The two regression equations discussed in this article can be combined to form:
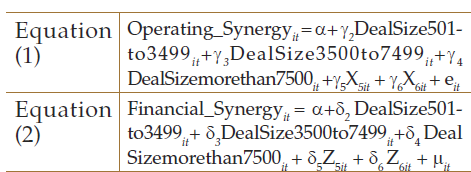
Here, X and Z include other control variables, DealSize 501to3499 is a dummy variable which takes a value of 1 if the size of the transaction lies between 501 and 3,499 mn, 0 otherwise; DealSize3500to7499 is a dummy variable which takes a value of 1 if the size of the transaction lies between 3,501 and 7,500 mn, 0 otherwise; and DealSizemorethan7500 is a dummy variable that takes a value 1 if the size of the transaction lies above 7,500 mn.
There are four steps in this section of the analytical technique. Most of the variables in this study are commonly stationary as per the Fisher type (Choi, 2001). The Breusch–Pagan and Cook–Weisberg test in a linear regression model was used to check for heteroskedasticity. The null hypothesis for the Breusch–Pagan and Cook–Weisberg test is that variance is homoscedastic, i.e., variance is constant. The null hypothesis must be dismissed in order to justify the application of 2SLS. Further, we use a new test developed by Wooldridge (2002) to search for serial correlation. The null hypothesis for this test states, ‘There is no serial connection’. When 2SLS is used, the null hypothesis is rejected, revealing the existence of autocorrelation in the error term. Based on these two tests, the 2SLS model is found to be more appropriate.
RESULTS AND EMPIRICAL ASSESSMENT
Formation of Composite Variable of Operating and Financial Synergies
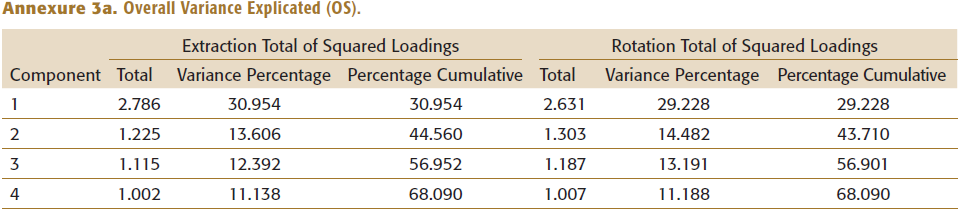
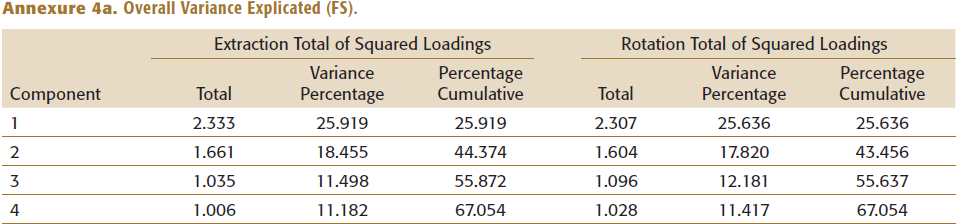
Identification of principal components: The Kaiser criterion was applied in this case, and four principal components of eigenvalue higher than 1 had been held. The cumulative variance is defined by the generated principal component (refer to Annexures 3a and 4a). The retained components in OS capture approximately 68% of the data, while the retained components in FS capture approximately 67% of the information.
Rotation of components: The components were rotated using varimax rotation with Kaiser normalization. In both FS and OS, this culminated in a series of factor ratings for the variables in addition to the four preserved components (refer to Annexures 3a and 4a).
Principal variables to be identified.: The principal variables were chosen using the Joliffe method (explained earlier). In order of importance, four variables were chosen for both OS and FS, starting with the most important component. Consequently, the four principal variables chosen for the OS composite variable were operating cash flow return on assets, earnings before interest, taxes, depreciation and amortization (EBITDA), quick ratio and net income. Similarly, four principal variables selected for the FS composite variable were weighted average cost of capital (WACC) of total capital, after-tax interest expense, depreciation of fixed assets and return on invested capital (refer to Annexures 3b and 4b).
Creation of composite dependent variable: The composite dependent variables were created using the weights from the component score coefficient matrix. Pairing the parameters with their corresponding weights yielded the cumulative variable of affected variables.
Estimations of 2SLS Instrument Variable Panel Regressions
For each equation, we ran six distinct steps for analysis. First, the OLS regression was run, following which residuals were predicted using Stata. A correlation was found between independent variables and disturbances. Thus, endogeneity exists. We applied the Wooldridge test for autocorrelation in the panel data to check whether the disturbance term was uncorrelated with every other disturbance conditioned on X. The null hypothesis was dismissed (Prob > F = 0.0000), indicating the existence of autocorrelation in the error term. The Breusch–Pagan/Cook–Weisberg test for heteroskedasticity in the error term was used.
Table 1 depicts models 1– 3 for Equation (1). One or two alternate parameters associated with operating income but unrelated to e were identified since operating income was utilized as an endogenous regressor. Furthermore, these exogenous parameters could not explicitly impact synergy, and if they did, they would have to be used in the regression equation mentioned earlier. The industry-relatedness variable in our data was assumed to be associated with operating income but not with the error term. Industry relatedness, total liability along with other exogenous variables constituted our set of instruments. Deal sizes less than 500 mn were captured by the constant term. Deal size was found to have a significant relationship with operational synergy. However, the relationship between deal size and operating synergy is positive for only a deal size up to 500 mn. It was observed that as the deal size increases, the magnitude of operating synergy gain reduces, signifying that as the magnitude of the deal size rises, the realized operating synergies are less. Small M&A deals have assisted acquirers in reaping high operational synergistic advantage. Sales/revenue, WACC, income tax expense and Tobin q have been found to have statistically significant affiliation with the acquirer’s operating synergy. Wu–Hausman (Hausman, 1978; Wu, 1974) and Durbin (1954) statistics were significant, i.e., the variables being tested were endogenous. Basmann’s (1960) χ2 and Sargan’s (1958) tests were reported to be statistically non-significant, indicating that the instruments were valid.
2SLS Regressions of the Impact of the Deal Size.
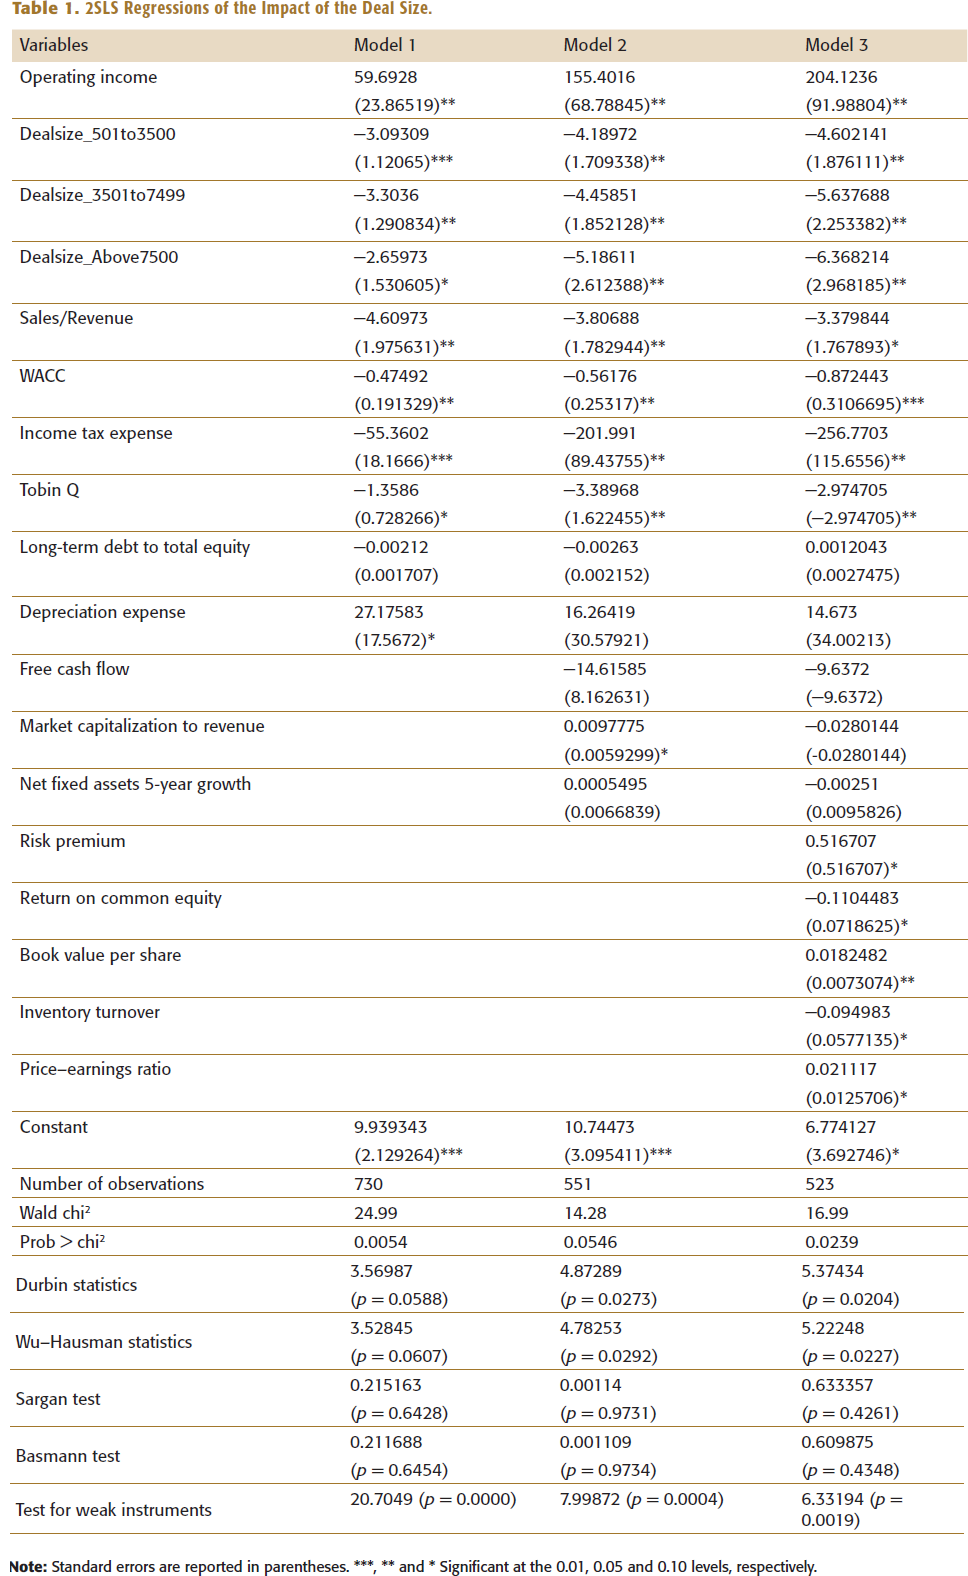
Table 2 depicts models 1 and 2 for Equation (2). One or two alternate factors associated with net debt to free cash flow to a firm but unrelated to µ were identified since net debt to free cash flow to a firm is being utilized as an endogenous regressor. Furthermore, these exogenous parameters could not explicitly impact synergy. If they did, they would have to be used in the regression equation mentioned earlier. The variable for industry-relatedness was correlated with net debt to free cash flow to the firm but not the error term. Industry relatedness, sales to total assets and other exogenous variables constituted the set of instruments. Deal size less than 500 mn was captured by the constant term. As per the results, deal size was found to have a positive and significant association with financial synergy. It was observed that with an increase in deal size, the magnitude of financial synergy gain also increases, suggesting that with an increase in deal size, the financial synergy is realized more in the case of Indian M&As. Tobin q, sales/revenue, market capitalization to assets have also been found to have statistically significant affiliation with the acquirer’s financial synergy. Wu–Hausman (Hausman, 1978; Wu, 1974) and Durbin (1954) statistics were significant, i.e., the variables tested must be endogenous. Basmann’s (1960) χ2 and Sargan’s (1958) tests were reported to be statistically non-significant, indicating that the instruments were valid.
Impact of the Deal Size on Financial Synergies.
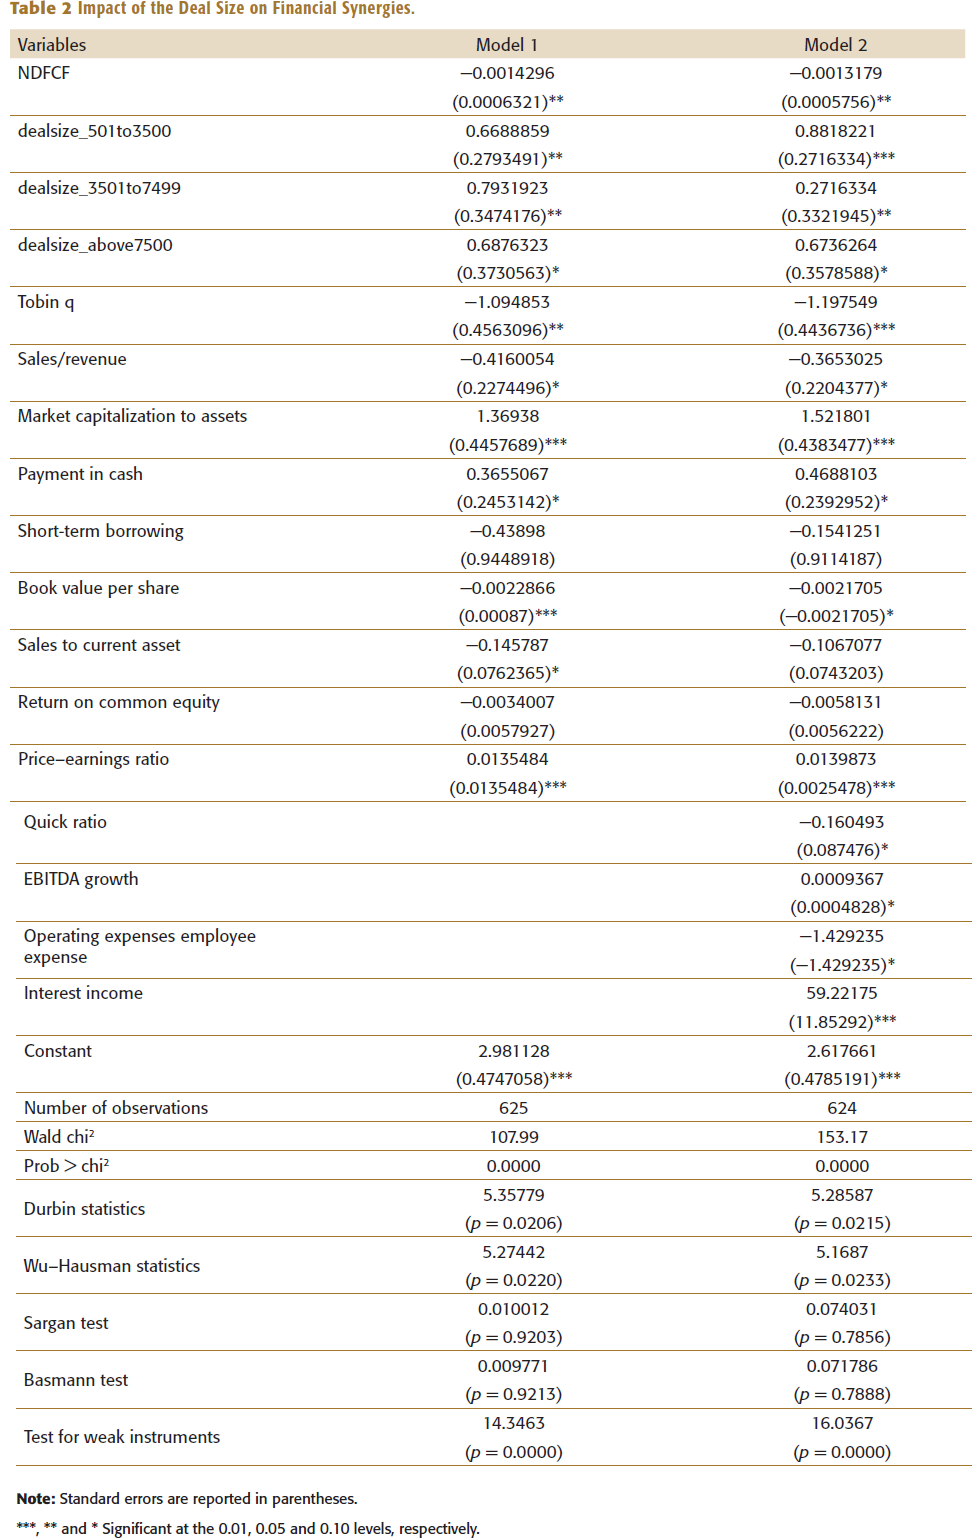
***, ** and * Significant at the 0.01, 0.05 and 0.10 levels, respectively.
CONCLUSION AND POLICY IMPLICATIONS
The paper proposes a method for analysing M&A phenomena employing a composite synergy component that correctly represents the complex phenomenon. As per the results, we prove that smaller firms do considerably better than large organizations when it comes to M&A deals in the Indian economy. The deal size has a positive and significant association with financial synergy but is negatively associated with operating synergy. It has been observed that as the deal size increases, the magnitude of financial synergy gain also increases. This suggests that with an increase in the acquisition deal, the financial synergy is realized more in the case of Indian M&As. However, the relationship between deal size and operating synergy is contradictory, i.e., as the deal size increases, the magnitude of operating synergy gain reduces. This signifies that as the magnitude of the acquisition deal rises, the operating synergies are correspondingly realized less. When large companies disclose the acquisitions of public entities, they suffer substantial operating synergistic erosion, regardless of how the merger is funded. We discovered that this side effect is robust. This contrasts with the existing studies, which suggest that operating synergies are more realized than financial synergy.
One of the most interesting findings of the research is that small M&A deals (deal size less than 500 mn) have aided acquirers in reaping high operational and financial synergistic advantages. Larger companies pay higher acquisition costs than smaller companies, and they also make deals with detrimental operating synergies. We found that large deal sizes result in extreme wealth erosion for the bidder in terms of operating synergy, meaning that large deals are riskier investments. Small acquisitions, on the other hand, result in both operating and financial benefits for investors. To sum up, our findings contradict the popular belief that operating synergy is much easier to obtain for huge firms than financial synergy (Basri & Arafah, 2020; Devos et al., 2009; Kwilinski et al., 2019, 2020; Ogada et al., 2016;). We argue that because large deals are synonymous with premiums, their uncertainty makes it more unlikely to have any financial benefits. We have seen that small businesses do far better than big businesses when it comes to acquisitions and can produce substantial synergy benefits.
Policymakers should encourage the creation of an effective market for corporate regulation. The M&A approach is critical in the post-liberalization period when it comes to restructuring. The research adds to the body of knowledge on M&A business strategy. By absorbing failing target firms on the brink of closing, acquiring companies will help retain economic resources. The release of entrepreneurial investment locked up in the acquirer firm can result in substantial capital growth and a multiplier impact on the local and national economies. M&A creates synergy in the long run for small acquirers by maximizing resource use. However, the leadership cannot assume that by pursuing an M&A policy for large acquisitions, earnings will rise, and synergy will be created. Financial synergy seems to have been a positive boost for all sizes of acquirers in India, indicating that M&A has resulted in tax and depreciation advantages.
ANNEXURES
Specification of Variables Used in the Research.
Specification of Variables and Source of Data Used in PCA.
Overall Variance Explicated (OS).
Coefficient Matrix of Component Score (OS).
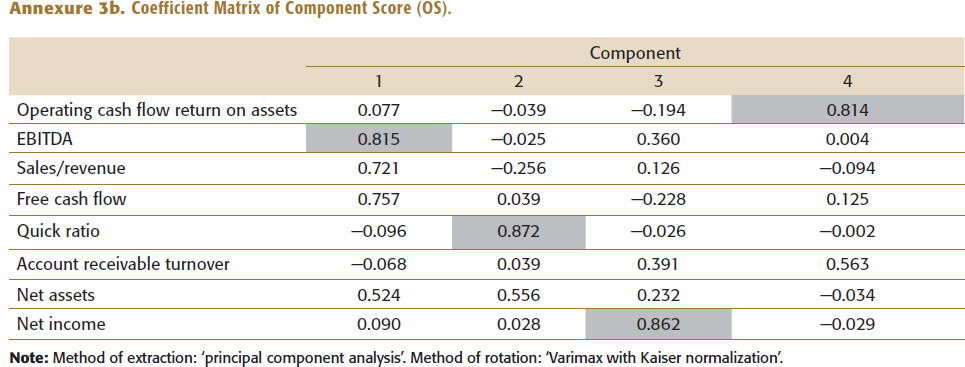
For the values in the shaded column: The weights have been determined using Joliffe criteria. The principal variables with the maximum factor scores in reference to the preserved components were kept. Starting with the maximum score in the first component, the process involves choosing variables and their scores in the ascending order.
Overall Variance Explicated (FS).
Coefficient Matrix of Component Score (FS).
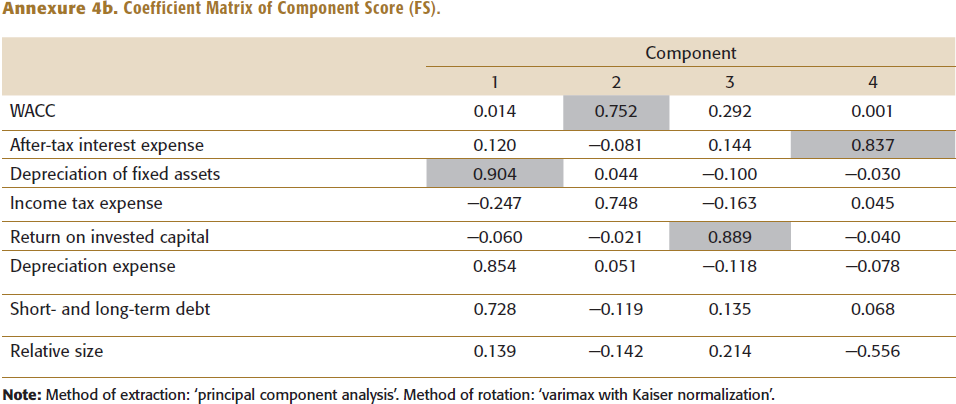
For the values in the shaded column: The weights have been determined using Joliffe criteria. The principal variables with the maximum factor scores in reference to the preserved components were kept. Starting with the maximum score in the first component, the process involves choosing variables and their scores in the ascending order.
Footnotes
DECLARATION OF CONFLICTING INTERESTS
The authors declared no potential conflicts of interest with respect to the research, authorship and/or publication of this article.
FUNDING
The authors received no financial support for the research, authorship and/or publication of this article.