
Abstract
Executive Summary
Capital structure decisions are vital for firms. Existing theories on capital structure partially explain the difference in capital structure decisions of identical firms. Researchers have integrated psychology with finance in recent years to explain the difference in capital structure decisions better. To help practitioners and academicians understand the role of psychology in capital structure decisions, this article focuses on CEO overconfidence and its influence on equity versus debt financing, short-term versus long-term debt financing, and level of debt financing concerning tax shields. Indian CEOs are unique in their leadership style, values and beliefs. Overconfidence among CEOs of S&P BSE 200 firms is measured using the press coverage of CEOs, and this proxy depicts how the press portrays CEOs. An extensive search on CEOs in relevant search engines helped measure overconfidence among CEOs. The results from regression models document that overconfident CEOs prefer debt over equity and short-term debt over long-term debt. In addition, overconfident CEOs are found to not avail the full benefits of tax shield and follow a conservative debt policy. The presence of bias of overconfidence among CEOs distorts optimal decision-making and deviates capital structure decisions from trade-off theory and pecking order theory of capital structure. The evidence on external versus internal financing helps explain the biased preference of overconfident CEOs for debt and short-term financing. The biased beliefs lead CEOs to form high expectations of cash flows. Overconfidence among CEOs is found to significantly influence capital structure decisions. The robustness of the results corroborates existing findings and documents the influence of behavioural biases on corporate decision-making.
Keywords
The bias of overconfidence is substantiated in psychology, and managers are often found to be excessively overconfident (Hackbarth, 2002). The presence of the bias of overconfidence leads individuals to consider their performance/views/decisions as being better-than-average (Weinstein, 1982), and overconfident individuals often form narrow confidence intervals for future events. Malmendier et al. (2011) stated that capital structure decisions for similar firms are inconsistent with modern dynamic theories of optimal capital structure. The study of overconfidence among CEOs helps explain the differences in capital structure decisions of similar firms. Malmendier and Tate (2015) stated in their seminal work that CEOs have larger-than-life images in the United States, and we are stating the same in the Indian context.
The study of Indian CEOs is unique. Tripathi et al. (2015) documented that Indian CEOs possess unique values and they derive good qualities from Hindu mythology. Similarly, Gutierrez et al. (2012) stated that Indian CEOs emphasize the welfare of the nation in business decisions and documented distinct qualities of Indian CEOs compared to Chinese and Western CEOs. Therefore, it is interesting to analyse the impact of the bias of overconfidence on capital structure decisions among Indian CEOs who hold different religious thoughts (Baxamusa & Jalal, 2016) and leadership styles (Vitale & Cull, 2018) as compared to CEOs of other countries. The findings of Brown and Sarma (2007) and Huang et al. (2011) provided further evidence of overconfidence among CEOs in Australia and China, respectively. The studies showed that overconfidence exists not only among CEOs of Western countries but also among CEOs of other countries. Indian CEOs are unique in their leadership style (Cappelli et al., 2015). The unique nature of Indian firms and their ‘leader’s’ leadership style motivated our study to explore the impact of bias of overconfidence among CEOs on capital structure decisions. To empirically test the presence of CEO overconfidence on capital structure decisions, we first measure CEO overconfidence using the press coverage proxy. The financing deficit (Frank & Goyal, 2009) is used as a proxy of capital structure decisions to study the preference of overconfident CEOs between debt and equity financing. Cash dividends, net investments, changes in working capital, and cash flow after deducting interest and taxes are used to calculate the financing deficit. Debt maturity, ranging from debt with one year of maturity to debt with five years of maturity, is used to study the impact of CEO overconfidence on the preference between short- and long-term debts. The variable kink (Graham, 2000) is used to study the debt conservatism among overconfident CEOs.
The study adds to the growing literature of behavioural corporate finance concerning the capital structure decisions by overconfident CEOs. The study documents that overconfident CEOs prefer debt financing over equity financing. Overconfident CEOs are also found to prefer short-term debts compared to long-term debts. Besides, it’s been found that overconfident CEOs do not utilize the full potential of tax shield and that such CEOs raise the sub-optimal amount of debt. Also, the study is an attempt to replicate the evidence observed for the developed markets. The findings strengthen the existing proxy of measuring CEO overconfidence. The study’s findings show that the measurable bias of CEOs’ overconfidence affects capital structure decisions and distorts optimal decision-making.
The rest of the article is organized as follows: the next section contains a review of the literature, followed by a section on research methodology. The results of the impact of CEO overconfidence on capital structure decisions are discussed subsequently. The last section presents the conclusion of this study.
REVIEW OF LITERATURE
For the developed countries, the literature provides evidence of the impact of CEO overconfidence on capital structure decisions. However, Basu (2010) stated that Indian leaders face complex challenges to manage the firms in the developing economy, and such challenges need varying leadership styles. Mendonca and Kanungo (1994) stated that Indian leaders manage their resources in complex hierarchies. The earlier discussion shows unique economic and organizational scenarios for the Indian leaders. Cappelli et al. (2015) stated that Indian business leaders follow their leadership styles; hence, it becomes imperative to study the behaviour of Indian CEOs’ capital structure decisions. Research shows that corporate executives are prone to form self-serving biases, and overconfidence among top executives is a common phenomenon (Larwood & Whittaker, 1977). Individuals often overestimate their capacity to perform the assigned tasks, and the presence of a self-serving bias leads to inaccurate planning for future outcomes. People are overconfident in evaluating the correctness of their knowledge (Koriat et al. 1980). Psychology documents the presence of bias of overconfidence among skilled individuals, which dominates social predictions (Dunning et al., 1990). Skilled individuals often equate confidence with the skill (Baumann et al., 1991), and the presence of overconfidence results in sub-optimal decisions. Research in psychology also indicates that individuals often cannot justify their own beliefs because most people’s beliefs are distorted by deep-rooted overconfidence (Russo & Schoemaker, 1992). The behaviour of CEOs is no exception to the presence of bias of overconfidence. Hirshleifer (2001) stated that overconfident CEOs overestimate their efficacy in bringing success. The study by Barros and da Silveira (2007) also documented the evidence of managerial bias of overconfidence among CEOs. The researchers quantified CEO overconfidence based on the status of the executive as an entrepreneur or non-entrepreneur. The existing studies provide evidence that positive information about a company is transitory and such information does not affect capital structure decisions (Malmendier et al., 2011). It is very unlikely for the same CEO to receive the same positive information, and the overconfidence measure used in the present study targets habitual tendency of CEOs and not the transitory information. We have thus not considered the impact of private information on the CEO’s decision-making. We have also not considered the effect of signalling by CEOs to hold the stocks of their firms because existing studies have also analysed CEO overconfidence using net buyer proxy in which the focus is on the new shares of the firm bought by the CEO. Such studies document that stock-based proxies eliminate the effect of signalling (Malmendier & Tate, 2005a).
Nevertheless, the research on the managerial traits of CEOs from developing countries is limited. Due to the different characteristics of CEOs from different countries, it is crucial to study overconfidence among CEOs of Indian firms. In the Indian context, the following hypothesis is proposed:
H1: All else being equal, the overconfidence of the CEO affects the capital structure decisions of a firm.
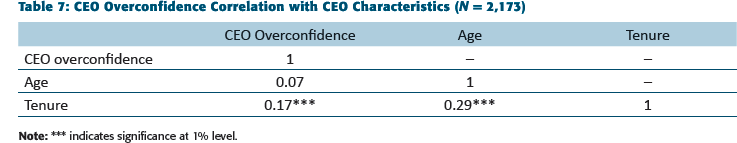
The presence of overconfidence among CEOs distorts corporate decision-making. One such distortion concerns the choice between debt and equity financing, which is documented in several studies. Barros and Silveira (2007) reported that bias of overconfidence among CEOs leads to more debt in firms. The biased CEO’s preference for higher leverage is confirmed by Hackbarth (2008), who stated that a manager’s growth and risk perception biases play an essential role in understanding their capital structure decisions. Hackbarth argued that biased managers tend to use more debt financing, as they overconfidently believe that the firm is less exposed to risks. The research by Malmendier and Tate (2008) stated that overconfident CEOs consider equity as more mispriced than debt is, and such CEOs prefer debt to equity. The biased CEO’s first preference is to generate cash flows internally. Overconfident CEOs are less likely to issue equity than debt and opt for external capital only if they believe equity to be more undervalued than debt. The literature documents that the biased behaviour of overconfident CEOs leads to higher leverage. Malmendier and Tate (2015), who studied overconfidence among CEOs with different datasets and confirmed bias in the capital structure decisions CEOs make, document similar findings for the behaviour of overconfident CEOs. Huang et al. (2016) stated that firms with overconfident CEOs borrow less debt, and firms with overconfident CEOs show lower asset maturity. They also reported that overconfident CEOs are older and have a much longer tenure than non-overconfident CEOs. Firms with overconfident CEOs are less likely to be rated, but such firms have higher opportunities for growth.
Recent studies have started focusing on sector-specific studies. For example, Tan (2017) studied the impact of overconfidence among CEOs of the US Real Estate Investment Trusts on the choice of debt for their firms. The study found that overconfident CEOs chose more debt than equity, and such preference for debt led to a reduction in the shareholders’ wealth. A firm’s governance is also used to quantify the biased behaviour of CEOs in studies such as Ji and Miglo (2019), who found that good quality firms focus on the rational behaviour of the manager. Overconfident managers are often sceptical about the market valuations and thus are reluctant to issue equity. Based on the evidence from the literature on the preference of overconfident CEOs between debt and equity, the following hypotheses is proposed:
H2: Overconfident CEOs, in comparison to other CEOs, prefer to raise debt financing relative to equity financing.
The literature provides evidence of CEO overconfidence when opting between short- and long-term debts; however, most of the studies are conducted in developed countries. The earlier studies in corporate finance also documented the evidence of the preference of a CEO between long- and short-term debts. One such study was conducted by Myers (1977), who found that CEOs issued short-term debts to alleviate the underinvestment problem and supported the matching hypothesis that firms matched debt maturity with asset maturity. Recent studies also document similar findings and provide evidence for the preference of short-term debt over long-term debt by overconfident CEOs (Malmendier & Tate, 2011). The biased behaviour of executives other than CEOs also affects the choice between long-term and short-term debts. Landier and Thesmar (2008) documented that biased entrepreneurs are inclined towards short-term debt and often consider their project as a success. Graham et al. (2013) compared US CEOs with non-US CEOs and found that they differ significantly. They also found that biased executives use more short-term debt financing; male CEOs in particular were found to raise more short-term debts than female CEOs. Their study shows that it is crucial to study overconfidence among non-US CEOs. This gap is addressed by the present study, wherein the focus is on the capital structure decisions of overconfident Indian CEOs.
Ataullah et al. (2018 reported that overconfidence helps mitigate the agency problem and contradicts the existing studies by providing evidence that overconfidence is positively associated with debt maturity. Malmendier et al. (2011) examined the alternative interpretation for capital structure decisions and stated that inside information and signalling have no link to capital structure decisions. They highlighted the difference between information and confidence, and they noted that positive information is transitory and not fixed. We measured overconfidence among CEOs over time, and the presence of overconfidence is a habitual tendency. It shows that overconfidence and private information varies in terms of persistence. Malmendier and Tate (2005a) measured CEO overconfidence using net buyer proxy and provided evidence of eliminating the effect of signalling on capital structure decisions. Net buyer proxy of measuring CEO overconfidence focuses on the additional stocks of the company bought by the CEO. Huang et al. (2016) tested the alternative explanation of signalling for understanding the impact of CEO overconfidence on short-term debt and dismissed the role of signalling to influence the capital structure decisions. The majority of the studies confirm the evidence of the biased behaviour of overconfident CEOs concerning debt maturity. Based on this, the following hypothesis is tested in the Indian context:
H3: Overconfident CEOs, in comparison to other CEOs, prefer to raise more short-term debt financing than long-term debt financing.
The literature in corporate finance also presents studies in which scholars have studied debt conservatism, such as the studies by Christensen et al. (2015), Hutton et al. (2014), Strebulaev and Yang (2013), and Hirshleifer and Thakor (1992). These studies focus on a firm’s behaviour toward leverage. Graham (2000) studied tax benefits that firms get and stated that a conservative debt policy is persistent across firms, and even firms with lower expected distress cost raise fewer debts. The position of firms on the interest benefit function was used to demonstrate how conservatively firms raise debt. Graham used the variable kink to infer the aggressiveness of firms in debt raising.
A few studies in the past decade have focused on debt conservatism by analysing the behaviour of CEOs. Sunder et al. (2010) studied how overconfidence among executives influences the formulation of debt covenants. They found that firms run by overconfident CEOs prefer conservative debt raising policies and suggested that the formulation of appropriate debt covenants can mitigate the presence of overconfidence among CEOs. Malmendier et al. (2011) suggested that overconfident CEOs issue debt conservatively as compared to available tax benefits, and they presented results consistent with the findings of Graham (2000). Cronqvist et al. (2012) examined the personal behaviour of CEOs and argued that leverage is an essential determinant of capital structure decisions. This study strengthens the literature in behavioural corporate finance by stating that the personal behaviour of the CEO can influence corporate decision-making. Huang-Meier et al. (2016) documented the evidence on debt conservatism by optimistic CEOs based on the data provided by Graham. They stated that debt conservatism is not related to cash holding. The managerial traits are shown to influence the cash holding policy of biased CEOs. Based on this, the following hypothesis is proposed to test the biased behaviour of overconfident CEOs:
H4: Overconfident CEOs in comparison to other CEOs issue debt conservatively relative to available tax benefits.
Hypothesis H4 is not related to hypothesis H2 because hypothesis H4 deals with the preference of debt by overconfident CEOs compared to available tax benefits, while hypothesis H2 deals with the preference between equity and debt. The next section presents the data and research methodology used in the present study.
DATA AND RESEARCH METHODOLOGY
We used different regression models to identify the influence of overconfidence in CEOs on capital structure decisions in India. CEO overconfidence has been measured in the literature using revealed beliefs, press coverage and forecasting error proxies (Malmendier & Tate, 2005a, 2005b, 2008, 2011). Revealed beliefs measure CEO overconfidence using three approaches: holder 67, long-holder and net buyer. These three measures are based on the stock option exercise behaviour of the CEO. Forecasting error proxy is based on the premise of the forecasted estimates by the CEOs regarding their company’s growth rate or any other macroeconomic variable’s growth rate. The literature documents studies of CEO overconfidence with corporate policy decisions such as corporate investment (Malmendier & Tate, 2005a), mergers and acquisitions (Malmendier et al., 2011), dividend policy (Deshmukh, 2013), the sensitivity of CEO wealth to equity risk (Niu, 2010), capital budgeting (Gervais, 2009, p. 3) and management forecasting (Hribar & Young, 2016) using press coverage to measure overconfidence. We have also used press coverage proxy to measure CEO overconfidence on similar premises. In press coverage, the focus is on examining how the press portrays CEOs. Ordinary least squares (OLS) regression is run to study the preference between net debt and equity. The generalized method of moments (GMM) regression is used to study the preference for debt maturity. The Tobit regression model is used for studying the preference between internal and external financing.
Sample Period and Coverage
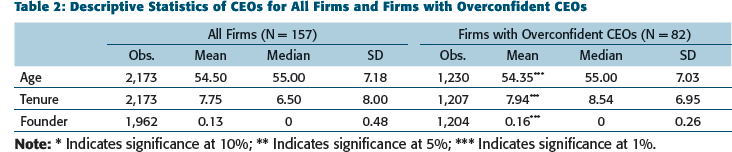
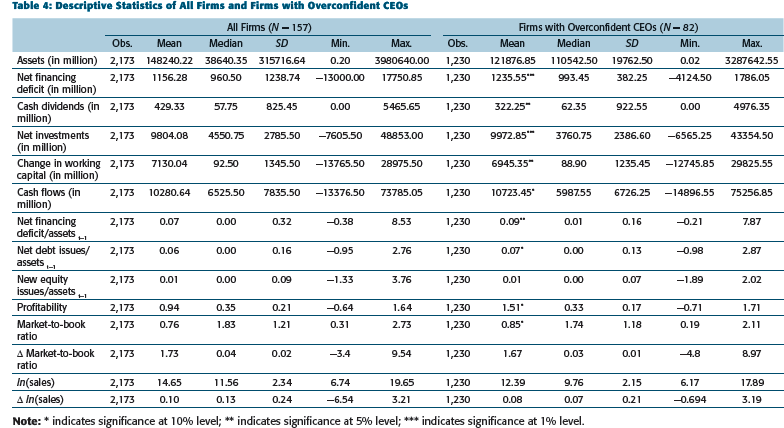
This study covers 15 years, from 1 April 2000 to 31 March 2015, to study the impact of overconfident CEOs on capital structure decisions. The study is conducted on S&P BSE 200 companies; financial companies are excluded from the sample due to regulations. The financing choices of large and small firms are not the same (Frank & Goyal, 2009), so the focus of the present study is on large firms. The study sample is 157 firms, with 2,173 observations; the observations in which the CEO stock options and vested options data were not available are excluded from final firm-year observations. About 82 CEOs were identified as overconfident.
Data Sources
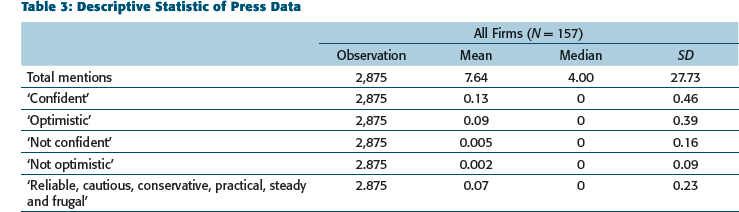
The data for the financial variable for S&P BSE 200 companies are collected from CMIE Prowess and S&P Capital IQ. The variables of CEO stock ownership and vested options are collected from S&P Capital IQ and annual reports of the sample firms. A search in The Economic Times, Business Standard, Financial Express, Business Line, The Economist, Factiva, The Wall Street Journal and CMIE Prowess IQ was done to measure CEO overconfidence. Three different searches were performed for each CEO. The first search focused on the total number of articles mentioning a CEO. The second search focused on articles that mentioned a CEO with words such as ‘confident’ or ‘confidence’. A crosscheck was done in articles that these words referred to describe the CEO in question. The third search focused on articles that mentioned a CEO with the words ‘optimistic’, ‘optimism’, ‘reliable’, ‘conservatives’, ‘cautious’, ‘practical’, ‘frugal’ or ‘steady’. These words to quantify CEO overconfidence are consistent with Malmendier and Tate (2005a). A careful check on the collected articles was done for ensuring that the used adjectives are only for the mentioned CEO. A distinction was also made on whether the article was about the firm or the CEO.
Once the required information was collected, a measure of an overconfident CEO was constructed. Each search was given a code as mentioned:
‘confident’ or ‘confidence’ ‘optimistic’ or ‘optimism’ ‘not confident’ ‘not optimistic’ ‘reliable’ and ‘practical’ ‘conservative’ and ‘cautious’ ‘frugal’ and ‘steady’
A variation in the frequency of (a)–(g) for different CEOs can come from two sources. For instance, CEO X has ten articles in (a) and CEO Y has two. It might be that CEO X is more confident than CEO Y. Nonetheless, there is also a possibility that CEO X has had more press coverage than CEO Y. Due to this reason and several expected zeros in various groups (a–g), the dummy variable of press coverage is defined. The question ‘Is the CEO ever portrayed as confident in press coverage?’ is asked, instead of the question ‘How many times CEO X is portrayed as confident compared to CEO Y?’
There is one more possibility of a problem in press coverage proxy; for instance, if CEO X is mentioned in the press 100 times, there will be at least one article mentioning CEO X as being confident. So, the original question ‘Is the CEO ever portrayed as confident in press coverage?’ was refined as ‘Is the CEO more often portrayed as confident and optimistic than not confident, not optimistic, reliable, cautious, conservative, practical, frugal or steady?’ The same method was applied to all sets of search results. Press coverage is only for the past press portrayal. The proxy for capital structure decisions for the first regression model is the financing deficit of the firm. The data for the financing deficit is collected from CMIE Prowess. For the measurement of the financing deficit of the sample firm, the following equation is used:

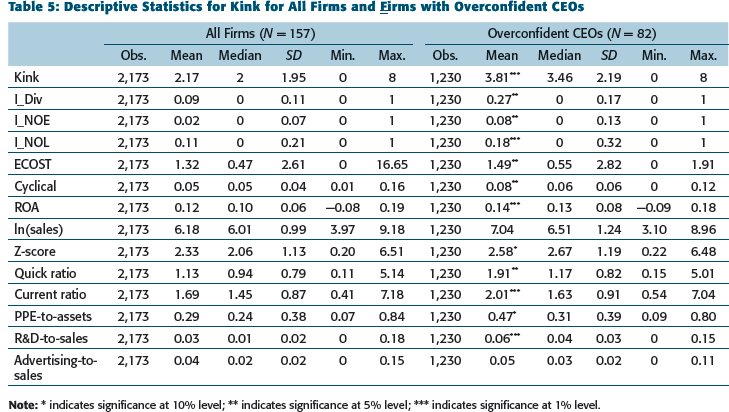
For the objective of availing full benefits of tax shield (internal versus external financing), following the Graham (2000) methodology, a variable called kink—describing a hypothetical level of interest rate where the marginal benefits from receiving tax shield by raising more debt start falling to the actual level of interest paid on debt—is created. Kink in the present study is defined as a ratio of the assumed interest level where the benefits from the tax shield start falling as compared to the interests paid. Kink helps determine the appropriate amount of the debt that a firm can issue till the point where the marginal benefits of interest payments begin to fall. Kink is thus a point where the tax shield curve slopes downward, and by downward sloping, the reference is to at least a 50-basis point fall in the interest rate. A value of kink more than 1 indicates a potential to generate value to the firm from the tax shield. The potential benefits from raising more debt are linear to the value of kink to a given level; hence, a firm with a very high kink level uses debt more conservatively. Kink helps to compare firms at a given point and to measure a firm’s aggressiveness in raising debt in its capital structure.
MODEL SPECIFICATION
Preference Between Net Debt and Equity
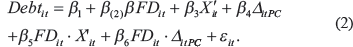
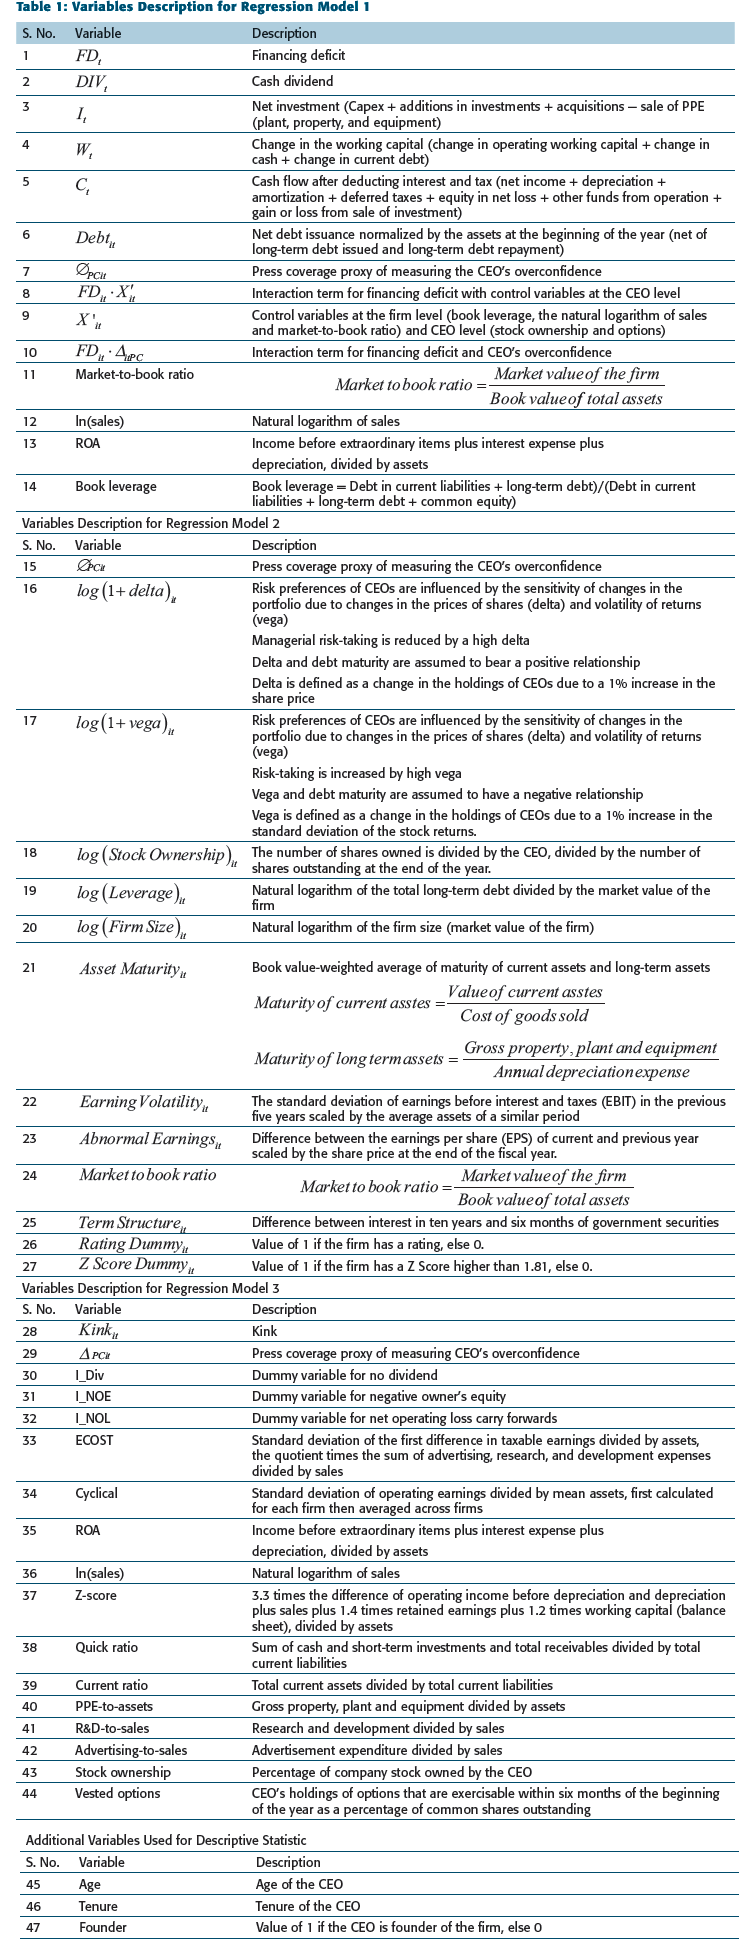
The study classifies capital structure decisions into three parts. We have used debt as the dependent variable in our first model studying the preference for net debt versus equity. The control variables mentioned in Equation (2) includes book leverage, the natural logarithm of sales, market-to-book ratio, CEO stock ownership and vested options. These control variables are chosen following Malmendier and Tate (2005a, 2008). In agreement with the existing research (Malmendier & Tate, 2008; Malmendier et al., 2010), we have also used the interaction terms. Interaction terms of financing deficit and firm fixed effects are added to separate the CEO overconfidence from time-invariant firm effects. The interaction terms also help us to compare the results with the existing studies. To investigate the internal and external financing, the following regression model is used, where the null hypothesis of H2 states that β2 is zero. Table 1 provides description of the variables used in the present study.
Preference Between Short-Term and Long-Term Debts
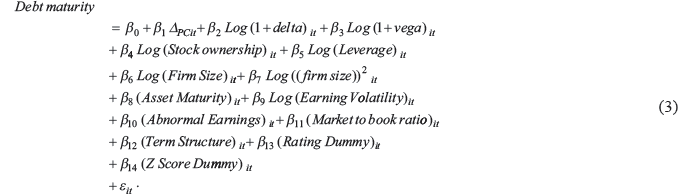
Debt maturity is the dependent variable in the regression model to study the preference for short-term debt over long-term debt. The control variables in Equation (3) are used in agreement with the existing literature (Malmendier & Tate, 2005a, 2008). To test the preference for short-term or long-term debts, the following regression model is run, where the null hypothesis of H3 states that β1 is zero:
Variables Description for Regression Model 1
Preference Between Internal Versus External Financing
Kink is the dependent variable in the study of preference for internal versus external financing. The control variables 
RESULTS AND ANALYSIS
Univariate Analysis
Descriptive Statistics of CEOs for All Firms and Firms with Overconfident CEOs
Descriptive Statistic of Press Data
Descriptive Statistics of All Firms and Firms with Overconfident CEOs
Descriptive Statistics for Kink for All Firms and Firms with Overconfident CEOs
Bivariate Analysis
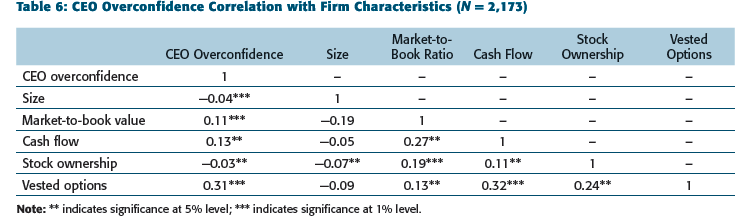
CEO Overconfidence Correlation with Firm Characteristics (N = 2,173)
CEO Overconfidence Correlation with CEO Characteristics (N = 2,173)
Regression Models Analysis
Table 8 presents the results of the first regression model. Model 1 in Table 8 is the baseline regression without controls or fixed effects, and it is shown to compare the coefficient with prior literature; Model 2 presents the results for CEO overconfidence and its interactions with financing deficit. The CEO level factors are controlled for, and the results are presented in Model 3. Model 4 presents results by controlling year fixed effects. Firm-specific control factors such as book leverage, the natural logarithm of sales and market-to-book ratio are controlled, and the results are presented in Model 5. Model 6 adds the lag of book leverage to study the firm’s capacity to raise debt.
OLS Regression Results of CEO Overconfidence with Net Financing Deficit
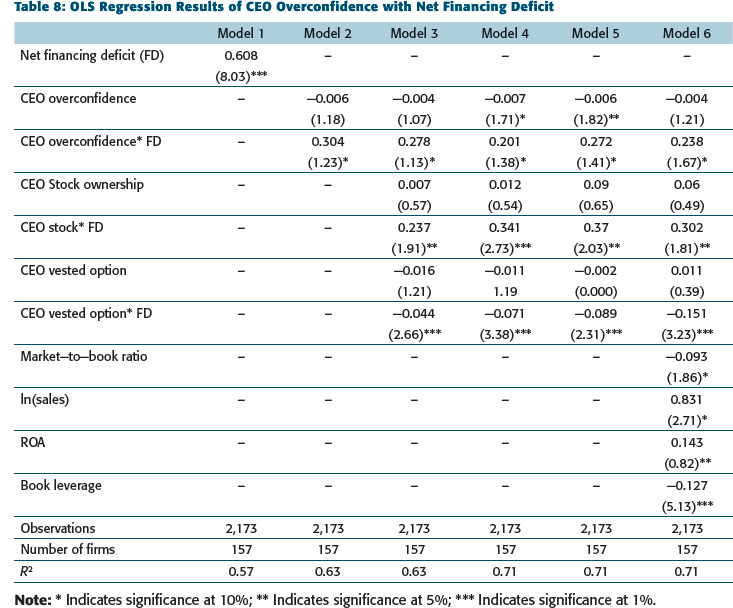
The positive coefficients of interaction between CEO stock and financing deficit are found to be significant. The coefficient in Model 6 is significant at a 5% level of significance (β = 0.302, p < .05), and the positive significant coefficient indicates that overconfident CEOs who hold significant stocks in the firms prefer more debt for financing deficits for the firms. The coefficient of book leverage in Model 6 (β = −0.127, p < .01) is found to be significant at 1% level of significance. The reported negative coefficient of the lag of book leverage indicates that the highly leveraged firms find it difficult to raise more debt. The significant negative coefficient of interaction between CEO vested options and financing deficit indicates that the CEOs with vested options raise less debt for their financing deficit needs. The aforementioned regression results show that 63% of the variation (Model 2) in the choice between debt and equity is explained by the amount of net financing deficit and, with the addition of control variables and leverage, the model explains 71% of the variation. The data in Table 8 supports hypothesis H2. The present study documents the presence of bias of overconfidence among CEOs and, in agreement with Shima and Nakamura (2018), presents evidence of flawed decision-making of overconfident CEOs. The evidence on sub-optimal decision-making for the preference between debt and equity of CEOs is reported in the present study. Our findings agree with Hackbarth (2002) and Oliver (2005), who documented the preference of overconfident CEOs for debt over equity. However, our findings contradict the results of Foster et al. (2016), who documented that overconfidence among CEOs reduces leverage and that overconfident CEOs prefer less debt. Our findings also contradict Fairchild (2009), who found that CEO overconfidence reduces debt financing as overconfident CEOs consider new projects as value-enhancing and raise less debt. The analysis shows that CEO overconfidence helps model the choice between debt and equity using the CEO traits. One possible explanation for overconfident CEOs not choosing equity to finance deficits is the fear of dilution of control as overconfident CEOs consider themselves more capable of managing their firm.
The short-term debt of one to five years is the dependent variable in the regression results shown in Table 9. CEO overconfidence is the dependent variable, and the control variables are selected as the existing study of Huang et al. (2016). STD 1 to STD 5 is the short-term from the duration of one to five years.
GMM Regression Results of CEO Overconfidence and Debt Maturity
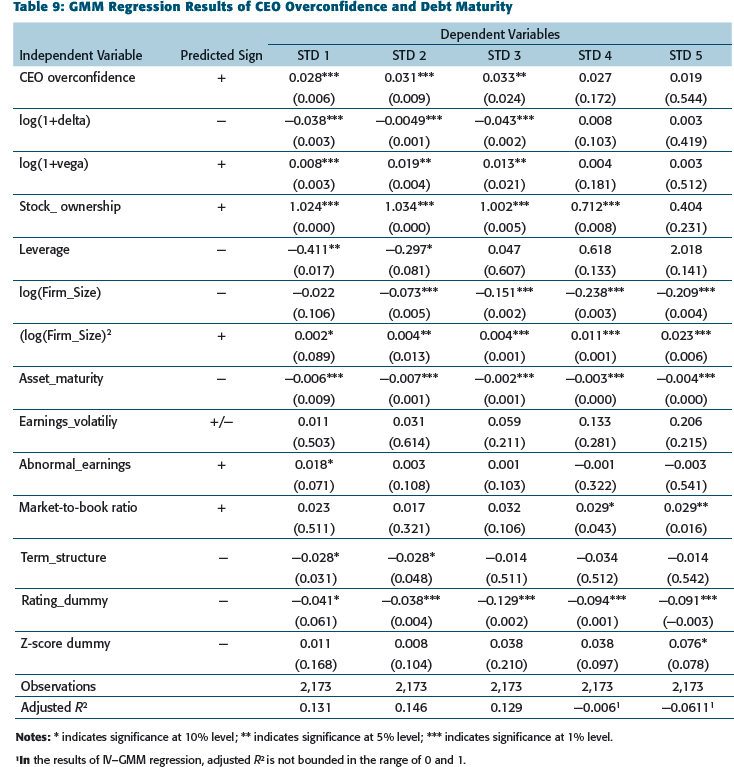
Notes: * indicates significance at 10% level; ** indicates significance at 5% level; *** indicates significance at 1% level.
1In the results of IV–GMM regression, adjusted R2 is not bounded in the range of 0 and 1.
The leverage coefficient is negative for STD 1 and STD 2, and it suggests that firms try to avoid suboptimal liquidation by incurring less short-term debts when the leverage is high (Huang et al., 2016). Earnings volatility is insignificant across the five periods, and it leads to the fact that firms with high asset volatility find it tough to raise short-term debts. The increase in the market-to-book ratio for firms is expected to increase the short-term debt of four- and five-year maturity only. The statistically significant and negative term structure coefficient suggests that with the increase in the interest rates, firms with overconfident CEOs borrow less short-term debts. The statistically significant and negative rating dummy coefficient shows that rated firms with overconfident CEOs borrow less short-term debt, and such firms might have better long-term financing opportunities. The findings agree with the results reported by Huang et al. (2016) and support hypothesis H3. Overconfident CEOs are shown to prefer short-term debt. Huang et al. (2016) provided one possible explanation that overconfident CEOs raise short-term debt to minimize the perceived mispricing of securities and enhance shareholder value.
Tobit Regression Results with Kink as the Dependent Variable
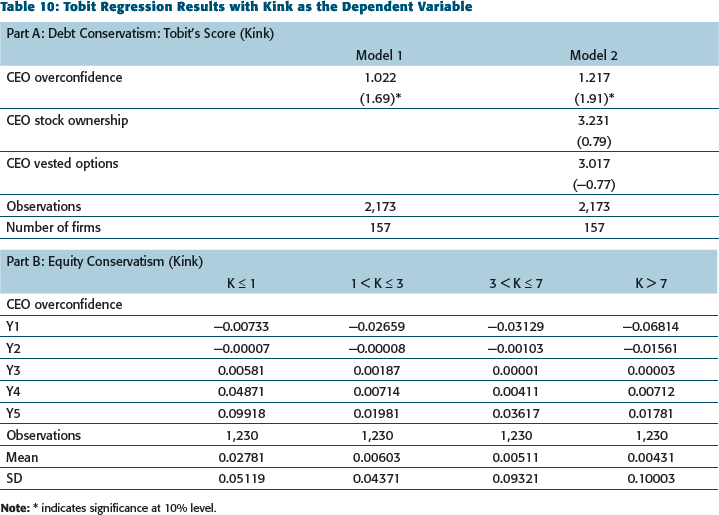
Table 10 presents the Tobit regression results, which are used for kink because the purpose of this regression model is to study kink at two points, 0 and 8. Part B of Table 10 presents four different levels of kink as per the methodology of Graham (2000), and Y1, Y2, Y3, Y4 and Y5 represent the 10th percentile, 25th percentile, 50th percentile, 75th percentile and 90th percentile, respectively, for kink. The positive and significant coefficients of CEO overconfidence indicate that although the overconfidence among CEOs increases the level of debt in the financing deficit for their firms, the lower value of kink suggests that such proportion of debt in the financing deficit for the firms is deficient as compared to the optimum amount of debt for the firms. The negative and statistically significant vested options coefficient in Model 2 indicates that the CEOs with vested options have a negative association with kink. The higher value of the vested options further reduces the value of kink for overconfident CEOs. The lower value of kink suggests that firms with overconfident CEOs do not utilize the available tax benefits. The results are consistent with Malmendier et al. (2011) and agree with the theoretical predictions of Graham (2000). Although results are consistent with the findings of a developed country, the value of the kink of Indian firms is lower. The lower value of kink for Indian firms suggests that Indian firms do not fully reap the benefits of available tax benefits, and the debt on an average for the Indian firms can be increased to fully utilize the benefits of tax shields.
Part B of Table 10 shows that overconfident CEOs are reluctant to obtain external finance. The lower level of equity issuance further falls with the increase in the level of kink. The mean value of equity issuance falls due to kink. When the value of kink is increased to more than 7, the mean net equity issuance value is 0.00431, which is lower as compared to the average net equity issuance value of 0.02781 at Kink value of less than 1. The results support hypothesis H4. The results also provide a piece of stronger evidence for the finding that overconfident CEOs are inclined to opt for internal finance as compared to external finance.
CONCLUSION
We analysed the impact of CEO overconfidence on capital structure decisions for Indian firms. The inclusion of managerial traits helps to better understand the corporate decision-making process. We have examined the bias of overconfidence among CEOs in Indian firms for capital structure policy. Overconfident CEOs make faulty decisions and often deviate from rational decision-making. We measured CEO overconfidence using a press coverage proxy. By studying the financing deficit for the overconfident CEO’s firms, we found that overconfident CEOs chose more debt financing than equity financing. Overconfident CEOs have high expectations for future cash flows, and they perceive equity financing as being more expensive than debt financing and prefer to issue debt over equity. We found that overconfident CEOs prefer short-term debts over long-term debts. Using the variable kink, we also found that overconfident CEOs issue debt conservatively and do not fully utilize the tax benefits of raising debts. Overconfident CEOs are also equity conservative and, therefore, rely more on internal financing. Managerial traits such as overconfidence are more critical for firms with long-serving CEOs. Our empirical analysis supports that overconfidence among CEOs impacts capital structure decisions. The results also show that the bias of overconfidence should be incorporated into the capital structure decisions. The critical contribution of our research is that it shows that overconfidence among CEOs impacts capital structure decisions. Our results have implications for organization design and corporate policy decision-making. CEO overconfidence plays a crucial role in corporate decision-making and affects shareholder wealth.
Footnotes
Declaration of Conflicting Interests
The authors declared no potential conflicts of interest with respect to the research, authorship and/or publication of this article.
FUNDING
The authors received no financial support for the research, authorship and/or publication of this article.
e-mails:
e-mail: