
Abstract
Executive Summary
A commodity transaction tax (CTT) of 0.01 per cent is levied on non-agricultural commodity futures trading since 1 July 2013 by the Government of India. This article examines the impact of CTT on market liquidity, volatility and government tax revenues for the Indian commodities market. We use daily data of five sample commodities, namely gold, aluminium, copper, zinc and crude oil available from 1 May 2010 to 31 August 2016. It is found that CTT imposition has destroyed the parity of the Indian commodity futures market with the international markets as CTT is absent on COMEX, LME, NYMEX, and so on. Moreover, evidence of trade migration can be found by drawing a comparison across MCX and international exchanges. This argument is further substantiated by observing the decline in liquidity after the imposition of CTT. It should be further noted that parity with the equity market is also lost as the transaction taxes imposed in equity and commodity markets are not in line with the level of volatilities of the two markets. CTT has also failed to curb speculative pressure as average volatility on major commodities has risen significantly by about 33 per cent post its imposition.
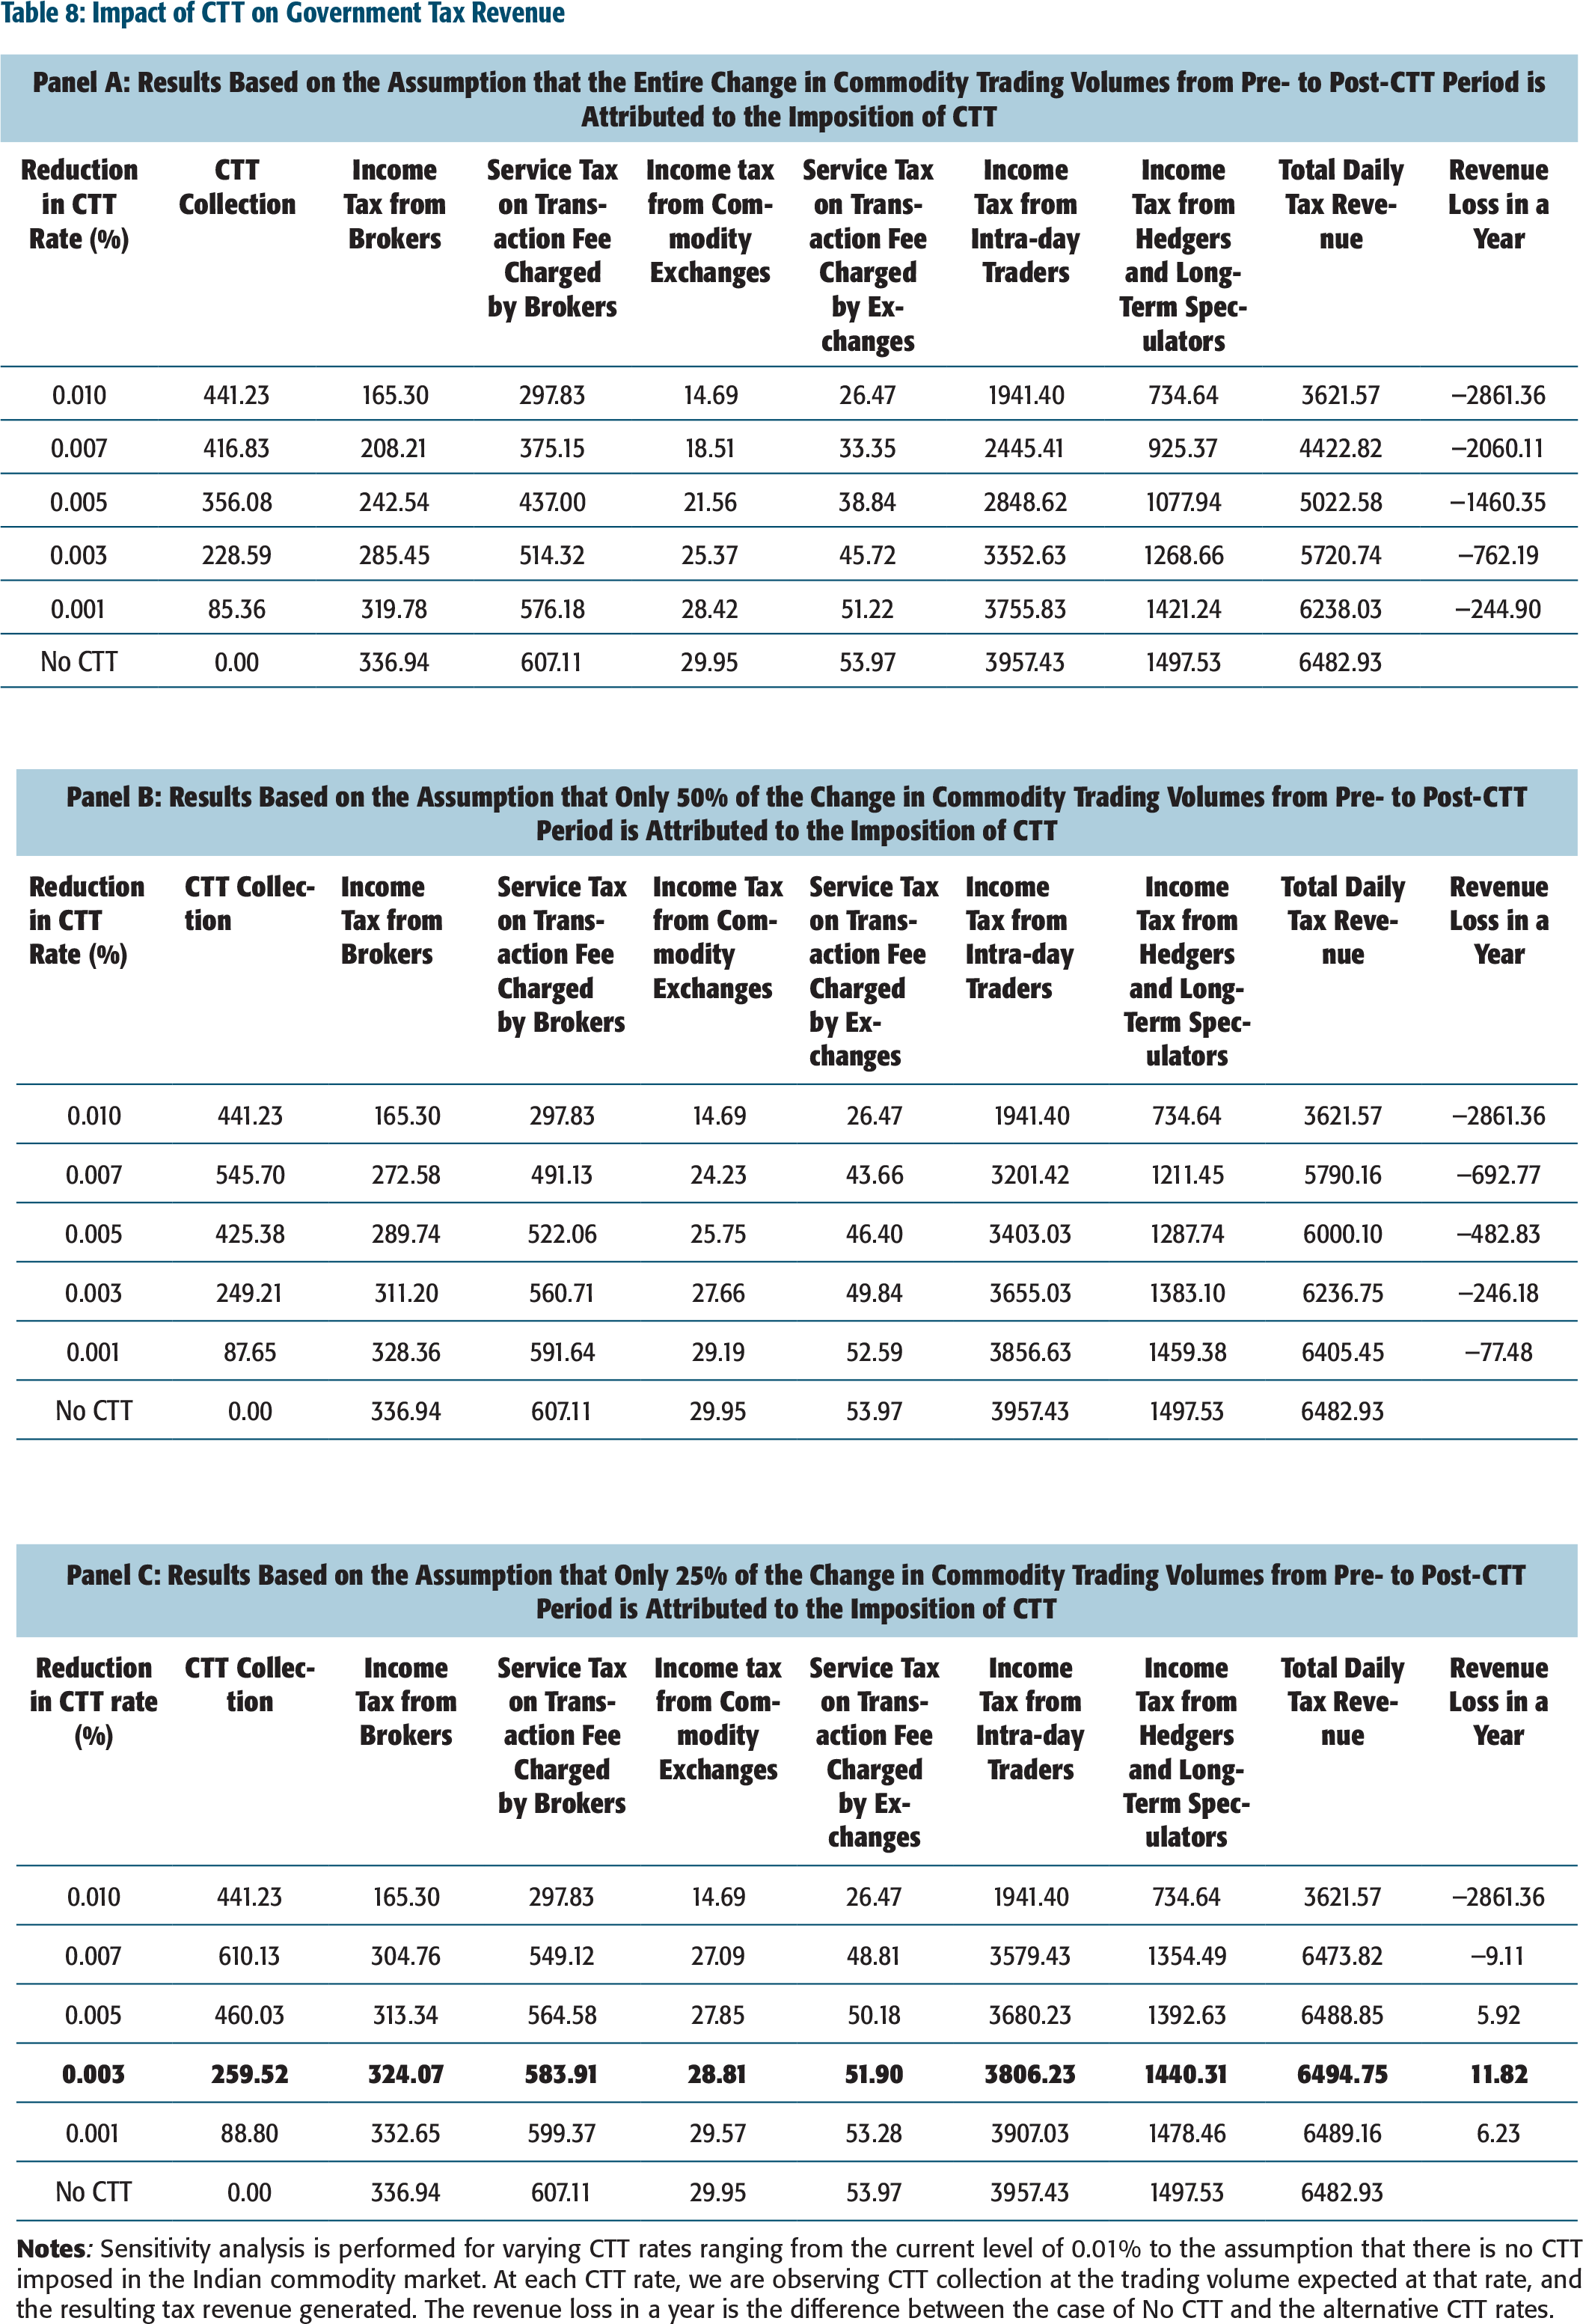
Considering the transaction tax, income tax and service tax aspects and decline in the trading volume attributed solely to the CTT imposition, it is found that CTT results in huge revenue loss to the exchequer. It is estimated that at the current CTT rate, government is losing an annual net tax revenue worth ₹30 billion. Even at a lower rate of 0.001 per cent (which is one-tenth of the current rate of 0.01%), the government’s fiscal loss is expected to be about ₹2.50 billion. Even if we make a conservative assumption that CTT accounts for only 25 per cent decline in the trading volumes, the optimal CTT rate, in terms of tax revenue collections, is found at 0.003 per cent, well below the current rate.
There is, therefore, no justification for retaining CTT on the commodity futures trading in India as it leads to a huge revenue loss to the government, owing to reduced trading activity and trade migration. Withdrawal of CTT would be ideal for Indian commodities market development, improving its liquidity and making it more internationally competitive.
The validity of this stated rationale of CTT is, however, questionable. International experience provides ample evidence of transaction taxes, which have failed to achieve their desired purpose. First, CTT ignores the primary difference in the economic rationale for the existence of the two markets (equity and commodity) and their level of maturity. The equity market is primarily for investors, who trade to (or ‘intend to’) earn profits, whereas the commodity futures market is essentially for hedgers and producers, as a way to manage risk, allocate resources and make better decisions. Second, with the levy of CTT, there is an increase in transaction costs, which drives out players from the Indian commodity futures market. The players move either to the international platforms, where commodities are traded globally, or to the illegal dabba trading platforms to hedge their risk in a cost-effective manner. The high cost of hedging also has a cascading effect on prices of energy and metals, which are necessary inputs for agriculture as well as industry, which further fuels inflationary expectations in the economy. Declining volumes not only result in lower CTT collection but also less tax collected from other direct and indirect taxes, such as service tax and income tax, owing to a smaller transaction base. This lost revenue has a high opportunity cost to the government as it could have been used for various economic development activities and specifically for market development. These arguments highlight the broader implications of CTT for tax revenue and the liquidity and volatility of the otherwise nascent Indian commodity futures markets.
The literature provides mixed evidence about the consequences of a transaction tax on trading liquidity, volatility, tax revenue, and trade migration. Keynes (1936) suggested that the introduction of a transaction tax would make speculative trading less profitable, which would reduce excess market volatility and stabilize the financial markets. Tobin (1978), Stiglitz (1989), and Summers and Summers (1989) also support the imposition of transaction tax. Roll (1989) showed that there is an inverse relation between transaction tax and volatility when analysing a 23-country sample for the period January 1987 to March 1989. Umlauf (1993) finds an increase in the volatility of Swedish stocks with the imposition of transaction tax. In their research, Campbell and Froot (1994) provided evidence of a transaction tax leading to a shift in the traded volume from Swedish exchange to London.
Further, Hu (1998) showed that an increase in transaction tax has an adverse impact on market return with no significant effect on market volatility and turnover. Habermeier and Kirilenko (2003) suggest that the STT negatively impacts price discovery, volatility and liquidity. Further, Lo, Mamaysky, and Wang (2004) found that trading volume decreases by 0.25 per cent when transaction costs increase by 1 per cent. Baltagi, Li, and Li (2006) concluded that an increase in the tax rate leads to a fall in the trading volume and market efficiency. Chou and Wang (2006) provided evidence of a reduction in the bid-ask spread (BAS) and increase in trading volumes when the transaction cost is reduced for the Taiwan stock exchange from May 1999 to April 2001.
Observing the Athens stock exchange, Phylaktis and Aristidou (2007) suggested that a transaction tax increases volatility during the bull period and decreases volatility during the bear period. In a study on the Shanghai and Shenzhen markets over the period from April 1991 to August 2008, Su and Zheng (2011) reported that a lower STT rate increases the trading volume, which, in turn, increases volatility and reduces market efficiency. Hayashida and Ono (2011) found a reduction in the trading volume due to a tax levy, increasing the transaction cost. Pomeranets and Weaver (2011) found that the BAS widened, and volumes decreased with the imposition of a STT, while they also found that there was no consistent relationship with volatility.
A limited number of studies have addressed the issue of the commodity transaction tax (CTT). Schulmeister (2009) found that a financial transaction tax on commodities leads to a reduction in short-term price volatility of futures contracts. Nissanke (2011) proposed a multi-tier tax system to commodity derivatives to stabilize prices and curb excess price volatility. Edwards (1993) suggested that a CTT could lead to a decline in speculative trading but not return volatility. Additionally, the study also indicates that the imposition of a CTT would lead to trading volumes shifting to international exchanges. Also, Bjursell, Wang, and Yau (2012) suggested that the imposition of a transaction tax could lead to an increase in the transaction costs, a decrease in trading volume, and potentially a rise in tax revenue or a reduction in return volatility for the US market.
In the Indian context, Sahoo and Kumar (2008) found transaction cost and liquidity to be negatively related and transaction cost and volatility to be positively related. Another study by Pavaskar and Ghosh (2008) showed the levy of CTT to be counterproductive when assessing the aggregate tax revenue from CTT and other sources such as service tax and income tax. Sahoo and Kumar (2011) conducted an ex ante analysis for five most traded commodities in India in the context of expected CTT of 0.017 per cent as announced in the 2008–2009 budget regarding trading activity, volatility and transaction cost. In another study, Sehgal and Ahmad (2013) found a negative relationship between BAS and trading volume and a positive correlation between BAS and intraday volatility. They also concluded that CTT to the tune of 0.017 per cent would have an adverse impact on trading volumes with no significant effect on the price volatility of the commodities.
Further, Sinha and Mathur (2015) suggested that an increase in the STT from 0.1 per cent to 0.125 per cent results in a decline in the trading volume on BSE and NSE, with no impact on the return volatility. Ray and Malik (2014) assessed whether the imposition of CTT was desirable for the Indian commodity market, using an event study methodology. Their findings suggest that CTT has not been able to achieve its objectives especially for revenue generation and also hampers overall market efficiency. Recent studies from Shanmugam and Champramary (2016), and Mukherjee (2017) suggest an adverse impact of CTT on the health of the commodity futures market.
As evident from the literature, work on the impact of CTT is very limited in the Indian context. It is also fragmented with studies examining only market liquidity, volatility or on the tax revenue aspects. There is a pressing need to revisit the CTT imposed in the Indian commodity futures market and evaluate its impact comprehensively on market liquidity, volatility and government tax revenue. The present study attempts to fill this significant research gap for the Indian commodities market. The results of this study shall provide valuable insights for policymakers, to re-examine the issue of CTT imposition in India and take appropriate policy steps based on a comprehensive analysis of all related aspects. Specifically, this study aims to scrutinize the following propositions: (a) The impact of CTT on market liquidity and volatility; (b) the effect of CTT on government tax revenue and (c) to provide policy suggestions for strengthening the Indian commodity futures market.
This study comprises two phases. In phase 1, we analyse the impact of CTT on liquidity and volatility in the Indian commodity futures market. In the second phase, we conducted a sensitivity analysis to ascertain the implications of CTT imposition on net tax revenue collections of the Indian Government.
The findings of the study suggest that CTT imposition has led to a significant decline in market liquidity, while return volatility has decreased post the levy of CTT, except for crude oil. Reduction in the trading activity has direct implications for government tax revenues. Analysing the impact of CTT on total tax revenue (involving transaction tax, income tax and service tax), we conclude that CTT is entirely unjustified on fiscal grounds as it results in substantial net revenue loss to the government. Further, other arguments for CTT, including market parity and checking speculative activity does not warrant the current high rate of CTT (0.01%). CTT has also damaged the equality between the domestic and international commodity markets as the latter have no transaction tax. Thus, CTT has an adverse impact on market microstructure aspects, global cost competitiveness and net tax revenue collection.
DATA
We use daily closing prices for the spot market and settlement prices for near-month futures contract. 1
Futures prices consist of daily closing prices of contracts nearest-to-maturity as trading volumes are expected to be the highest for these contracts (Sehgal, Berlia, & Ahmad, 2013; Zhong, Darrat, & Otero, 2004)
We shortlisted prominent exchanges, which record the highest trading volume for each category of commodity and hence are popularly accepted reference points in most prior work. Trading volumes data have been obtained for COMEX in the case of gold. LME has been used as a reference for base metals, while NYMEX has been taken for crude oil. The data source is Bloomberg. The traded quantity data are measured in lots, which have been standardized for different commodities across markets. Table 1 provides the details. We also obtain daily bid-ask quotes from Multi Commodity Exchange (MCX). Five quotes received around 10:00 pm (based on microsecond trading data) for each day have been used in the study for calculating average daily BAS. The period before CTT was levied is referred to as the pre- and after the CTT was imposed is referred to as post-CTT period in the text that follows. A separate analysis is carried out for the pre- and post-CTT period.
IMPACT OF CTT ON MARKET LIQUIDITY AND VOLATILITY
Liquidity
Some Indian studies 2
Sahoo and Kumar (2011), Ray and Malik (2014), Sinha and Mathur (2015), Shanmugam and Champramary (2016)
Commodities, Trading Platforms, and Units of Measurement as Used in the Study
We compute mean values for the pre-CTT and post-CTT period for all the measures of liquidity. For studying the long-term impact of CTT imposition on liquidity, we take the 38-month period before and after CTT implementation. An equal time window helps in getting a more reliable estimate of the decline in the liquidity post-CTT period. Statistical tests have been performed to find whether the pre- and post-CTT liquidity significantly differ from each other. First, we use a standard t-test. Additionally, to get a better estimate of standard errors, a bootstrap method is adopted, following Baltagi et al. (2006). A G(c) statistic using the Bootstrap method is calculated as follows:
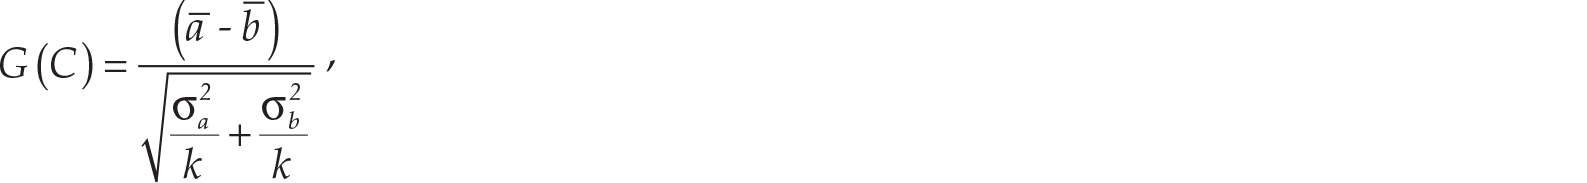
Where a = (a1, a2, a3, …, ak) representing the quantity of lots traded for k trading days in the pre-CTT period and b = (b1, b2, b3, …, bk) for k trading days in the post-CTT period. Samples were chosen 100 times, and the critical values of the test statistic were derived. The significance level is assessed using the confidence interval obtained from the bootstrapping distributions. We reconfirm our results using the Mann–Whitney test, a non-parametric test.
Results (Table 2, panel A) show that there is a significant decline in market liquidity after the imposition of CTT for all sample commodities. Table 2 is organized in two panels. In panel A, we report the mean values for different measures of liquidity in the pre- and post-CTT period and the change due to the CTT imposition. In panel B, we draw a comparison between the mean trading volumes for India and international exchanges in the pre- and post-CTT period along with the p-value for the t-test conducted to check for the significant difference between them. The increase in the BAS post the CTT implies a considerable rise in the transaction cost for all commodities except for zinc. Further, the trading volume and the turnover rate have fallen significantly in the period following CTT imposition. The Hui–Heubel ratio provides similar results, suggesting that the liquidity for all the commodities has shown a significant decline in the post-CTT period. Next, MEC confirms a decrease in market liquidity in the post-CTT period for all the sample commodities except gold and aluminium, where there is no significant change.
Impact of CTT on Commodity Market Liquidity: Empirical Results
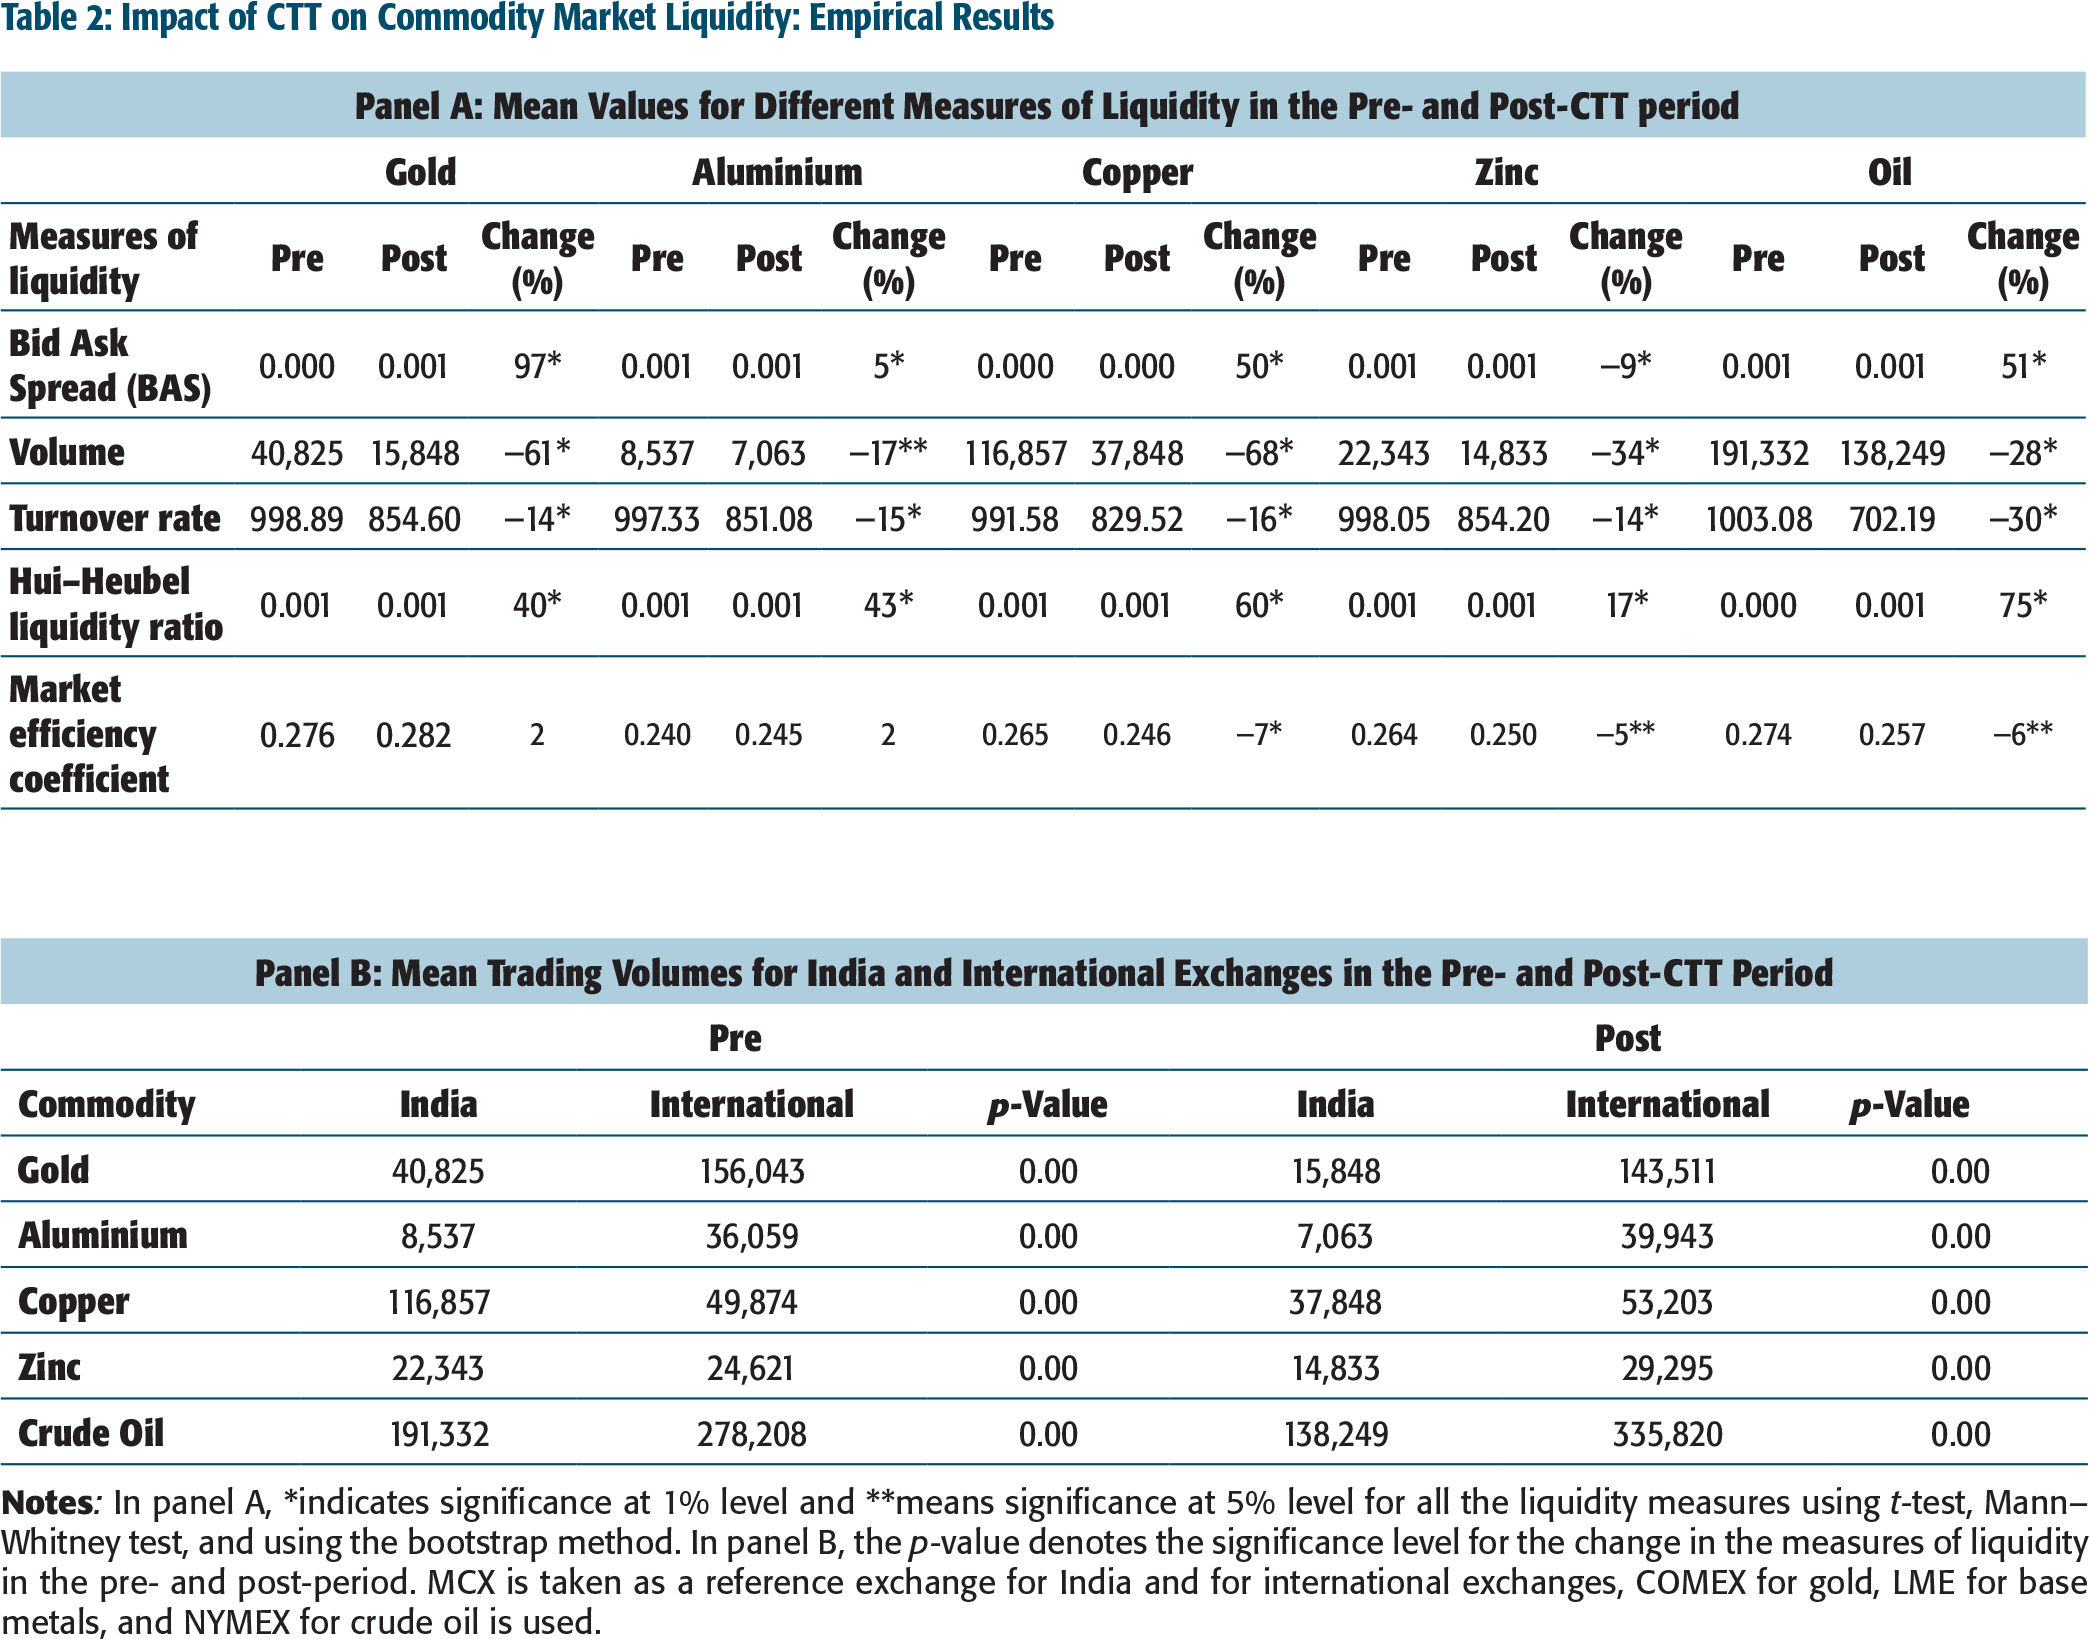
We also draw a comparison across MCX and international exchanges (Table 2, panel B). There is a significant difference between the trading volumes, with the global volumes being higher than the volumes at MCX for both the periods. While there is a percentage decline in the trading volumes on MCX in the case of base metals and crude oil, there is an increase in volume on international counterpart exchanges, which may signal a trade migration in the post-CTT period. Regarding gold, while the MCX trading volume has witnessed a significant decline of 61 per cent, similar decline for COMEX is only 8 per cent. Thus, CTT imposition seems to have severely impacted the market liquidity and international competitiveness of the Indian commodity futures market vis-a-vis global trading platforms.
As robustness check to conclude that imposition of CTT has led to the decline in liquidity, we statistically test for significant difference in the liquidity in the pre- and post-CTT period, controlling for the other factors affecting liquidity. We follow Sahoo and Kumar (2008) and Sehgal and Ahmad (2013) and make liquidity (trading volumes) a function of BAS, a measure of transaction cost, future price volatility (FPV), OI, lagged volume (TV) to control for their effect. In addition to the aforementioned factors, we also introduce the volumes of the equity market (NSE) and on corresponding international exchanges (INT), measured by the number of shares traded at NSE and the foreign counterpart exchange respectively in the aforementioned equation to account for any shifting of funds from the commodity market to another.

The results presented in Table 3 are organized in two panels. In panel A, we report the coefficients for factors affecting liquidity in the pre- and post-CTT period, and in panel B, the mean residual liquidity in the pre- and post-CTT period. Table 3, panel A suggest that OI and lagged volume impact market liquidity in a significantly positive manner for all commodities and in both pre- and post-CTT period. The impact of BAS has a significant negative impact on the liquidity of gold and copper, whereas a significant positive impact is observed for zinc and crude oil in the post-CTT period. However, in case of aluminium, the impact of BAS is significantly negative in both pre- and post-CTT period. The impact of FPV is significantly positive for all commodities except for gold in the pre-CTT period and oil in the post-CTT period. Impact of equity market volumes NSE is significantly positive for gold and copper in both pre- and post-CTT period and significantly negative for oil in the pre-CTT period only. The volumes at the international exchanges (INT) have a significant positive impact for all commodities except for gold in the post-CTT period.
Table 3, panel B shows the measure of residual liquidity estimated after controlling for the factors affecting it. The difference between these mean liquidity figures in the pre- and post-CTT period (38 months) has been statistically tested using a standard t-test. The total period is also divided into three sub-periods—3 months, 6 months and 1 year to assess whether the impact of CTT on market liquidity is temporary or permanent. 3
Due to paucity of space, the results can be provided on request.
Volatility
Liquidity in the Pre- and Post-CTT Period: Determinants and Measure of Liquidity
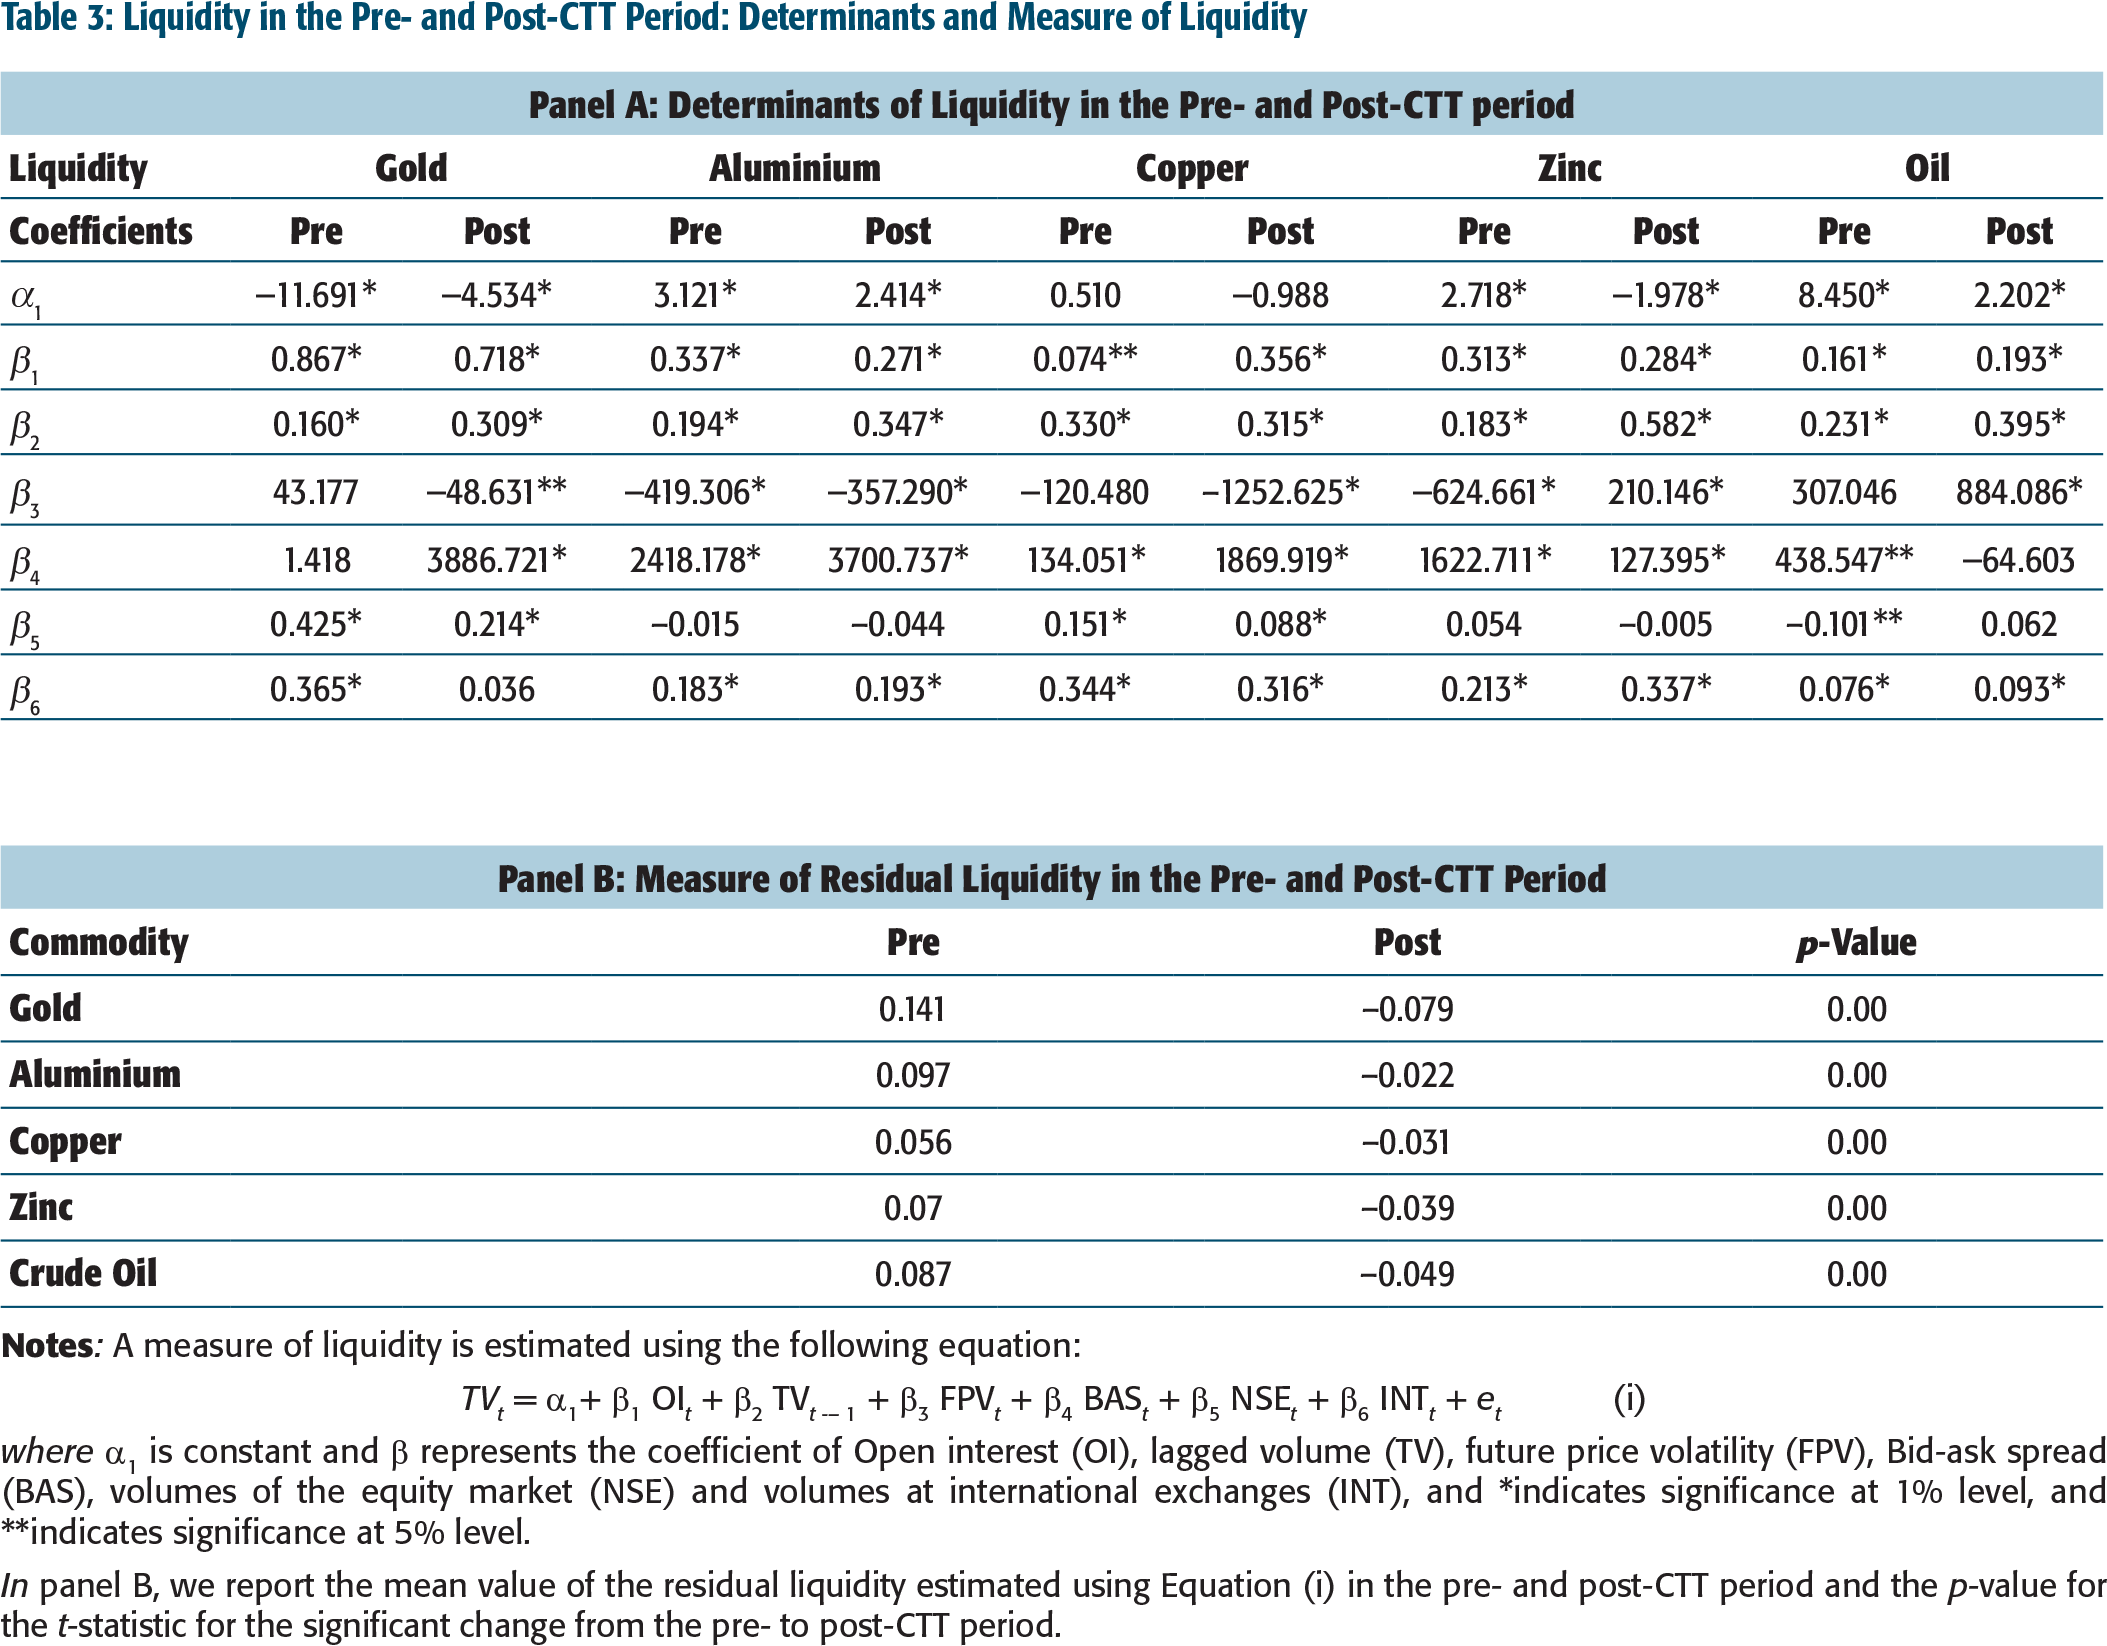

where α1 is constant and β represents the coefficient of Open interest (OI), lagged volume (TV), future price volatility (FPV), Bid-ask spread (BAS), volumes of the equity market (NSE) and volumes at international exchanges (INT), and *indicates significance at 1% level, and **indicates significance at 5% level.
In panel B, we report the mean value of the residual liquidity estimated using Equation (i) in the pre- and post-CTT period and the p-value for the t-statistic for the significant change from the pre- to post-CTT period.
For estimation purpose, we calculate the returns as the log difference in price for each of the commodities. Table 4 provides descriptive statistics of the sample return series for pre- and post-CTT period. In the pre-CTT period, the mean MCX futures returns are higher than the average future returns at the corresponding international exchanges for all the commodities except for crude oil. Further, return volatility on MCX is significantly lower than the similar values on foreign exchanges, which may perhaps due to greater regulation on the Indian bourses. All the series show negative skewness and leptokurtic distributions, implying non-normality, which is confirmed by the Jarque–Bera (JB) statistic. The Ljung–Box (LB) statistic shows evidence of autocorrelation at a level only for return series of copper and zinc and in the case of aluminium for LME. For the post-CTT period, MCX returns are higher than the international exchanges for base metals while they are lower for gold and crude oil, though not statistically significant. But the percentage increase in the returns is more for international exchanges vis-a-vis MCX. MCX return volatility is significantly higher in the case of gold, lower for crude oil and almost similar to those of LME for base metals except zinc where the difference is not significant. Most of the sample series are positively skewed and leptokurtic. The peakedness, however, seems to be lower in the post-CTT period as compared to pre-CTT period. The LB statistic shows that there is no significant autocorrelation for the majority of the sample series. 4
To test for inter market arbitrage opportunities, a standard t-test was conducted. The results indicate that the difference between the MCX returns and the returns on the international exchanges is not significant in the pre- and post-CTT period. Similar analysis for volatility suggests that except for zinc in the post-CTT period, the volatility for MCX and their respective international counterpart exchange is significant.
Descriptive Statistics of Commodity Return Series, Panel A Shows Results for the Pre-CTT Period, and Panel B Shows It for the Post-CTT Period
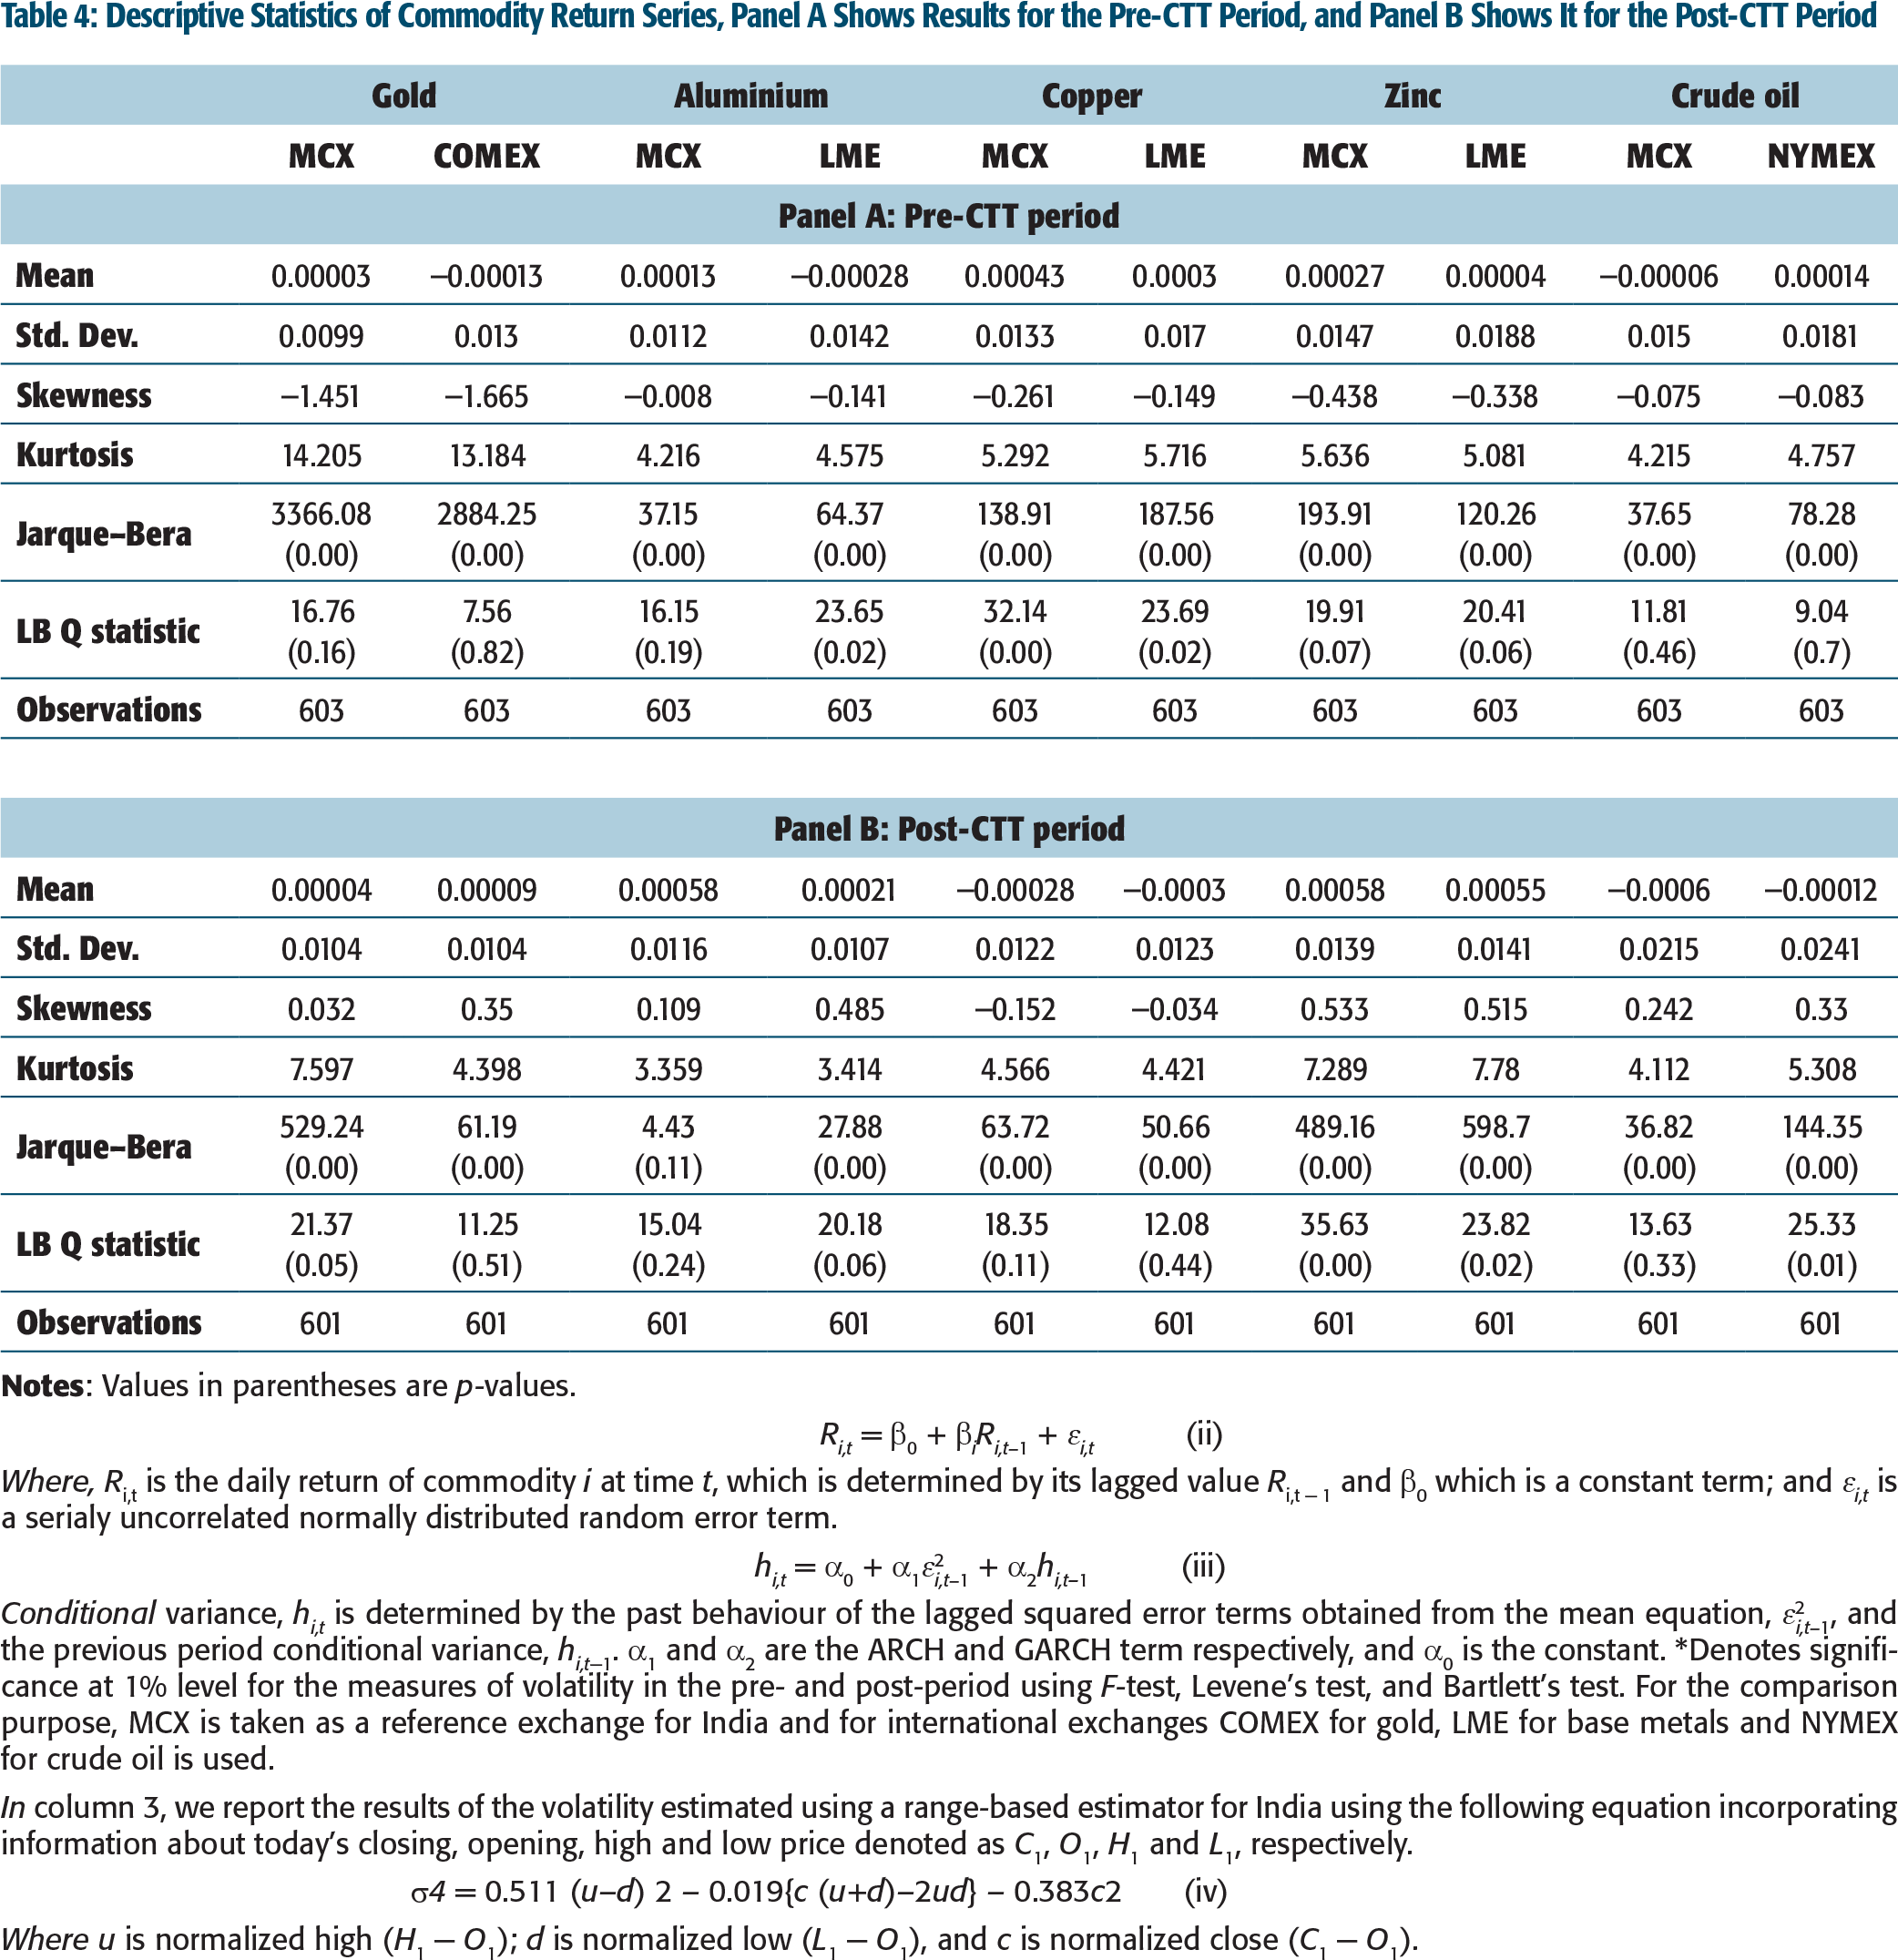

Where, Ri,t is the daily return of commodity i at time t, which is determined by its lagged value Ri,t − 1 and β0 which is a constant term; and ε i,t is a serialy uncorrelated normally distributed random error term.

Conditional variance, hi,t is determined by the past behaviour of the lagged squared error terms obtained from the mean equation, ε2 i,t –1, and the previous period conditional variance, hi,t−1. α1 and α2 are the ARCH and GARCH term respectively, and α0 is the constant. *Denotes significance at 1% level for the measures of volatility in the pre- and post-period using F-test, Levene’s test, and Bartlett’s test. For the comparison purpose, MCX is taken as a reference exchange for India and for international exchanges COMEX for gold, LME for base metals and NYMEX for crude oil is used.
In column 3, we report the results of the volatility estimated using a range-based estimator for India using the following equation incorporating information about today’s closing, opening, high and low price denoted as C1, O1, H1 and L1, respectively.

Where u is normalized high (H1 − O1); d is normalized low (L1 − O1), and c is normalized close (C1 − O1).
Stationarity was tested using augmented Dickey–Fuller (ADF) test and Phillips–Perron (PP) unit root tests, and all the series were found to be stationary at first difference both in the pre- and post-CTT period. 5
Due to paucity of space, the results can be provided on request.
Impact of CTT on Commodity Market Return Volatility: Empirical Results
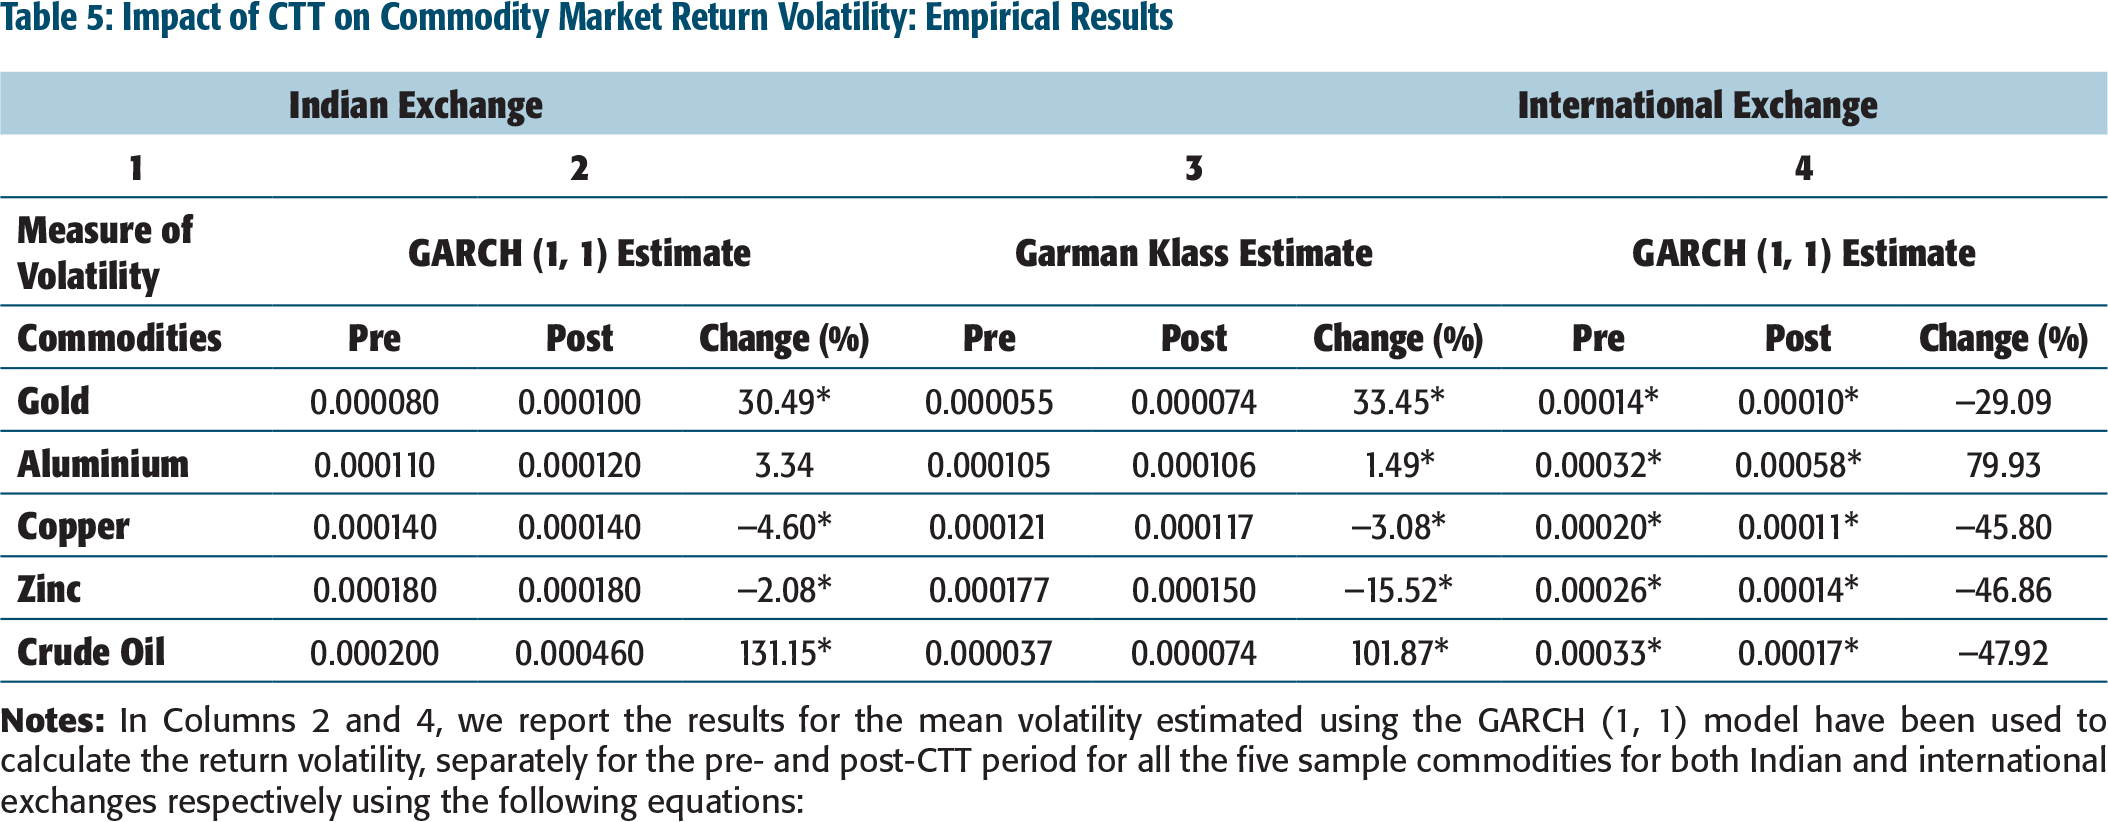
GARCH (1, 1) model has been used to estimate the return volatility, separately for the pre- and post-CTT period for all the five sample commodities for both Indian and international exchanges.

Where Ri,t is the daily return of commodity i at time t, which is determined by its lagged value Ri,t − 1 and 
Conditional variance, hi,t is determined by the past behaviour of the lagged squared error terms obtained from the mean equation,
The significance test for a change in the volatility has been done using standard F-test, Levene’s test and Bartlett’s test.
Determinants of Volatility and Measure of Residual Volatility

Where Ri,t is the daily return of commodity i at time t, which is determined by its lagged value Ri,t−1 and β0 which is a constant term. and ε i,t is a serially uncorrelated normally distributed random error term.

Conditional variance In σ2 i,t is determined by the equation mentioned above. α1, α2 and α3 are the ARCH, leverage and GARCH term respectively, and α0 is the constant. The variable TTMt is time to maturity; BASt is Bid-ask spread; VOLt and OIt is trading volume and open interest respectively; SPV is spot market volatility, and VINT is the volatility for the international market. *indicates significance at 1% level, **indicates significance at 5% level, and *** indicates significance at 10% level.
In panel B, we report the mean value of the residual volatility in the pre- and post-CTT period and the p-value for the F-statistic for the significant change from the pre- to post-CTT period.
Following Garman and Klass (1980), a range-based estimator of volatility is also calculated using the following equation incorporating information about today’s closing, opening, high and low price denoted as C1, O1, H1 and L1, respectively.
Where u is normalized high (H1 − O1); d is normalized low (L1 − O1), and c is normalized close (C1 − O1). Literature highlights the benefit of using range-based estimators over the classical estimators of volatility (Parkinson, 1980; Rogers & Satchell, 1991; Yang & Zhang, 2000). The results are robust to a change in the measure of volatility (Table 5, column 3).
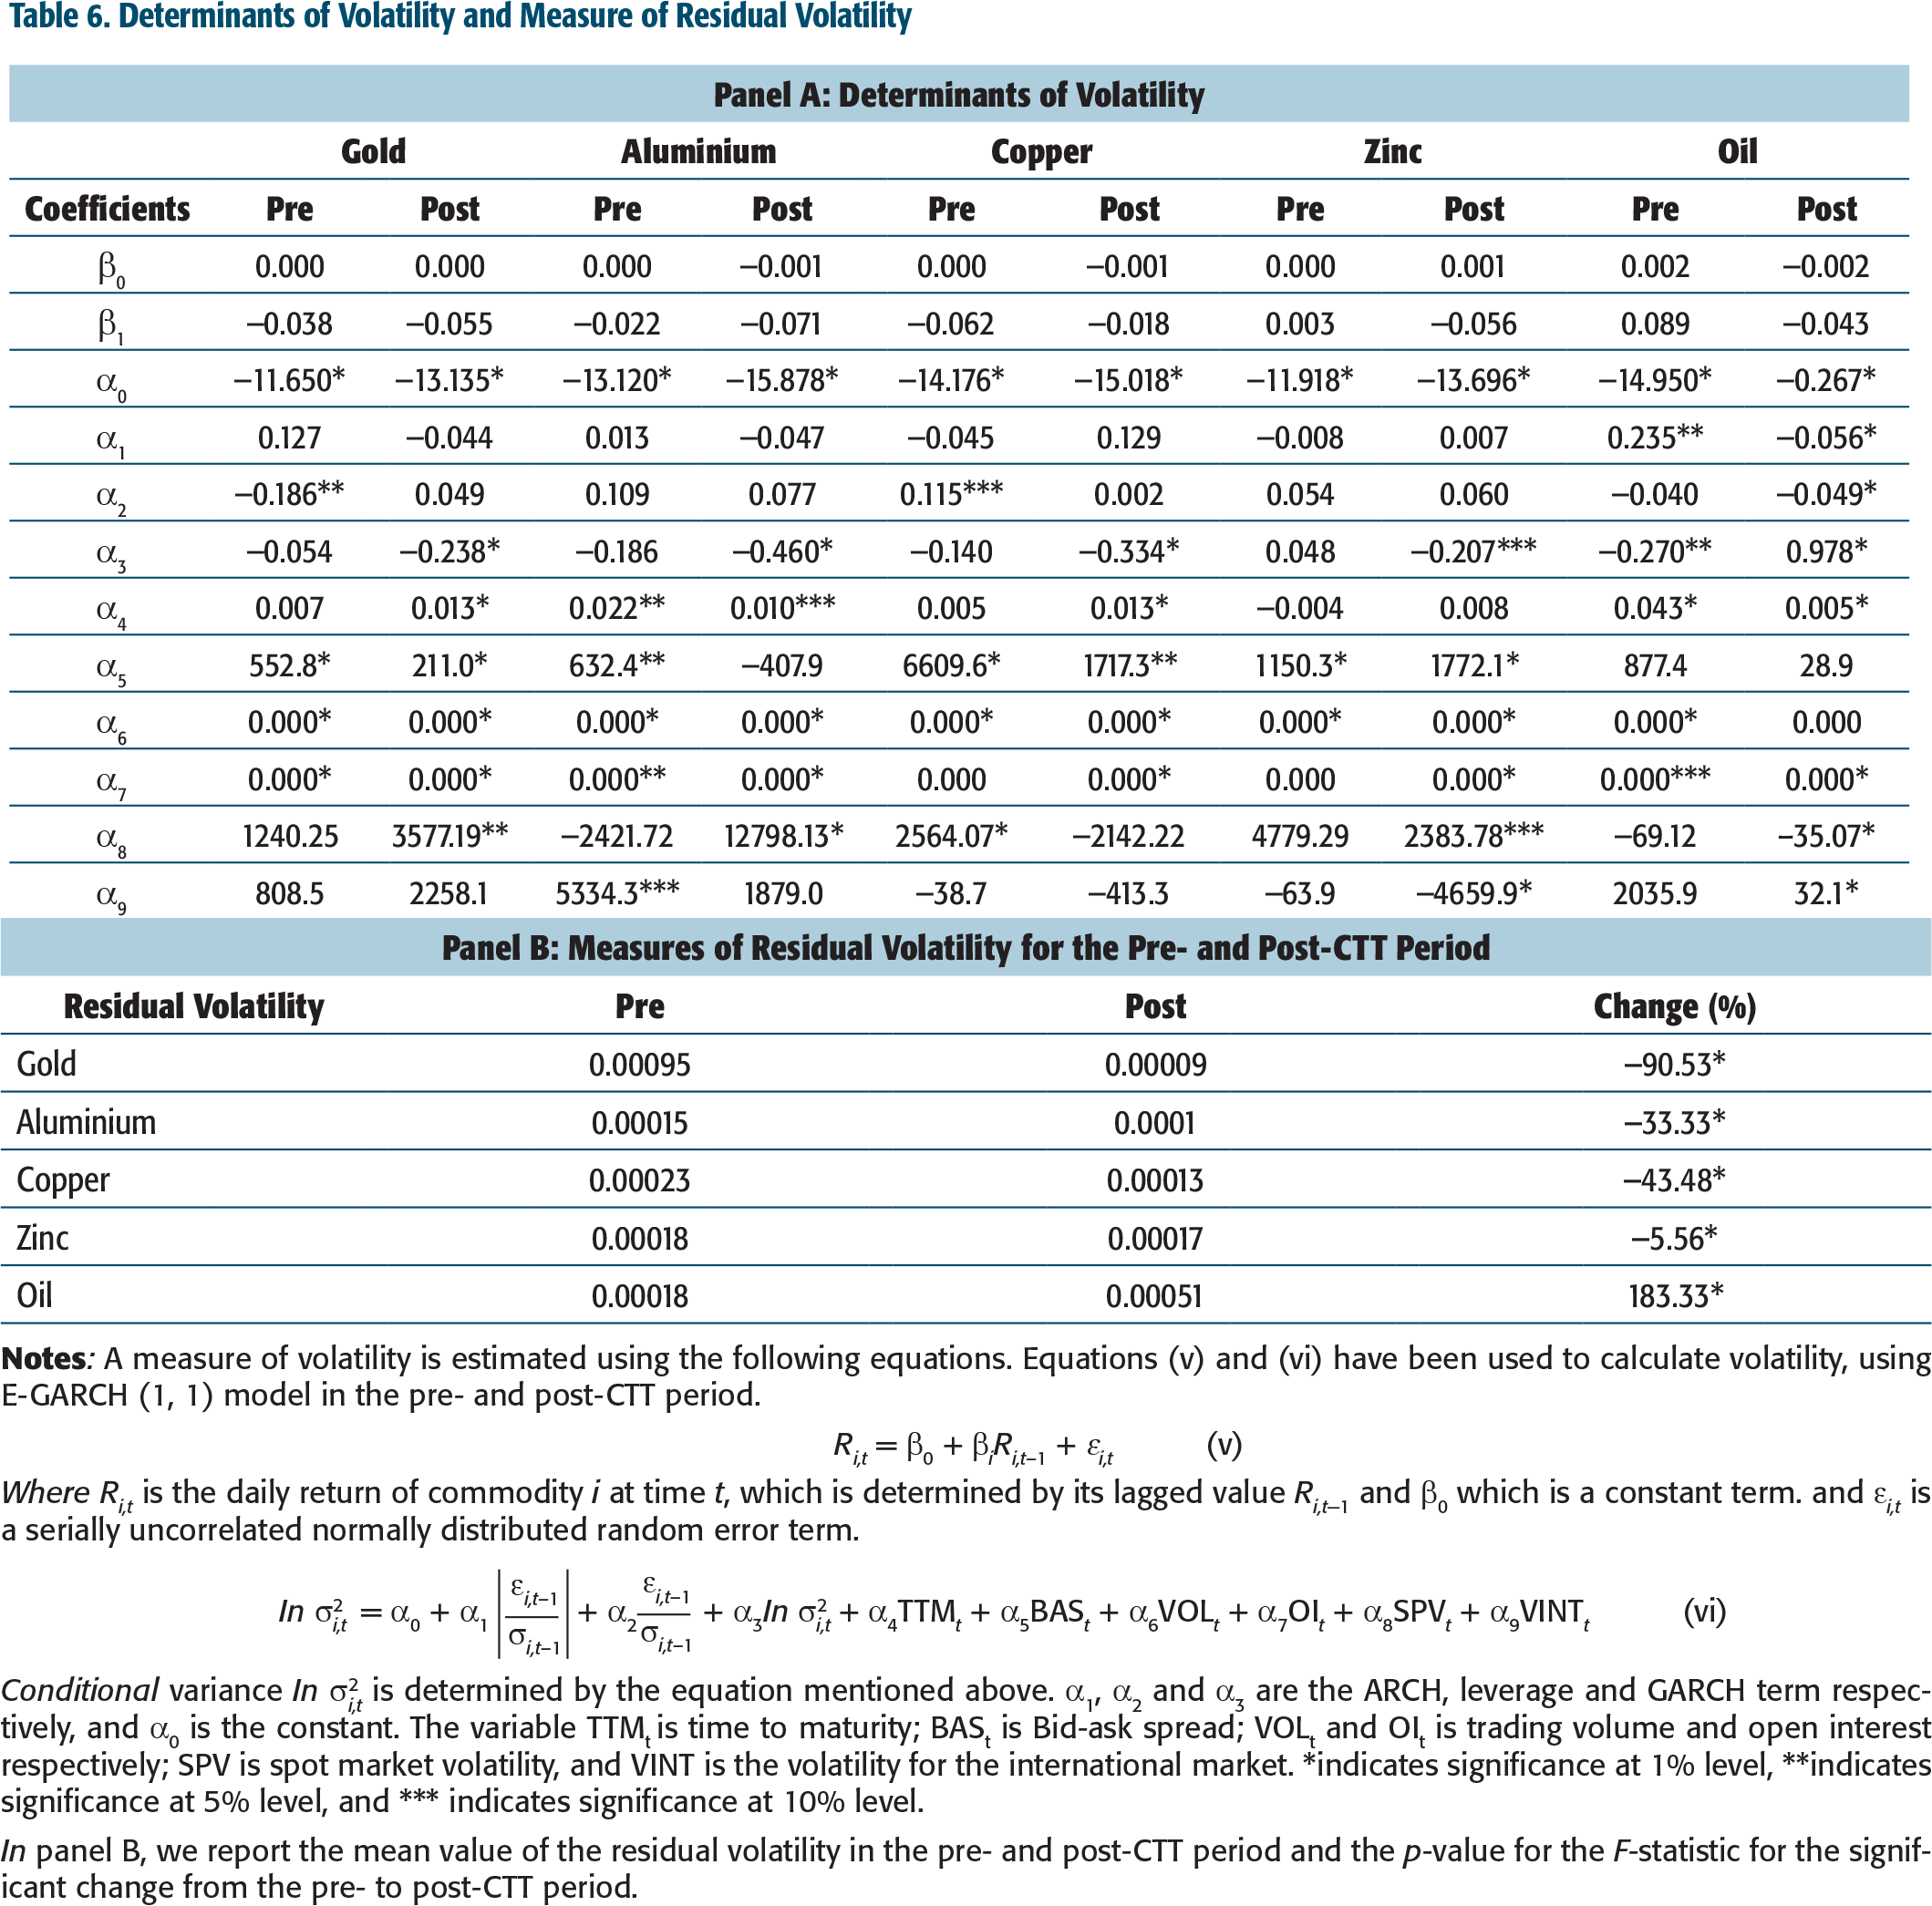
To isolate the impact of CTT on the return volatility, we control for other factors affecting volatility. A number of studies discuss the relationship between volatility and its determinants like time to maturity, volume, OI, transaction cost and spot price volatility (refer to Gurrola & Herrerias, 2011; Jongadsayakul, 2015; Kadioglu, Kiliç, & Öcal, 2016; Kenourgios & Ketavatis, 2011; Sahoo & Kumar, 2008; Sehgal & Ahmad, 2013; Verma & Kumar, 2010). We incorporate the volatility of the international counterpart exchange as an additional factor to account for its impact on the volatility of the Indian market.
Equations (v) and (vi) have been used to estimate volatility, using E-GARCH (1, 1) model in the pre- and post-CTT period.

Where, Ri,t is the daily return of commodity i at time t, which is determined by its lagged value Ri,t−1 and 
Conditional variance
The results are presented in Table 6, panel A offer interesting insights. Time to maturity has a significant positive impact for aluminium, oil in both pre and post-CTT period, and in case of gold and copper (only in the post CTT period) with no significant effect on zinc. BAS has a significant positive impact for all commodities except aluminium in the post-CTT period and crude oil for both periods (similar to Aliber, Chowdhry, & Yan, 2003; Sahoo & Kumar, 2008). Trading activity, measured by trading volume and OI, has a significant positive impact on the volatility for all commodities, consistent with the expectation (Pati & Kumar, 2007; Sahoo & Kumar, 2008). Interestingly, spot market volatility has a significant negative impact only in case of oil in the post-CTT period and significant positive impact for gold, aluminium and zinc (in the post-period) and copper (in the pre-period). Volatility at the international exchanges has a significant positive impact in case of oil (post-CTT period) and aluminium (pre-CTT period) and a significant negative impact on zinc (post-CTT period).
In Table 6 panel B, the measure of residual volatility is calculated for the pre- and post-CTT period, and the difference between these volatility figures in the pre and post period (38 months) has been statistically tested using a standard t-test. The table is organized in two panels. In panel A, we report the coefficients for factors affecting volatility in the pre- and post-CTT period and in panel B the mean residual volatility in the pre- and post-CTT period. The impact of CTT imposition is more pronounced for gold and crude oil owing to their international character. There is a significant decline in the volatility for all the commodities except for crude oil, where there is a considerable rise in the volatility of more than 100 per cent. In case of gold, the volatility has reduced by almost 90 per cent primarily because of reduced price efficiency of the Indian markets and lost information interlinkages with its international counterpart (Sehgal & Dutt, 2016). The total period is also divided into three sub-periods—3 months, 6 months and 1 year to assess whether the impact of CTT on market liquidity is temporary or permanent. The results indicate similar patterns both the short and long term except for aluminium and zinc (refer to Note 5).
Next, we attempt to ascertain the tax revenue generated at alternative CTT rates for the Indian commodity futures market. Given the link between revenue implications and trading activity, we use trading volumes as the base liquidity measure for estimating net tax revenue gain/loss to the government at different CTT rates. Besides the economic aspects of CTT imposition, we also extend our analysis by examining other arguments including market parity, curbing speculation and information efficiency implications.
CTT AND GOVERNMENT TAX REVENUE
The principal argument for the imposition of CTT was to improve the fiscal deficit position of the government. In this section, we analyse the net tax benefit to the government after the imposition of CTT.
Pavaskar and Ghosh (2008) highlight that while assessing the real impact of CTT on the total tax revenue collections, it is critical to account for revenue generated from all the sources relating to derivative trading in commodity futures market. They consider the total tax revenue to be a sum of the CTT tax revenue, income tax revenue from brokers, commodity exchanges, intraday traders and other investors. We augment their framework by including the service tax 6
Service tax rate inclusive of surcharge and cess approximately equal to 15% is considered for the analysis. It has been replaced by Goods and Service Tax (GST) with effect from July 1, 2017.
Commodities Market and Government Tax Revenue: A Summary
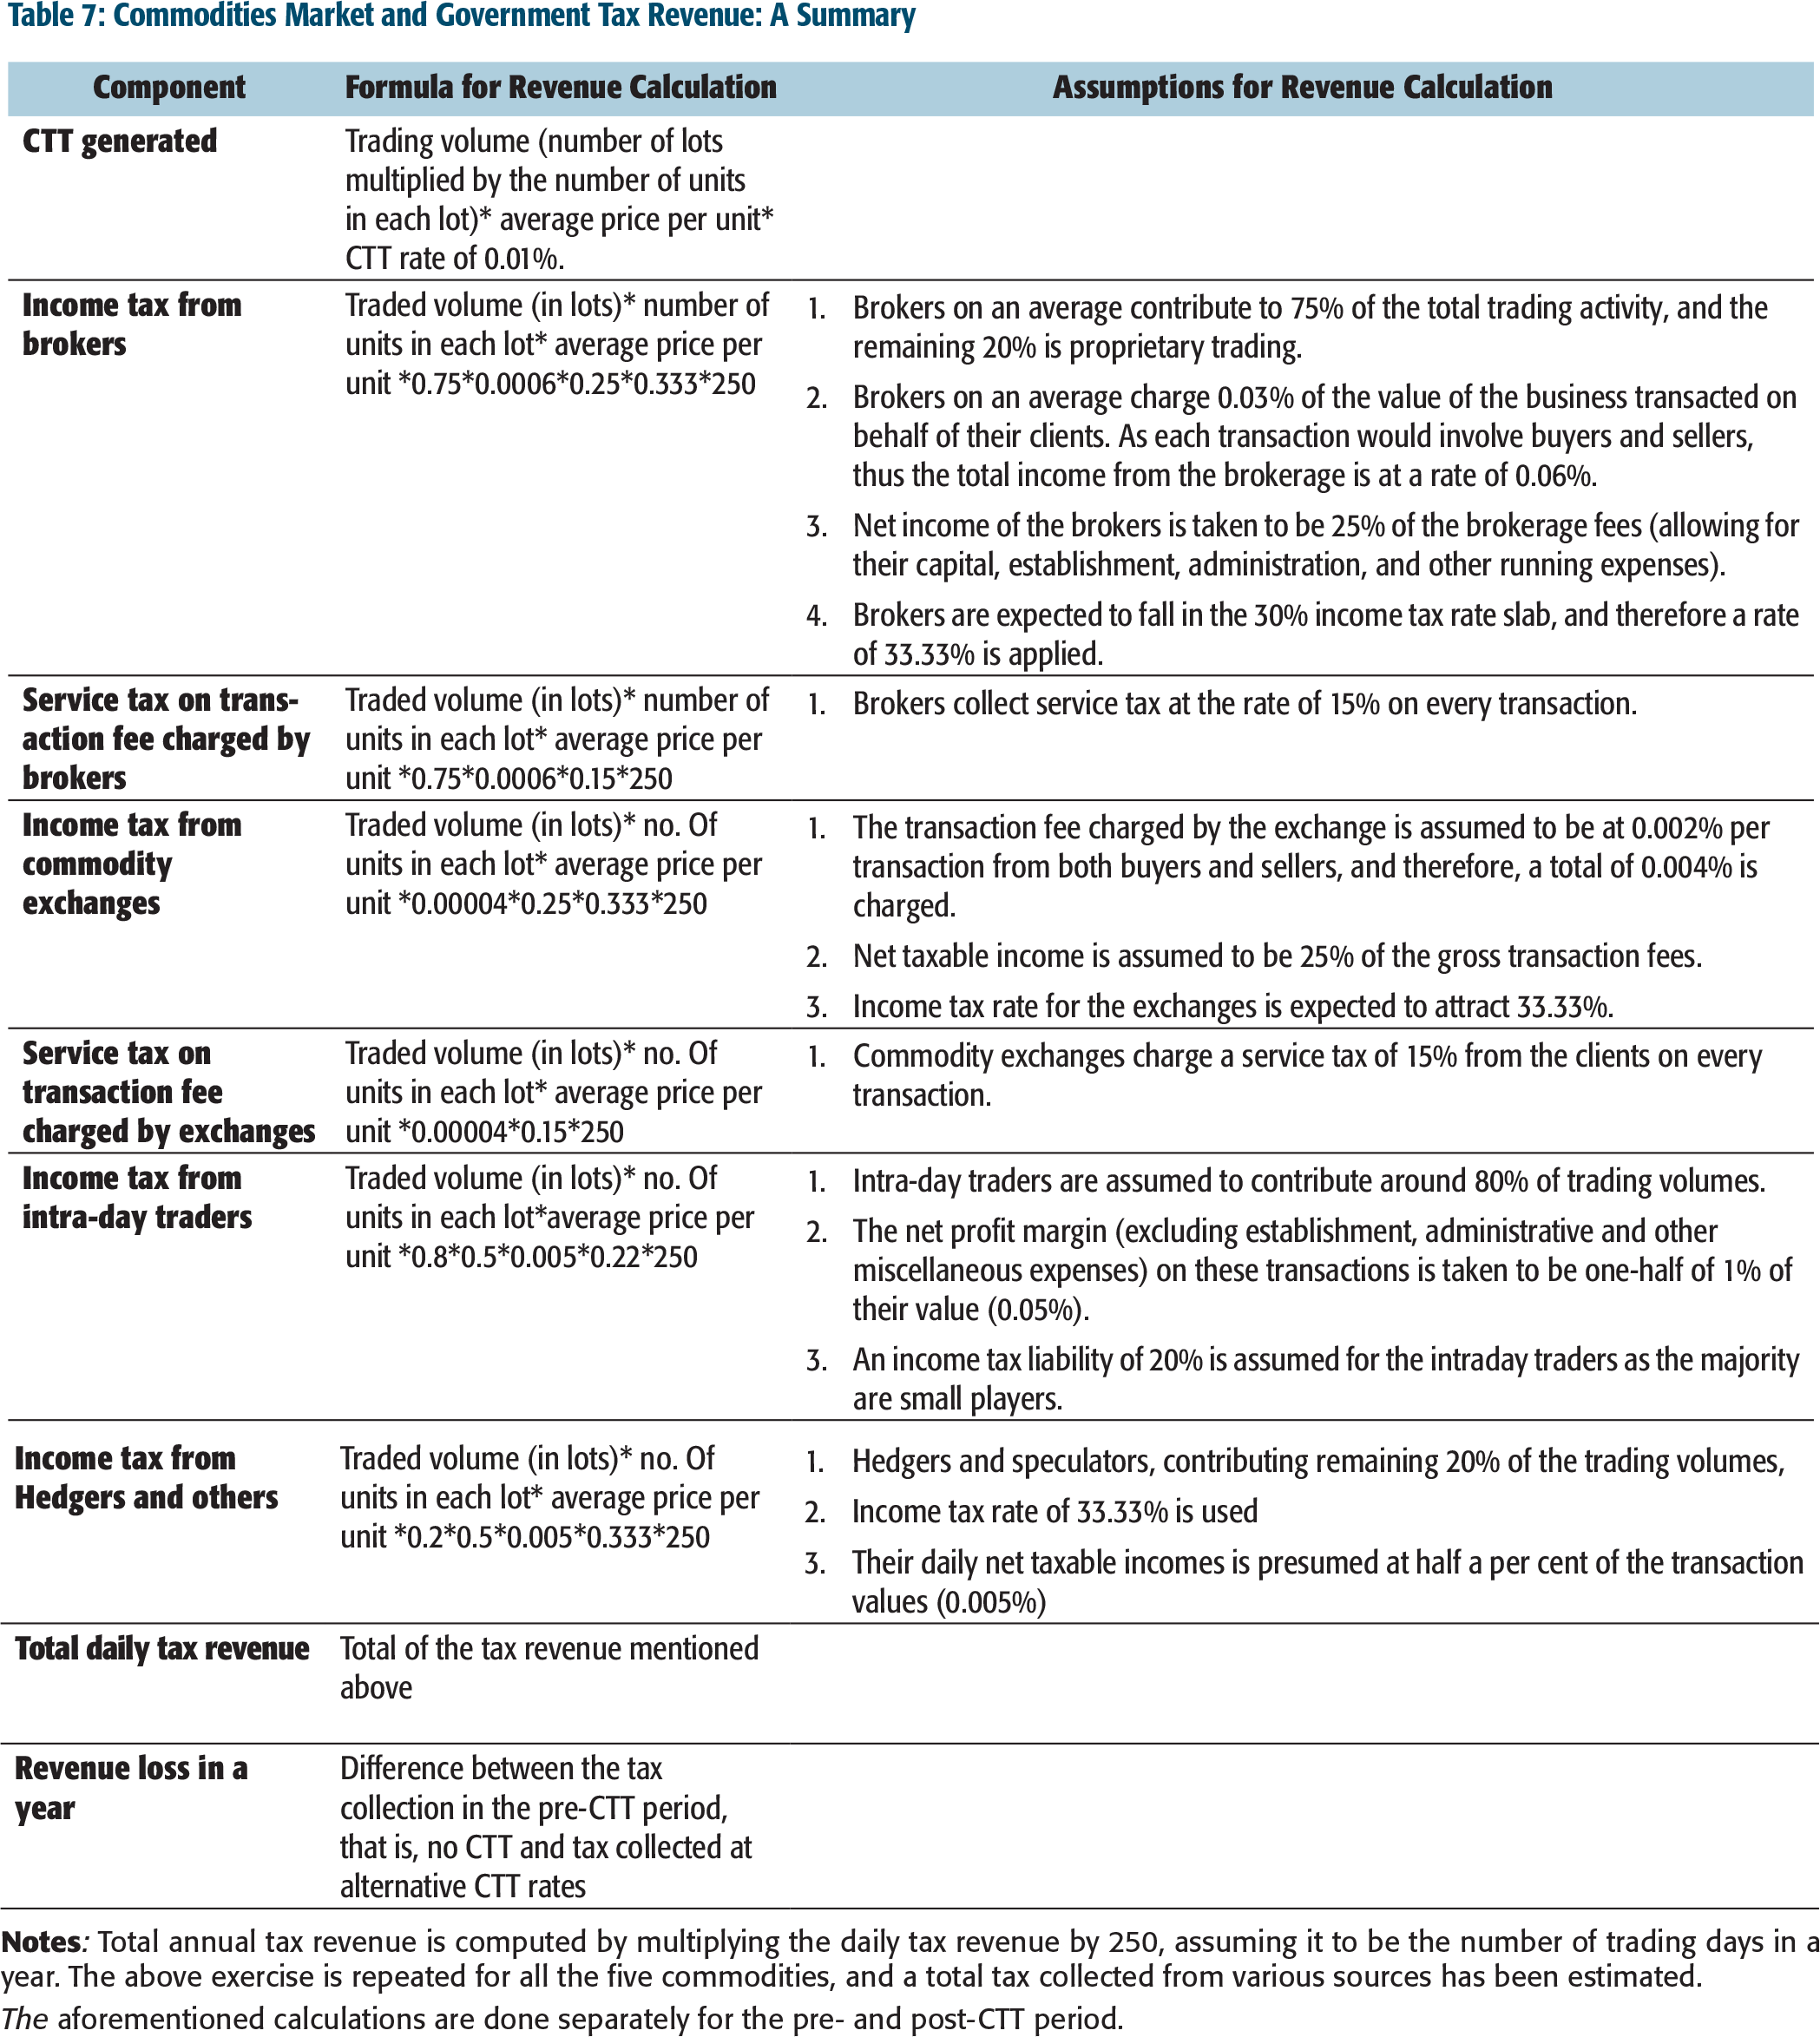
The aforementioned calculations are done separately for the pre- and post-CTT period.
The result of the empirical analysis is presented in Table 8. The table is organized in three panels. In panel A, we report the results based on the assumption that the entire change in commodity trading volumes from pre- to post-CTT period is attributed to the imposition of CTT. In panel B, we provide the results, assuming only 50 per cent of the change in commodity trading volumes from pre- to post-CTT period is attributed to the imposition of CTT, while the remaining is attributed to the difference in macroeconomic and commodity market conditions. In panel C, we provide the results, assuming only 25 per cent of the variation in commodity trading volumes from pre- to post-CTT period is attributed to the imposition of CTT, while the remaining is attributed to changes in macroeconomic and commodity market conditions. The result shows that CTT is revenue negative and cannot be justified on the grounds of improving the fiscal deficit.
The result also highlights the massive opportunity cost government incurs regarding the tax revenue lost and hampers economic growth and market development. Even at the rate of 0.001 per cent, the government loses annual tax revenue worth ₹2.44 billion, thus warranting the need for removal of CTT.
Impact of CTT on Government Tax Revenue
Despite negative consequence, the proponents of CTT may, however, argue in its favour on the market parity grounds as similar transaction tax is imposed on equity market in India. However, the transaction taxes imposed in equity and commodity markets should have been in line with the level of volatility of the two markets as one of its goals is to curb speculation. Market with greater volatility should be taxed at a higher rate. Even on the grounds of market parity, current CTT rate of 0.01 per cent is not justified. It may be noted that the average volatility, measured by the standard deviation for NSE 50 stocks in the post-CTT period is 8.8 per cent on a monthly basis, while the average monthly standard deviation for our five sample commodities is about 5.3 per cent for the same period. The above argument, however, does not hold ground because CTT has failed to curb speculative pressure as there is a significant rise in the volatility post the imposition of CTT.
It should be further noted, that after the imposition of CTT, Indian commodity futures market has lost its parity with the international markets, since globally no tax is levied on the commodity futures trading. Mukherjee (2017) highlights the absence of transaction tax on DGCX, LME COMEX, and so on. Another reason for introducing CTT was to have an audit trail of money flow into the commodity markets. A possible alternative is to ensure that there is separate and detailed reporting of transactions above a certain threshold by the Indian exchanges, like in the case of international trading platforms such as Chicago Board of Trade (CBOT).
Further, our analysis in the previous section provides substantial evidence that CTT has adversely impacted trading liquidity, returns volatility and international competitiveness of the Indian commodity futures market. Hence, keeping in mind these arguments, there is no justification for retaining CTT on the commodity futures trading in India as it leads to a huge revenue loss to the government, owing to reduced trading activity and trade migration.
SUMMARY AND POLICY SUGGESTIONS
This study estimates the economic consequences of the imposition of CTT on market liquidity, volatility and government tax revenue in a comprehensive manner using data on five sample commodities (gold, aluminium, copper, zinc, and crude oil) in India. The study period is from 1 May 2010 to 31 August 2016. MCX has been used as a reference commodity exchange in India, while we use COMEX for gold, LME for base metals and NYMEX for crude oil for international comparisons. The impact of CTT on market liquidity is analysed using different measures of liquidity, and subsequently, a sensitivity analysis is performed to assess the effect of CTT on the net tax revenue loss/gain to the government.
The empirical results show that levying the CTT has substantially reduced market liquidity, which has direct implications for government tax revenues. Considering the transaction tax, income tax and service tax aspects of CTT and the resulting loss in trading volumes, we conclude that CTT results in huge revenue loss to the exchequer and hence is entirely unjustified on economic grounds.
The market parity argument too does not justify a high rate of CTT because equity returns are far more volatile than commodity returns. Nor is CTT imposition explained on account of curbing speculation as commodity return volatility has gone up in the post-CTT period. CTT has also distorted the parity between the domestic and international commodity markets as most international exchanges have no transaction tax, which makes the Indian market lose its cost competitiveness. Given that CTT results in substantial net revenue loss to the government and its adverse impact on market microstructure aspects and international cost competitiveness, we suggest that withdrawal of CTT would not only imply greater fiscal prudence but also be the right trigger to boost the Indian commodity futures market in the long run.
However, if the government wishes to withdraw CTT in a phased manner, then the CTT rate should be revised to about 0.003 per cent in the first phase and can be removed subsequently over the next 3 years. Reduction in CTT would be ideal for Indian commodities market development, improving its liquidity and making it more internationally competitive. In addition, a vibrant commodity futures market would lead to more significant economic growth through ecosystem linkages, by creating employment opportunities, better hedging possibilities for SME’s and farmers.
Withdrawal of CTT will have positive implications for all stakeholders in the market. The government can obtain more substantial tax revenues on higher trading volumes, which have been severely impacted by the imposition of CTT. Withdrawal of CTT will help the government in achieving its fiscal targets. Improved market liquidity shall also lead to better price discovery. Removal of CTT shall also reduce the cost of risk hedging, thereby encouraging farmers and SMEs to use commodity derivatives platforms more actively. Improved cost competitiveness of the Indian market will also address the problem of trade migration to international exchanges. The higher commodity futures trading will also generate increased employment and income opportunities by creating greater demand for warehousing, quality testing labs, transportation, insurance, and other related services.
Declaration of Conflicting Interests
The authors declared no potential conflicts of interest with respect to the research, authorship, and/or publication of this article.
Funding
The authors received no financial support for the research, authorship, and/or publication of this article.