
Abstract
Executive Summary
With incessant global competition, technological innovations, organizational restructuring, and turbulent business environment, contemporary organizations need resilient employees, who in turn are capable to face unprecedented changes and adapt successfully to challenging roles, tasks, and situations (Shin, Taylor, & Seo, 2012). Consequently, this necessitates a validated employee-centric measure of resilience for assisting the organizations in fostering and measuring employee resilience development, which would enable employees to meet the challenges and growing work demands (Hodliffe, 2014, The development and validation of the employee resilience scale (EmpRes): The conceptualisation of a new model (Doctoral dissertation), New Zealand: University of Canterbury; Masten, 2001, American Psychologist, 56(3), 227; Winwood, Colon, & McEwen, 2013, Journal of Occupational and Environmental Medicine, 55(10), 1205–1212). To address this gap, the study assessed the psychometric properties of the ‘resilience at work’ (RAW) scale.
The study sample comprised employees working in IT organizations operating in the Indian National Capital Region (NCR). The study is based on cross-sectional questionnaire responses from 546 Indian employees working in the IT industry. A confirmatory factor analysis (CFA) was conducted to test the factorial validity followed by an analysis of convergent and discriminant validity of the scale items. To evaluate the convergent validity, this study utilized three standard criteria which are standard factor loadings, composite reliability, and average variance extracted (AVE) (Anderson & Gerbing, 1988, Psychological Bulletin, 103(3), 411–423). In addition, the study tested the nomological validity of the RAW scale.
The study results reveal that the RAW scale exhibits high reliability and the results of CFA validated the seven-factor model of the RAW scale. The results of CFA and reliability of the scale demonstrate that the scale can be utilized to develop and measure resilience among Indian employees. Furthermore, the results of the nomological validity exhibit a significant relationship between resilience and work engagement. This study offers significant implications for both researchers and HRD practitioners. The study provides preliminary evidence for the psychometric properties of the scale in t he Indian organizational context and signifies its potential for the cross-cultural implementations. The RAW scale, thence, can be utilized by organizations as a validated tool for measuring and developing resilience among employees.
Keywords
Existent research shows that resilience is not merely a stress resistance resource, rather it plays a pivotal role in assisting employees to adapt successfully to adverse workplace settings, manage emotional strains, nurture effective coping strategies, improve their well-being, and augment professional development (Cooke, Cooper, Bartram, Wang, & Mei, 2016; King, 2016; King et al., 2016). Thus, in the present era of economic uncertainty and intense competitiveness, organizations that instil resilience among their employees will have a clear advantage. However, resilience in the workplace context is still a relatively unexplored phenomenon.
Researchers have affirmed the significance of resilience and reported its vital role in fostering employees’ well-being and performance (Grant, Curtayne, & Burton, 2009; Mak, Ng, & Wong, 2011; McCann, Selsky, & Lee, 2009).
CONCEPTUALIZATION OF RESILIENCE
Recently, the construct of resilience has garnered an intensified attention of behavioural and medical sciences scholars (Britt et al., 2016; King, 2016; Winwood, Colon, & McEwen, 2013). Earlier, the construct of resilience has been investigated profusely in clinical and developmental psychology (Herrman et al., 2011; Luthar, Cicchetti, & Becker, 2000; Robertson et al., 2015; Wagnild & Young, 1993). The conceptualization of resilience has not been uniform (Herrman et al., 2011) since the plethora of research has varied across disciplines over time. This has ensued in a myriad of operational definitions of resilience (Rossi, Meurs, & Perrewe, 2013). Over the decade, researchers have postulated innumerable conceptualizations of the construct of resilience, reflecting resilience as a personality trait or state (Block & Kremen, 1996); process or outcome (Masten, 2001), and innate resilience or dynamic capability (Luthans, 2002; Rutter, 2012). However, most of the existing definitions describe the concept of resilience as bouncing back from adversity (see Buzzanell, 2010; Moenkemeyer, Hoegl, & Weiss, 2012; Torres & Fyke, 2013).
Resilience indicates an individual’s emotional endurance and characterizes persons who exhibit courage and adaptability in the wake of crisis and life’s misfortunes (Wagnild & Young, 1990). Newman (2005) defined resilience as ‘the individual’s capability to adapt in the face of calamity, strain, suffering, and ongoing consequential life stressors.’ Rutter (1987) described resilience as a protecting factor that shields persons from psychotic illness and defined resilient individual as one who possess self-esteem, believe in one’s own self-efficacy, and foster problem-solving skills. Southwick and Charney (2012) elucidated resilience as the ‘process of adapting well in the face of adversity, trauma, tragedy, and even significant sources of threat.’ Nevertheless, all of these researchers conceptualized resilience as the individual’s relative susceptibility to the maladaptive effects of their environment.
However, recently there has been a shift from the dispositional view of resilience which identifies it as a developable capability among individuals. This perspective views resilience as a dynamic process which can be developed through individuals’ thoughtful interaction with the external environment (Luthans, 2002; Rutter, 2012). This is extremely important, since it suggests that rather than being a genetic trait, resilience is an adaptable epiphenomenon which can be developed among employees through appropriate training (Winwood et al., 2013). Supporting this view, Luthans (2002) defined resilience as the ‘developable capacity to rebound or bounce back from adversity, conflict, and failure or even positive events, progress, and increased responsibility.’ Buzzanell (2010) argued that ‘rather than an individual phenomenon that someone either possesses or does not, resilience is developed, sustained, and grown through discourse, interaction, and material considerations.’ Poole advocated that through a process perspective, ‘we can see resilience as dynamic, integrated, unfolding over time and through events, evolving patterns, and dependent on contingency’ (as cited in Buzzanell, 2010). These studies, thus, supported the fact that resilience can be consciously developed. The concept of resilience has primarily been ushered to the workplace through the seminal study of Masten and Reed (2002) and Coutu (2002). Coutu (2002) described resilient individuals at the workplace as those who exhibit enhanced awareness and show the ability to be more flexible, improvise things, and adapt readily to change.
Thus, supporting the transformational perspective, the current study adopts a dynamic view on resilience, and draws on the following tenets: (a) employee resilience is an individual ability that can be fostered by employing resources and ensuing successful adaptation and flourishing at work, and (b) employee resilience can be manifested in both stable and adverse conditions, that is, the construct indicates the individual’s capability of not only adapting to adverse events but also to proactively pursue opportunities for continual growth and improvement in stable environments. Drawing on these perspectives, the study advocates that considering resilience as merely ‘bouncing back’ to a previous state of functioning, indicates a rather deficit explanation and thus advocates a ‘developable and transformational’ perspective of resilience. The current study defines employee resilience as ‘an individual’s capacity to manage the adverse situations and everyday stress of work and remain healthy, rebound and learn from unexpected setbacks and prepare for future challenges proactively, demonstrating increased competence, professional growth, and the ability to handle future challenges in the workplace.’
Literature has shown that resilience exists in the workplace, is tied to positive workplace outcomes, and is measureable. However, there are noticeable gaps on resilience research in the workplace context. First, much of the literature on resilience treats resilience as a trait or resource rather than as a developable capacity (Moenkemeyer et al., 2012). This static view of resilience ignores the factors leading to the development of resilience and how resilience might be measured at workplace. Second, while resilience has been considered significant for individual functioning in organizations (e.g., King et al., 2016), measuring resilience construct through the paradigm of psychological capital is insufficient and lacks ecological validity. Luthans, Youssef, and Avolio (2007) proposed that the resilience component should be considered as a uni-dimensional construct, which further lacks operational underpinning. Echoing a similar thought, Bobko and Stone-Romero (1998) argued that if a measure does not assess all of the components or facets of a construct that are theoretically related, then the measure should be considered ‘deficient’. Third, despite the fact that researchers now believe resilience is something that can be developed, little academic research has been dedicated to ‘how people develop resilience in themselves and others’ (Luthans, Vogelgesang, & Lester, 2006). The scales for measuring resilience in the workplace are still in its infancy (Luthans et al., 2007), therefore, the approaches to design, deliver, and evaluate workplace resilience measures still await scholarly investigation.
TOOLS FOR MEASUREMENT OF RESILIENCE
As the concept of resilience evolved, researchers began to develop instruments aimed at measuring the construct (Connor & Davidson, 2003; Prince-Embury, 2008; Wagnild & Young, 1993). There are different scales available to measure resilience for different age groups, though these resilience measurement tools targeted the individual personality characteristics that might lead to successful adaptation. Rather than assessing resilience as the capacity to emerge from experiences of adversity and exhibiting increased competence and growth at workplace, the extant resilience measurement scales generally examined protective factors or resources that involved personality traits and coping styles. For instance, Wagnild and Young (1993) developed the resilience scale which assessed equanimity, perseverance, self-reliance, meaningfulness, and existential aloneness. Congruently, the Connor–Davidson Resilience Scale (Connor & Davidson, 2003) measured individual characteristics such as self-efficacy, sense of humour, patience, optimism, and faith.
Major Resilience Measures Investigated in Various Cultural Contexts
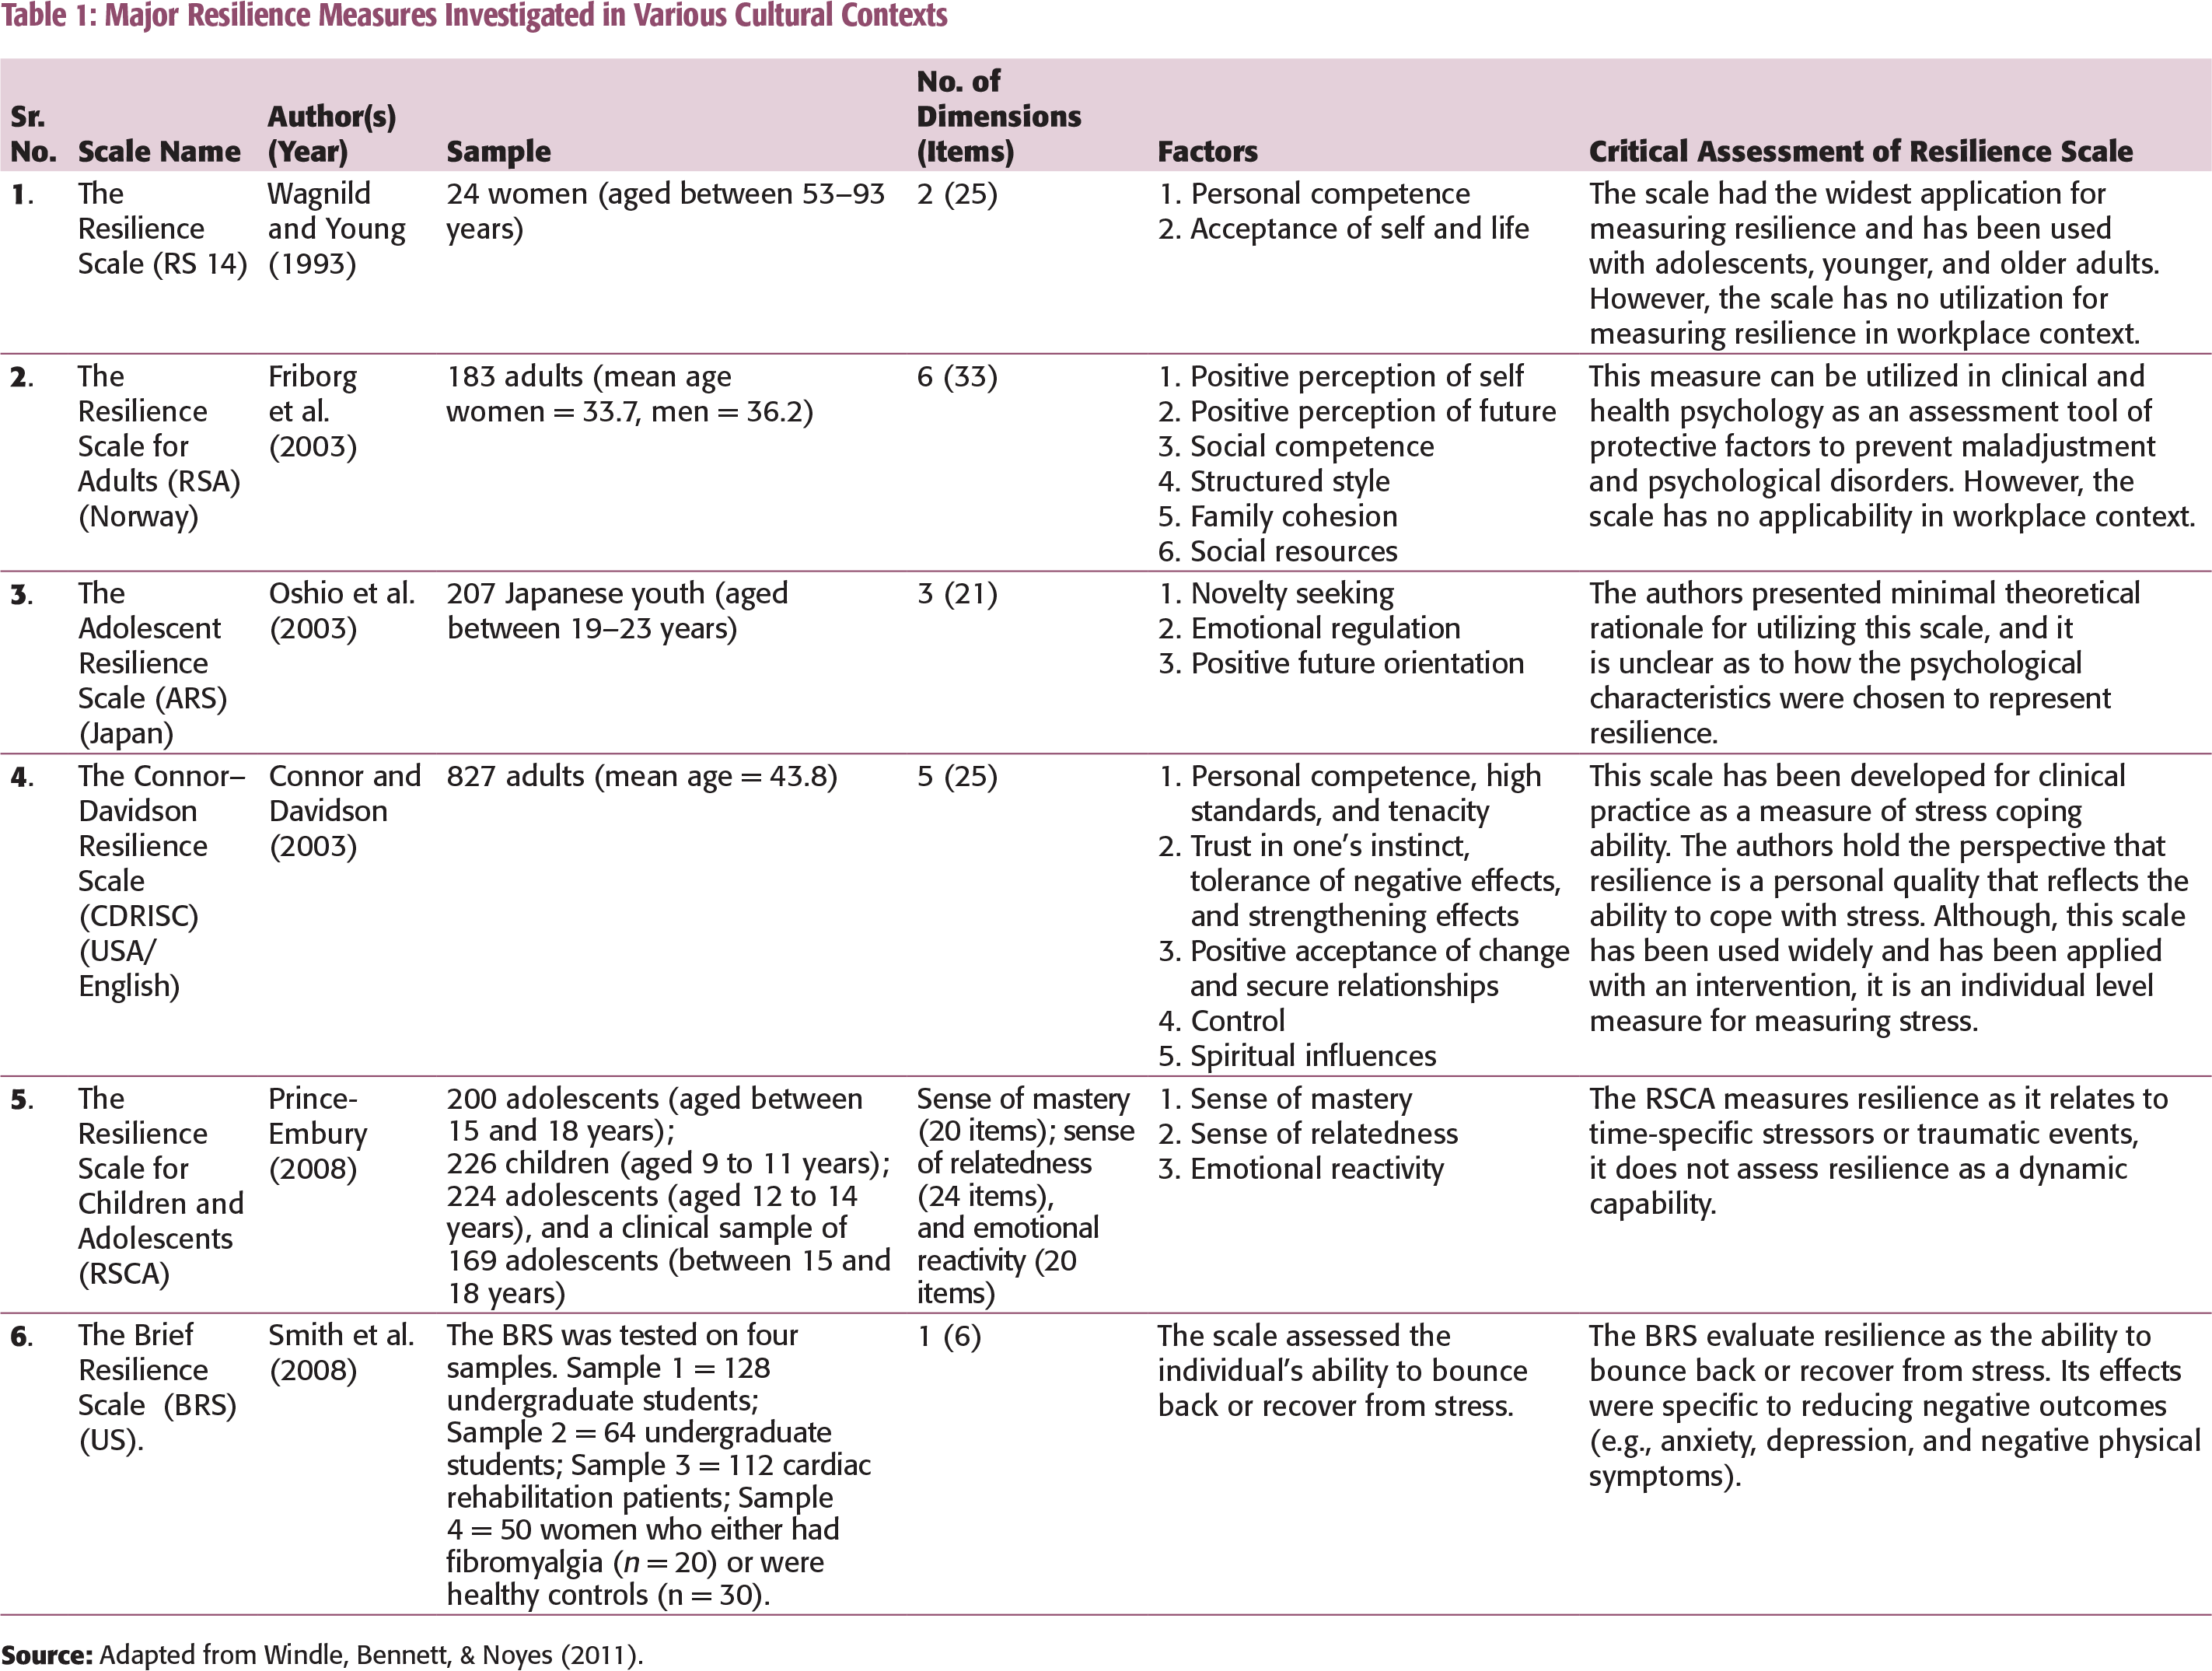
Table 1 provides a brief synopsis of each instrument, followed by the scale factors and their critical assessment focusing on the scope and utility of the scales. It is evident from Table 1 that previous resilience scales evaluated resilience as a general personality trait useful for managing stress and for assessing heath issues, rather than as a specific capacity which can be fostered through workplace interventions (Winwood et al., 2013). Addressing this crucial limitation, Winwood et al. (2013) concentrated on recognizing components of resilience that can be ‘intentionally and purposely reformed through appropriate skills, training and strategies and that are not restricted to fixed genetic and personality traits’. The authors emphasized on building the individual worker’s strengths, rather than focusing on coping strategies. According to them, the critical part of being resilient at work is not only managing the everyday stress but also rebounding and learning, and preparing for future challenges proactively. The ‘resilience at work’ scale (RAW) comprised 20 items which are related to seven components that are (a) living authentically (LA), (b) finding your calling (FYC), (c) maintaining perspective (MP), (d) managing stress (MS), (e) interacting cooperatively (IC), (f) staying healthy (SH), and (g) building networks (BN).
Winwood et al. (2013) reported that the RAW scale manifested a significant reliability (α = 0.84). The RAW scale was chosen for this study since: (a) the scale is a validated tool that specifically measures employee RAW, focusing on everyday workplace behaviours rather than on personality; (b) examines resilience as a capability, which can be fostered by offering assets and resources at workplace; (c) offers a concrete measurement tool for organizational programmes and interventions, where each scale dimension can be translated into specific initiatives in an applied setting; and (d) can be implemented across a multitude of organizations, job types, and employees. Therefore, the current study focuses on examining the psychometric properties of RAW scale to assess employees’ resilience in the workplace.
AIM OF THE STUDY
There are three central aims of this research. The first one is to evaluate the factorial structure of the RAW scale. The second is to examine the reliability, and investigate the convergent and discriminant validity of the scale. Third is to establish the nomological validity of the RAW scale. Given the intangible and relative novelty of the measure, the study tested the nomological validity of the RAW scale.
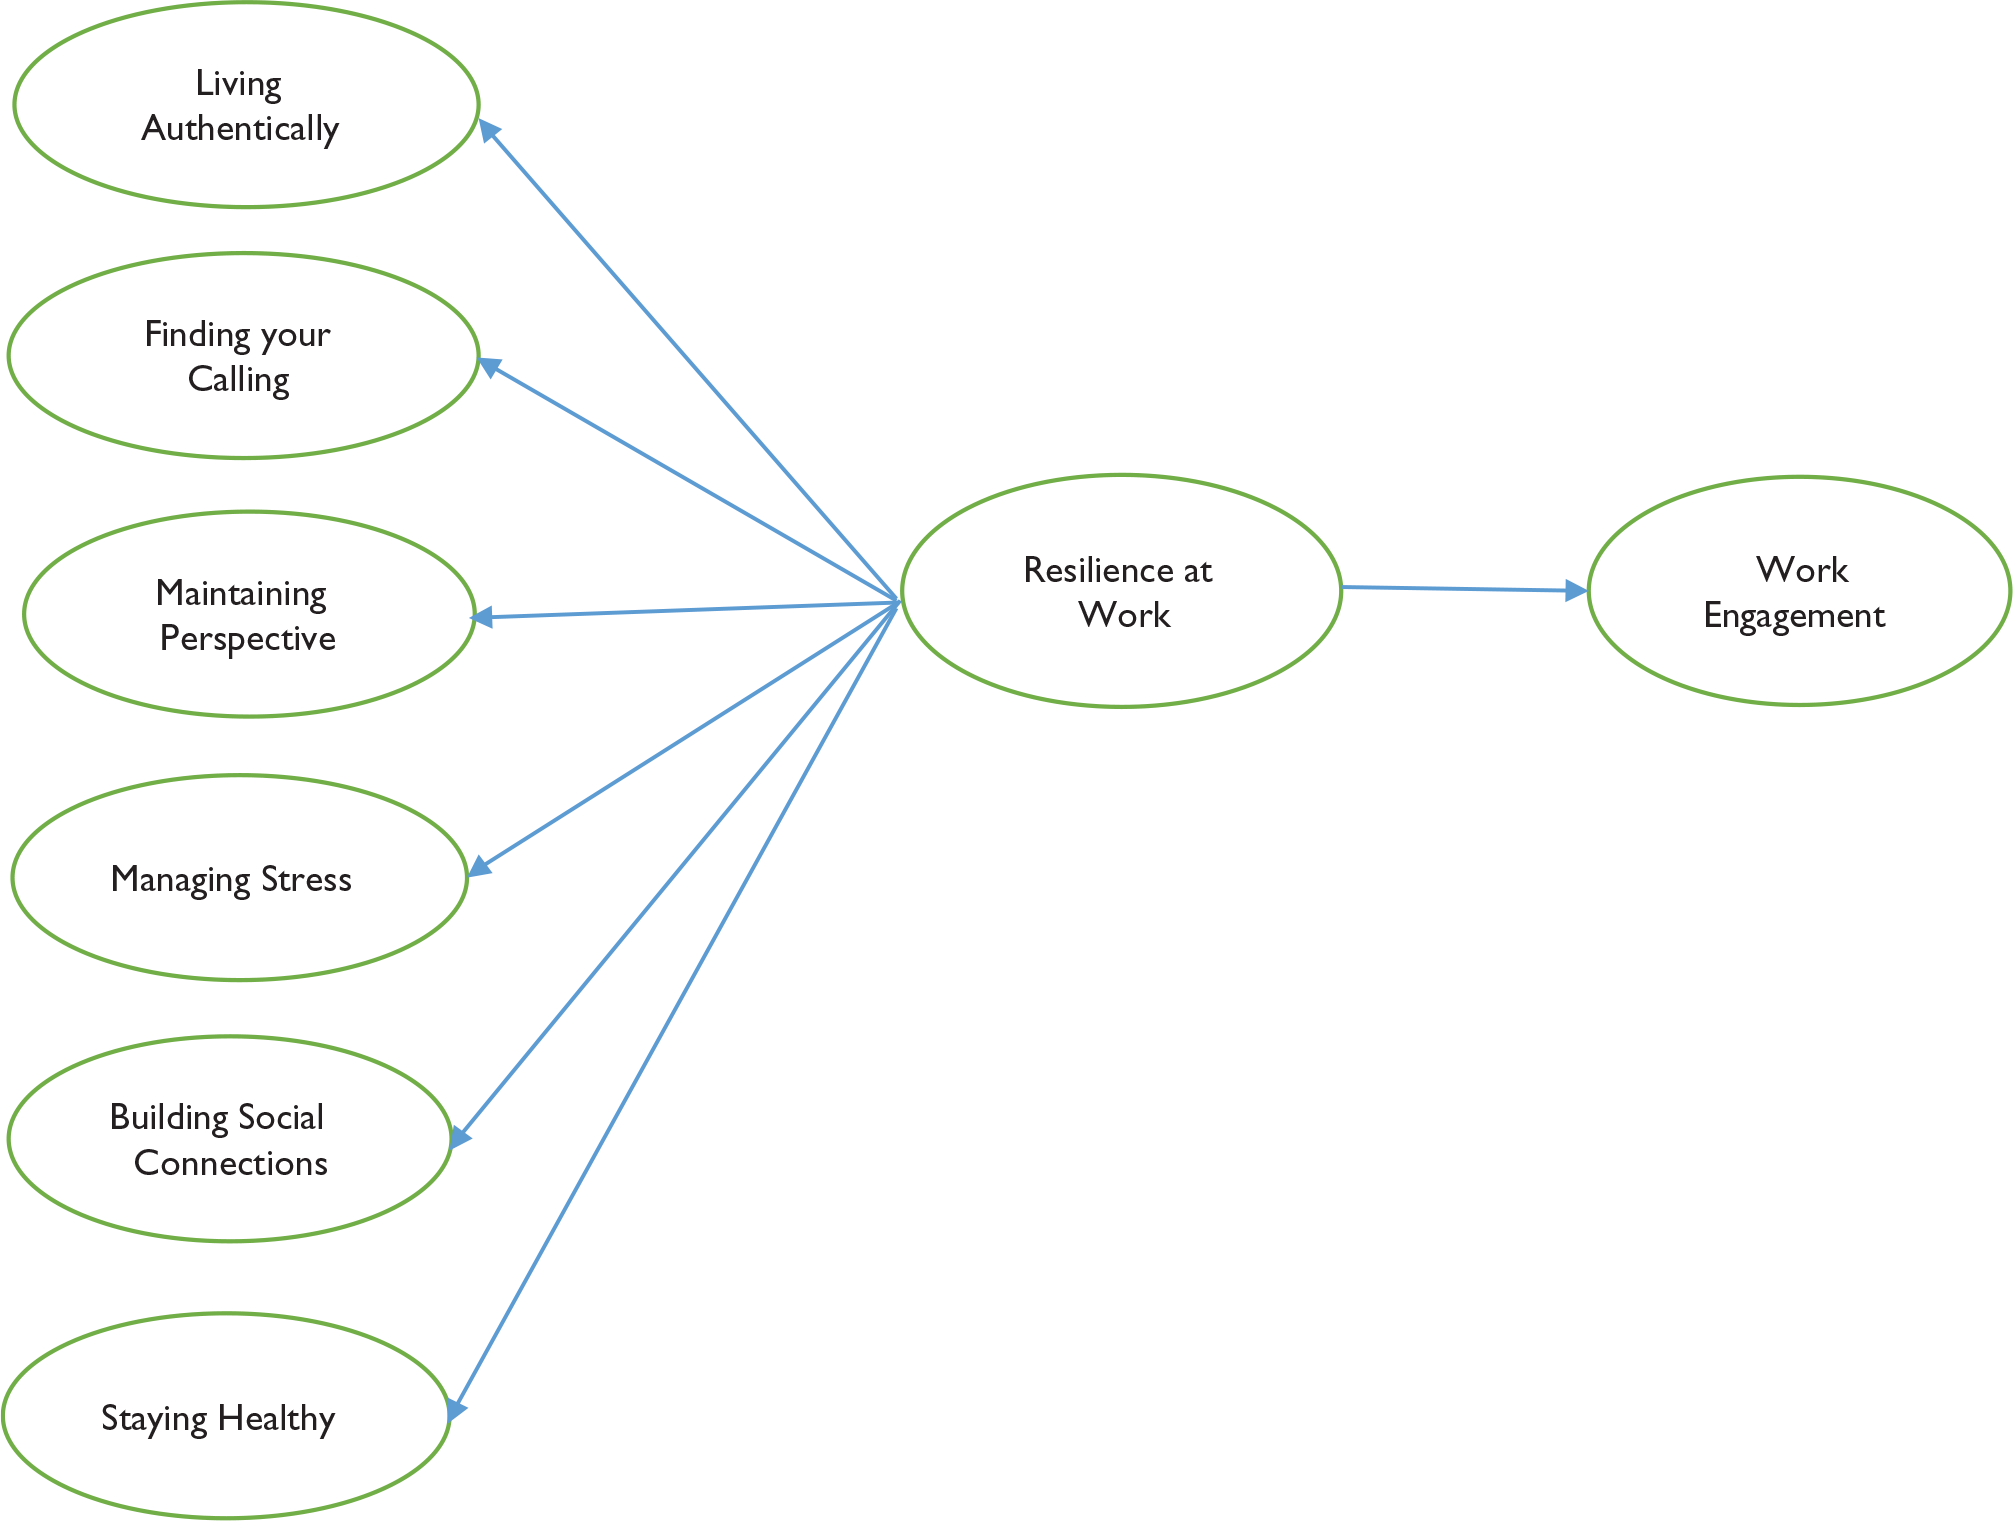
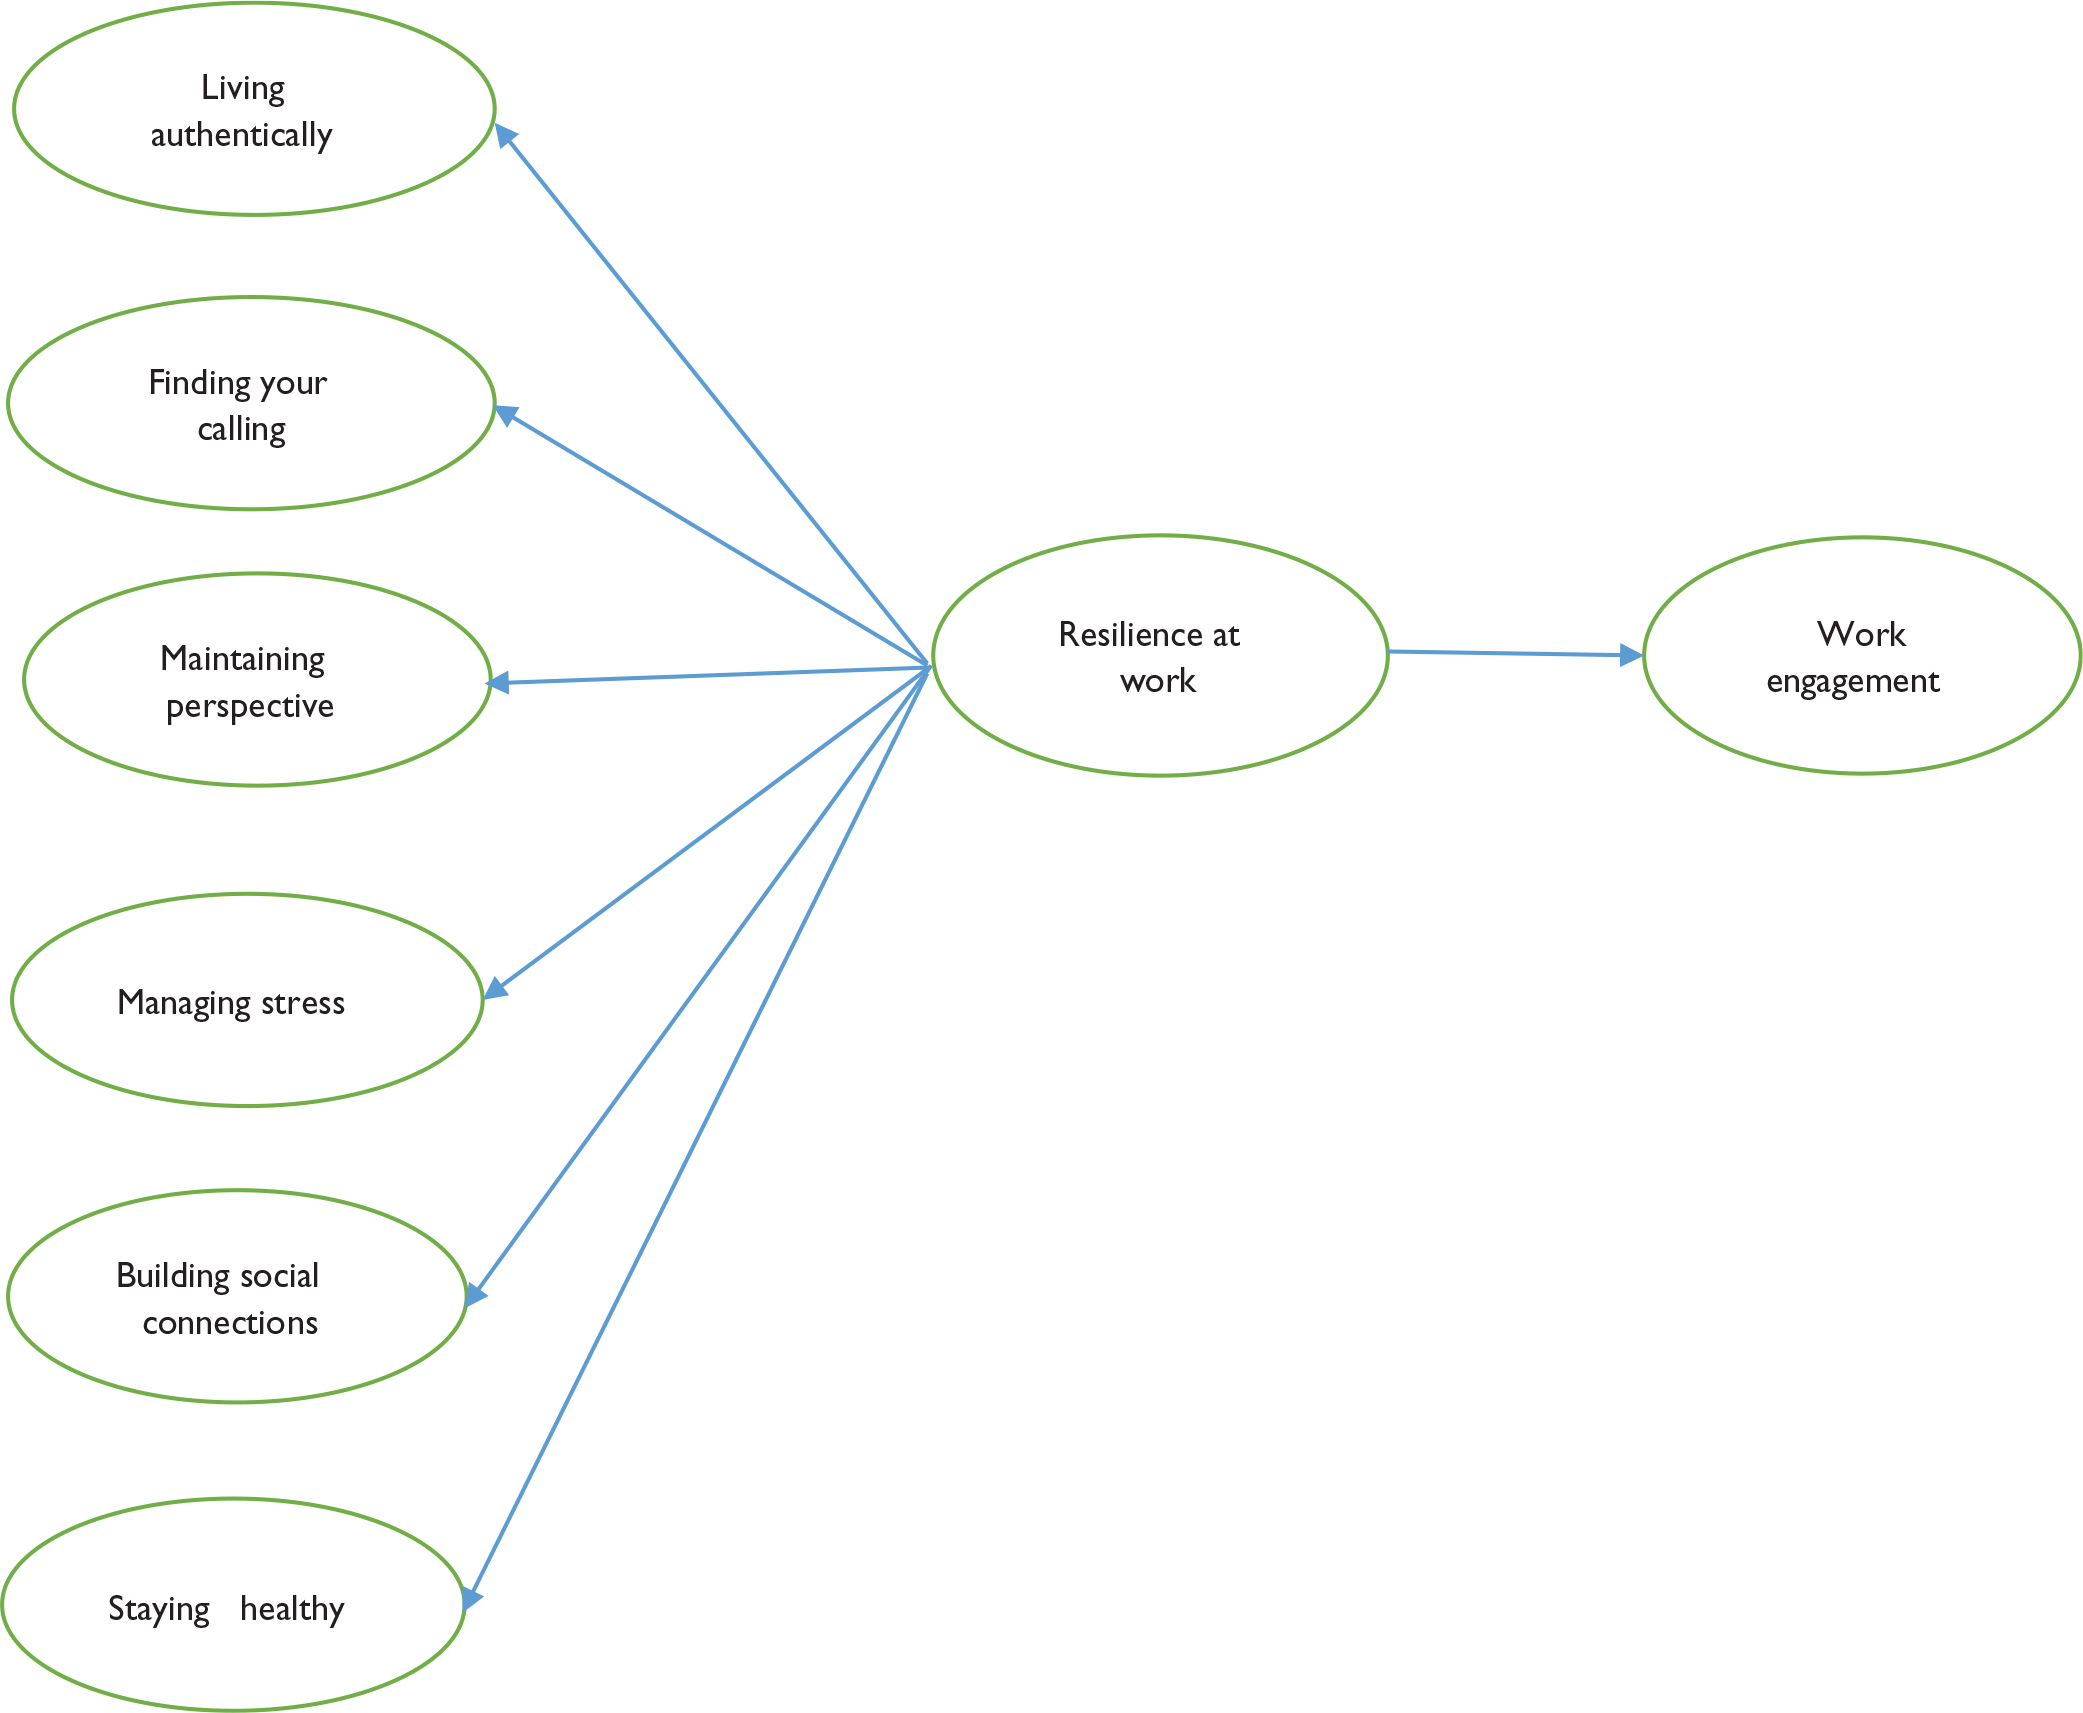
Previous research has identified a positive relationship between resilience and work engagement (Cooke et al., 2016; Hodliffe, 2014; Winwood et al., 2013), and therefore the study tested the relationship of resilience with work engagement as a consequent variable. Figure 1 shows the hypothesized model depicting the relationship between resilience and work engagement.
RESEARCH METHODOLOGY
Participants
Data were collected from employees working in IT organizations operating in the Indian National Capital Region (NCR). Professionals who work in the IT sector face numerous challenges at work including lengthy working hours, exigent client demands, gruelling targets, and skills obsolescence (Fu, 2010), which make these firms stressful for the employees (Bagga, 2013; Messersmith, 2007). High employee turnover signals that IT professionals have been experiencing the negative consequences brought about by such job demands (Fu, 2010). It is evident by the report of Asian and Gulf/Middle East Recruitment Company which claimed that around a third of workers in the Indian IT sector leave their jobs each year (cited in Bagga, 2013). A study by Willis Tower’s Watson titled Global Workforce Study (2015) claimed that 50 per cent Indian employees’ report excessive pressure at work. As a consequence, IT organizations are facing innumerable cases of employees psychological illness, lower commitment, enhanced anxiety levels, job dissatisfaction, absenteeism, and turnover rates, which poses serious concerns for the higher management. However, despite the challenges, these professionals are required to bounce back and bring innovative ideas to their clients on a routine basis. Thus, it becomes imperative for IT organizations and HR practitioners to focus on developing resilience among their employees and support them to face unprecedented changes (Malik & Garg, 2017). Clearly, there is a need for a standardized resilience measurement tool for measuring employee resilience working in a stressful environment.
Sample Procedure
The study sample was drawn between March 2016 and July 2016 using non-probability purposive sampling technique. Twenty Indian IT organizations in the NCR were identified and approached to participate in the study. Of these, 10 firms agreed to participate. The sample population represented the middle hierarchical level of the organization. A total of 1,000 employees (comprising of programmers, system analysts, and database administrators) were invited to participate in the study; out of which 800 agreed. To maintain confidentiality, the questionnaires were administered by the HR personnel of the firm. The responses were collected within two weeks in sealed envelopes. Out of 800 survey sheets, 700 were returned, giving a response rate of 87.5 per cent. Of these, 100 incomplete survey sheets were rejected, leaving 600 for further analysis. The data were then scrutinized for missing values and outliers, after which 54 survey sheets were rejected. Thus, the final sample of this study comprised 546 IT managers.
Hypothesized Model Demonstrating Relationship between Resilience at Work (RAW) and Work Engagement
The sample was composed of 65 per cent male and 35 per cent female employees. In terms of the age distribution, 16 per cent were aged less than 30 years, 69 per cent belongs to 30–39 years, and 15 per cent belongs to 40–49 years. In terms of work experience, 14 per cent had less than 5 years of work experience, 54 per cent had 5–10 years of work experience, and 32 per cent had more than 10 years of working experience. Of these, 15 per cent of the participants were unmarried while the rest were married. The sample comprised management (25%) and engineering graduates (75%).
Instruments
Resilience at Work
The study used the RAW scale developed by Winwood et al. (2013), containing 20 items, rated on a 7-point Likert scale. The scores in the scale range from 1 = strongly disagree to 7 = strongly agree. Sample items include ‘I am able to change my mood at work when I need to’, ‘The work that I do helps to fulfil my sense of purpose in life’, ‘I have developed some reliable ways to deal with the stress of challenging events at work’, etc.
Work Engagement
This variable was measured by a nine-item Utrecht Work Engagement Scale (UWES) developed by Schaufeli, Bakker, and Salanova (2006). The UWES-9 has three sub-dimensions of work engagement, namely, vigour, dedication, and absorption with three sub-items each: vigour (e.g., ‘At my work, I feel bursting with energy’), dedication (e.g., ‘I am enthusiastic about my job’), and absorption (e.g., ‘Get carried away when I am working’). The work engagement questionnaire was rated on a seven-point frequency-based scale (1 = never to 7 = always). Cronbach’s α value for the scale was 0.87.
DATA ANALYSIS
The collected data were analysed using statistical analysis software SPSS© (20th version) and AMOS© (20th version). The study analysis was divided in three stages. In the first stage, the exploratory factor analysis (EFA) was conducted through principal component analysis (PCA) using varimax rotation method for assessing the factorial structure of the scale. The Cronbach’s alpha coefficients were calculated for determining the scale reliability. In the next stage, the correlation coefficients were calculated to assess the correlations among the scale components. Furthermore, confirmatory factor analysis (CFA) was employed to confirm the dimensionality of the scale, followed by calculating the convergent and discriminant validity. As a part of the final stage, a structural equation modeling (SEM) was developed to evaluate the nomological validity of RAW scale.
RESULTS
Exploratory Factor Analysis
An EFA was employed to inspect the patterns or components underlying the RAW scale. A total of 20 items representing seven original components of RAW scale were subjected to PCA using varimax rotation to extract the factors of the scale. Before conducting the factor analysis, the Kaiser-Meyer-Olkin (KMO) value was confirmed, which was found to be 0.74, thus surpassing the threshold value of 0.60 (Kaiser & Rice, 1974). Also, the Bartlett’s Test of Sphericity (Bartlett, 1954) was found to be significant (p = 0.000).
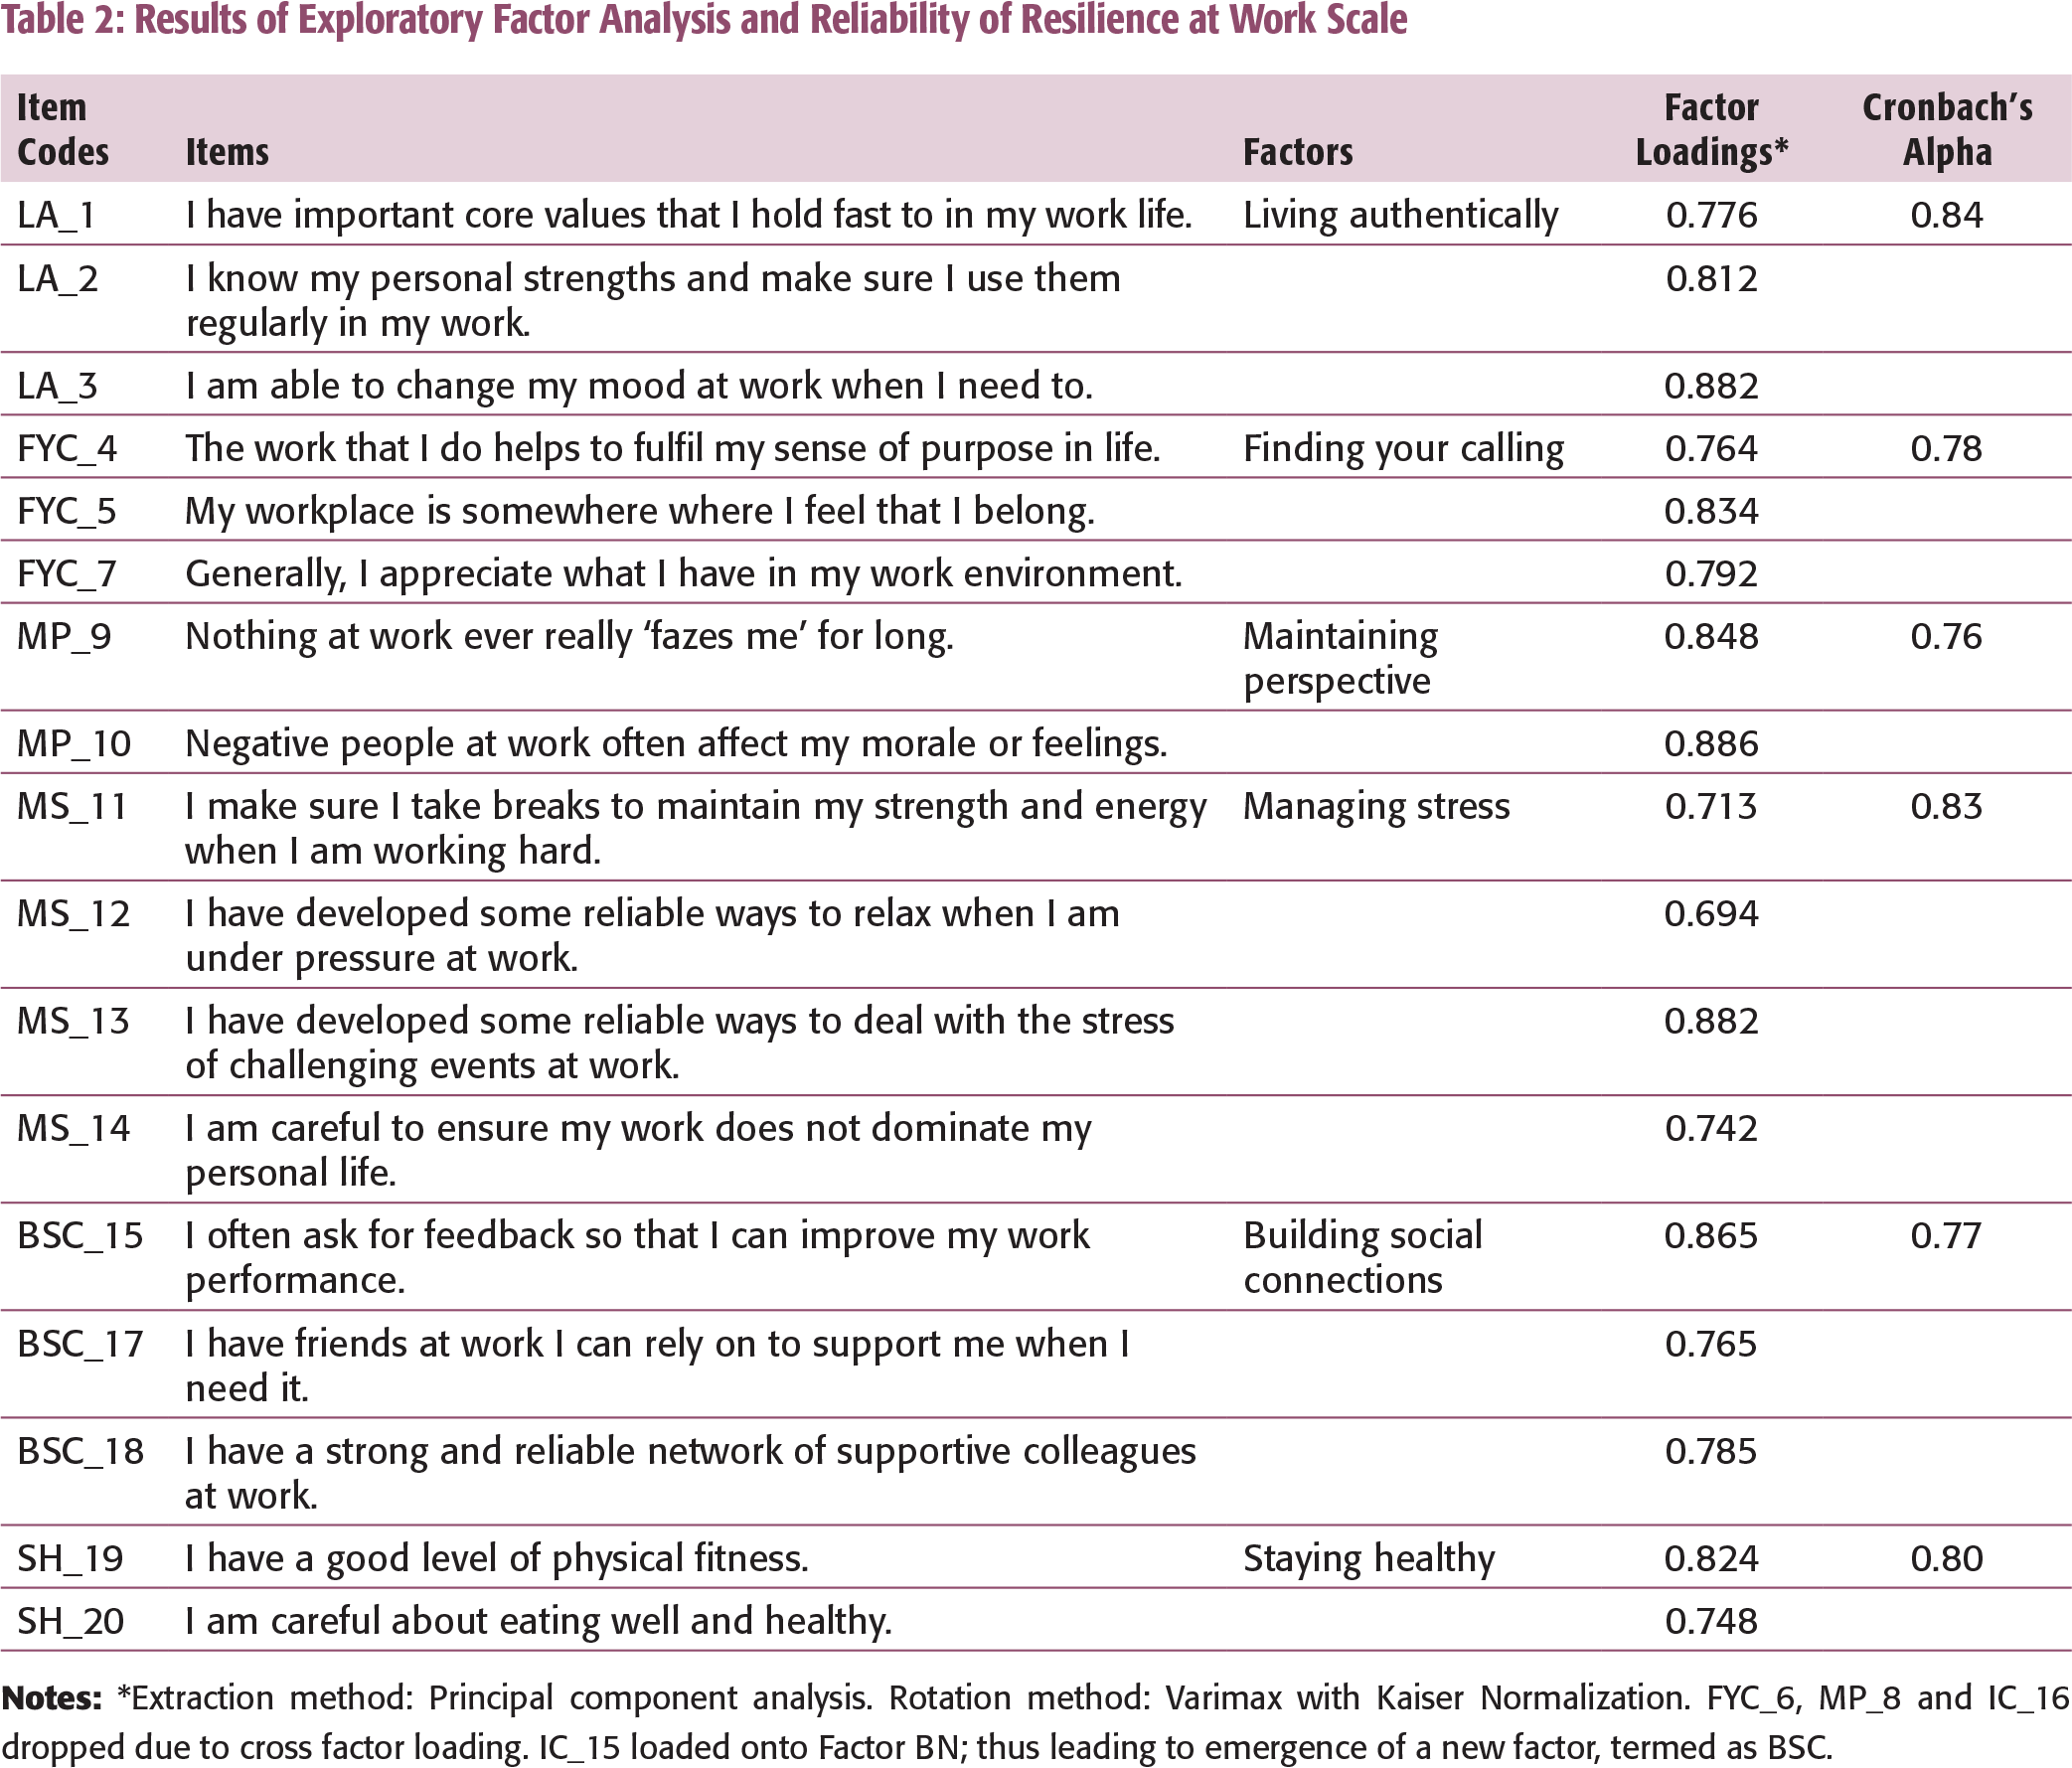
Principal components analysis (with varimax rotation) resulted in a six-factor structure for RAW scale and explained 76.93 per cent of the variance. Throughout the progression of EFA, items that did not load accurately on any factor (< 0.40) or depicted cross loadings on more than one factor with a difference of less than 0.10 with other factors (Field, 2013) were dropped, retaining only 17 items. The RAW scale demonstrated the similar factor components as proposed by Winwood et al. (2013) in the Indian context. The only key difference was the grouping of the items from the IC and BN components into one factor. Item number 1 to 3 loaded on Factor 1 and corresponds to the original RAW scale of LA. Factor 1 showed an eigenvalue of 5.45 and explained 27.25 per cent of the variance. Also, all three items were retained for the LA component. Factor 2 corresponds with the FYC component and exhibited an eigenvalue of 3.28 and explicated 16.41 per cent of the variance. One item from Factor 2 (‘the work that I do fits well with my personal values and beliefs’) was omitted from analysis due to cross loading. Factor 3 MP showed an eigenvalue of 2.39 and explicated 11.95 per cent of the variance. It involved two of the three items from MP component. One item from Factor 3 (‘when things go wrong at work it often affect other areas of my life’) was omitted from the analysis due to insignificant factor loading (0.10).
Factor 4 (MS) exhibited an eigenvalue of 1.81, and explained 9.09 per cent of the variance, and comprised all items from the MS component. One of the items of Factor 5 (IC) was dropped due to the cross loading (‘I believe in giving help to my work colleagues, as well as asking for it’). Furthermore, the second item of Factor 5 (IC) (‘I often ask for feedback so that I can improve my work performance’) loaded with items of Factor 7 (BN). Thus, Factor 5 (IC) and Factor 7 (BN) were clubbed together to form a new factor. The new Factor 5 was termed as building social connections (BSC), since the items loading on this new factor were related to making connections with colleagues and asking for support and feedback. The new emerged Factor 5 BSC included three items (one item of IC clubbed with two items of BN and showed an eigenvalue of 1.36 and explained 6.83 per cent of the variance. Furthermore, Factor 6 (SH) exhibited an eigenvalue of 1.07 and explained 5.39 per cent of the variance, and embodied all items from the SH component. The results of the EFA are shown in Table 2.
Reliability of the Scale
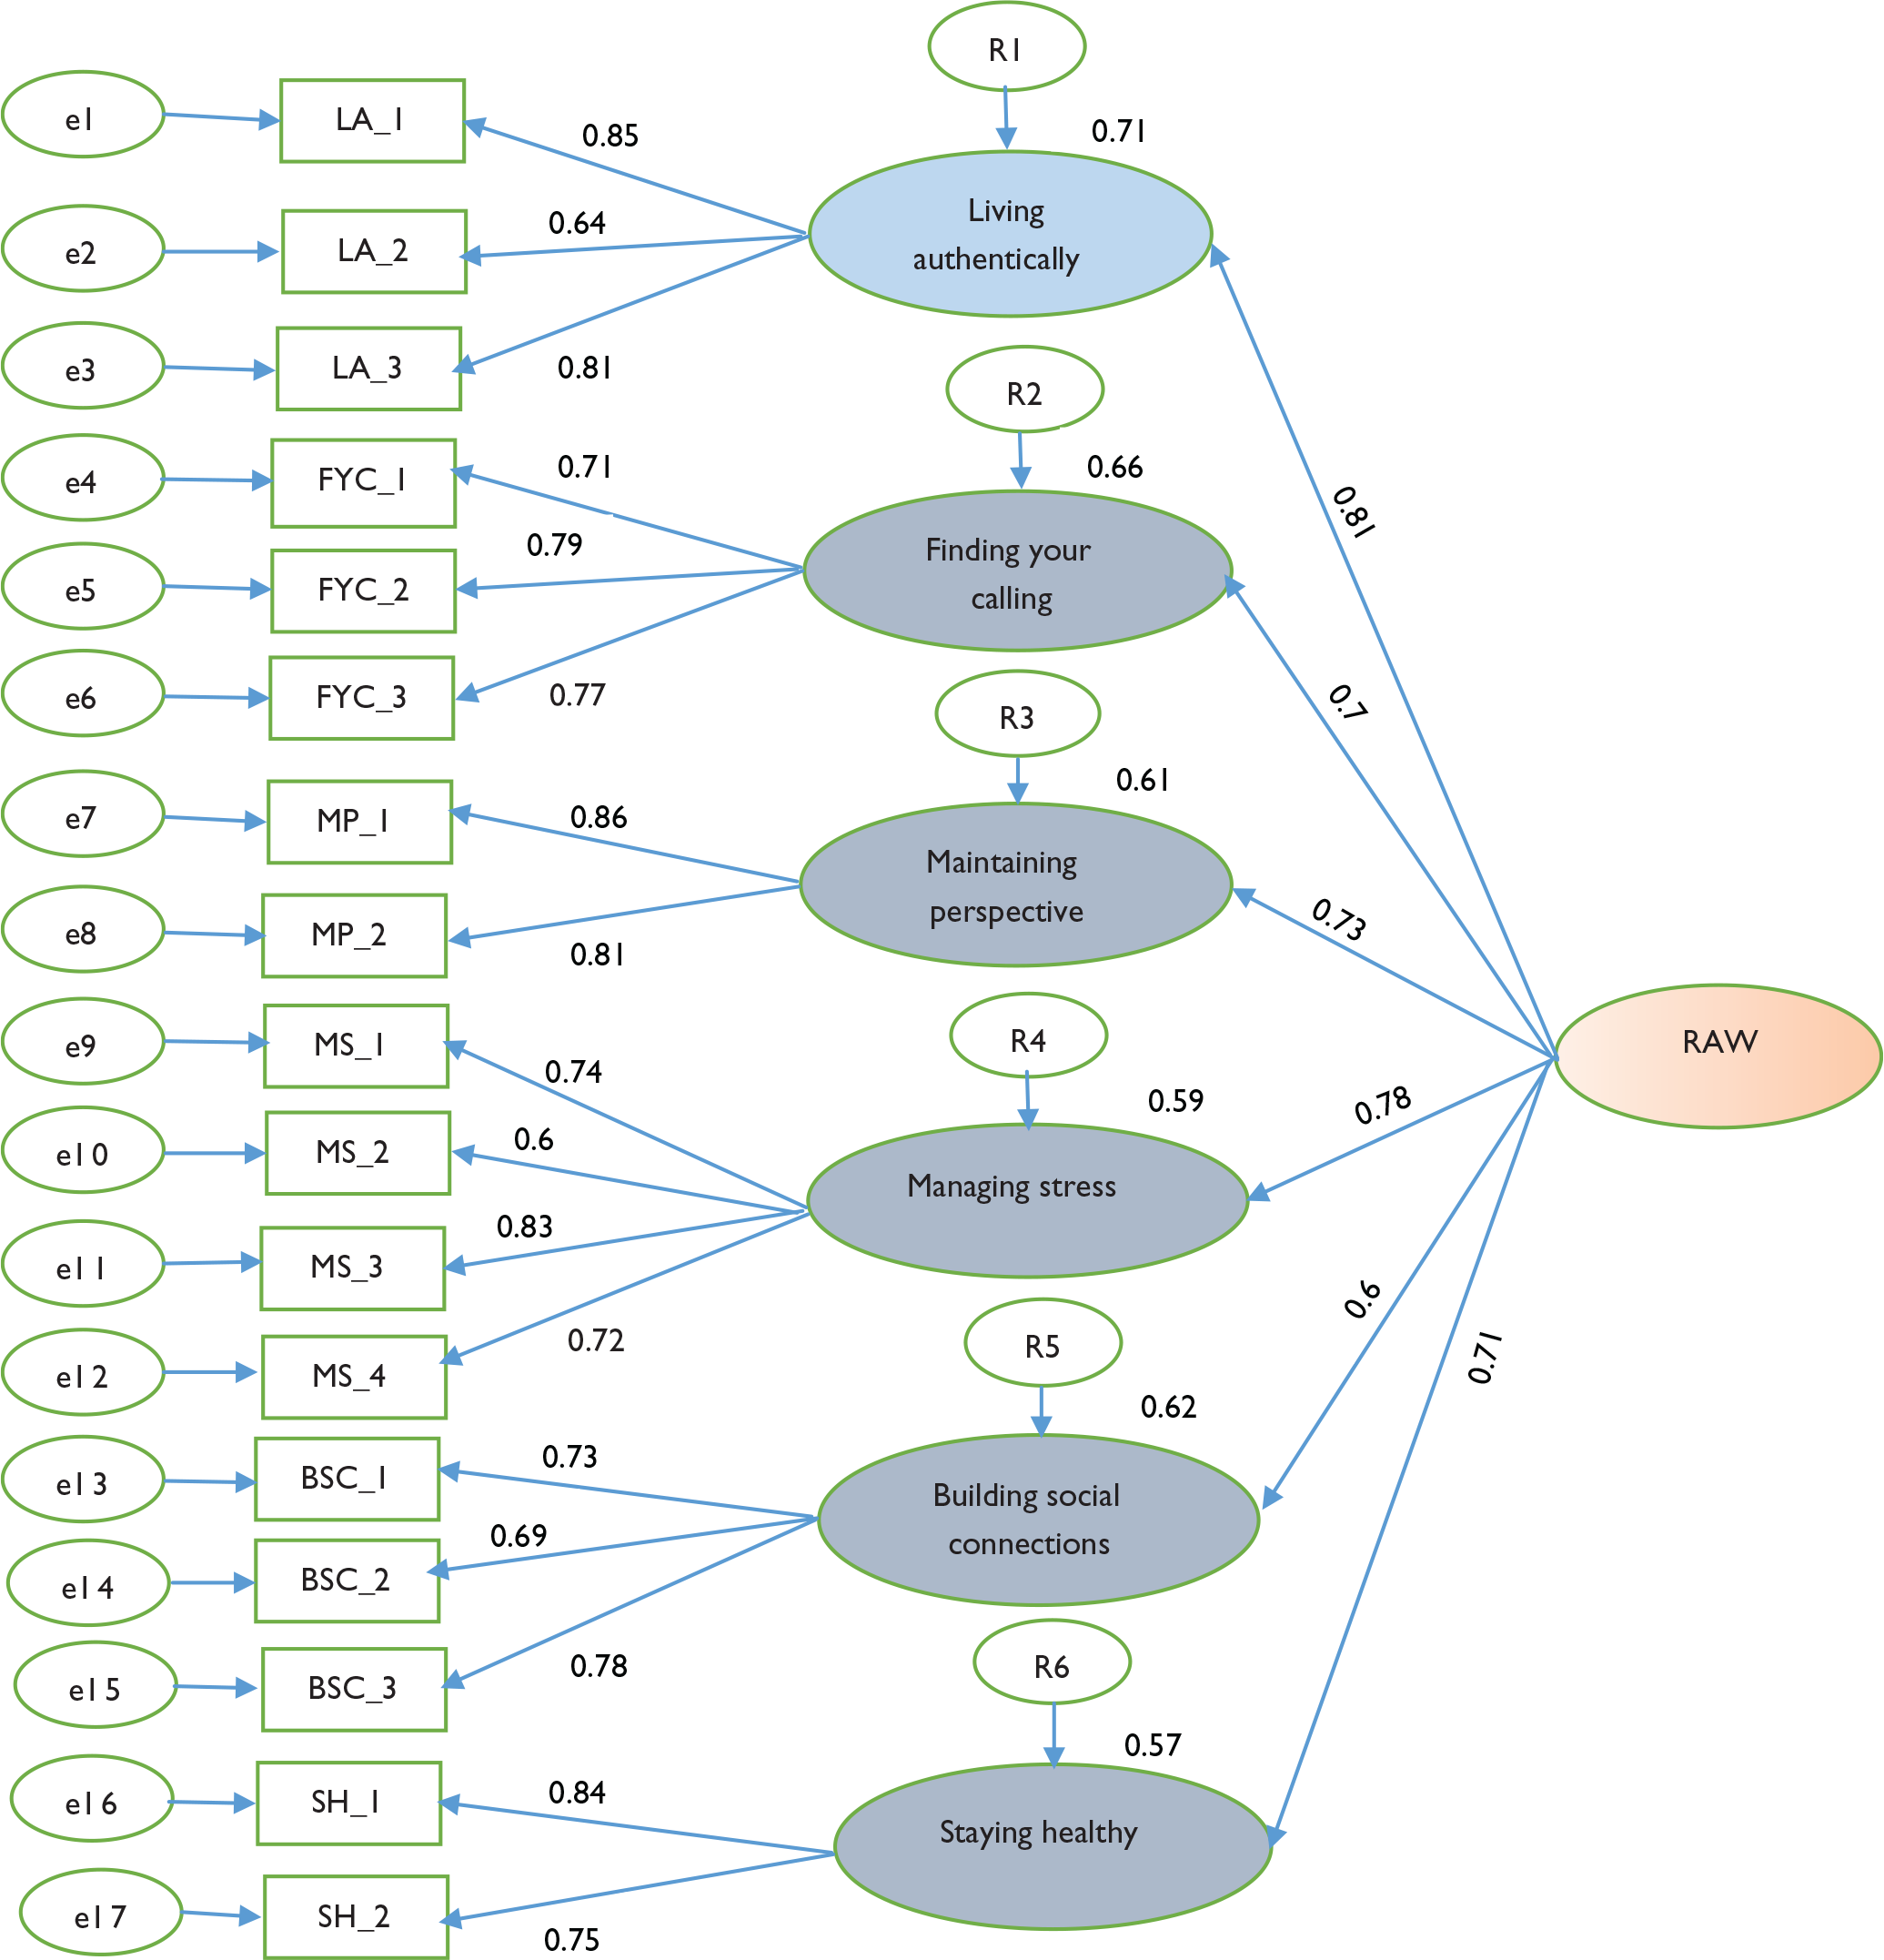
The reliability analysis of refined RAW scale with 17 items and 6 factors was undertaken to verify how strongly the attributes are associated with each other (Hair, Black, Babin, & Anderson, 2010). The reliability values of the scale components are delineated in Table 2. The Cronbach’s alpha values were evaluated to determine the internal consistency reliability of the RAW scale and its components. The reliability of the RAW scale (17 items) was α = 0.81. Furthermore, the internal cons-istency of the six components of the scales was found to be significant, representing Cronbach’s alpha values: α = 0.84 (Component 1), α = 0.78 (Component 2), α = 0.76 (Component 3), α = 0.83 (Component 4), α = 0.77 (Component 5), and α = 0.80 (Component 6). The composite reliability estimates of the scale components exceeded the threshold value of 0.70 (Fornell & Larcker, 1981), indicating that the scale items were internally consistent and reliable.
Results of Exploratory Factor Analysis and Reliability of Resilience at Work Scale
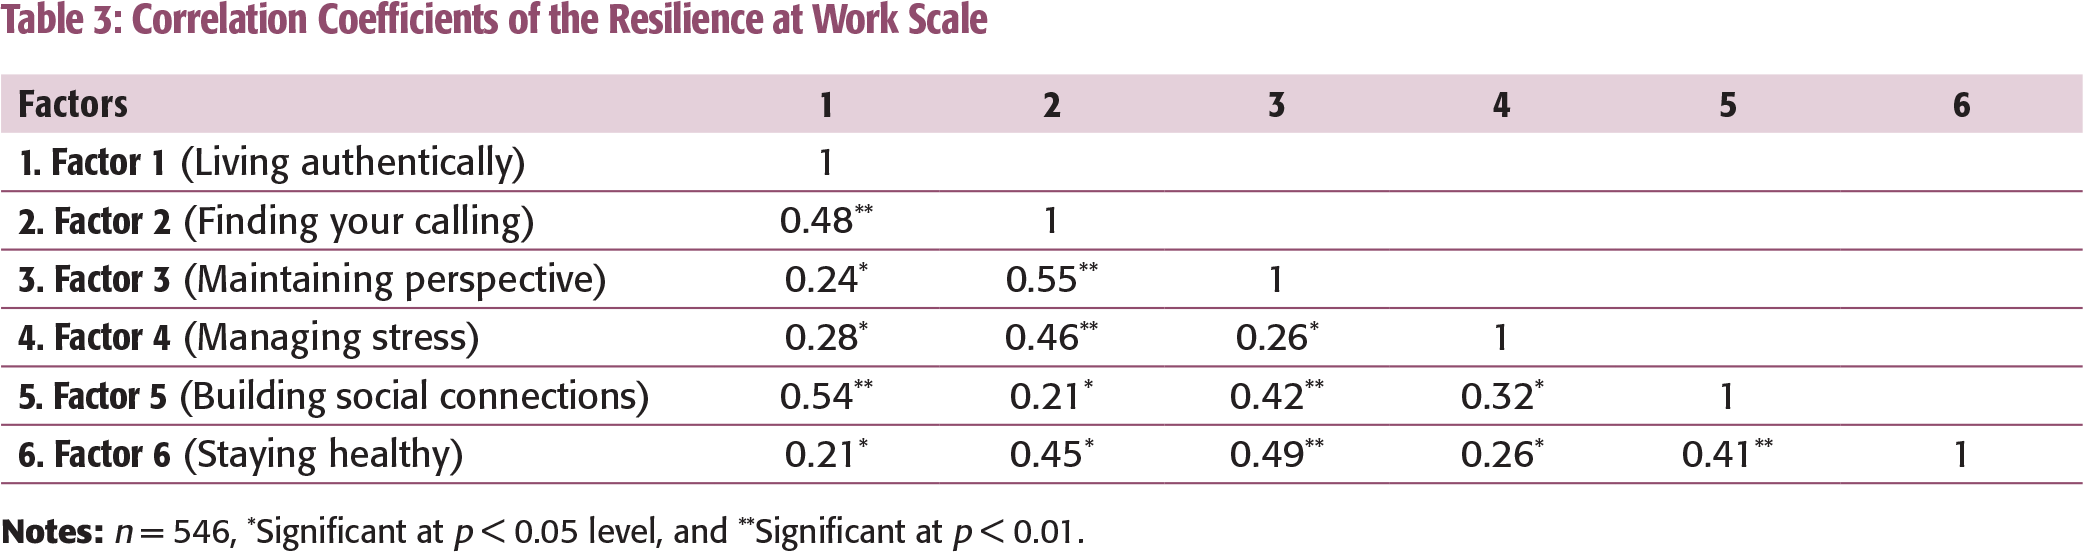
Furthermore, the correlation coefficients were calculated to examine the relationship among the six components of RAW scale, which are shown in Table 3. The correlation values revealed significant low to moderate correlations between the subscales, indicating adequate reliability. The study results showed positive low correlations between: Components 1 and 3 (r = 0.24, p < 0.05); Components 1 and 4 (r = 0.28, p < 0.05); Components 1 and 6 (r = 0.21, p < 0.05); Components 3 and 4 (r = 0.26, p < 0.05); Components 2 and 5 (r = 0.21, p < 0.05); Components 4 and 6 (r = 0.26, p < 0.05), and Components 4 and 5 (r = 0.32, p < 0.05). Moreover, results reflected significant moderate correlations for Components 1 and 2 (r = 0.48, p < 0.01), Components 1 and 5 (r = 0.54, p < 0.01), Components 2 and 3 (r = 0.55, p < 0.01), Components 2 and 4 (r = 0.46, p < 0.01), and for Components 2 and 6 (r = 0.45, p < 0.01).
Correlation Coefficients of the Resilience at Work Scale
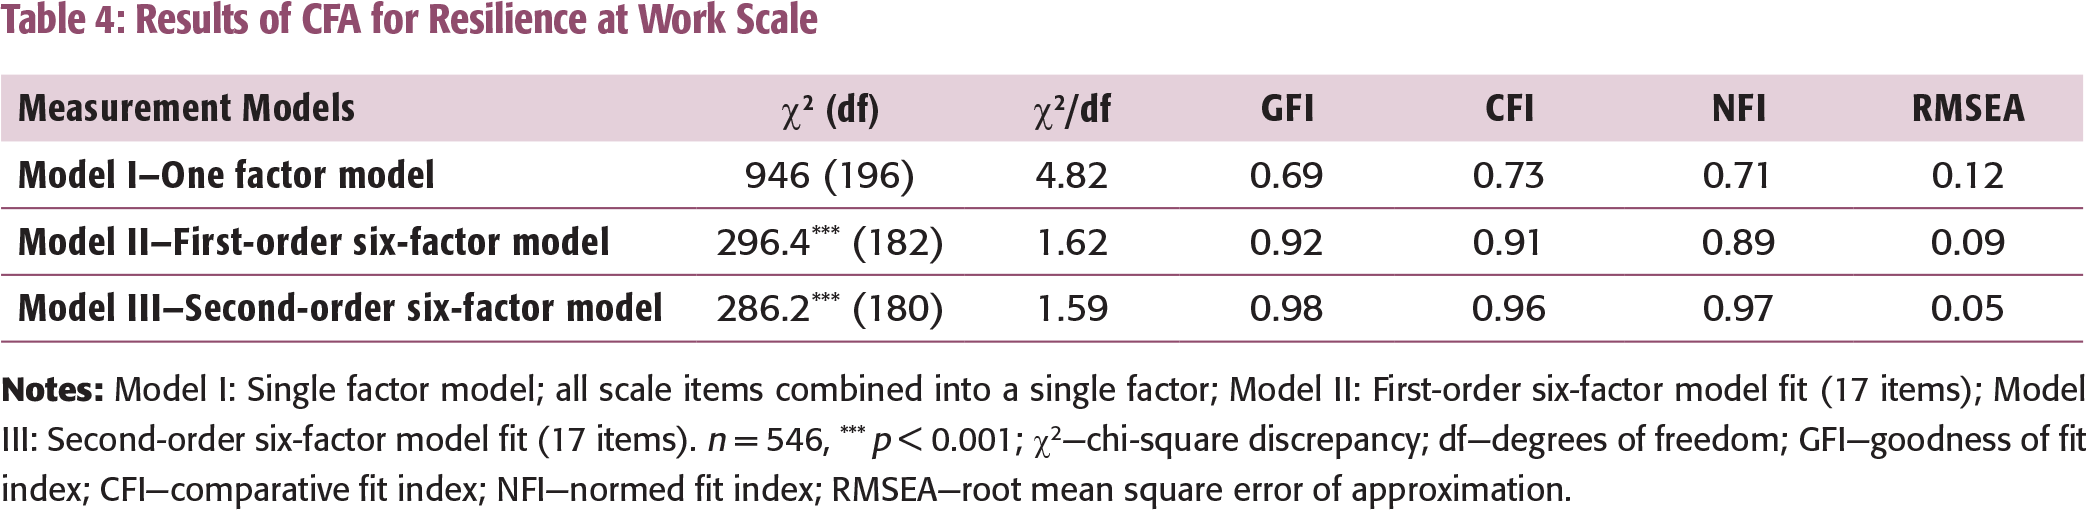
Results of CFA for Resilience at Work Scale
Confirmatory Factor Analysis
A CFA was utilized to confirm the model fit of the scale. With an aim to evaluate the model fit, three models were tested: the one-factor model (Model I) comprising of all the scale items on a single model; the first-order six-factor model (Model II), and second-order six-factor model of RAW scale (Model III). Following established recommendations in the literature (Hair et al., 2010); we calculated five fit indices to determine the best model fit of the data: χ2/df, goodness of fit index (GFI), comparative fit index (CFI), normed fit index (NFI), and root mean square error of approximation (RMSEA). The one factor model (Model I) which involved all the seven factors in a single model exhibited poor model fit (χ2 = 946; df = 196; Normed χ2 = 4.82; GFI = 0.69; CFI = 0.73; NFI = 0.71; and RMSEA = 0.12), which provided an evidence that employee resilience scale is not a uni-dimensional measure (Table 4).
The results of model fit indices of Model III supported that RAW scale is a second-order construct having a strong association with the first-order factors, thereby providing the evidence that RAW scale is a reliable higher order measure (Figure 2). Also, the χ2 difference value between first-order and second-order models indicated that second-order model was statistically superior to the first-order model, Δχ2 (2) = 10.20, p < 0.001.
Convergent and Discriminant Validity
The scale items were further analysed in terms of convergent and discriminant validity (Anderson & Gerbing, 1988; Fornell & Larcker, 1981; Hair et al., 2010). To evaluate the convergent validity, this study utilized three standard criteria which are standard factor loadings, composite reliability, and average variance extracted (AVE) (Anderson & Gerbing, 1988). High composite reliability values and significant factor loadings indicate convergent validity of the scale (Cable & DeRue, 2002). Furthermore, all the standardized factor loadings were found to be above the threshold value of 0.60, reflecting that all scale items effectively measured their corresponding constructs (Anderson & Gerbing, 1988). The minimum acceptable level for the AVE is 0.50 (Fornell & Larcker, 1981) and the study value (0.634) demonstrates that the scale met the accepted threshold value criteria. Thus, the scale met the criteria for convergent validity.
Furthermore, this study used the AVE test to gauge the discriminant validity of the scale. According to Fornell and Larcker (1981), AVE from the constructs must be larger than the shared variance that is a squared correlation among constructs. The results indicated strong evidence of discriminant validity of the RAW scale (Fornell & Larcker 1981; Kline et al., 2012).
Second-order Six-factor Measurement Model of RAW Scale
Nomological Validity
To evaluate the nomological validity of the RAW scale, this study tested the relationship between RAW and work engagement. Nomological validity is based on evidence that measures of a construct exhibit relationships with measures of other constructs in a way that is consistent with a priori expectations about how the construct should affect the predicted variable (Peter, 1981). If the results are in accordance with the prior anticipated relationships between the constructs, then it is presumed that the measures of those constructs exhibit a definite degree of nomological validity (Bagozzi, 1980; Peter, 1981).
The current study embedded RAW into a nomological network with work engagement as a consequent variable. The hypothesized relationship in the model was tested using SEM. The developed model showed an excellent model fit, as indicated by the values of fit indices (i.e., GFI = 0.98; NFI = 0.96; CFI = 0.97; RMSEA = 0.05). The model shown in Figure 3 delineates the standardized path coefficient between the resilience and work engagement (β = 0.38; p < 0.05). The results showed that the RAW demonstrated a significant relationship with work engagement as depicted by previous studies (Hodliffe, 2014; Winwood et al., 2013). Therefore, the study found a strong support for the nomological validity of RAW scale.
Hypothesized Model Demonstrating Relationship between Resilience at Work (RAW) and Work Engagement (*p < 0.05)
DISCUSSION
The current research examined the psychometric properties of RAW scale and explored whether RAW scale (Winwood et al., 2013) can be applied in an Indian organizational. The RAW scale shows promising validity and reliability, which confirms the suitability of the scale in an Indian workplace setting. Also, given that resilience is found to have a significant relationship with work engagement, it further strengthens the fact that development of resilience among employees should be considered valuable. Recently, Gattis (2017) utilized the RAW scale to explore how resilience can act as an effective coping strategy for a professional women’s overall well-being, when exposed to workplace bullying within the National Capital Region (NCR) of Washington, DC.
The findings of the current study support the factor structure of the RAW scale, as recommended by Winwood et al. (2013). The key difference was the alliance of the items from the IC and BN components onto one factor, resulting in a new factor, that is, BSC. In their research, Winwood et al. (2013) also acknowledged the sub-optimal reliability for LA and BN components (α = 0.68), and reported that both the components showed minimal construct distinction with other scale components. According to Winwood et al. (2013), IC component refers to ‘seeking feedback and offering support to others’, while congruently, the BN component also reflect ‘building and preserving personal support networks’. Thus, it can be posited that if an individual readily seeks feedback and support, this in turn enables the person to offer support to others. This lack of construct distinction might be accounted for the overlap between the two components. This might have resulted in the interaction effect and thus the items of both the components were actually measuring one latent variable. However, future research is required to establish the generalizability of this finding.
The study findings found support from the study of Turner, Scott-Young, and Holdsworth (2016), who also reported the six-factor structure of RAW scale in an Australian university. They developed and validated a measure of student resilience, that is, Resilience at University (RAU) measure. The six-factor structure of the RAU measure was found to be congruent with the seven-factor structure of the RAW scale. Their study demonstrated promising validity and reliability of RAW scale for measuring student resilience. However, they reported that the major difference was the grouping of the items from the IC and LA components onto a single factor.
Echoing the similar finding, Holdsworth, Turner, and Scott-Young (2017) reported that three factors of RAW scale—‘maintaining perspective, staying healthy, and developing support networks’—were identified as key attributes linked to students’ resilience in an Australian university. Their findings indicated that the component of BN was conflated with the component of IC. This further support the six-factor structure of RAW scale established in this study.
The present study results demonstrated promising convergent and divergent validity of RAW scale in an Indian workplace context, with the exception of two components (IC and BN). This study focused on Indian IT employees and how they characterize their level of resilience and approach work. Future studies are required to gauge the psychometric properties of this scale. Also, the future studies could examine the validity of the scale with a different sample of employees working in varied sectors to authenticate the underlying components of the RAW scale.
The findings of the study offer significant implications for researchers as well as HR practitioners. In the current tempestuous and incessantly changing working environment, workplace stress can affect the performance of the workforce and could result in adverse organizational consequences including high employee turnover. Thus, it becomes imperative that organizations understand the significance of resilience in the workplace. The results of the study advocate that developing resilience among employees, might in turn aid in building a highly engaged workforce. Improving individual resilience is one area where managers can play a vital role in their employees’ development. By understanding primary resilience factors and using the RAW scale, managers can design and implement specific interventions to foster resilience. The RAW scale can aid employees’ working in a demanding and competitive environment to adapt effectively to challenging work roles and situations.
Supporting this fact, Mallak and Yildiz (2016) also advocated that improved workplace resilience could result in expected outcomes such as reduced stress, higher quality decision-making, decreased use of sick days, and higher job satisfaction. Thus, future research on resilience and outcomes is required to verify the extent and conditions in which these outcomes exist. Future studies could investigate the antecedents and consequences of resilience and explore the underlying mechanisms of how higher resilience among employees might lead to enhanced mental health and subjective well-being, and performance outcomes.
Resonating the aforementioned fact, Menéndez Blanco and Montes Botella (2016) argued that in today’s globally competitive and knowledge-based economies, managers must focus on developing internal capabilities aimed at strengthening resilience. According to the authors, resilience is not merely survival in response to adversity but rather an anticipatory strategy for progressing and recognizing the need to take both proactive and reactive measures for future development. The authors also proposed that RAW scale is a more realistic and practical measure affecting workplace resilience and suggested that the scale dimensions could be useful indicators to build a resilience balance scorecard. Mallak and Yildiz (2016) also argued that there is a dire need for developing a standardized instrument in workplace setting to measure resilience of employees.
The current research examined the nomological validity of RAW scale by evaluating its relationship with work engagement. The study found that resilience was significantly related to work engagement (β = 0.38; p < 0.05). The standardized path coefficient between the variables is shown in Figure 3, which indicates a significant relationship between the variables. This model identifies, as reported by prior scholars, that resilience held a significant relationship with work engagement. Thus, the study results accord with the previous research findings, which reported that resilience significantly influence work engagement across varied organizational contexts in different countries (e.g., Cooke et al., 2016; Hodliffe, 2014; Winwood et al., 2013). Thus, the study results advocate that high resilience among employees can lead to enhanced work engagement.
CONCLUSION AND LIMITATIONS
The current research contributes to the validation of RAW instrument for measuring employee resilience in an Indian organization. Validation of measures that can effectively measure individual resilience in the workplace is vital, since this can help in designing interventions to increase resilience among employees.
Resilience research, especially the measurement of resilience dimensions, is found predominantly in the psychological, medical, and nursing professions and their associated journals. However, to date, there are minimal studies, which utilized RAW scale to measure resilience among employees in varying organizational contexts. Thus, future work is required to assess the validity of RAW scale in sectors other than IT organizations. Future research could focus on investigating the psychometric properties of RAW scale for testing and validating its reliability and validity, which can differ across countries. Also, future studies could explore the role of employee resilience in augmenting workplace outcomes. Finally, researchers could investigate whether the measurement precision of the RAW scale is the same across sample groups such as gender, age, and type of work.
About 65 per cent of respondents in this study comprised male employees and thus the study results cannot be generalized to the broader workforce. To overcome this limitation, the future studies might consider testing the RAW scale using an extensive sample of employees working in multiple organizational sectors in different countries. This will further contribute to the validation of the measure and its pragmatic generalizability for the wider organizational settings across different countries. Also, further research is required to investigate the suitability of the RAW scale for young and adult working populations. Furthermore, studies can contribute to validate the factor structure of the RAW scale and examine whether it confirms the proposed six-factor structure of the scale as specified in this study.