
Abstract

Keywords
INTRODUCTION1
The idea for this colloquium emerged out of a panel discussion organized on inclusive growth by Prof. Rama Mohana R. Turaga at the 43rd Annual Conference of Partnership in International Management held at the Indian Institute of Management Ahmedabad during 10–12 October, 2016. We would like to thank the organizers and participants of this conference for their inspiration and participation.
The idea for this colloquium emerged out of a panel discussion organized on inclusive growth by Prof. Rama Mohana R. Turaga at the 43rd Annual Conference of Partnership in International Management held at the Indian Institute of Management Ahmedabad during 10–12 October, 2016. We would like to thank the organizers and participants of this conference for their inspiration and participation.
India has recently completed 25 years of economic liberalization during which the country has delivered rapid economic growth, as measured by gross domestic product (GDP), to become one of the fastest growing economies in the world. One of the central debates that marked the occasion of a quarter century of reforms is the state of inclusiveness in the growth process. While there is a general consensus on the drop in poverty rates over this period, the enduring or even worsening state of disparities on a variety of dimensions—gender, rural vs urban, and socio-economic status—is well acknowledged by several recent studies.2
OECD Economic Surveys. (2017). India. Retrieved 20 January 2018, from http://www.oecd.org/eco/surveys/INDIA-2017-OECD-economic-survey-overview.pdf
Chancel, L., & Piketty, T. (2017). Indian income inequality, 1922–2014: From British Raj to Billionaire Raj? Retrieved 20 January 2018, from http://wid.world/document/chancelpiketty2017widworld/
Anand, I., & Thampi, A. (2016). Recent trends in wealth inequality in India. Economic & Political Weekly, 51(50), 59–67.
The recent Global Inequality Report,5
Alvaredo, F., Chancel, L., Saez, E., & Zucman, G. (2018). World inequality report 2018. Retrieved 20 January 2018, from http://wir2018.wid.world/files/download/wir2018-summary-english.pdf
It is not as if the problem of unequal growth and the need for inclusivity is not acknowledged by the Indian government. In the Eleventh Five Year Plan (2007–2012),6
Government of India, Planning Commission. (2008). Eleventh five year plan (2007–2012) Volume 1: Inclusive growth. New Delhi: Oxford University Press.
Government of India, Planning Commission. (2013). Twelfth five year plan (2012–2017) Volume 1: Faster, more inclusive and sustainable growth. New Delhi: SAGE.
Government of India, Niti Aayog. (2017). India: Three year action agenda, 2017–18 to 2019–20. Retrieved 20 January 2018, from http://niti.gov.in/writereaddata/files/coop/IndiaActionPlan.pdf
The policy rhetoric around inclusive growth since the mid-late 2000s has been partly translated into policy action by conceiving and implementing a variety of programmes such as Mahatma Gandhi National Rural Employment Guarantee Act, the Right to Education Act, the National Food Security Act, and Pradhan Mantri Jan-Dhan Yojana (PMJDY) among several other such programmes. While the impact varies across these programmes, the country’s spending on social sector, especially those focusing on basic needs such as education and health, continues to lag many of the emerging economy peers.9
OECD Economic Surveys. (2017). India. Retrieved 20 January 2018, from http://www.oecd.org/eco/surveys/INDIA-2017-OECD-economic-survey-overview.pdf
This colloquium is part of a special section on inclusive growth in this issue of Vikalpa. This is a modest attempt to bring together specific perspectives on four important aspects of inclusive growth discourse in the country. The first contribution by Manali Chakrabarti touches upon one of the most extensively debated topics in economic policy today: jobless growth (see Abraham10
Abraham, V. (2017). Stagnant employment growth: The last three years may have been the worse. Economics & Political Weekly, 52(38), 13–17.
Panagariya, A. (2018). India: Three and a half years of Modinomics. Retrieved 20 January 2018, from http://indianeconomy.columbia.edu/sites/default/files/working_papers/2018–01-modinomics.pdf
Mirai Chatterjee brings her extensive experience in national and international health policymaking to assess the state of inclusion in health care sector in India. Arguing that healthy population is a key requirement for economic growth, she laments the low levels of government spending on health in spite of several initiatives targeting improvements in health care provision. She suggests an approach for inclusive health care in which instead of viewing the target beneficiaries as mere recipients of health care delivery, the institutions facilitate collectivization and participation of beneficiaries in policy design and implementation. As an evidence for the potential for success of such an approach, she shares the experience of women in Self-Employed Women’s Association (SEWA), the organization with which she has been associated for many decades.
The third article addresses another key aspect of inclusive growth discourse: education. Shivakumar Jolad and Vaijayanti K. focus on the declining public school system with significant implications for inclusion in education. Based on their experience in studying the public school closures in Karnataka, they argue that a desire for universal access, an increasing preference for private schools even among the poor, and the complex organizational structure of public schools are reducing the size of public schools to a level that makes their continued operation economically infeasible. They go on to provide important guidelines for reorganization of public schools to make them more relevant and address the issue of inclusivity in education.
The last article by M. S. Sriram outlines the state of financial inclusion in the country and presents a slightly more optimistic view. Sriram, who has been involved with several government and voluntary organizations, advising them on financial inclusion, divides state initiatives into four phases since Independence. According to him, each of those four phases tasted some level of success in bringing inclusivity in access to credit. He argues that the current phase, which is building on the successes of the previous phases, has a ‘good architecture in place’, but needs a more careful thinking to consolidate on the gains achieved so far.
The key takeaway from the four contributions is that while the need for inclusive growth is generally well recognized by policymakers, there is a need for the state to step up, rather than withdraw, to fulfil its obligations towards key social sectors. The colloquium obviously cannot do full justice to this enormously complex issue, but the four contributions hopefully provide some useful perspectives on the state of inclusive growth in India.
Over the last quarter of the century, India’s GDP has grown tenfold over from around $275 billion in 1991 to US $2.3 trillion in 2016, even through the period of global recession in 2008.12
However, in a paper provocatively, titled ‘Indian Income Inequality, 1922–2014: From British Raj to Billionaire Raj?’, renowned French economists Thomas Piketty and Lukas Chancel argue that the share of income of the top 1 per cent population of the country, at present, is more than what it was during the colonial times.13 Between 1980 and 2014, the income share of the top 1 per cent of India’s population increased from 6 per cent to 22 per cent, while the share of the bottom 50 per cent fell from 24 per cent to 15 per cent. In fact, according to the Multidimensional Poverty Index (MPI)14The MPI was launched by the UNDP and the Oxford Poverty & Human Development Initiative (OPHI) in 2010. Basic philosophy and significance of MPI is that it is based on the idea that poverty is not unidimensional (not just depends on income and an individual may lack several basic needs such as education, health, etc.), rather it is multidimensional.
EMPLOYMENT IN INDIA: AN OVERVIEW
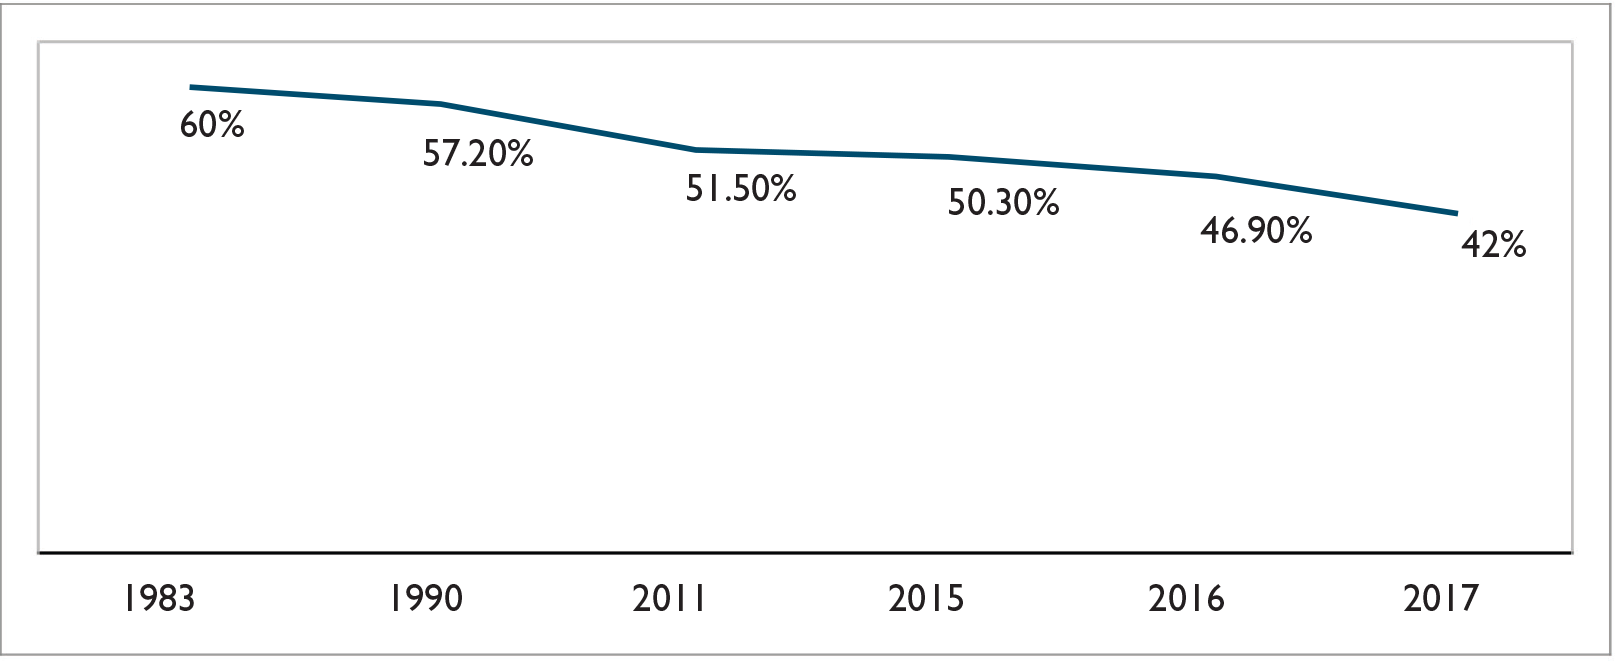
One of the most startling features of the labour force of our country is that only half of the working population16
Standard definition of working population is people of the age group 15 years and above.
Vyas, M. (2017). 1.5 million jobs lost in first four months of 2017. Retrieved from, https://unemploymentinindia.cmie.com/kommon/bin/sr.php?kall=wtabnav&tab=4080&nvdt=20170711110731463&nvpc=091000000000&nvtype=COMMENTS
This basically means that, according to the official statistics, more than half of the potential working population do not even count for in the economy—they are not part of the GDP and the growth spectacle. This is particularly striking because India is apparently at the peak of its demographic dividend—that means it is primarily a youth-driven economy.18
Unlike many of the developed countries which are plagued by a predominantly aging population.
Shah, S. (2017). India’s demographic dividend: 64.4 percent youth, 27.3 percent children in 2015. Retrieved from http://www.indiaspend.com/viznomics/indias-demographic-dividend-64–4-youth-27–3-children-in-2015-2015
Indian women do 10 times as much unpaid work as men: McKinsey. Retrieved from http://www.huffingtonpost.in/2015/11/04/indian-women-economy_n_8469456.html
The low labour participation rate explains the astonishingly low unemployment rate in the country.21
Unemployment rate is defined as the difference between those seeking formal employment and those who are actually employed.
Suman, A. (2016). Thanks to technology, 20 crore middle class youth will soon be jobless. Retrieved from https://www.kenfolios.com/thanks-technology-20-crore-middle-class-youth-will-soon-jobless/
Government Of India, Ministry Of Labor & Employment, Report on fifth annual employment: Unemployment survey, 2015–16 (Vol. 1, p. 44).
The unemployment rate during September–December 2016 was 6.8 percent (29.6 million unemployed out of a labour force of 436 million) in January–April the rate fell to 4.7 percent (20 million unemployed out of a labour force of 425 million).25
Vyas, M. (2017). 1.5 million jobs lost in first four months of 2017. Retrieved from https://unemploymentinindia.cmie.com/kommon/bin/sr.php?kall=wtabnav&tab=4080&nvdt=20170711110731463&nvpc=091000000000&nvtype=COMMENTS
The only way one can explain this is by appreciating the extent of disenchantment of the population with the existing system and also the nature of employment available to them.
Employment: Formal and Informal
Countries across the world, including India, need to move towards formalisation of labour and generation of at least 600 million new quality jobs in the next 15 years to fulfil Sustainable Development Goals set by the United Nations by 2030.26 The Hindu Business Line. ILO keen to support India in formalisation of jobs. Retrieved 7 July 2016, from http://www.thehindubusinessline.com/economy/policy/ilo-keen-to-support-india-in-formalisation-of-jobs/article8820150.ece
—Guy Ryder, Director-General, ILO during his recent visit to India
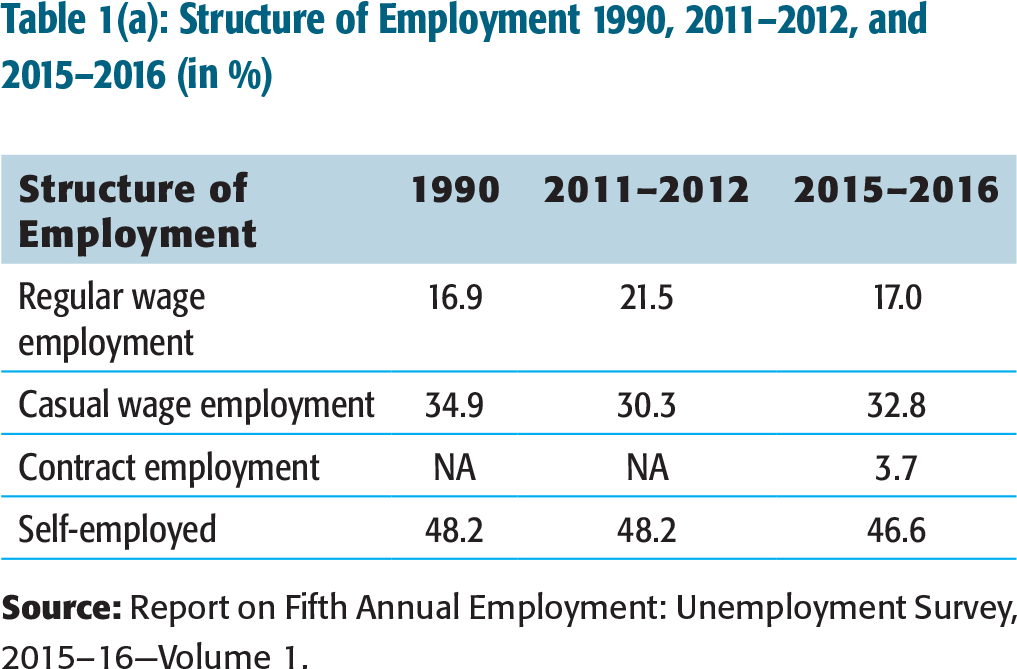
Currently, of the total number of people employed in India, only 17 per cent are in the organized sector27
The organized sector is defined to include all government and public sector establishments, all private corporate sector establishments and those of private non-corporate sector establishments that employ at least 10 regular employees (this is a standard definition widely used in India). The unorganized sector is the rest of the economy.
See Ghose, A. K. (2015). Employment in a time of high growth in India (No. 994885873402676). International Labour Organization http://www.ilo.org/wcmsp5/groups/public/ed_emp/documents/publication/wcms_405771.pdf , p. 7.
Report on Fifth Annual Employment: Unemployment Survey, 2015–16 (Vol. 1, p. 40).
(a): Structure of Employment 1990, 2011–2012, and 2015–2016 (in %)
(b): Structure of Employment: Organized and Unorganized Sectors (in %) 1990 and 2011–2012
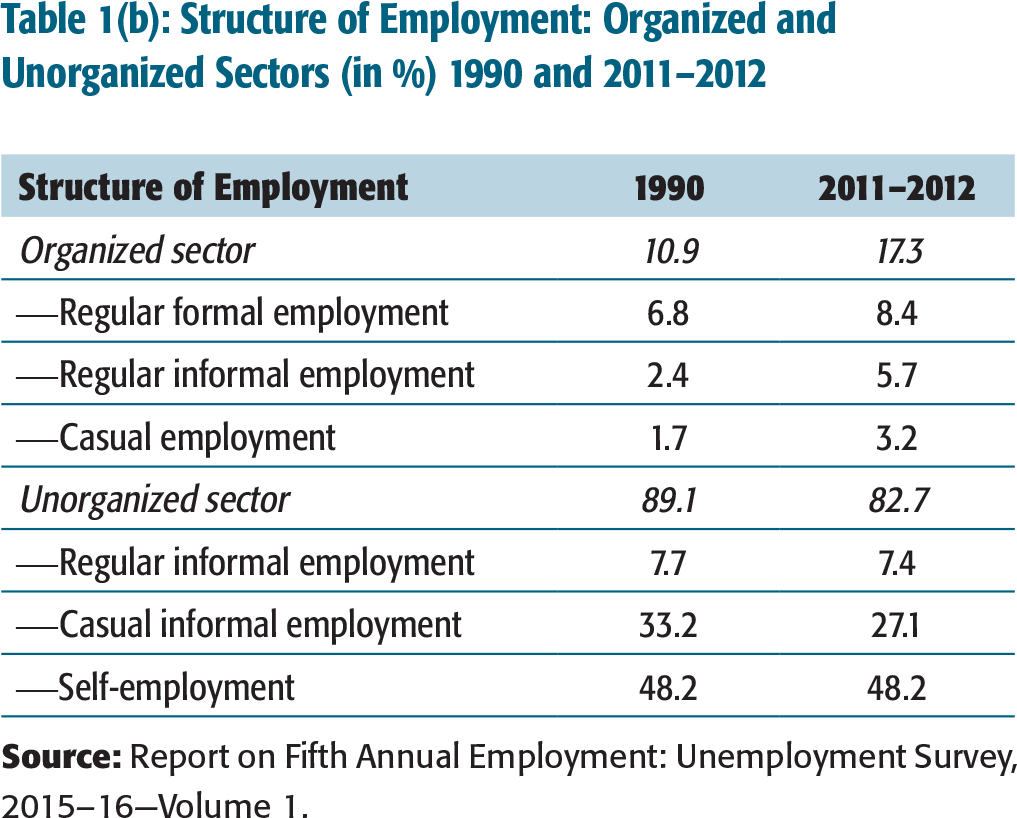
About half of our country’s labour force is self-employed, as is evident from Tables 1(a) and 1(b). But this is not to imply that they are in the company of the Ambanis and the Adanis or even the spate of young start-ups which have been romanticized by the media for the last two decades. These self-employed people are the ones who probably have not been able to find any sort of employment even in the informal sector. They have to face all the uncertainties of an entrepreneur, including rising input costs, falling prices, decreasing demand, competition, and contingencies (personal, economic, weather, etc.), without any institutional support. Majority of them are in the agrarian sector, forced to eke out a meagre living by tilling a small piece of land which does not yield enough to even cover their consumption expenditure. Probably this is the reason that the ‘self-employed’ category even in rich countries is a minuscule fraction of the total working population. For instance, the United States, the citadel of entrepreneurship, has only about 6.5 per cent of the working population as self-employed.30
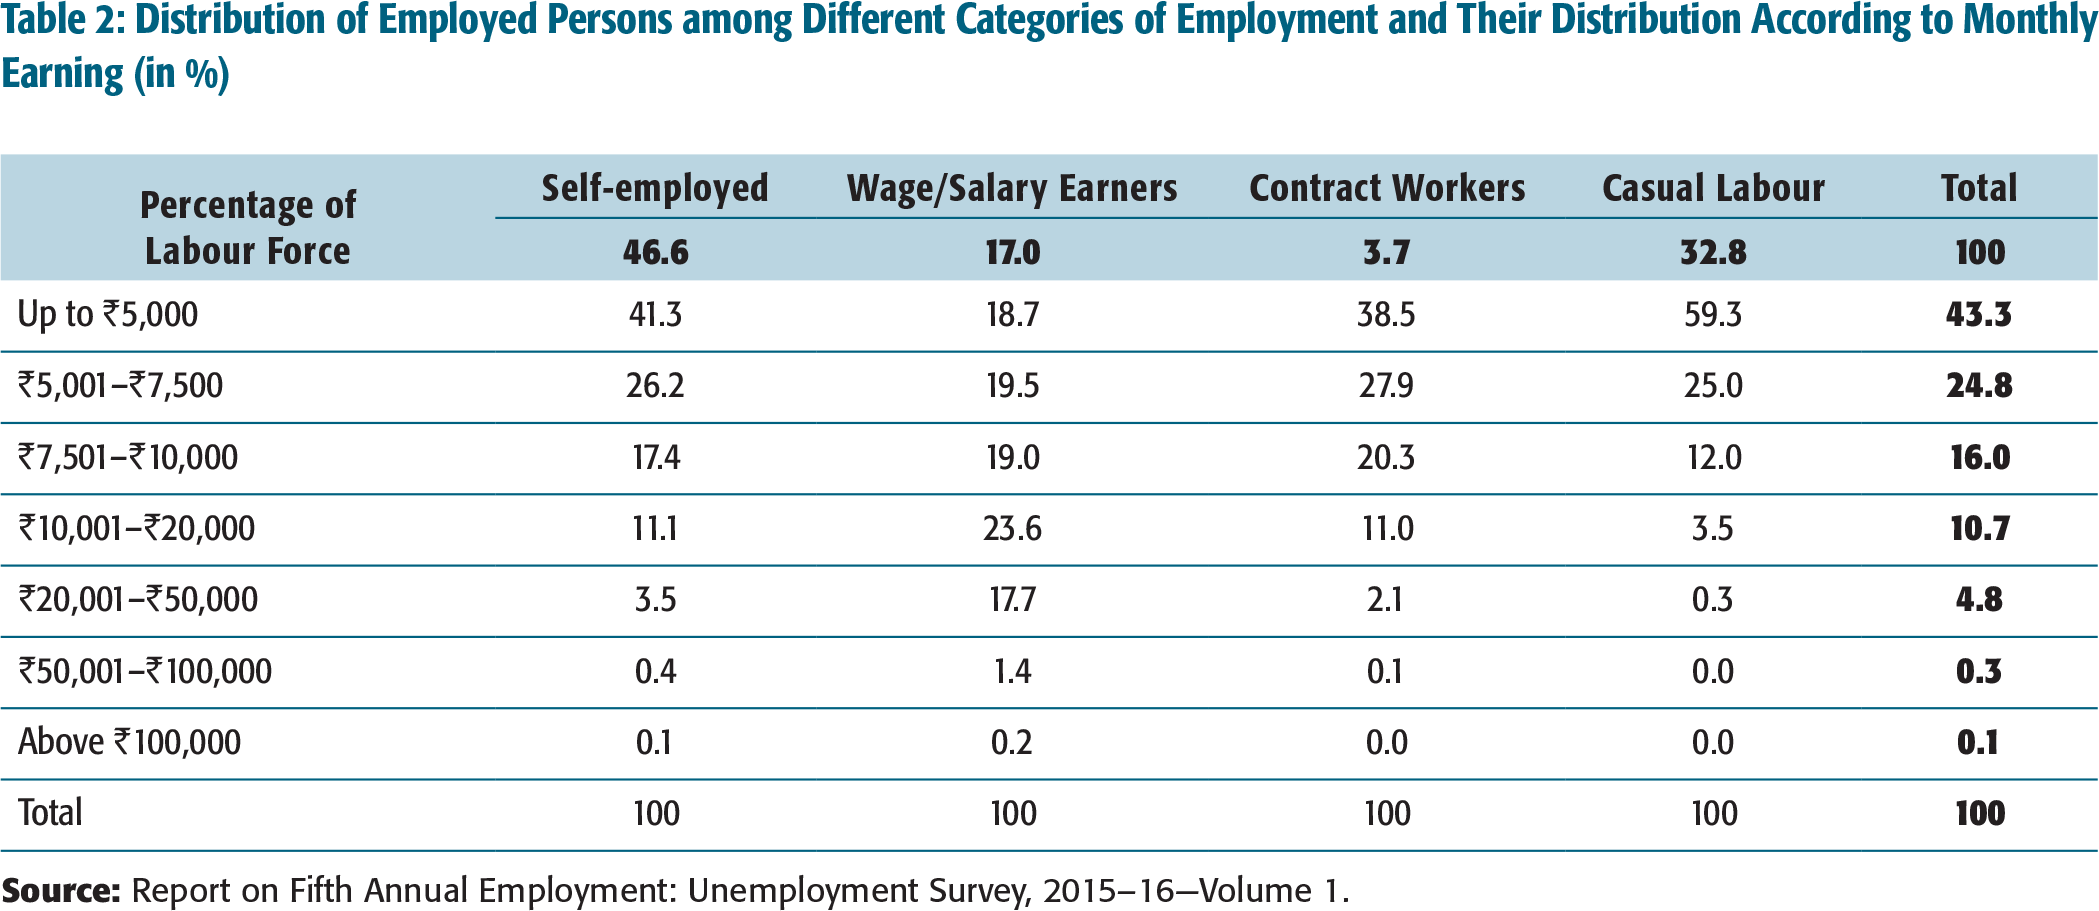
A cursory glance at the income of the self-employed in India would make this assertion amply clear (Table 2). Around 90 per cent of the self-employed earn less than ₹10,000/- per month and only around 4 per cent earn more than ₹20,000/-. In the case of casual labour, over 96 per cent of the workforce earn less than ₹10,000/- per month and around 60 per cent earn less than ₹5,000/- per month. Compared to that, around 40 per cent of the labour force in regular employment earns more than ₹10,000/- per month.31
Report on Fifth Annual Employment: Unemployment Survey, 201516 (Vol. 1).
If our country took seven decades to formalize merely 8 per cent of the jobs, not accounting for the fact that over half of the working population are not even part of the labour force, one can safely surmise that contrary to all claims made by successive governments and policymakers, they are nowhere close to tackling this crucial issue.
Let us briefly examine the sectoral constraints which might be the reason for such extreme sluggishness in any kind of mobility in the job market.
Sectoral Analysis of Constraints in Mobility of Employment
Agriculture and Allied Activities
Distribution of Employed Persons among Different Categories of Employment and Their Distribution According to Monthly Earning (in %)
Sector-wise Distribution of Employed Persons (in %)
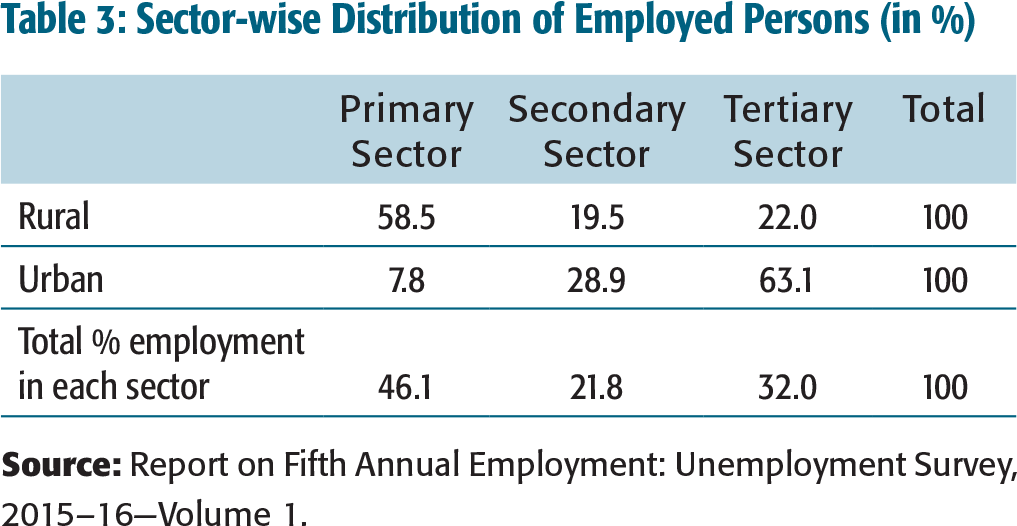
While the number of households dependent on agriculture has been increasing over the decades, the total agricultural area owned has been declining over the years.32
At present (2017), it is around 92.37 million ha which is 13 per cent less than what it was in 2003 (107.23 million ha) and 23 per cent less than what it was in 1971–1972 (119.64 million ha).
From 1.53 ha in 1971–1972 to just 0.59 ha in 2013.
Jobs in Manufacturing and Services
Half the working population is employed in manufacturing and services, but far from being the citadel of modernity, over 90 per cent of the jobs are in the informal sector. The 2010–2011 round of NSS estimated that there were 58 million such enterprises (in manufacturing, trade, and other services, excluding construction), employing 108 million workers—this translates to ‘less than two workers per enterprise’. In fact, majority of them (49 million) did not hire any workers, instead they worked with family members. The rest have an average of four employees. These ‘enterprises’ primarily cater to the needs of the poorest sections of our economy, but given the dire straits in agriculture (where half of the population is stuck), there is hardly any demand pull. With no surplus and zero access to any form of institutional support, the owners of these units have to be enormously enterprising to survive—that probably is the only reason these insignificant set-ups qualify to be labelled as ‘enterprises’.
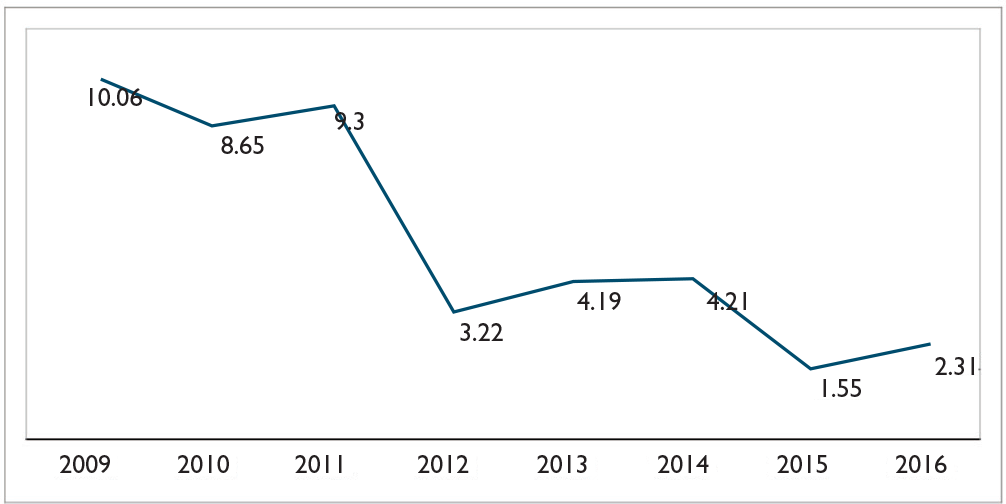
A million people enter the job market every month; thus to keep up with the population, the economy needs to create around 12 million jobs. No wonder, the present government’s electoral promise to create 10 million jobs every year resonated so widely among the people. But halfway into their term, the reality is a far cry from the promise. From a high of 1 million jobs in 2010 (still merely one-tenth of the actual requirement) in the 8 key sectors, the new jobs plummeted to merely 0.15 million (one-hundredth of the promise) in 2015 (Figure 2). The government tried to boost up the numbers by including high growth service sector jobs in the 8 key sectors, but the picture remained dismal.
Chowdhury, J. (2017). No jobs? Let them eat… Employment growth at 8-year low, tough times ahead for the young. Retrieved from, https://www.telegraphindia.com/1170518/jsp/frontpage/story_152234.jsp
The IT sector which created so much euphoria in the country in the last decade is in the midst of a massive downsizing—the seven largest players have decided to lay off 56,000 engineers this year.35
Sood, V. Top 7 IT firms including Infosys, Wipro to lay off at least 56,000 employees this year. Retrieved 12 May 2017, from,http://www.livemint.com/Industry/4CXsLIIZXf8uVQLs6uFQvK/Top-7-IT-firms-including-Infosys-Wipro-to-lay-off-at-least.html
Press Trust of India (2017). Up to 6 lakh IT staff may lose jobs. Retrieved from http://www.thehindu.com/business/Industry/up-to-6-lakh-it-staff-may-lose-jobs/article18451843.ece
The manufacturing industry seems to have already lost the script about its role in the economy. At present, the formal sector accounts for 65 per cent of the manufacturing output but employs only 10 per cent of the manufacture sector workforce, and there has been a secular trend towards even more capital-intensive production. Further this trend is visible not only in capital-intensive industries but also in labour-intensive industries. In the use of capital-intensive techniques of production, skilled workers are favoured, while unskilled workers are replaced by technology. This leads to further accentuation of inequality amongst wages of workers and supervisory/managerial staff. According to a recent research, in the period 2001–2002 to 2011–2012, the ratio of the average salaries of supervisory and managerial staff to the wages of production workers increased from 3.57 to 5.82.38
Kapoor, R. (2016). Technology, jobs and inequality: Evidence from Indias manufacturing sector. Retrieved from http://icrier.org/pdf/Working_Paper_313.pdf
Ibid.
Post-2008, things have got worse. According to a recent analysis, India’s salary growth stood at 0.2 per cent in real terms in the last eight years since the global recession, while the GDP grew by 63.8 per cent over the same period. But more importantly Indian wage growth was ‘by far the most unequal’ of the countries analysed. People at the bottom are 30 per cent worse off in real terms since the start of the recession; while people at the top are 30 per cent better off.40
WHAT HAVE BEEN THE POLICY MEASURES TO ADDRESS THIS CRISIS?
A working population of around 470 million, with a similar number opting to stay out of the labour market without any viable economic alternative, is a serious situation by itself for any economy. But combined with the fact that 12 million young people are entering the job market annually while the economy is being able to provide only a minuscule percentage of new jobs (one-hundredth), it is a crisis of immense proportions. The continuous focus of the media, the elected representatives and the policymakers about the growth of the economy and how to keep it going is not assuaging the people anymore. And unfortunately, the various policies practised by the government are not even attempting to address this grave situation, if anything it seems to be making things worse. Let us look at a few indicators to support the earlier contention:
One of the primary tasks for a poor country like India should have been to provide maximum support to social protection, health, and education (Figure 3). India spends less than 3 per cent of its GDP on social protection and health while in comparison, most developed countries spend 20 per cent to 30 per cent of the GDP on these important heads. Even African countries allocate a higher proportion of their GDP to these sectors. Half the working population and the food security of the entire country depend on agriculture. Yet, successive budgets have been slashing the allocation to this crucial sector. At present, the combined allocation by the centre to agriculture, water resources, and rural development is less than 1 per cent of GDP. This in spite of three drought years in a row in several parts of the country. As has been discussed earlier, 90 per cent of the population is dependent on agriculture earning not enough to cover their consumption and are in serious debt. The budget provision for the only large-scale employment drive by government, Mahatma Gandhi National Rural Employment Guarantee Act (MGNREGA), has been shrinking for the last two years. This year’s allocation of ₹480 billion is claimed to be 25 per cent higher than last year’s budget estimates. However, it is barely 1 per cent higher than the revised estimates of ₹475 billion for last year. It is, in fact, lesser than last years’ allocation if one builds in inflation. It is telling that a programme which is supposed to support millions of farm households accounts for merely 2.5 per cent of the country’s budget. On the other hand, the government claims to boost the economy by incentivizing the corporate sector by writing off massive revenues due as income tax, excise, and customs. The official figures put the total amount of these ‘incentives’ in the 10-year period (2005–2006 to 2015–2016) at a whopping ₹42,000 billion. As P. Sainath, whom Amartya Sen has declared ‘one of the world’s great experts on famine and hunger’, noted ‘with these corporate incentives you could run MNREGA for 109 years at the present level’.41 Biswas, S. (2017). Why inequality in India is at its highest level in 92 years. Retrieved from http://www.bbc.com/news/world-asia-india-41198638
Further, the demonetization drive in 2016, termed as the surgical strike against black economy, bled dry the informal sector which employs over 90 per cent of the working population. Thousands of units had to shut shop, leading to massive unemployment.
The informal economy was still reeling from the shock of demonetization, when it was hit by the all-encompassing Goods and Services Tax (GST). As UNCTAD’s Trade and Development Reports 2017 noted about India:
(T)he informal sector, which still accounts for at least one third of the country’s GDP and more than four fifths of employment, was badly affected by the Government’s ‘demonetization’ move in November 2016, and it may be further affected by the roll-out of the Goods and Services Tax from July 2017.43
The above list is merely illustrative of the complete lack of direction or will by successive governments to ensure that the gains of growth are distributed across the population, or in other words, to make the growth ‘inclusive’.
Thus, after a quarter of century of ushering in massive economic reforms, the Indian economy and the Indian people seem to be hurtling down two opposite trails—while the economy is growing dramatically, the people are not. On the contrary, the extreme wealth of the super-rich brings home the obscene poverty of the majority even more sharply, and they are not entirely unrelated phenomenon.
SO WHAT IS TO BE DONE?
Well, this is a difficult question and merits a complex exploration to do it justice. Our society, as has been briefly argued earlier, is stuck in a structural bind where mobility for the majority consists of distress movement from one sector of the all-encompassing informal economy to another—with no qualitative change in the economic condition. Structural constraints warrants a fundamental programme for change. Band-Aid solutions can only make things worse in the long run. Personally, I believe, for all complex questions on society, history offers a treasure trove of experience to learn from. And yet as Hajo Holborn, the late German American historian of the 20th century, pointed out succinctly ‘[H]istory gives answers only to those who know how to ask questions’—so the essence is in being able to ask the right questions.
In the 1990s, when the leaders of our country introduced fundamental economic reforms and embarked on a path of high growth, they aspired to emulate the spectacular performance of the Asian Tigers and Japan, which were able to undergo rapid industrialization through high growth. The reforms constituted primarily of withdrawal of the government from all vital sectors of the economy and allowing free run to the private sector, both national and global. But a cursory look into the development process of all these countries reveals the decisive role of the state in ensuring minimum social protection to the people and also to make capital accountable to a comprehensive programme of inclusive growth. Even before the economic reforms, these countries implemented ‘extensive land reform programmes’ by the state, often referred to as the ‘secret sauce’ that sparked sustained and broad-based economic growth.44
Prosterman, R. (n.d.). How land reform shaped Asia’s Tiger Economies. Retrieved from https://landportal.info/blog-post/2017/04/how-land-reform-shaped-asia%E2%80%99s-tiger-economies
Studwell, J., & Jochnick, C. (2016). Land reform for the modern era. Retrieved from https://www.devex.com/news/land-reform-for-the-modern-era-88732
To achieve inclusive growth is a problem, and our country is miserably failing to find a solution to it. But maybe we should not rush to a solution. Maybe we should take time to appreciate the enormity of the problem, decipher its many manifestations, linkages, and complexities, and only then go back to history yet once again, ‘and ask the right question’ this time. We just might find the answers. To quote Albert Einstein:
If I had an hour to solve a problem I’d spend 55 minutes thinking about the problem and 5 minutes thinking about solutions.
Inclusive health or health care has been the hallmark of all policy documents in India, well before Independence. Two important milestones in our public health history are the Bhore Committee report of 1945 and the Sokhey Committee report of 1948. The latter was a subcommittee of the National Planning Committee, chaired by Jawaharlal Nehru, and began its work in the 1930s. Both acknowledged the poor status of public health in India and identified the root causes and analyses that remain relevant to the health scenario today.
In its introduction, the Sokhey Committee states that
‘The root cause of disease, debility, low vitality and short span of life is to be found in the poverty, almost destitution, of the people, which prevents them from having sufficient nutrition, clothing and shelter.’46 The Sokhey committee report (1948, p. 6).
It notes that per capita income in India was ₹80 per annum at that time.
We have no doubt come a long way since then. However, the close link between poverty and health is brought home to us every day at SEWA. Whether it is Savitaben explaining how she sold her land for ₹0.2 million for treatment for her son who had a motorcycle accident or Ayeshaben who took a loan from SEWA Bank for her cataract surgery, SEWA members face injury and ill health frequently, leading to further impoverishment and indebtedness.
Several expert health committees in independent India fully recognized the link between health and poverty reduction, as well as the need for what was first called an ‘intersectoral approach’, especially during the years leading up to and beyond the Alma-Ata Declaration on primary health care in the mid-1970s. In 2005, the World Health Organization (WHO) introduced a major change in the discourse, referring to the ‘social determinants of health’, and establishing a Commission on the Social Determinants of Health (CSDH). The Commission and its report, ‘Closing the Gap in a Generation’,47
Commission on the Social Determinants of Health. (2008). Closing the gap in a generation. Geneva: WHO.
In India, not long after the CSDH’s report, the Planning Commission set up an expert group to plan for Universal Health Coverage (UHC) in 2010, and a year later, its report was presented. This High Level Expert Group (HLEG) report, such as the Bhore and Sokhey committees decades earlier, is widely considered to be a landmark in Indian public health. It strongly advocates for inclusion, attention to the most vulnerable and community action for health. There is a whole chapter devoted to this, arguing that people’s involvement and action is essential for appropriate health care.
Communities are not just recipients of care. They have the capacities to create and promote health, by means of social and familial networks, and the application of local health knowledge. Increased community participation in health care—its delivery, governance and accountability—represents the deepening of democracy. It can empower people, particularly women, the poor and other marginalised segments of society, and ensure that the delivery of health care services remains appropriate and accountable to them.48 Planning Commission of India. (2011). High level expert group report on universal health coverage for India (p. 26). New Delhi: Author.
Most recently, the National Health Policy 2017, accepted by the Union Cabinet earlier this year, not only takes forward the discourse on UHC, now calling it Universal Health Assurance (UHA), but also emphasizes inclusion in health by its focus on the poor and vulnerable. For the first time, occupational health is explicitly mentioned, focusing attention on the health of our workforce. Similarly, the health of women and the elderly is singled out for special attention. There is also an emphasis on incentivizing doctors to reach out to people in remote areas. Perhaps most importantly, this latest health policy document outlines 10 key principles, including universality and equity. The latter spells out clearly an inclusive agenda for health:
Reducing inequity would be affirmative action for the poorest. It would mean minimizing disparity on account of gender, poverty, caste, disability, other forms of social exclusion and geographical barriers. It would imply greater investments and financial protection for the poor who suffer the largest burden of disease.49 Ministry of Health and Family Welfare. (2017). National health policy 2017 (p. 2). New Delhi: Government of India.
Thus, over decades of public health policy dating to the 1930s, as a nation we have promoted the idea of inclusion in public health. However, there is a significant gap between policy and implementation. The latest National Health Policy 2017 states that ‘A policy is only as good as its implementation’.50
Ibid., p. 31.
At SEWA, we experience this gap between policy and implementation at the grassroots level. Our own journey towards inclusive health began 40 years ago when a study of loan defaulters at SEWA Bank revealed that sickness was the major reason for irregularity in payment of loan instalments. In fact, of 500 defaulters surveyed, 20 had died, 15 of them from causes related to childbirth. This jolted us into action, propelling us to develop a low-cost, inclusive, women-centred and community-based programme by, for, and with women, our own SEWA members.
Another lesson learned from the very early days of SEWA’s establishment by Ela Bhatt in 1972 was that poverty elimination is impossible without some measure of health care. As our SEWA sisters put it: ‘Our health is our only wealth. As long as we are healthy, we can earn and feed our families.’ Over the years, we increasingly understood these linkages, and realized that our goal of self-reliance for women and their families would be an impossible dream without inclusive health care. In fact, self-reliance itself is only possible with full employment which includes work security, income security, food security, and social security. The latter, in our experience, must include at least health care, child care, insurance, pension and housing with basic services such as a tap and toilet in every home. In fact, full employment, this composite concept, should be the definition of inclusive growth, leading families to self-reliance, both financial and in terms of decision-making and control over their lives.
The question is how does one develop inclusive health for inclusive growth? What is required? We believe some of the major reasons for the gap between policy commitments to inclusion and its actual implementation on the ground are conceptual, and also because we need to develop workable way of ensuring inclusion at the grassroots or local level. SEWA’s experience of inclusive health care may be helpful and is outlined in the following.
First, a deep faith in people’s, and especially women’s, ability to learn to take care of their own health and that of others. What naturally follows from this is developing systems and services with, for, and by women.
The first step is identifying local women as health workers. This is crucial for inclusive health. We did this by having meetings with women, our members, taking their wise counsel on who would make the best health worker, and importantly, who would also benefit from the opportunity of special health training to be the community health worker. Our SEWA sisters inevitably chose the poorest and most vulnerable of women. There was Shardaben whose husband abandoned her, taking her baby with him. Then there was Ayeshaben, divorced with two young sons, and Chanchiben, Dalit and disabled. All these women were without hope and in despair. Chanchiben and Shardaben openly said they had no will to live. Slowly, we convinced them that they were not alone and that they had a role to play in their communities, and that they could contribute. With much encouragement and patience, these women changed their lives and that of others. We were proud to see them grow into strong health workers. Shardaben was once frail and despondent, but now there was a spring in her gait and a warm smile for those she served as a health worker. Ayeshaben had chronic stomach pain which disappeared without any medicines and she became an articulate health educator.
Chanchiben’s was perhaps the most dramatic change of all. When we identified her as a health worker, there was a furore in the village. Several village folk said she was disabled and Dalit, how could she possibly be a health worker? And they refused to take medicines from her due to caste taboos. Today not only does she enter all upper-caste homes freely to provide care and medicines but also the entire village asked her to stand for election as sarpanch.
The second step in developing inclusive health is capac-ity-building through rigorous training and also practical field experience. This was not easy. For women who had never been exposed to this kind of health training and also had to overcome their own fears, this again was a slow process. We organized two-day training sessions every month, and the rest of the time, the health workers practised their new-found knowledge and skills in their community, meeting with us every week when they had doubts or faced a particularly difficult situation. And we accompanied them to the referral hospitals with unfamiliar systems to navigate. This combination of training, praxis, and supervisory support proved critical in the development of our health workers and their inclusive health services.
The field work involved identifying women’s needs for health and their priority health issues, whether white discharge and menstrual problems or acute respiratory infections in their young children. From these felt needs, we built up our basket of services: first and foremost, health education and health awareness—simple dos and don’ts, facilitating immunization, providing primary health care including low-cost medicines and our own Ayurvedic ones, family planning and other reproductive health care, occupational health care, mental health care and counselling, linkages with government services and programmes that otherwise were not reaching people, and referral care. Later on, at women’s behest, we began ‘Know Your Body’ health education for adolescents and young people—girls at first and later on boys as well. Then these young people were organized into their own collective or mandals to enable them to work together locally for health—cleaning up their villages or mohallas [bylanes], providing extra food to a malnourished mother or child and educating people against pre-natal sex determination, among other health action points.
The third step was creation of women health workers’ own cooperative where they are the users, managers, and owners. Each of the initial 50 health workers paid up ₹100 as share capital to register their own membership-based organization, the health cooperative Lok Swasthya. The cooperative gave them voice and representation. Through democratic elections in their general body, they could get elected to the board of Lok Swasthya. They decided to nominate health workers by geographic area and then elections were held—and continue to be held every three years ever since for the last 27 years. In the board, the elected health workers learned to run their own organization: to read a balance sheet, maintain minutes, run meetings, and make carefully thought-out policy decisions.
The fourth step was recognition for individual health workers, and their cooperative too. The health workers realized that they had made a breakthrough when they began to be invited to speak at various national and international health fora, national health assemblies, health promotion conferences abroad, and as case studies for the WHO and the World Bank. Then their cooperative winning a WHO prize for excellence in primary health care and being awarded by the health minister further bolstered their confidence in their own organization, and their own abilities to work together as health workers and change agents.
The journey for inclusive health for inclusive growth is far from over. The SEWA health workers have only shown the way. But we have a long way to go. It has been a journey full of learnings. Perhaps the biggest one is the immense potential of the poorest and most vulnerable to change and improve their own health, and that of their communities. Health cannot be ‘delivered’ to local people. But local people can be trained to be catalysts to improve their own health by acting on a whole host of social determinants such as clean water and nutrition. It is this that is empowering and leads to inclusion—both of the health worker and her community.
While strong organizing for health via local people at the micro level is essential, they also need an enabling environment via macro-level policies, leading to appropriate programmes and services at grassroots level. One of the biggest gaps has been the under-investment in public health, only 1.2 per cent of GDP.51
National Health Policy 2017, pp. 5, 6.
Fortunately, our government, the last one and the present one, have finally recognized the importance of health care for all Indians. There is now a solid commitment to universal health care or UHA in the National Health Policy 2017, as mentioned earlier. Ayeshaben, Shardaben, and Chanchiben greeted this new policy with enthusiasm. They were pleased to know that community action by local health workers like themselves is a cornerstone of the policy which calls for a people’s movement or jan andolan for health. This signifies an understanding at the highest levels of government that inclusive health and inclusive growth are inextricably linked, and that inclusive health is only possible with the involvement of every citizen of our country in efforts to take care of their own health and well-being. No doubt it will be the Ayeshas, Shardas, and Chanchis of our country who will lead us from the front.
India has one of the largest schooling system in the world, with over 1.5 million schools having 260 million students studying in classes from I to XII. Elementary schools have grown from 0.22 million in 1950–1951 to 1.27 million in 2014. According to the Universal District Information System for Education (UDISE) 2015–2016 data, around 200 million children, about the size of Brazil’s population are studying in elementary schools alone.52
Universal District Information System for Education (UDISE) 2015–16. Retrieved from http://udise.in/
NUEPA. (2014). Education for all towards quality with equity in India. New Delhi: Author.
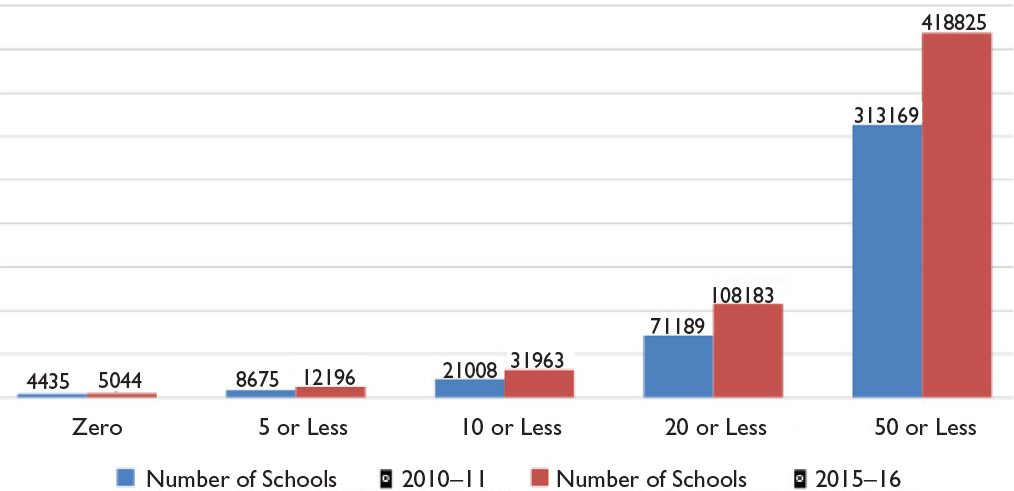
In the last two decades, while both the government and private schools have increased substantially, the growth in enrolment has been primarily driven by the private schools, with children migrating out of the government school system in both urban and rural areas. This problem is further compounded by the demographic decline of the child population in many states due to falling fertility rates. According to District Information System for Education (DISE) 2015–2016 data, 0.419 million (40%) of government schools had total enrolment of less than 50 children and 0.108 million schools (10.3%) were ‘tiny’54
For the purpose of this discussion, a ‘tiny’ school is defined as one with a total enrolment of 20 or less students.
Kingdon, G. G. (2017, March). The private schooling phenomenon in India: A review (Discussion Paper Series).
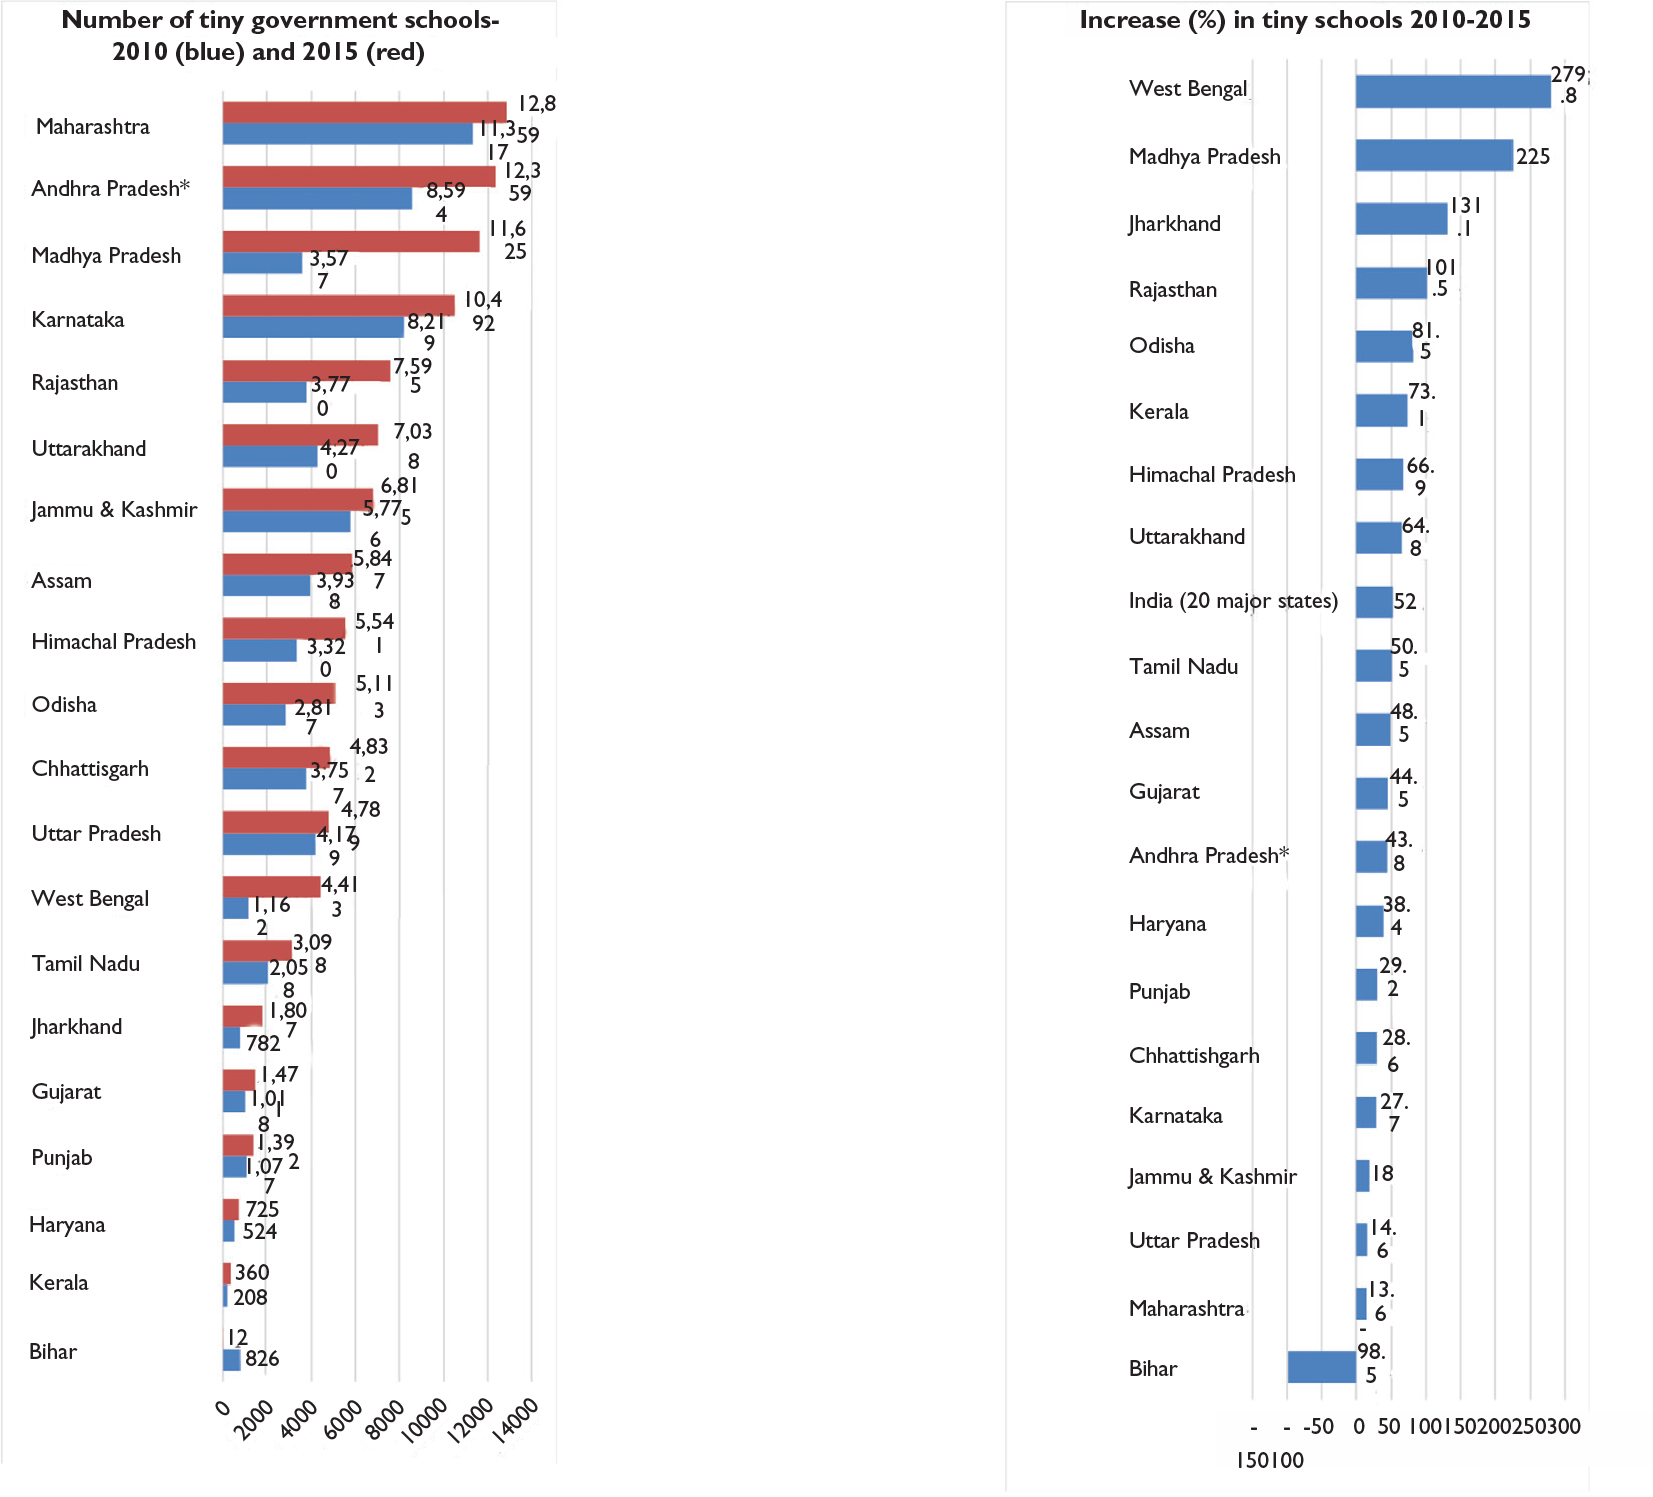
This trend of emptying of government schools can be seen in almost every major state in India (except Bihar), with some variation. Maharashtra, Andhra Pradesh (AP), MP and Karnataka have more than 10,000 tiny schools. In MP, the tiny schools have grown from around 3,500 schools in 2010 to 11,600 schools in 2015, showing a 225 per cent increase. West Bengal too showed a sharp increase (280%) in tiny schools from 1,162 in 2010 to 4,413 in 2015 (Figure 5).
Ibid.
If the drain of students from government schools continues at the current pace, we are likely to see many pockets of urban and rural areas with empty government schools or those on the verge of shutting down. Small schools lead to increase in per-child expenditure, create distributional inefficiencies, and inadequate teacher allocation compromising the quality of teaching.57
Kochar, A. (2007). ‘Can Schooling Policies Affect Schooling Inequality. In An Empirical Evaluation of School Location Policies in India’ (pp. 17-18). Paper presented at the India Policy Forum, National Council for Applied Economic Research, New Delhi.
Blum, N., & Diwan, R. (2007). Small, multigrade schools and increasing access to primary education in India: National context and NGO initiatives (Research Monograph No. 17).
Kingdon, G. G. (2017, March). The private schooling phenomenon in India: A review (Discussion Paper Series).
CAUSES OF GROWTH IN SMALL AND TINY SCHOOLS
Policy of Access to Schools
Since Independence, Indian education policies have focused on providing access to schooling to all sections of society, and achieving universal elementary education (UEE). Early education planners felt that the primary deterrents to schooling was inadequate number of schools, and the consequent distance between the residence and a school.60
Kochar, A. (2008, NA). Can Schooling Policies Affect Schooling Inequality? An Empirical Evaluation of School Location Policies in India. (B. B. Suman Bery, Ed.) India Policy Forum, 4.
Education Commission; Kothari, D. S. (1966). Report of the education commission, 1964–66: Education and national development. New Delhi: Government of India.
Diwan, R. (2015). Small schools in rural India: ‘Exclusion’ and ‘inequity’ in hierarchical school system. Policy Futures in Education, 13(2), 187–204.
Many of the non-formal schools were converted to formal schools, post the Sarva Shiksha Abhiyan (SSA) launched in 2001. SSA has provided 0.204 million primary and 0.159 million upper-primary schools as of 2015–2016.63
Department of School Education & Literacy, MHRD. (2017, July 7). Guidelines for rationasing small schools-F.No.12–4/2016-EE. New Delhi: Government of India.
NUEPA. (2014). Education for all towards quality with equity in India. New Delhi: Author.
Private Schools Growth and Drain of Enrolment from Public Schools
Access to elementary school has largely been addressed by the growth of both government and private schools. The demand for schooling has primarily tilted towards the private schools in recent years for various reasons such as quality of public schools, English medium instructions and facilities, etc. Between 2010–2011 and 2015–2016, government schools in India (in 20 major Indian states) lost 13 million students, whereas private school enrolment rose to 17.5 million.65
Kingdon, G. G. (2017, March). The private schooling phenomenon in India: A review (Discussion Paper Series).
The perception of lack of quality in government schools and absence of English as a medium of instruction in primary schools are cited as the prime drivers of a shift towards private schools. There is growing aspiration among the parents to send their children to English medium schools,66
India Spend. (2016, May 16). Private schools preferred over govt ones; learning outcomes yet to improve, says report. Firstpost. Retrieved from http://www.firstpost.com/india/private-schools-preferred-over-govt-ones-learning-outcomes-yet-to-improve-says-report-2783206.html
Mody, A. (2015, September 2). India’s craze for English-medium schools is depriving many children of a real education. Scroll.in. Retrieved from https://scroll.in/article/750187/indias-craze-for-english-medium-schools-is-depriving-many-children-of-a-real-education
Demographic Decline of Child Population
The demand for schooling depends on the population and its age composition in a given region. With rapid fall in fertility rate across many states in the last few decades, India has entered the last phase of demographic transition. The demographic bulge is shifting upwards and child population is declining.68
Jolad, S. (2017, September 5). Can India reap the demographic dividend in higher education? Ideas for India, p. 6.
National family health survey 2015–16. Retrieved from http://rchiips.org/NFHS/factsheet_NFHS-4.shtml
Authors projection based on Census 2011 and Sample Registration Bulletin (SRS) 2014–2015 data.
School Organizational Structure
The Indian schooling system is organized at multiple levels, and run by multiple managements. The UDISE has classified 10 categories of schools covering primary (1–5), upper-primary (6–8), secondary (9–10), and higher secondary divisions (11–12). Government school management falls into four categories: department of education (under state), tribal/social welfare, local body, and central government. Private schools are managed under three categories namely private-aided, private-unaided and unrecognized schools. The RTE Act mandates free and compulsory education from 6 to 14 years (1st–8th grade). However, separate schools at primary and upper-primary levels create artificial barriers for completion of elementary schooling. With an increasing demand for secondary education and the government move to universalize secondary education, it is ideal to integrate secondary education with elementary education. Such vertical integration will ensure continuity in education, prevent dropouts, increases efficiency, and enable better utilization of resources.
CASE STUDY OF KARNATAKA
Delving deeper into DISE data at state-level shed light into the complex structure of schools, interaction between public and private school location, challenges faced by small schools such as teacher rationalization and multi-grade teaching. We summarize the main insights derived from the secondary data analysis and pilot study of schools in the urban, rural, and tribal districts of Karnataka71
Jolad, S., & Vaijayanti, K. (2017). Drain of government schools in India. Paper presented at the Eighth CESI International Conference: ‘Criticality, Empathy and Welfare in Contemporary Educational Discourses. Comparative Education Society of India.
Karnataka has around 22,000 government lower primary schools (LPS) and roughly same number of higher primary schools (HPS). Around 85 per cent of the LPS have an enrolment of less than 50 students, that is, less than 10 children per class. In almost all of them, multi-grade teaching is common. The teacher per grade (TPG) ratio crosses one only when the average size of the school is 200 or more. HPS have relatively better enrolment since children from the neighbouring primary-only schools join these after 5th grade. There are substantial regional variations in school size. Greater proportion of small and tiny schools were found in districts with better developmental indicators, possibly due to a greater supply of private schools and affordability. Secondary schools are in shorter supply when compared to primary and HPS. For about 23,000 government-run schools with higher primary classes, there are only 5,400 schools which have secondary classes. The relative shortage of government-run secondary schools creates an increased demand visible as higher strength of students per class. The mean enrolment in government-run secondary schools (as of 2015–2016) was 171, implying average per grade enrolment of more than 50. While the TPG is more than two in all the secondary schools, it is still below the expected TPG of three (that ensures presence of subject-wise teachers).
A pilot study of 16 schools helped us to understand some of the challenges that small schools faced. We sampled government schools in urban (Bengaluru Urban North), rural (Bengaluru Rural) and tribal (Chamarajanagar) areas, as well as a few linguistic and religious minority schools to get insight into ground realities of the government school distribution, dwindling enrolment, and challenges faced by teachers and students. We found that in urban areas with high population density, schools are located in very close proximity, and many of them are facing dwindling enrolments. Students often use public transport to commute long distances to reach a school. In rural areas with low population density, the growth of private schools in a neighbouring city substantially influence enrolments. The drain of students is particularly seen in LPS, where the vertical link for upper-primary classes is cut off. Multi-grade teaching is a norm rather than an exception, and teacher absenteeism is high in these small schools. Teachers complain that RTE mandate of reserving seats for economically weaker section students in private schools has further caused the drain of students from the public schools. The secondary school enrolment per class remains high due to the limited number of these schools, and more students seeking secondary education. In the tribal district, school distribution is relatively sparse. Many schools here are also facing dwindling enrolment. Parents in these areas prefer to send their children to residential schools in the neighbourhood established by department of tribal/social welfare or Navodaya Vidyalaya schools.
SMALL SCHOOLS AND SCHOOL CONSOLIDATION
Small schools exist in different proportions in almost all countries of the world. Definition of school size, largely restricted to school enrolments, vary from country to country depending on context. In sparsely populated countries like Finland, schools with enrolment as low as 50 maybe considered small. In contrast, in the US, where the average school enrolment is above 550, school size of 250 or less may be considered as small.72
Little, A. W. (2008). Size matters for EFA: Create pathways to access (Research Monograph).
Diwan, R. (2015). Small schools in rural India: ‘Exclusion’ and ‘inequity’ in hierarchical school system. Policy Futures in Education, 13(2), 187-204
In the US, the term small school is generally referred to schools with an enrolment of 200–400. The US experienced a phenomenal growth of schools in the late 19th and early 20th century. Between 1870 and 1920, schools increased by two and a half fold. In 1920, there were 270,000 schools, 70 per cent of which were single teacher schools. The process of consolidation of schools started in the 1920s, and by 1970, there was a two-thirds reduction in the schools (91,000), and the number of single teacher schools had dropped to 1,815. During the same period, the number of school districts too dropped from 117,000 (1940) to about 18,000 (1970).74
Education Policy Institute. (2011, April). The landscape of public education: A statistical portrait through the years. Epicenter.
Small schools and school consolidation have been widely debated in the US. Consolidation proponents argue on the basis of efficiency and economy of scale that consolidation provides better facilities, trained teachers, more comprehensive curriculum, broader extracurricular activities, and diverse social experience. Opponents argue that small schools provide better student support and better extracurricular activities, while consolidation brings additional stress on students due to longer commutes, reduced parental participation, and undermines the role of community in education.75
Nitta, K. A., Holley, M. J., & Wrobel, S. L. (2010). A phenomenological study of rural school consolidation. Journal of Research in Rural Education, 25(2), 1.
Sher, J. P., & Tompkins, R. B. (1976). Economy, efficiency, and equality: The myths of rural school and district consolidation. Washington, DC: ERIC, National Institute of Education US Department of Health, Education and Welfare.
School Consolidation in India
The Ministry of Human Resource Development (MHRD) has acknowledged that surplus schools, that is, in excess of the neighbourhood requirement, have been established which are adversely affecting the provisioning of resources, teaching, and learning process, as well as monitoring and supervision.77
Department of School Education & Literacy, MHRD. (2017, July 7). Guidelines for rationasing small schools-F.No.12–4/2016-EE. New Delhi: Government of India.
However, these school consolidation attempts have been made in many states without a detailed study of the need for consolidation and potential impact on children in the local communities. A recent study by Srinivasa Rao, Sriti Ganguly & Roma Ranu Dash on school closures and mergers in the three states of Telangana, Odisha and Rajasthan highlights how this closure impacts access to schools for marginalized sections and remote habitations.78
Little, A. W. (2008). Size Matters for EFA Research Monograph No 26’.
Srinivasa Rao’s study also reports that Odisha has adopted a clearer policy on school mainstreaming. Their norms for mainstreaming are:
1. Phase I (already executed): Schools with an enrolment of five or less than five children to be mainstreamed (merged) with a nearby school. Transport and escort facility to be provided to the children. 2. Phase II (under consideration): Schools with an enrolment of 10 or less than 10 children to be mainstreamed (merged) with a nearby school.
The Odisha policy proposes to attach a Shiksha Sahayak [Teaching Assistant] to ensure smooth transition from the closed to mainstreamed schools. Teachers that were posted in the now-closed schools are to be posted to the nearest school where children are mainstreamed so that these children are provided additional attention. The infrastructure of the now-closed school (if any) is to be handed over to the concerned gram panchayat and will be managed by the villagers. The policy also assures villagers that, if required, the school will start operating again (demerged).79
Odisha Primary Education Programme. (2015). Office order on school consolidation (GO - No.2365 (30)/Access/15/M (CEGSCF) - 319, dated 27 February 2015). Bhubaneswar: Author.
According to the study, Telangana’s policy for school rationalization requires schools without any enrolment to be merged to the neighbouring school. Schools with 1–19 student enrolments are to be merged with a school within walking distance of 1 km of the neighbourhood area. In tribal areas, schools without enrolment or with 1–19 student enrolments are to be merged with the nearby schools including schools under tribal welfare department. The teaching posts are to be shifted to the respective managements. In case there are no tribal schools in the nearby area, the school may continue to operate, if the enrolment is at least 15. Surplus teachers during the mainstreaming are to be shifted to a primary or upper-primary school that requires resources. Telangana’s merger policy so far does not have any provision of transportation allowance.
GUIDELINES FOR SCHOOL REORGANIZATION
Any exercise around the restructuring of the public schooling needs to be crafted carefully with a broad perspective, as the outcomes may have several implications to access, quality, equity, and accountability issues. The focus should not be limited to physical access but the functionality of the school in terms of adequate number of trained teachers, physical and teaching infrastructure, and curriculum provision. The RTE Act norms on access go beyond the neighbourhood criteria and emphasize on such functional understanding of access. There is a pressing need to revisit the structure of schooling and think of ways to reorganize schools through school consolidation and optimal school location to ensure access—with functional infrastructure and quality teaching–learning environment—and to enable rete-ntion of the child until the completion of schooling.
School location decisions have to be taken to account with optimal match of schooling demand with supply in the neighbourhood without compromising the functional access. School consolidation should ensure vertical integration across different categories (primary, upper-primary, and secondary) to address the continuum of schooling, and pooling of teaching and infrastructural resources. Diversified strategies need to be adopted to address the specific needs of urban, rural, tribal, and remote locations. Our pilot studies indicated that in cities, better utilization of teachers and infrastructure resources could be made by consolidating schools in the neighbourhood without compromising on access. In rural areas, our preliminary findings showed that many neighbouring government LPS, HPS, and secondary schools, within 3 km radius, can be converted as a school complex. This may lead to an access to schooling with better infrastructure and ease of access to higher levels/stages of schooling. This may ground well the enrolment, address issues around multi-grade teaching, and issues related to monitoring, thereby ensuring accountability. In tribal areas, however, careful consideration and consultation needs to be undertaken about shifting of enrolment to schools with better infrastructure, before consolidation exercise is actually taken up.
School consolidation should not result in denying access to school to any child. A detailed planning for consolidation based on secondary data, child mapping, and mandatory consultations with all the stakeholders as well as the local governance institutions should be carried out. All possible transportation options should be explored, in case the consolidated school leads to difficulty in physical access to school. Financially empowered local committees could be set up to look into any transitory problems that may arise during the process.
The centre, state, and the local governments should act as facilitators for consolidation and desist from making a one-size-fits-all approach. Consolidation should be a local exercise, best decided by local authorities. They should be empowered to take decisions regarding consolidation after careful assessment of the need at the local level in consultation with the teachers, parents, and the community. The state government should act as facilitators to the process of school rationalization by providing school data analytics and visualization platforms, capacity-building of local authorities, and financial support.
From a supply-driven state-owned provision of financial services to the excluded, the country has significantly moved in making financial inclusion a larger agenda. If we were to look at financial inclusion from the time of Independence onwards, we can possibly break this up into four phases: the first phase of co-operativization; the second phase of bank nationalization; the third phase of institutional tinkering, and the fourth phase of providing a framework for private sector participation and bank-led initiatives. The current and the fourth phase, in which we currently are, is opening up multiple possibilities both in terms of the technology adopted in the financial inclusion space as well as the institutional infrastructure. In this article, we will briefly describe the earlier phases and discuss in detail the last phase.
Historically, the efforts of the state to bring the poor into the banking system has worked at multiple levels, without sharp definitions and, therefore, has resulted in creating opportunities for inclusion rather than having a focused and planned approach to inclusion. It is important to recognize this continuing fallacy and define the aspect of inclusion sharply, if we were to ensure that the institutional and technological archi-tecture has to work for the poor.
Phase 1: Local Institutions; Agriculture; Credit is Inclusion
The first phase can be termed as the phase from Independence all the way up to bank nationalization. Following the report of the All India Rural Credit Survey Committee report in 1954, there was much state support for promotion of primary agricultural co-operative societies that were spread across the length and breadth of the country. At its peak, there were nearly 100,000 rural co-operatives, federated into district co-operative banks and further federated into a state co-operative bank. The idea and thrust during that phase was that the state would partner with people in promoting co-operatives, but once the co-operatives were large enough, then it was expected that they would run on their own and the state would withdraw from active participation. However, the state continued the function of refinancing the co-operatives through the central bank.
The entire paradigm of these institutions were centred around trying to get the poor out of the clutches of the ‘evil’ moneylender. People’s institutions would empower them, and they would manage their own institutions. The focus was (a) rural, (b) agriculture, and (c) credit. In a way, these three buzzwords were used as a proxy for solution to exploitation, poverty, and providing empowerment. It did achieve the overall objective in some sense. The successive debt and investment surveys showed that the relative share of co-operatives increased in comparison to the informal money lenders as far as rural indebtedness was concerned.
Phase 2: Rural Branches; Agriculture; Priority Sector; Weaker Sections
The second phase started with the nationalization of banks, wherein the state took over the largest banks in two instalments: the first in 1969 and the second in 1980. The idea again was largely focused on making credit available. It was a recognition of the fact that possibly co-operatives had reached their potential and there needed to be a more impactful measure. For a good measure, by nationalizing the banks, the state took direct control of the institutions, unlike the co-operative structure which was under the control of the state—off and on, when administrators were appointed intermittently between elected boards. The state thus controlled not only the policy but also the operations.
Most of the credit-based interventions—particularly the Integrated Rural Development Programme (IRDP)—were routed through the banks, with the beneficiaries for credit being identified outside of the banking system. In addition, the focus was also on improving the reach of the physical infrastructure—by controlling the branch licencing policy and also the portfolio by establishing priority sector lending targets.
The initiative did yield results, with the relative share of the banking sector improving and replacing the informal sector. Over a period of time, the banking sector started gaining at the cost of both the informal sector and the co-operatives until about the turn of the century.
Phase 3: Rural Focused Institutions; Agriculture; Local Touch
The Phase 3 overlaps with Phase 2. While the second round of bank nationalization came in 1980, the design of a new type of institution, which distilled the learnings of Phase 1 (co-operatives, local institutions) and Phase 2 (banks, professionally managed institutions), were put together. This resulted in the design of a new type of institution—the Regional Rural Banks (RRBs). These were smaller in number—about 196 in all with more than 10,000 branches which later expanded to around 15,000 branches. The institution was expected to be larger than a local co-operative, but more local than a commercial bank. They had a higher target for priority sector lending and agriculture, and restrictions on moving to urban areas. While the institution did make more credit available to the people, the overall structure was never in the best of health. The structure needed significant doses of recapitalization and restructuring. One major contribution of the RRBs was that it addressed the regional skew in bank branch presence. The rural–urban quota given increased the number of rural branches, but did not address the issue of regional imbalance significantly. It was only after the promotion of RRBs that the regional issues were addressed to an extent.
Phase 4: Bank Penetration; Institutional Design; Credit Through Micro Credit; Opening of Accounts; Benefit Transfers; Digitization
The fourth phase starts with the liberalization of the economy and moving towards market structures. The first of the moves was to open up the banking to the private sector. In the first round of new private sector banks, 10 new banks were set up. However, while there was some rhetoric on inclusiveness, the policy architecture did not move towards a great thrust towards inclusiveness. The requirement for physical branches to be located in rural areas were not implemented. The only requirement of the license was about total computerization from start and application of the requirement of priority sector lending requirements—as they were applicable to the other banks. This was a perfect occasion for generating data to study the impact of branch licensing policy, which was done effectively by Burgess and Pande,80
Burgess, R., & Pande, R. (2005). Do banks matter? Evidence for Indian social banking experiment. The American Economic Review, 95(3), 780–795.
In keeping with the larger approach to liberalization, the RBI did not encourage any new state-led institutions in the inclusive finance sector. The last of the institutional intervention was the carving out of the agricultural refinance department from the RBI as an autonomous institution the National Bank for Agriculture and Rural Development. The only other institutional initiative taken by the RBI during this phase was to license a new institution called the Local Area Bank, which was a private sector version of the RRBs. While about 10 institutions were considered for licensing, ultimately 4 of them survived.
It was during this phase that the most significant initiatives outside of the state started experimenting. The voluntary sector came up with the new self-help group programme, which focused on women and the poor. This was the target that the state in any case wanted to reach out, and the fact that it came about voluntarily seems to have pleased the state. A quick recognition of this activity was made and later the programme was co-opted into the state’s welfare schemes. The IRDP Programme which was implemented through the banks was redesigned with the groups also playing an important part in the last mile delivery. From IRDP to SwarnaJayanti Swarozgar Yojana to National Rural Livelihoods Mission (the present programme), the targeting was sharper, the scheme better, and the delivery moved to the groups.
It was a little later that another set of voluntary agencies tried out the model propagated by the Grameen Bank of Bangladesh. This model also deployed group methodology, targeted poor women, and made credit accessible. Unlike the self-help groups, which started with savings, the Grameen model focused on standardized delivery of small amounts of credit for augmenting livelihoods by targeting women beneficiaries. This model turned out to be efficient, successful, and lucrative, and thus the private sector participation in the field of inclusive finance opened up.
The regulators allowed the private sector inclusive finance to grow without a specific regulatory framework. While there were instances that should have triggered a regulatory intervention several times, given that the vulnerable clients were being subject to exchanges without a well-articulated customer protection framework, the regulatory framework showed forbearance until one of the state governments (the undivided AP) passed an ordinance regulating the operations of the microfinance institutions. Simultaneously, the articulation of the regulator expanded the definition of financial inclusion from a mere provision of credit services to a much larger bouquet of services. However, the regulatory approach seemed to be largely in the direction of providing a regulatory support/forbearance to the private sector non-bank initiatives while encouraging the banks, largely public sector, to continue the agenda of inclusion. From having an agenda of just tinkering around with priority sector credit, the regulator moved to a different approach on the supply side which was more sharply defined and the following steps were taken (not necessarily sequentially):
1. The quotas for rural-unbanked locations were re-introduced with the requirement that 25 per cent of all the branches of commercial banks should be established in rural and semi-urban-unbanked locations; 2. All the habitations which had a population of more than 2,000 were identified and allocated to banks with a requirement to establish a banking touch point in each one of these (with the facility to exchange the location of the obligation allocated bank to another on a reciprocal basis); 3. A framework for extension banking through outsourced models of agents and correspondents was put in place; 4. The national project of creating a biometric identity for every resident was leveraged to create transaction efficiency at the account opening and authentication instances; 5. The priority sector lending targets were sharpened to include sub-classifications of marginal farmers and micro enterprises, with a refinance agency created for micro enterprises; 6. The massive PMJDY was launched, which brought people to the bank to open accounts on a mission mode by providing incentives; 7. The transaction intensity in these accounts was addressed by converting some subsidies to cash and depositing it in the new accounts; and 8. New institutions such as the small finance banks (unlike the local area banks, these have a national footprint) and payments banks (specialized institutions for doing remittances and collecting savings) were permitted to be established in the private sector.
As we can see, in the earlier decades, the policy and regulatory focus of the agenda was supply-driven and institution-specific, and largely in the public sector. In the past two decades, we have moved to a multi-pronged approach of providing a framework for private sector to grow unregulated in the first instance and then control them, and providing non-sequential policy directions to the state-owned banks for carrying forward the idea of inclusion. The costs of implementing these directives have not been discussed widely and have devolved on to the banking institutions.
At this juncture, we seem to have a good architecture in place, the technology of inclusive banking is evolving, and a liberal regulatory framework is in place. If the state can sequence its agenda and phase it out with a clearly defined vision and focus, much consolidation could happen. The bits and pieces of the jigsaw are strewn all over the place; there needs to be the painful process of consolidation so that we get a good picture of the achievements and the residues.