Abstract
Executive Summary
Indian states have been facing traffic related issues including traffic congestions and accidents for decades. The situation has worsened with time due to the increasing population. This article investigates the causes behind the accidents and provides recommendations and measures that would bring forth an improvement in the traffic conditions.
The research uses forecasting models to confirm the existence of traffic problem in the State of Kerala. The various reasons for the accidents were enumerated and classified. Using regression models, the relationship between the number of accidents, deaths, and injured were obtained. In addition, the relationship between the number of accidents and the number of vehicles on road were examined along with the type of vehicle, design of the roads, the design of traffic, and the design of road network.
In addition, a simulation model is presented to study the effect of the change in design of roads on the traffic situation. As an example, a 15-minute time period can be used to count the number of vehicles of each type (buses, cars, and trucks) travelling in both directions on a major highway. This data can then be categorized into slow and fast moving traffic. The Mean time between arrivals, percentages of slow and fast vehicles, percentages of vehicles travelling in both directions can be calculated and used in ARENA simulation software to perform discrete event simulation. Various scenarios are simulated; and waiting times and potential number of accidents are found for each of the scenarios.
Based on forecasting, regression and simulation models, this article provides several recommendations and managerial insights, which are believed to alleviate the traffic problems in the State of Kerala. The solution approaches from this research could be used for addressing similar traffic situations in other states of India, which could result in saving millions of lives over the next decade.
LITERATURE REVIEW
There is extensive literature in the area of fatalities related to traffic. We first present the research articles from the Western countries and then discuss those from India, as the vehicle types and traffic conditions are significantly different in both contexts.
Clarke et al. (2010) studied a sample of 1,185 fatal accidents in 10 UK police jurisdictions during the years 1994–2005. They showed that the primary causes of accidents were excessive speeding and drunken driving with the drivers having alcohol levels beyond the permissible limit. In addition, the young age of the drivers, driving in the night, and the failure to wear seat belt are contributors to these fatalities. Gjerde et al. (2011) studied 204 fatally injured drivers in South-eastern Norway from 2003–2008. The risk for fatal injury in a road traffic accident was estimated using logistic regression adjusting for gender, age, season of the year, and time of the week. They showed that the risk for fatal accidents was high with intake of multiple drugs or alcohol by the drivers. Spoerri, Egger, and Von (2011) examined socio-demographic and geographical determinants of road traffic accident mortality in Switzerland by linking 2000 census data to the mortality records from 2000–2005. Data from 5.5 million residents aged 18–94 years, 1,744 study areas, and 1,620 accidental deaths were analysed, including 978 deaths (61.2 per cent) among motor vehicle occupants, 254 (15.89 per cent) among motorcyclists, 107 (6.69 per cent) among cyclists, and 259 (16.21 per cent) among pedestrians. Weibull survival models and Bayesian methods were used to calculate hazard ratios (HR) and standardized mortality ratios (SMR) across study areas. They showed a u-shaped relationship with age in motor vehicle occupants and motorcyclists. For cyclists and pedestrians, mortality increased after the age of 55 years. Mortality as a function of education (primary, tertiary) and civil status (single, married) was also discussed. They suggested that preventive efforts should aim to reduce inequities across socio-demographic and educational groups, and across geographical areas, with interventions targeted at high-risk groups. Ayuso, Guillén, and Alcañiz (2010) used multinomial logistic regression to analyse accidents with victims and calculate the influence of different types of traffic violations on the probability of having a serious or fatal accident, compared to a smaller accident. The data for this study was based on accidents that occurred in Spain from 2003 to 2005. The average cost per victim and the average number of victims per accident were then used to find the estimated cost of an accident with victims, given the information on the type of traffic violation incurred. They presented some recommendations on the severity of penalties, and suggested that regulators penalize the occurrences of some specific combinations of traffic violations more rigorously.
In the Indian context, Mohan and Bawa (1985) attempted to understand fatal crash patterns in Delhi in the 1980s. The results of the study indicated that fatality patterns in Delhi were different from those in highly industrialized countries. Pedestrians, two-wheeler riders, and bus commuters comprised 80 per cent of the fatalities while motor-vehicle occupants comprised a small minority. The authors proposed some short-term and long-term safety countermeasures for Delhi which were significantly different from those in more industrialized high-income countries. Sahdev et al. (1994) undertook a study of road traffic fatalities in South Delhi to determine the injury patterns and incidence of deaths that could be prevented by optimal utilization of available medical resources. According to them, the majority of the preventable deaths resulted from a failure to diagnose or treat an injury and that an improvement in hospital management of intracavitory hemorrhage could prevent 70 per cent of the deaths. Sood (1988) studied the different factors influencing the fatality of injury among two-wheeler motor accidents. One key observation was that the helmet users had a much lower incidence and severity of head injury than the riders who did not use helmets. Jain et al. (2009) studied the trend of two-wheeler accidents over the period, 2000–2004, with respect to age and sex of the victim, type of injury sustained, type of vehicle involved, and time distribution of accidents. Among 1,231 accidents, 77 per cent of the victims were in the age group of 18–44 years, and the accident rate among males (83 per cent) was higher than those among females (17 per cent). They further concluded that the highest number of accidents occurred at a certain time of the day (6 p.m.–10 p.m.).
THE STUDY
This article contains three separate areas of analysis that are linked to each other in the following order:
(1) The first step was to evaluate the existing traffic accident problem in Kerala. This consisted of forecasting the number of accidents, number of people died in accidents, and number of people injured in accidents, using standard forecasting techniques. Time series models such as Moving Averages, Single and Double Exponential Smoothing, Winters’ Method, and Neural Networks were used. (2) The second step was to verify the impact of accidents. This was achieved by regressing the number of accidents with the number of deaths and the number of injured. Once the impact of accidents was measured, the factors contributing to the increase in the number of accidents were determined. To achieve this, regression analysis was performed with the number of accidents against the vehicle type, the number of vehicles, and the density of vehicles. In addition, regression was used to identify the relationship between the increasing number of vehicles on the roads and the accidents. Using data from all the states in India, another set of regression was done with the number of deaths against the number and type of vehicle. When the number of vehicles did not give a good regression coefficient, various transformations were applied on the number of vehicles, in search of a higher regression coefficient. Pareto analysis of accidents vs. vehicle type was used to determine the highest contributors to the accidents by vehicle type, and this information was then used in the regression analysis of vehicle type vs. number of deaths. The Pareto analysis also ranked the accidents by vehicle type which helped in focusing on accident causing vehicles. (3) The third step was to present a simulation methodology to redesign the road network which would reduce the traffic accidents significantly on national highways. We used Discrete Event Simulation models to study the effect of the change in the design of roads, traffic, and road networks on the traffic accidents. Here, the dataset was obtained by direct observation of traffic on a national highway. A 15-minute time period was used to count the number of vehicles of each type (buses, cars, and trucks) travelling in both directions on NH-47, a major highway in Kerala. This data was then categorized into slow and fast moving traffic. The mean time between arrivals, percentages of slow and fast vehicles, and percentages of vehicles travelling in both directions were calculated and used in ARENA simulation software to perform discrete event simulation. Various scenarios were simulated; and waiting times and potential number of accidents were found for each of the scenarios. Based on the analysis of these scenarios, we present several recommendations and trade-offs.
DATA
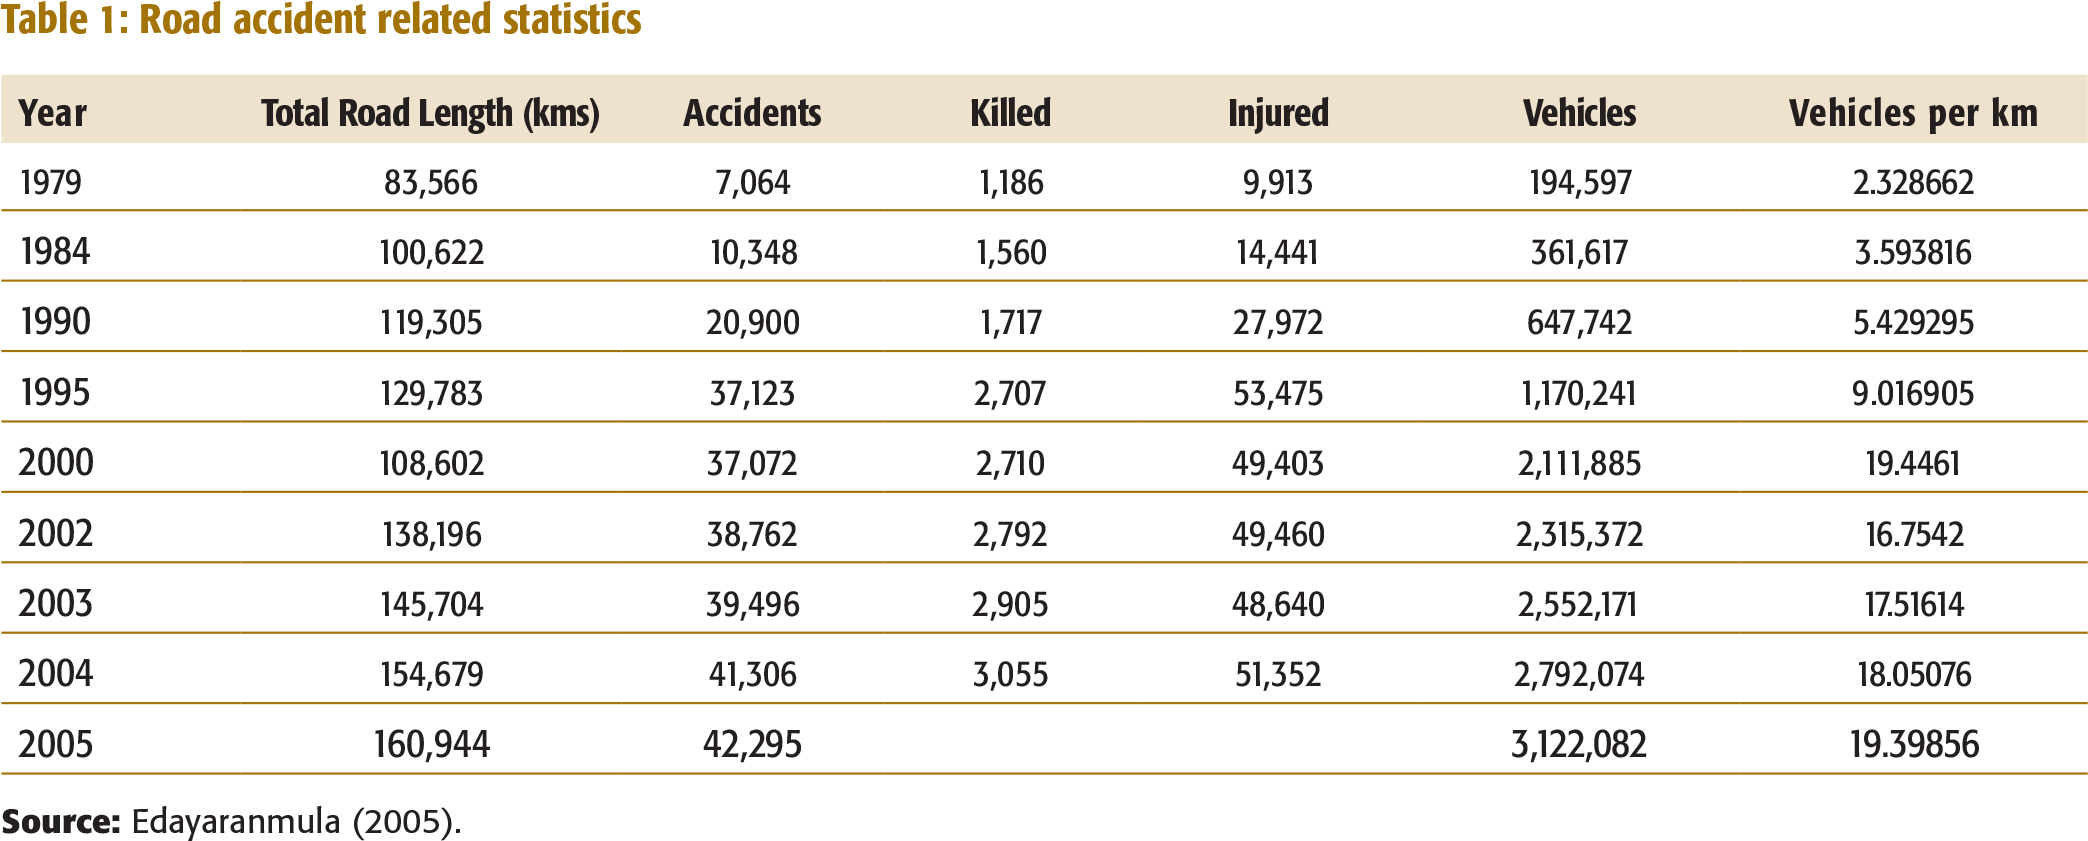
The data on road accidents, the number of deaths in accidents, and the number of people injured in accidents were obtained from online sources such as: Public Works Department, Government of Kerala and the Kerala State Crime Records Bureau. (Edayaranmula, 2005; Table 1, Appendix I).
The data collected from these sources were used for performing statistical analysis and making recommendations for reducing traffic accidents using forecasting, regression, and simulation models discussed above.
ANALYSIS
An analysis of the number of accidents, deaths, and injuries in accidents, using forecasting, regression and simulation techniques are presented below.
Forecast of Accidents
The data on the number of accidents in Kerala from 1990 to 2005 showed an increase over the years (Table 1, Appendix I). The number of accidents was forecasted based on the publicly available data from the State Crime Records Bureau, Kerala Police (Edayaranmula, 2005). A summary of errors for the various forecasting methods used to forecast accidents is given in Table 1.
Summary of errors – Forecast of accidents
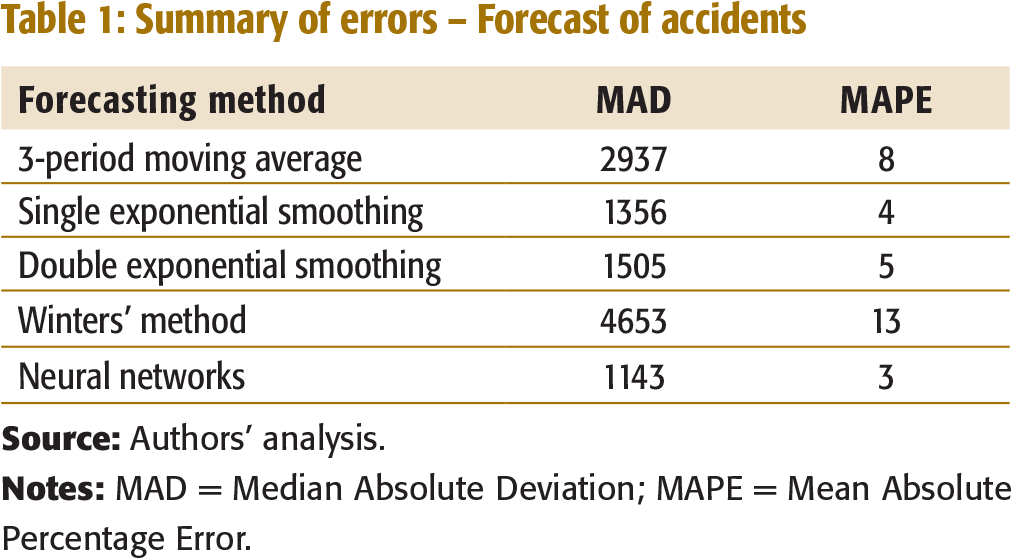
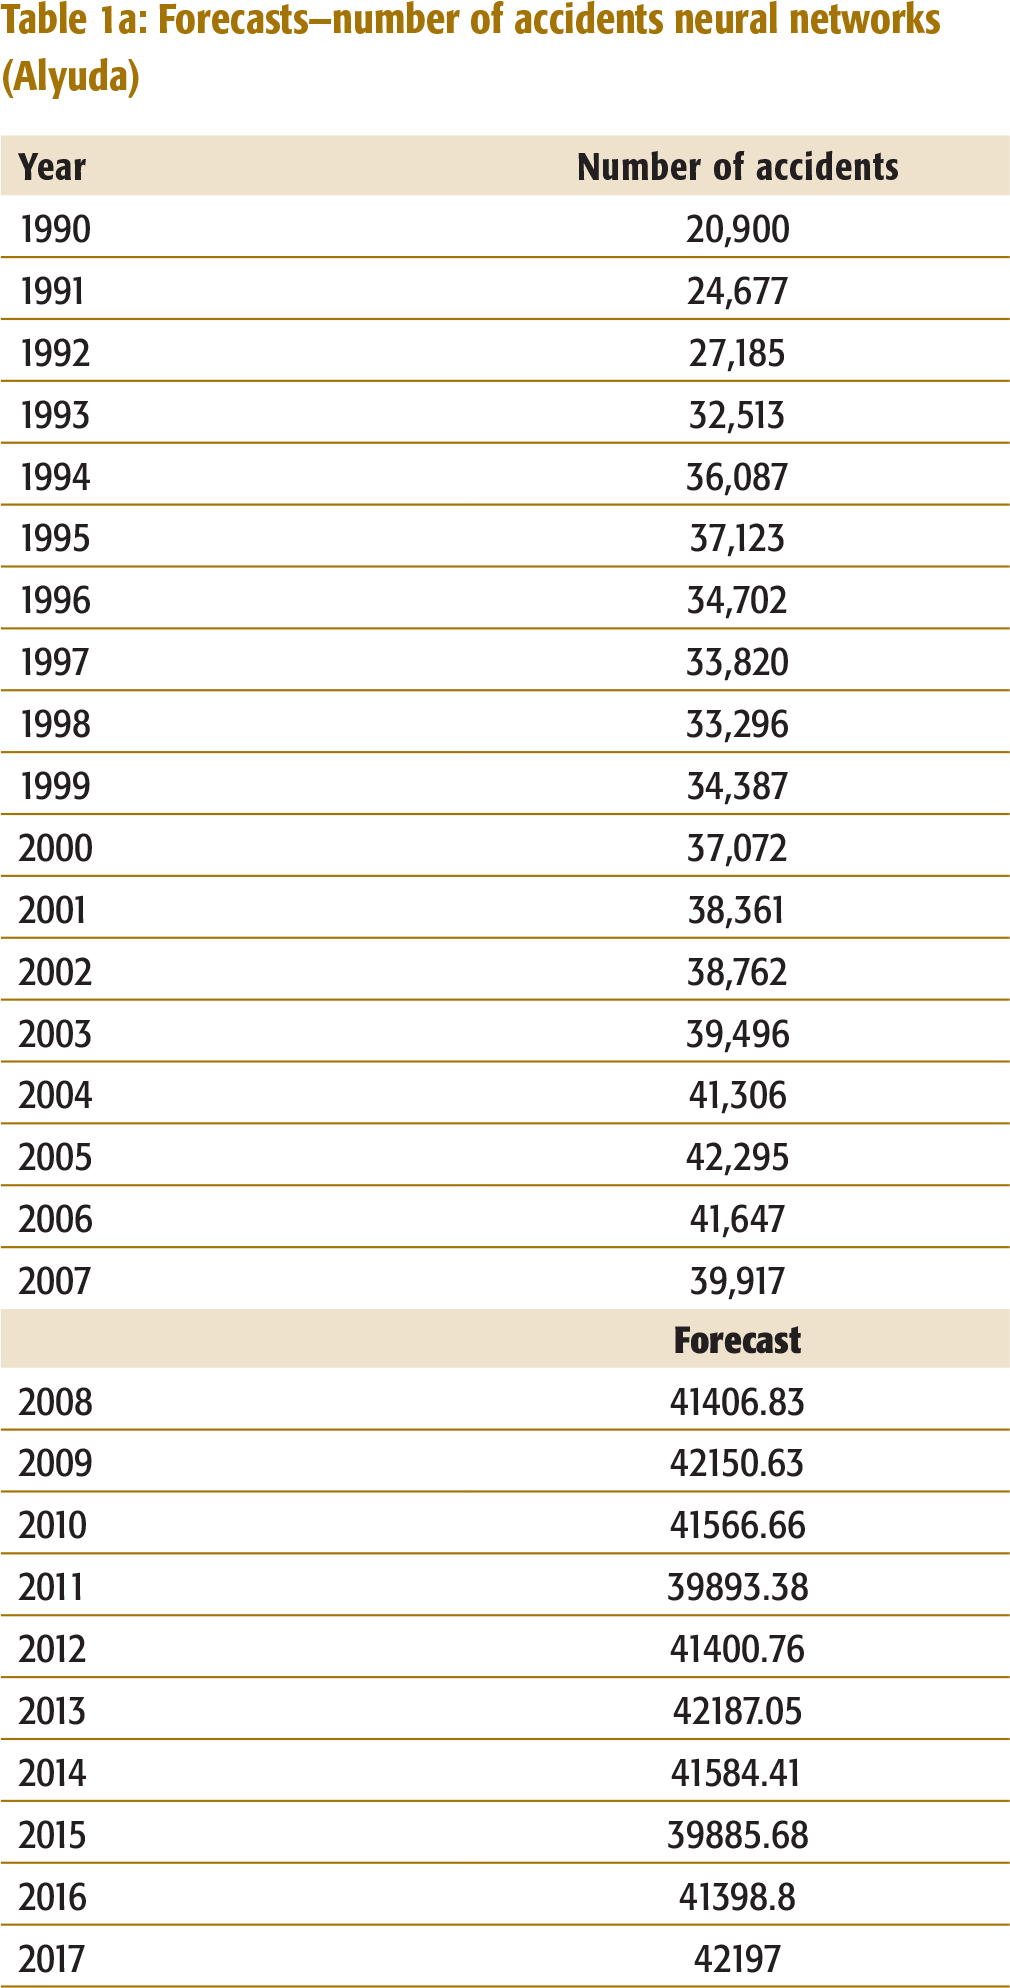
From Table 1, neural network method appears to be the best method for forecasting. The forecasting exercise indicates an increase in the number of accidents— 39,917 accidents in year 2007 to 42,197 accidents in year 2017; (Table 1a, Appendix I). If no measures are taken, the number of accidents will continue to increase.
Forecast of Number of Deaths in Accidents
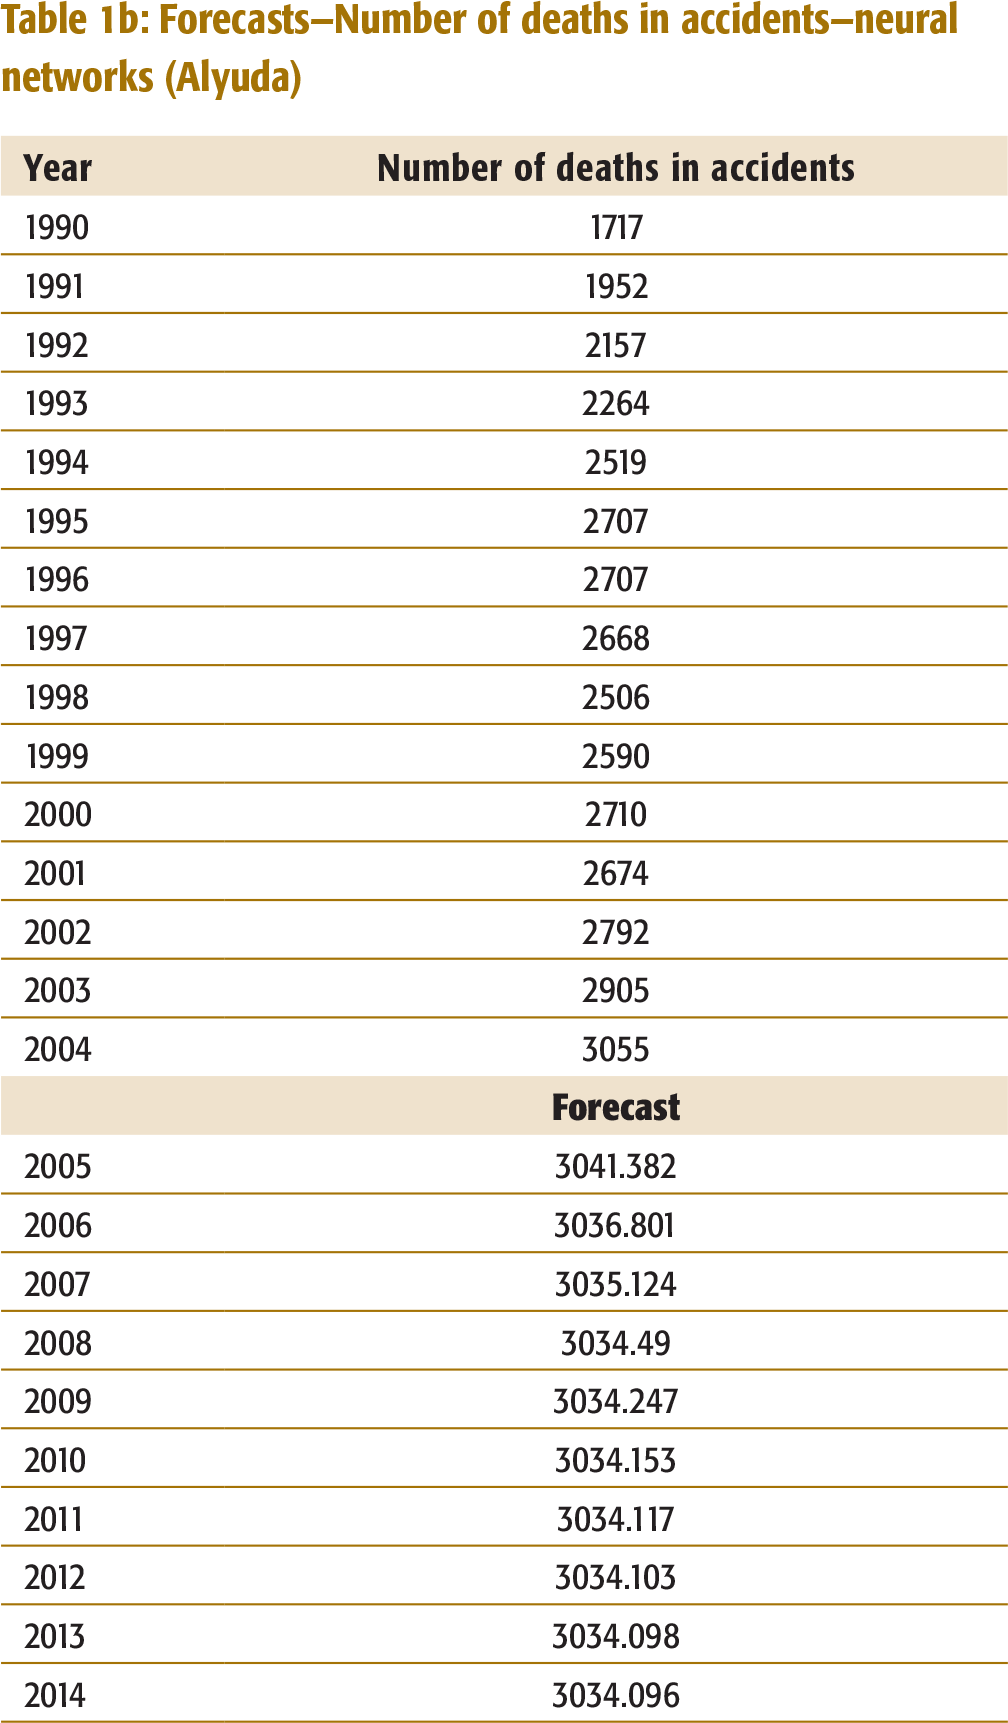
The number of deaths in traffic accidents in Kerala was forecasted with the same data and techniques used for forecasting the number of accidents. The actual data on the number of deaths has an upward trend from 1990 to 2004 with a downward dip from 1995 to 1998 (Appendix I, Table 1b). A summary of errors for the various forecasting methods used to forecast the number of deaths in the accidents is given in Table 2.
Summary of errors – Forecast of number of deaths in accidents
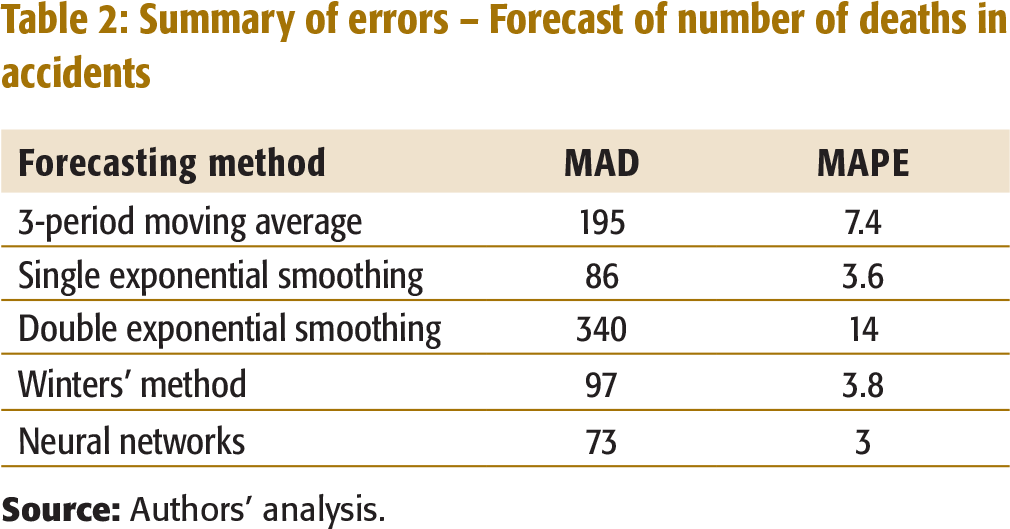
It can be inferred from Table 2 that neural network forecasting is the most appropriate method. The forecast using this method indicates that the number of deaths in accidents would remain at more than 3,000 per year for the next 10 years (Appendix I, Table 1b). The actual number of deaths in accidents for the years 2005 to 2007 substantiates this forecast.
Forecast of Number Injured in Accidents
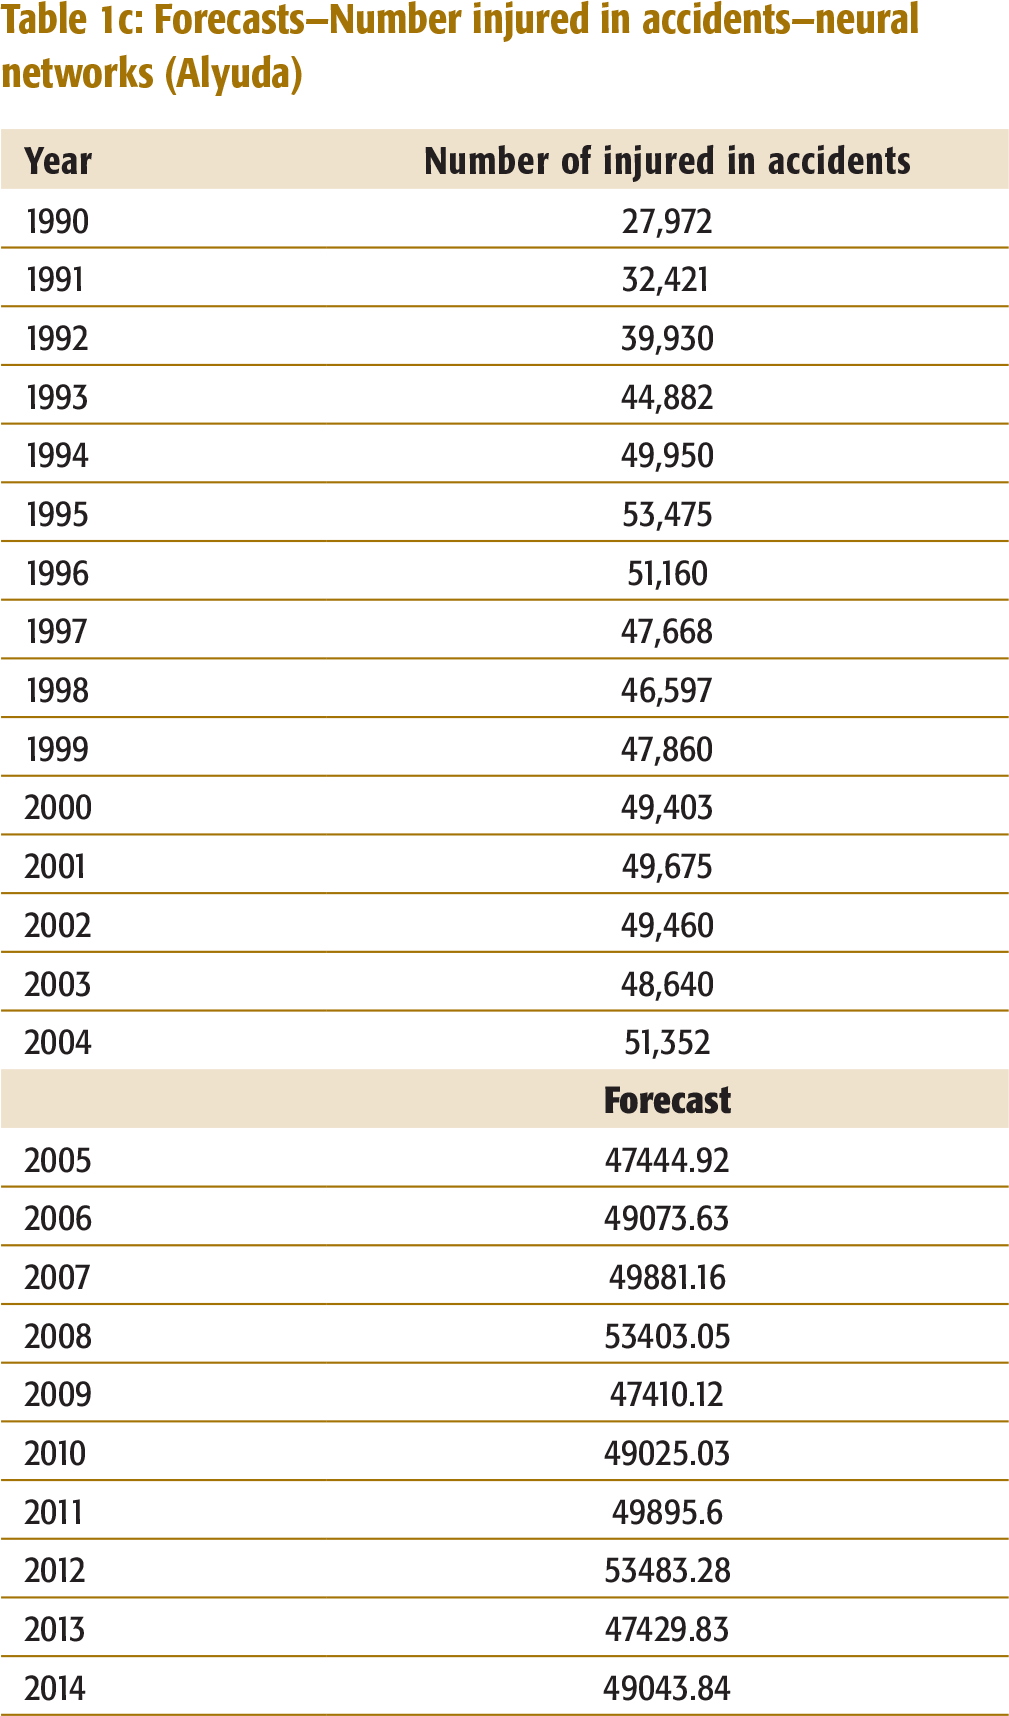
The actual data on the number of injured in accidents in Kerala has an upward trend from 1990 to 2004 with a downward dip during 1995–1998 (Table 1c, Appendix I). A summary of errors for the various forecasting methods used to forecast the number injured in the accidents is given in Table 3.
Summary of errors – Forecast of number injured in accidents
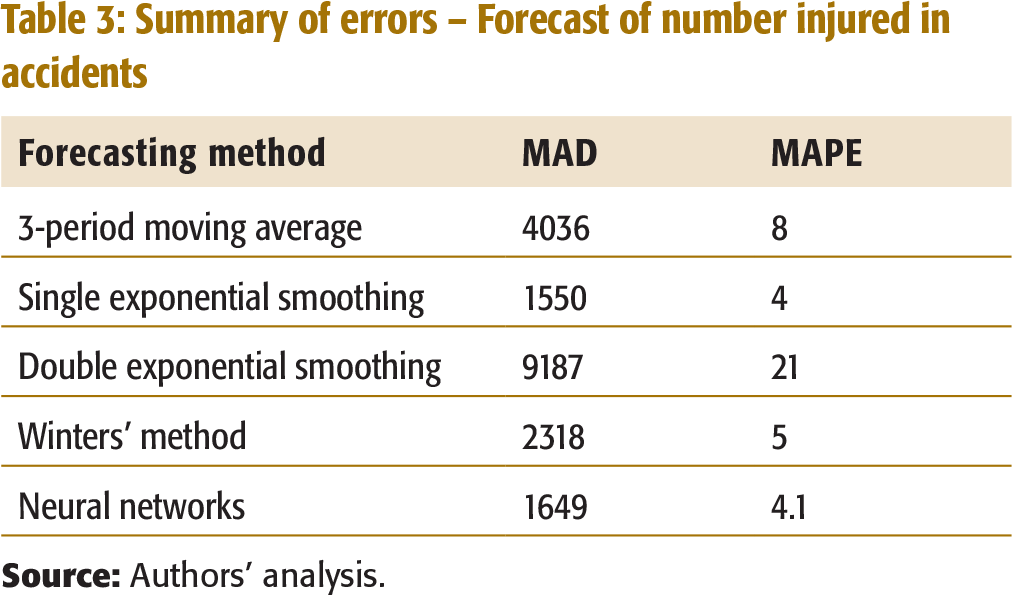
Based on the above MAD and MAPE, Single Exponential Smoothing method appears to be the most accurate. The forecasts using this method as well as the Neural Network method indicates that there is no significant decrease in the number of people injured over a span of 10 years.
Regression
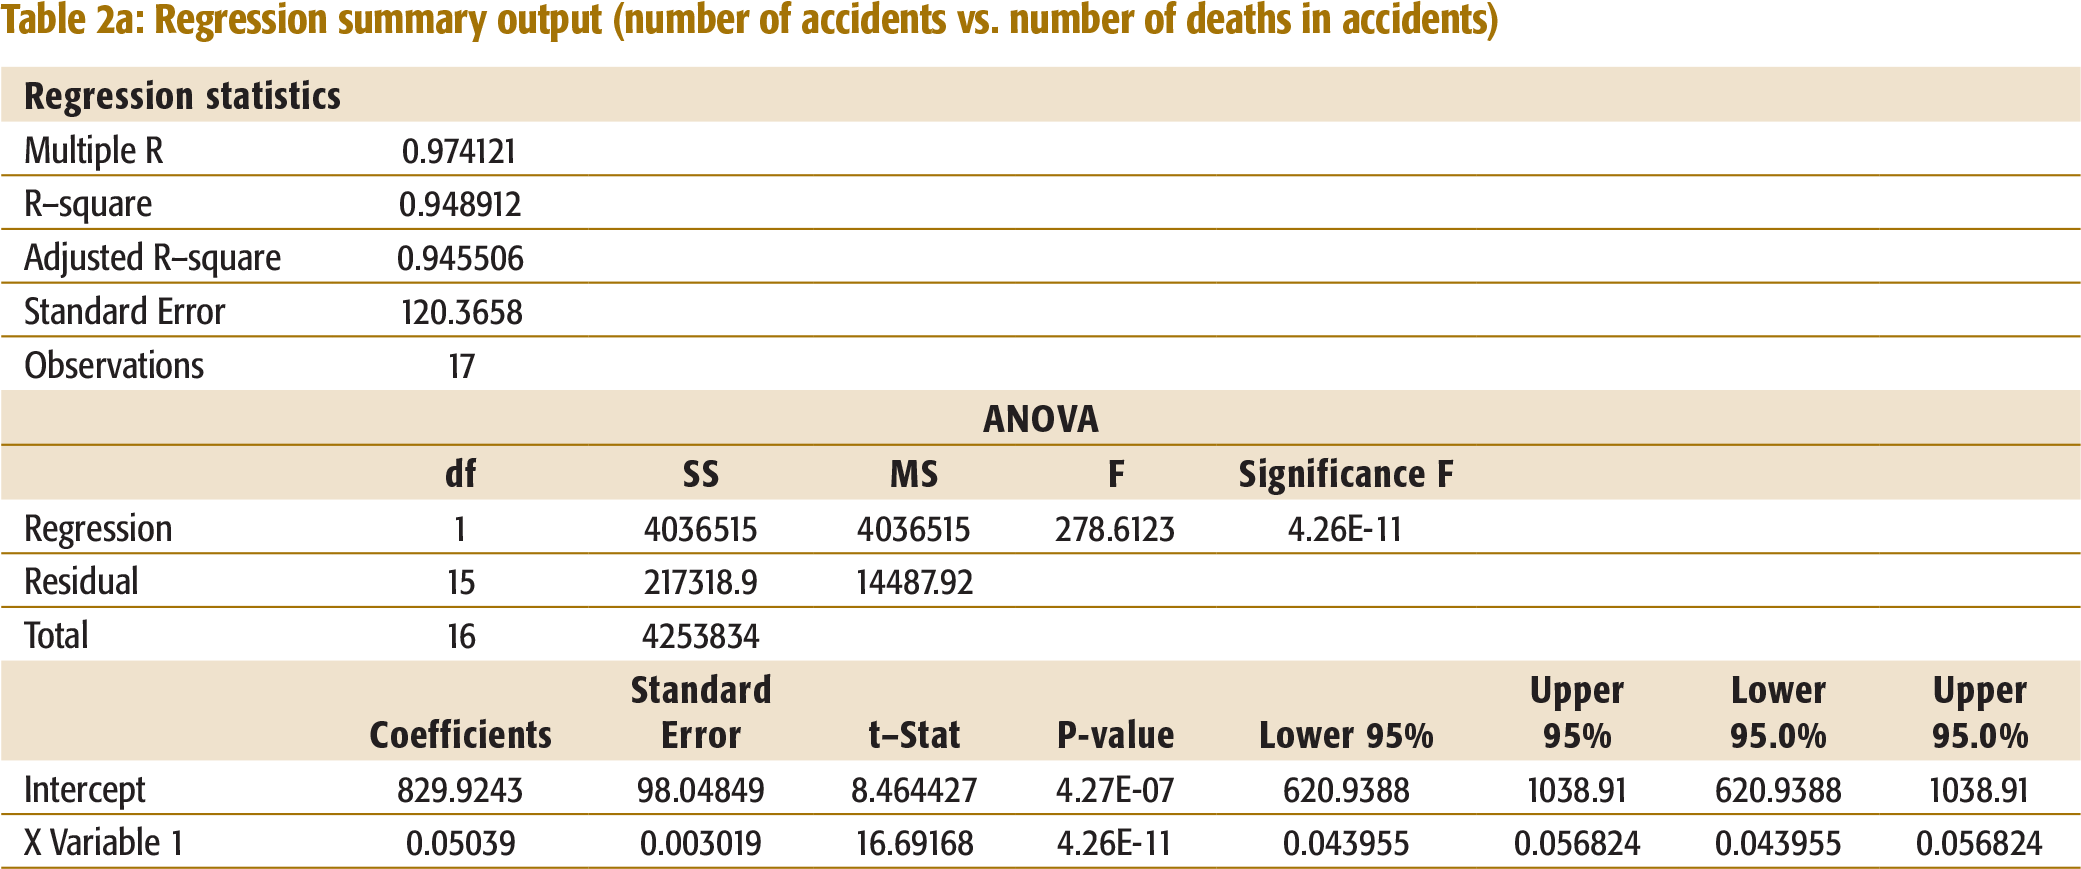
Number of Accidents vs. Number of Deaths
A regression analysis was performed to understand the relationship between Number of accidents and Number of deaths. An R-Square of 94.9 per cent confirms the general understanding that accident deaths are correlated to the number of accidents. The regression equation is:
Number died = 829.9243 + 0.05039 * Number of accidents.
This shows that the number of deaths increases with the increase in accidents (See Table 2a, Appendix I for summary regression output).
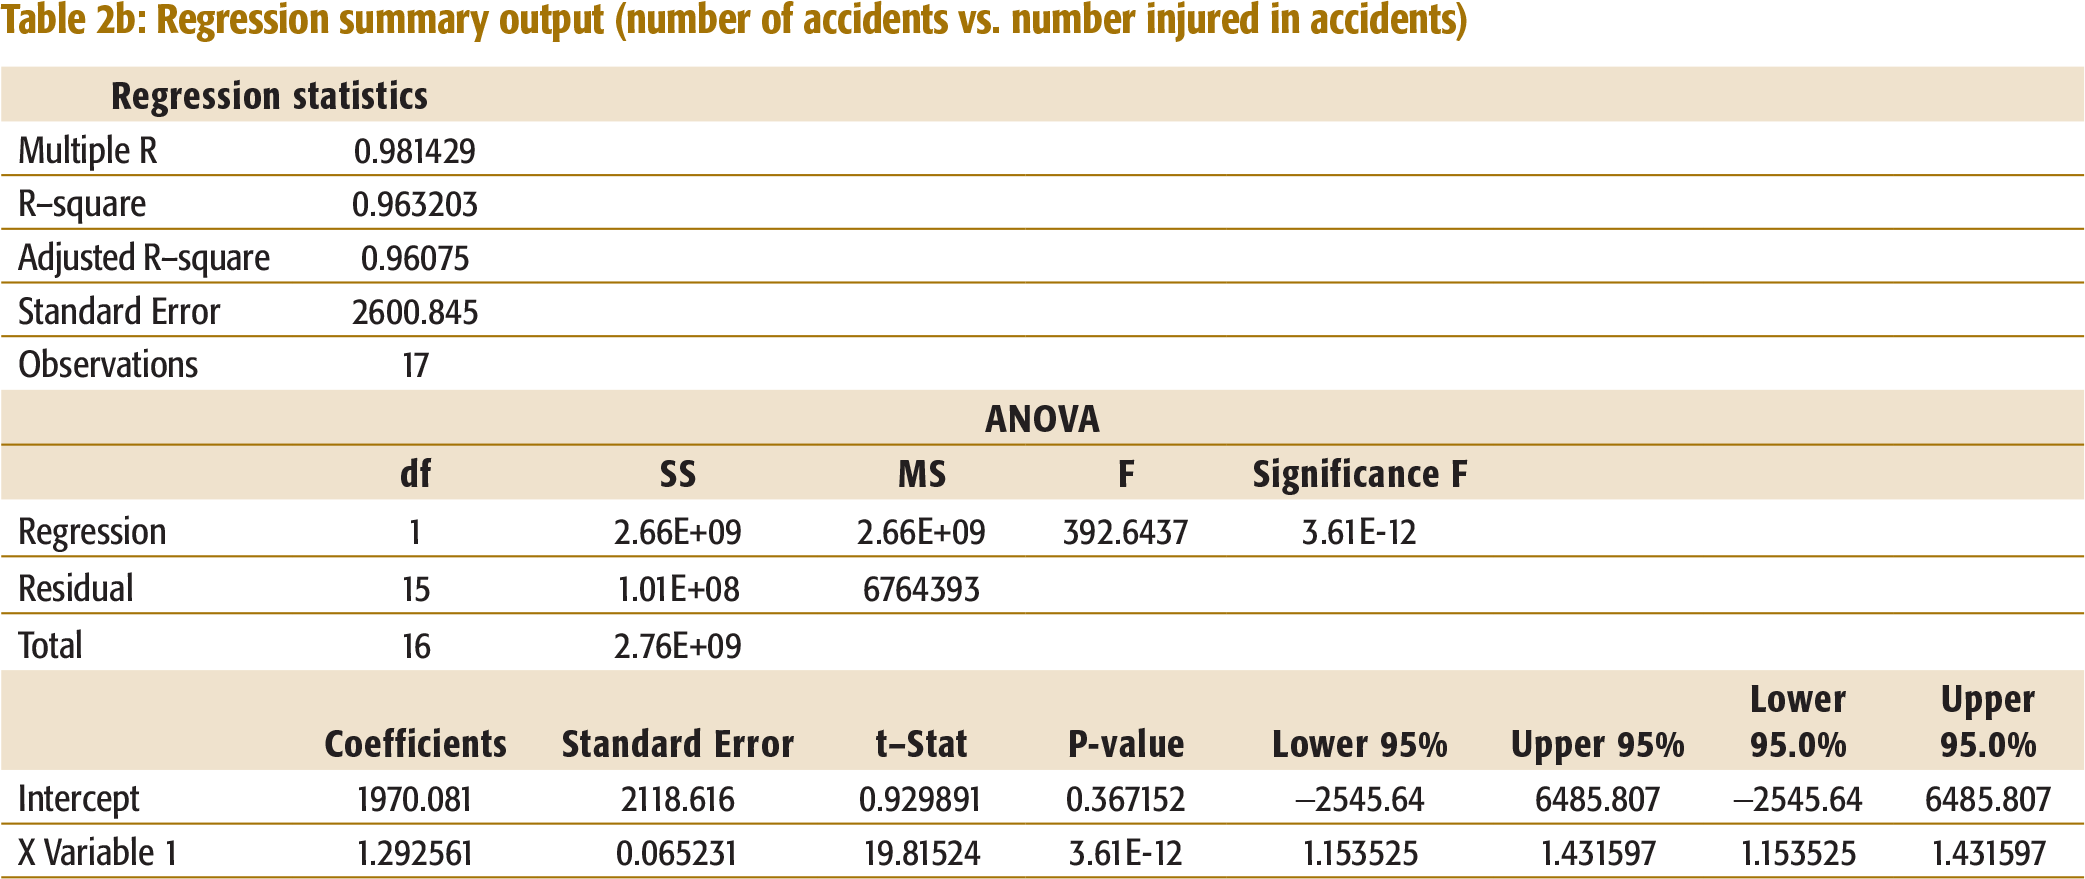
Number of Accidents vs. Number of Injured
An R-Square of 96.32 per cent confirms that accident injuries are correlated to the number of accidents. The regression equation is:
Number of injuries = 1970.081 + 1.292561 * Number of accidents
This shows that injuries increase with the increase in the number of accidents (See Table 2b, Appendix I for summary regression output).
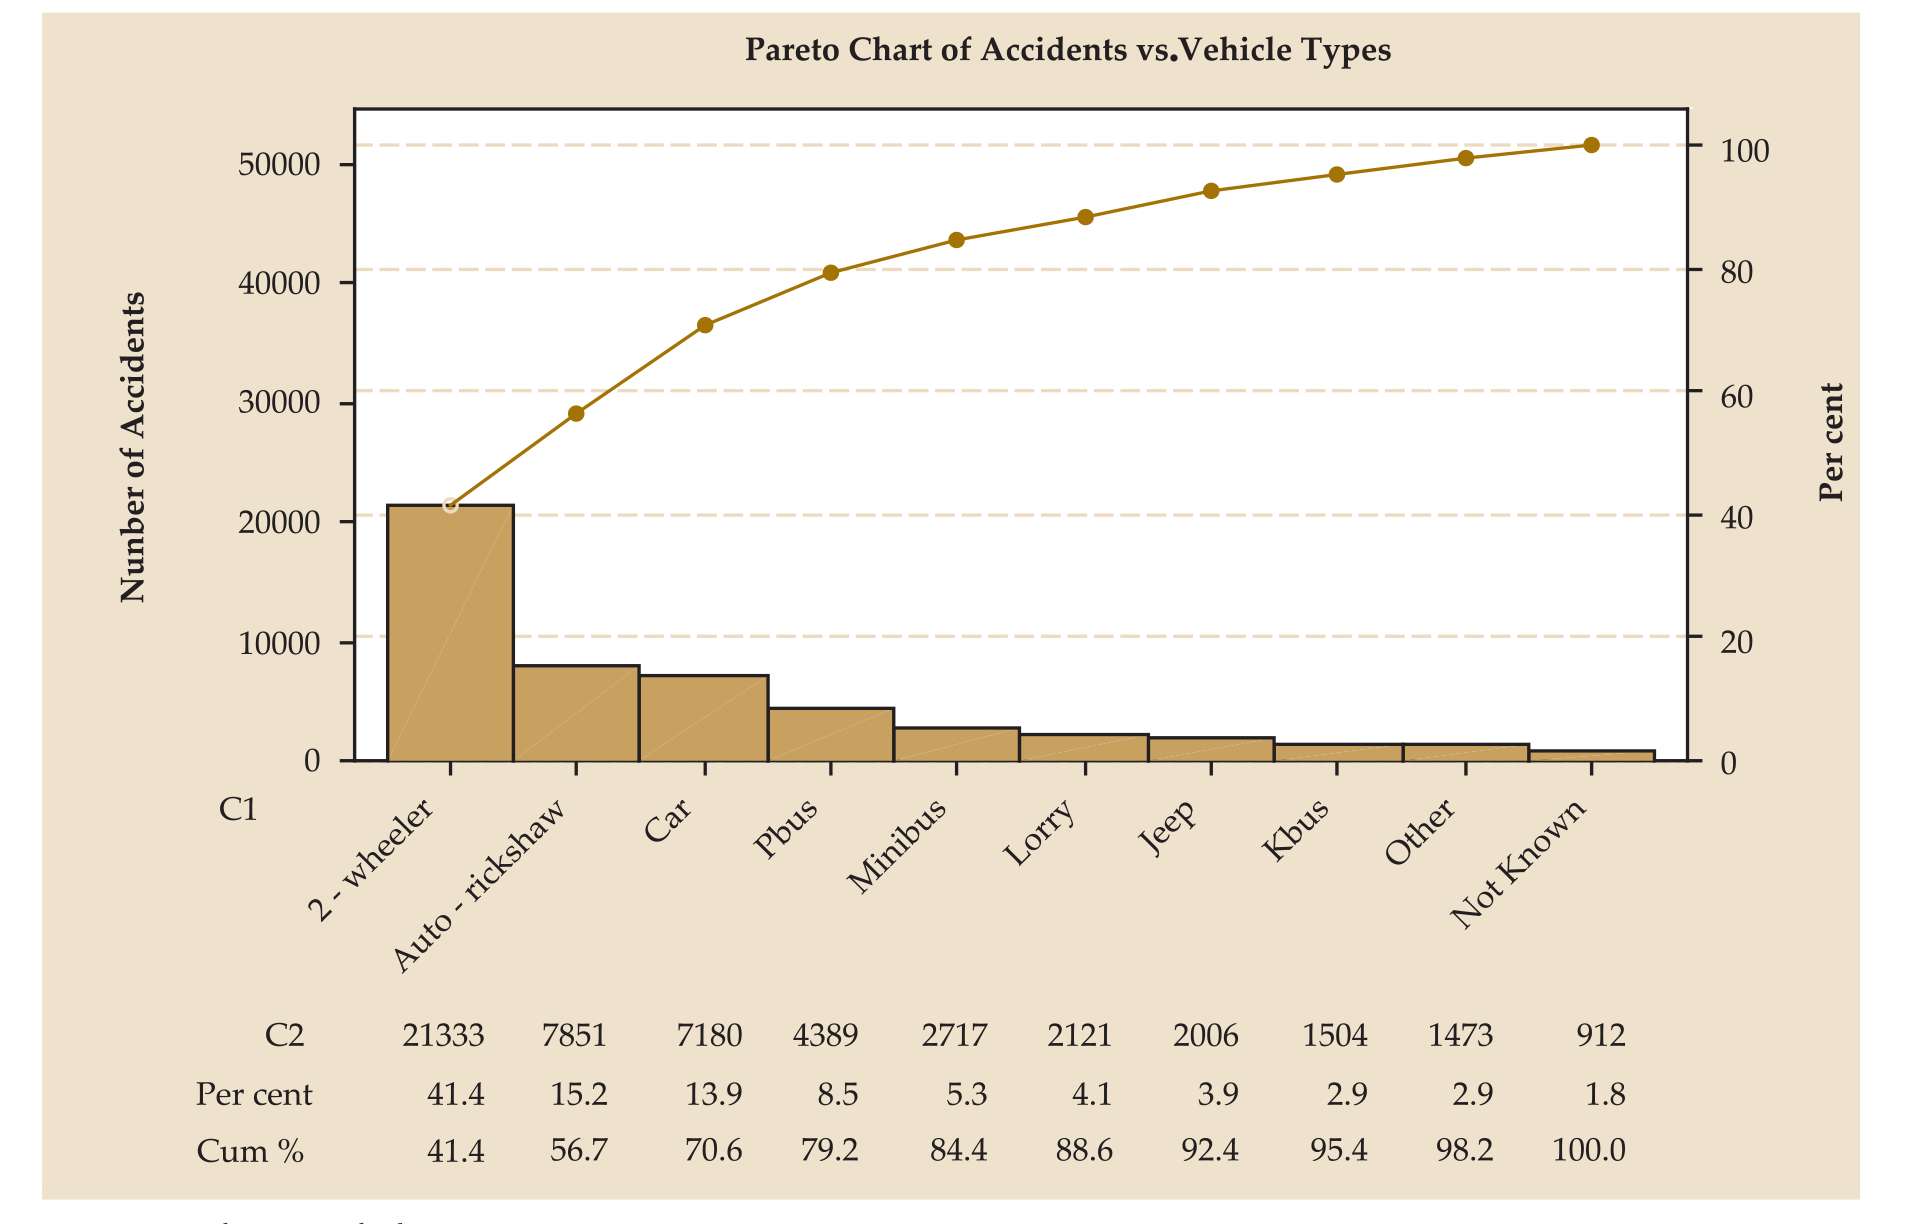
Pareto Analysis—Accidents vs. Vehicle Type
Figure 1 demonstrates the results of the Pareto analysis of the publicly available data (NATPAC, n.d.) to investigate the correlation between the number of accidents and the vehicle type.
As can be seen from the Pareto chart, two-wheelers contribute to 41.4 per cent of the accidents. Auto-rickshaws, cars, and private buses, add up to make 79.2 per cent of all accidents.
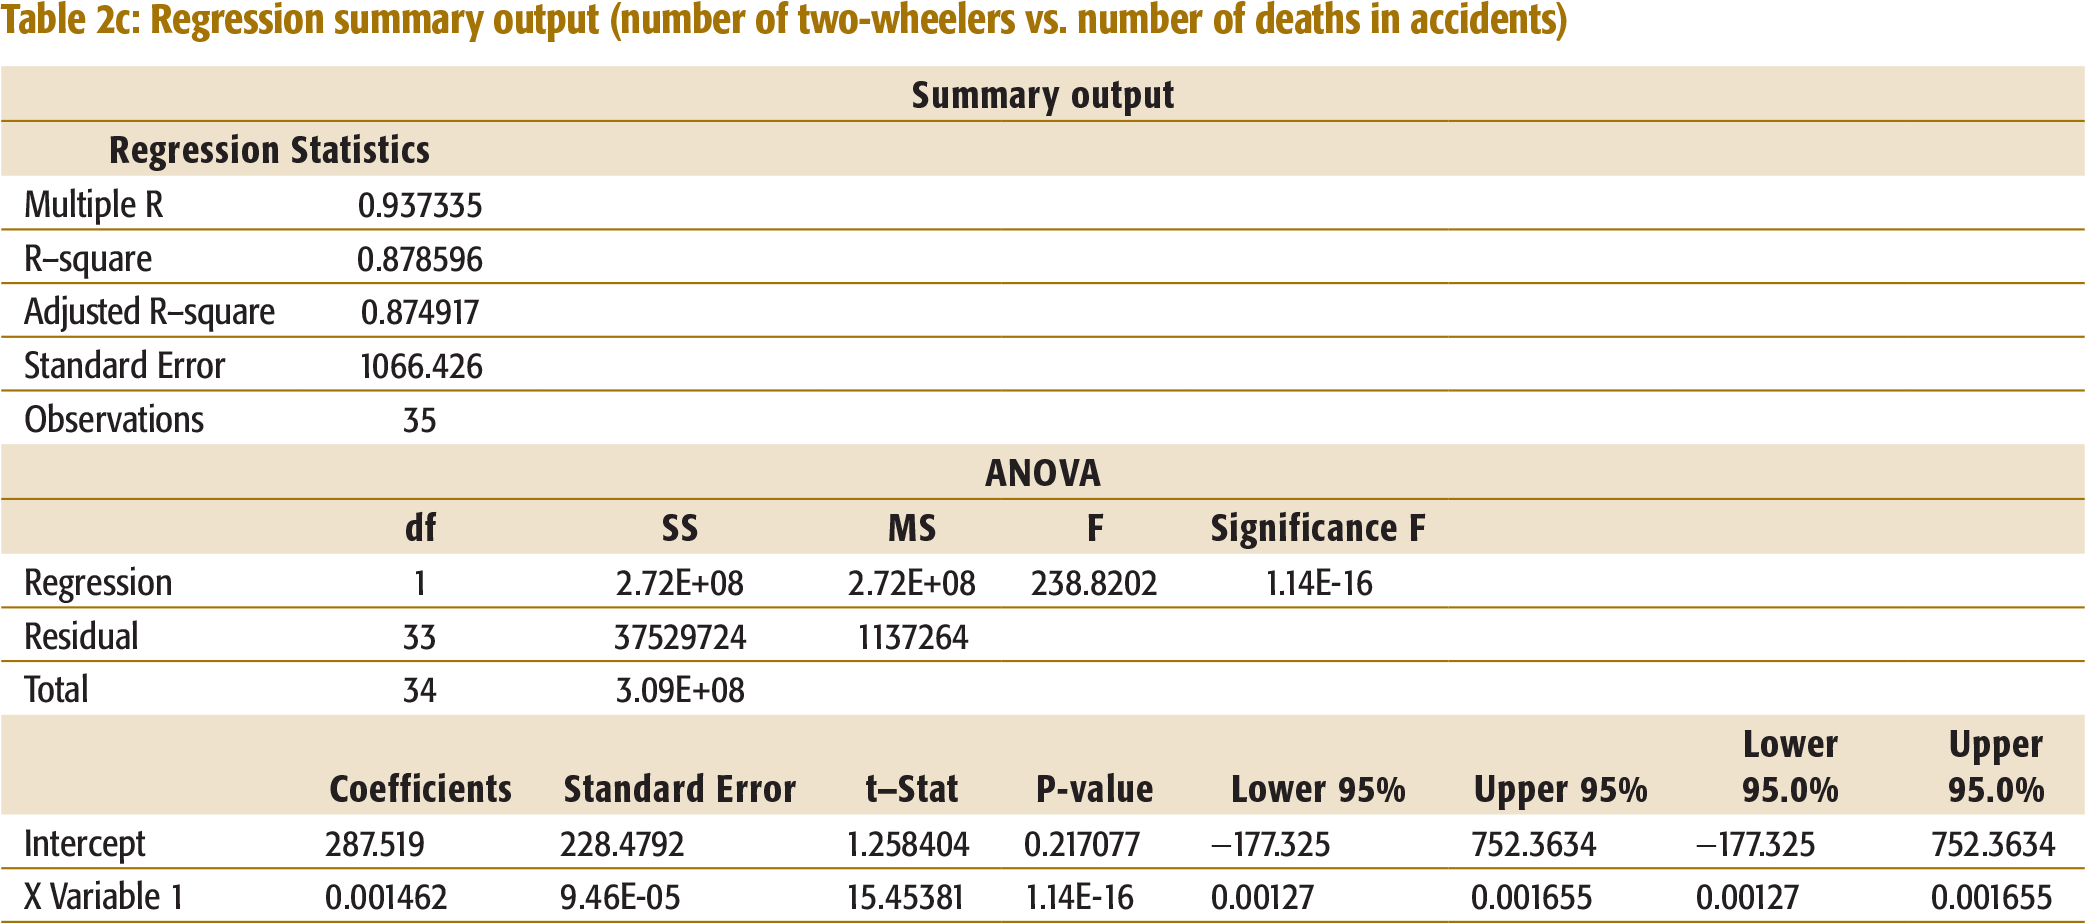
Vehicle Type vs. Number of Deaths
The R-square was significant only in one case; two-wheelers, at 87.9 per cent, indicating a high correlation between two-wheelers and the number of deaths in accidents (Table 2c, Appendix I). The regression equation is:
Number died = 287.519 + 0.001462 * Total number of two-wheelers.
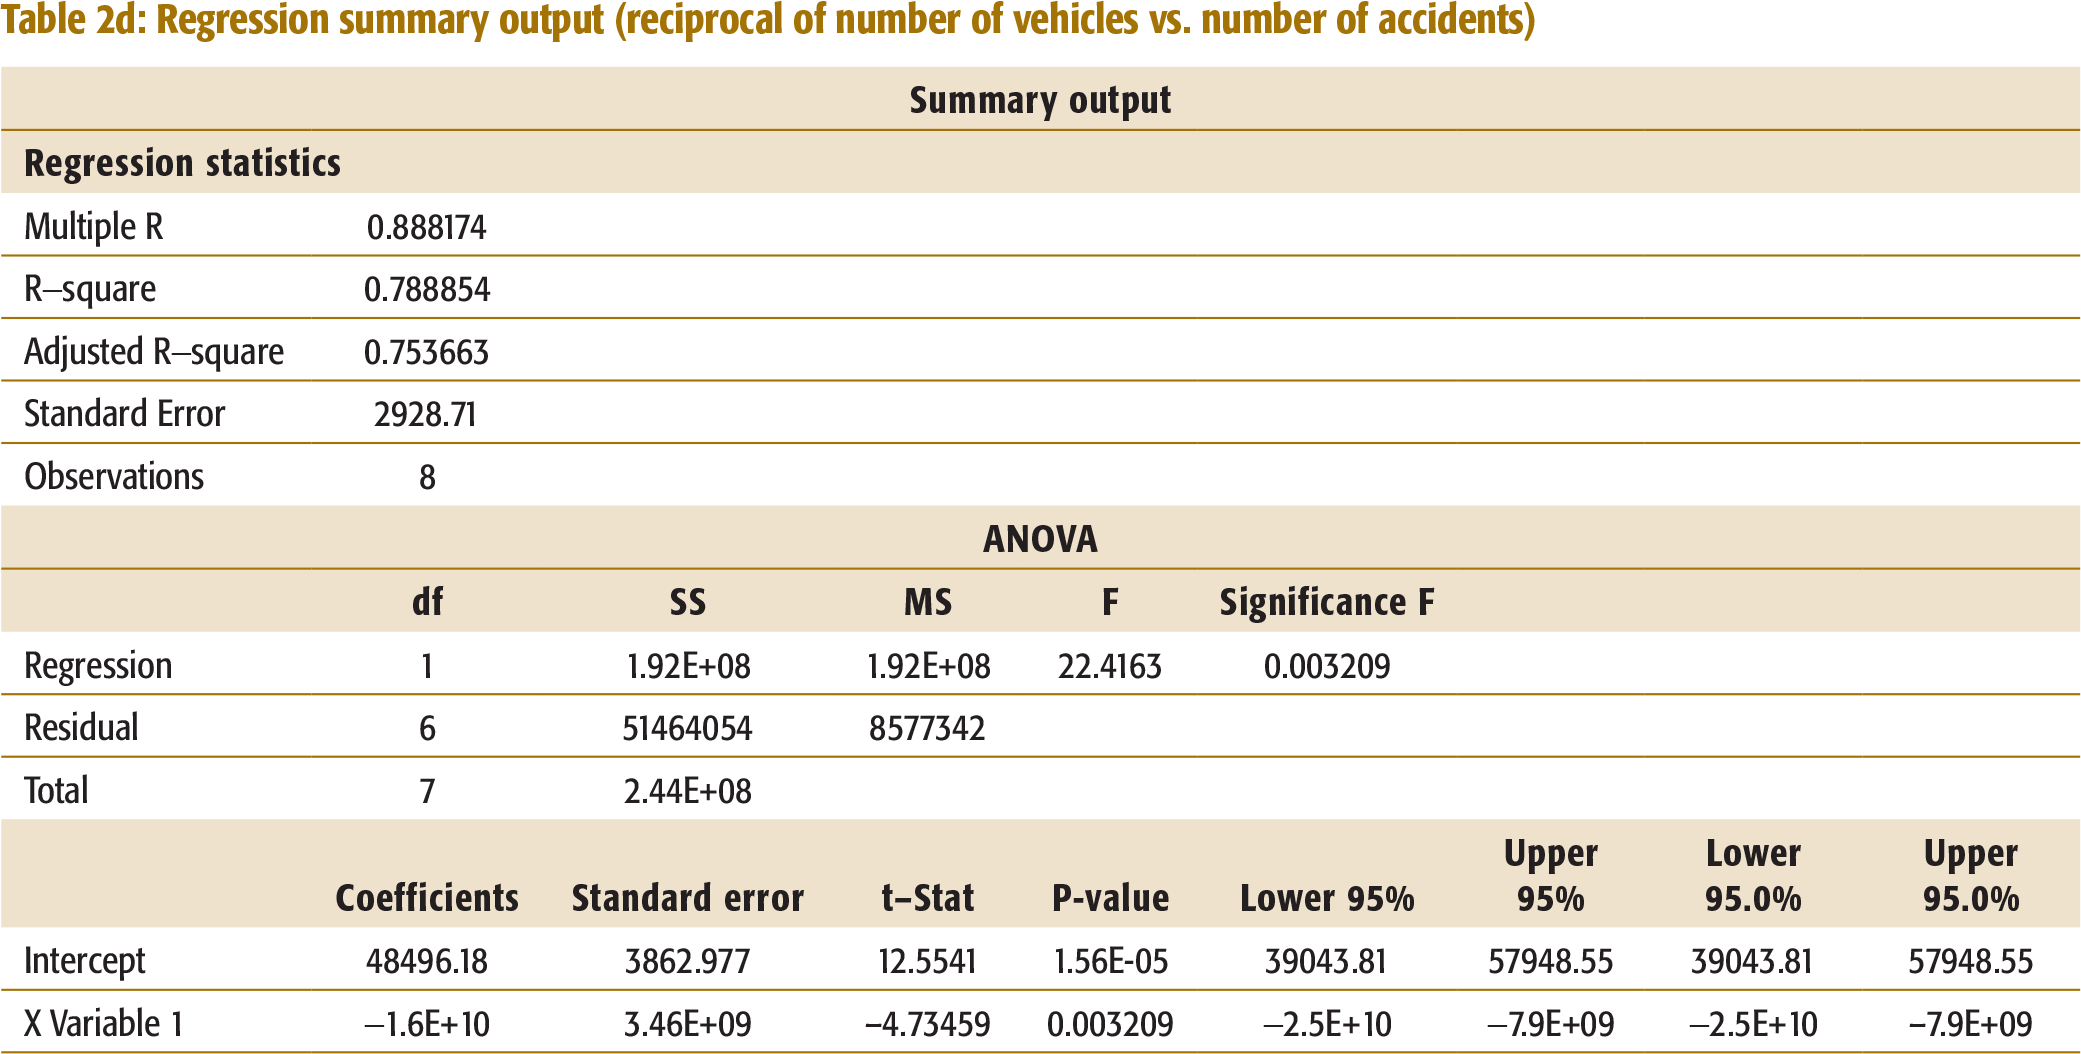
Reciprocal of Vehicles vs. Number of Accidents
A regression was run to determine the correlation between the number of accidents and the number of vehicles on the roads. As this did not yield an R-square of more than 80 per cent, regressions were tried with various transformations on the number of vehicles, which included squaring, taking a square root, using logarithm and a reciprocal. The regression with the reciprocal was the only transformation that yielded an R-square close to 80 per cent (Table 2d, Appendix I).
The regression equation is:
Number of accidents = 48496 - 1.64E + 10 reciprocal of vehicles.
The R-square obtained (78.9 per cent) shows a high correlation between the reciprocal of the number of vehicles and the number of accidents.
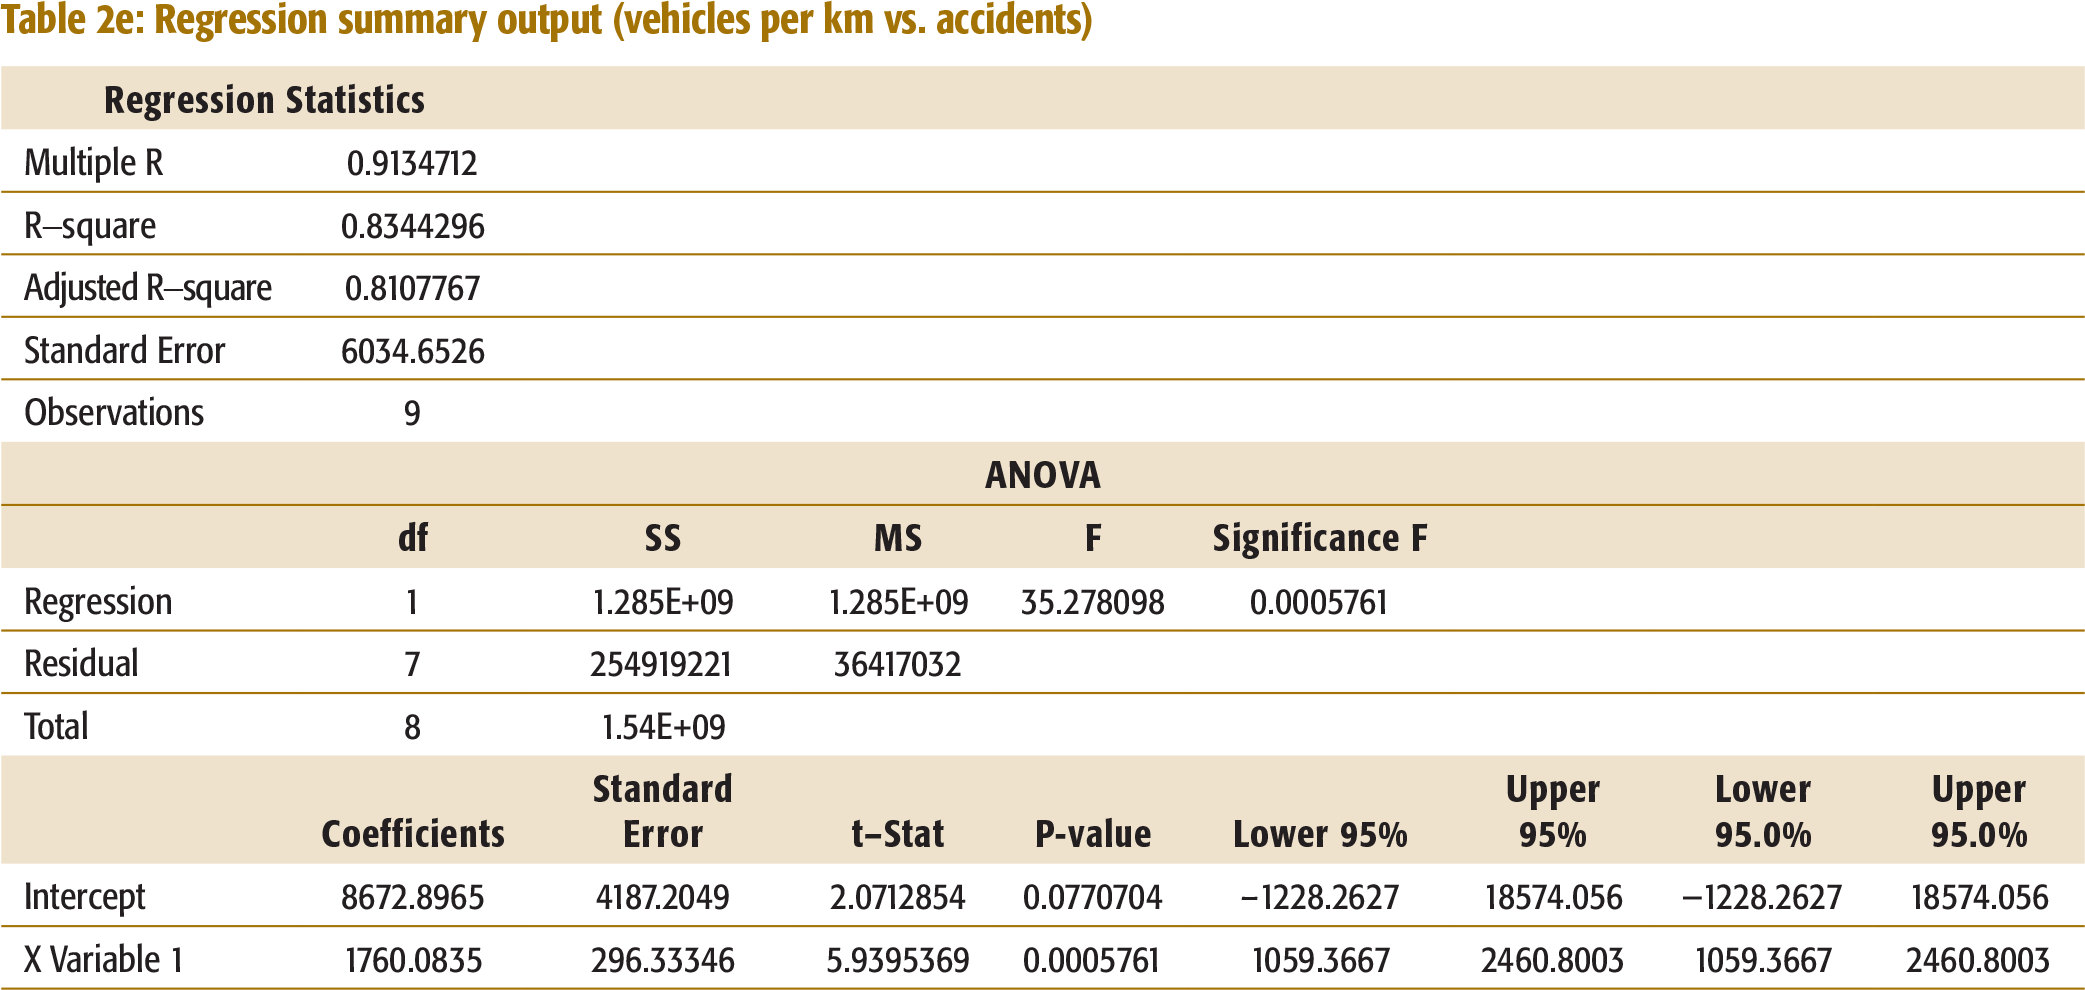
Vehicles per km vs. Number of Accidents
The R-square of 83.4 per cent indicates a high correlation between the number of vehicles per kilometre and the number of accidents (Table 2e, Appendix I).
Simulation
Based on the findings of the regression methodology, a simulation model is presented here to redesign the roads, traffic, and the road network, that could help reduce the traffic accidents significantly on national highways.
The goal of the simulation model was to reduce the number of unsuccessful switches by redesigning traffic and/or roads, and at the same time minimizing the waiting time.
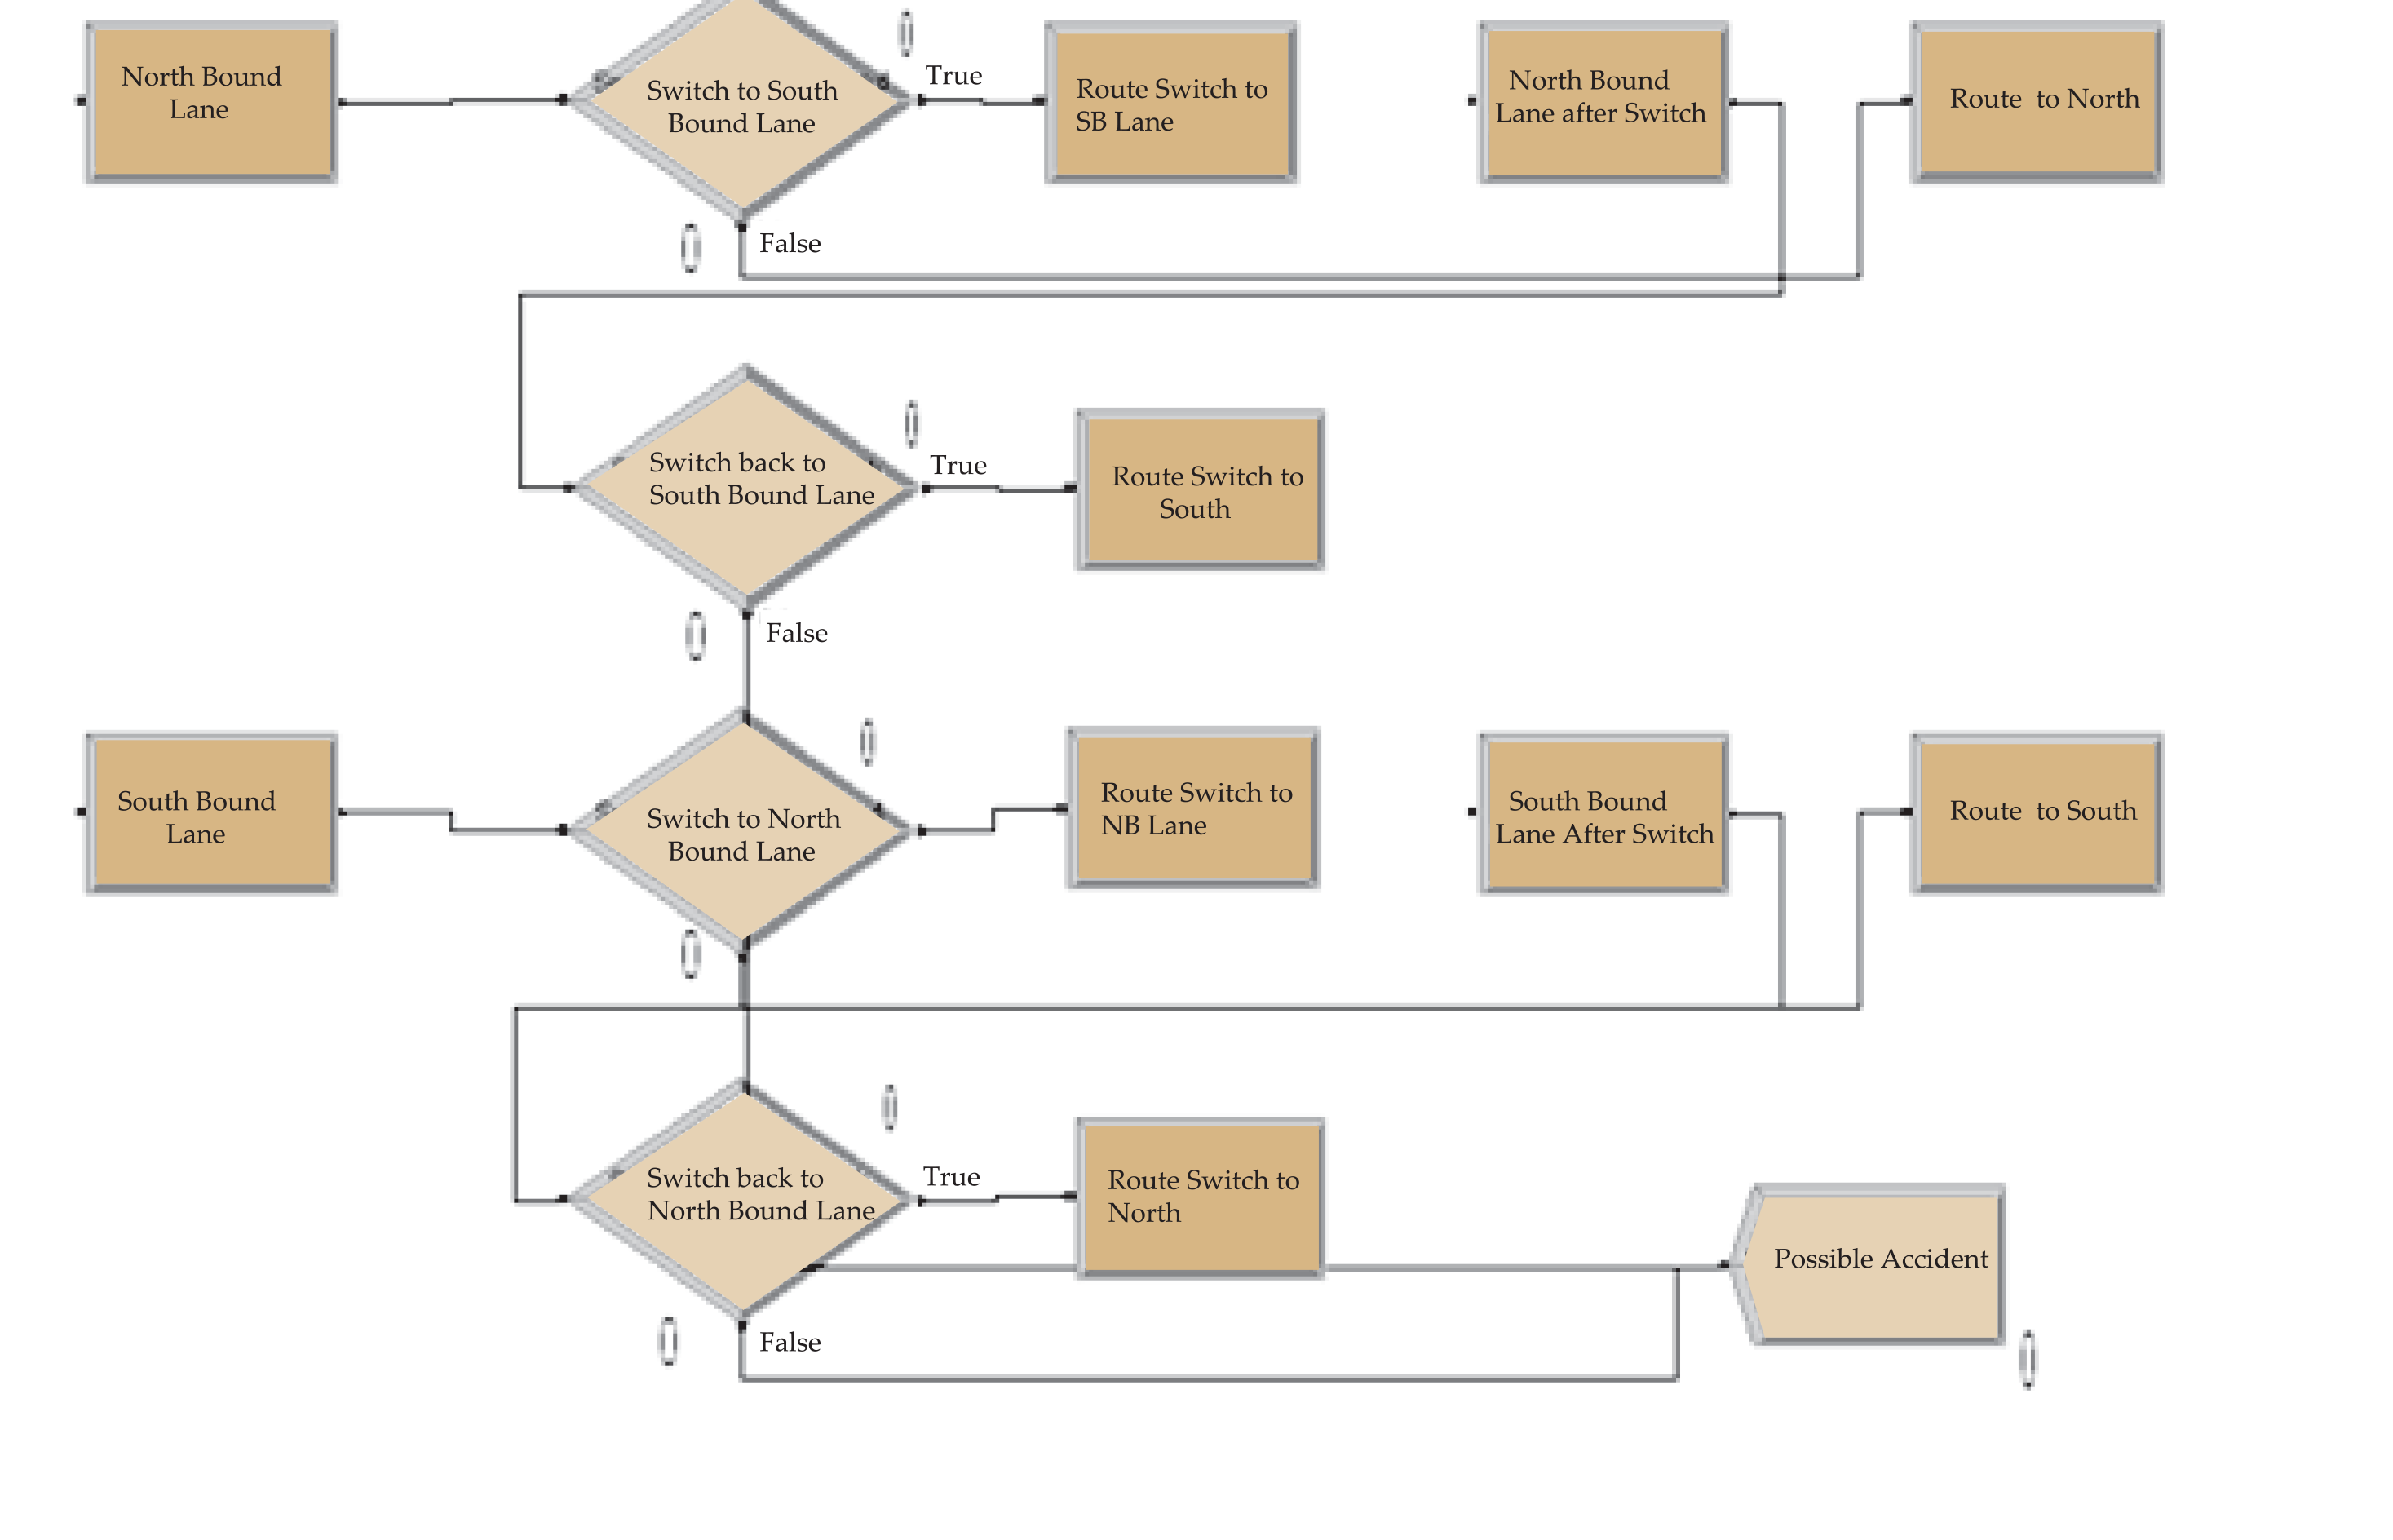
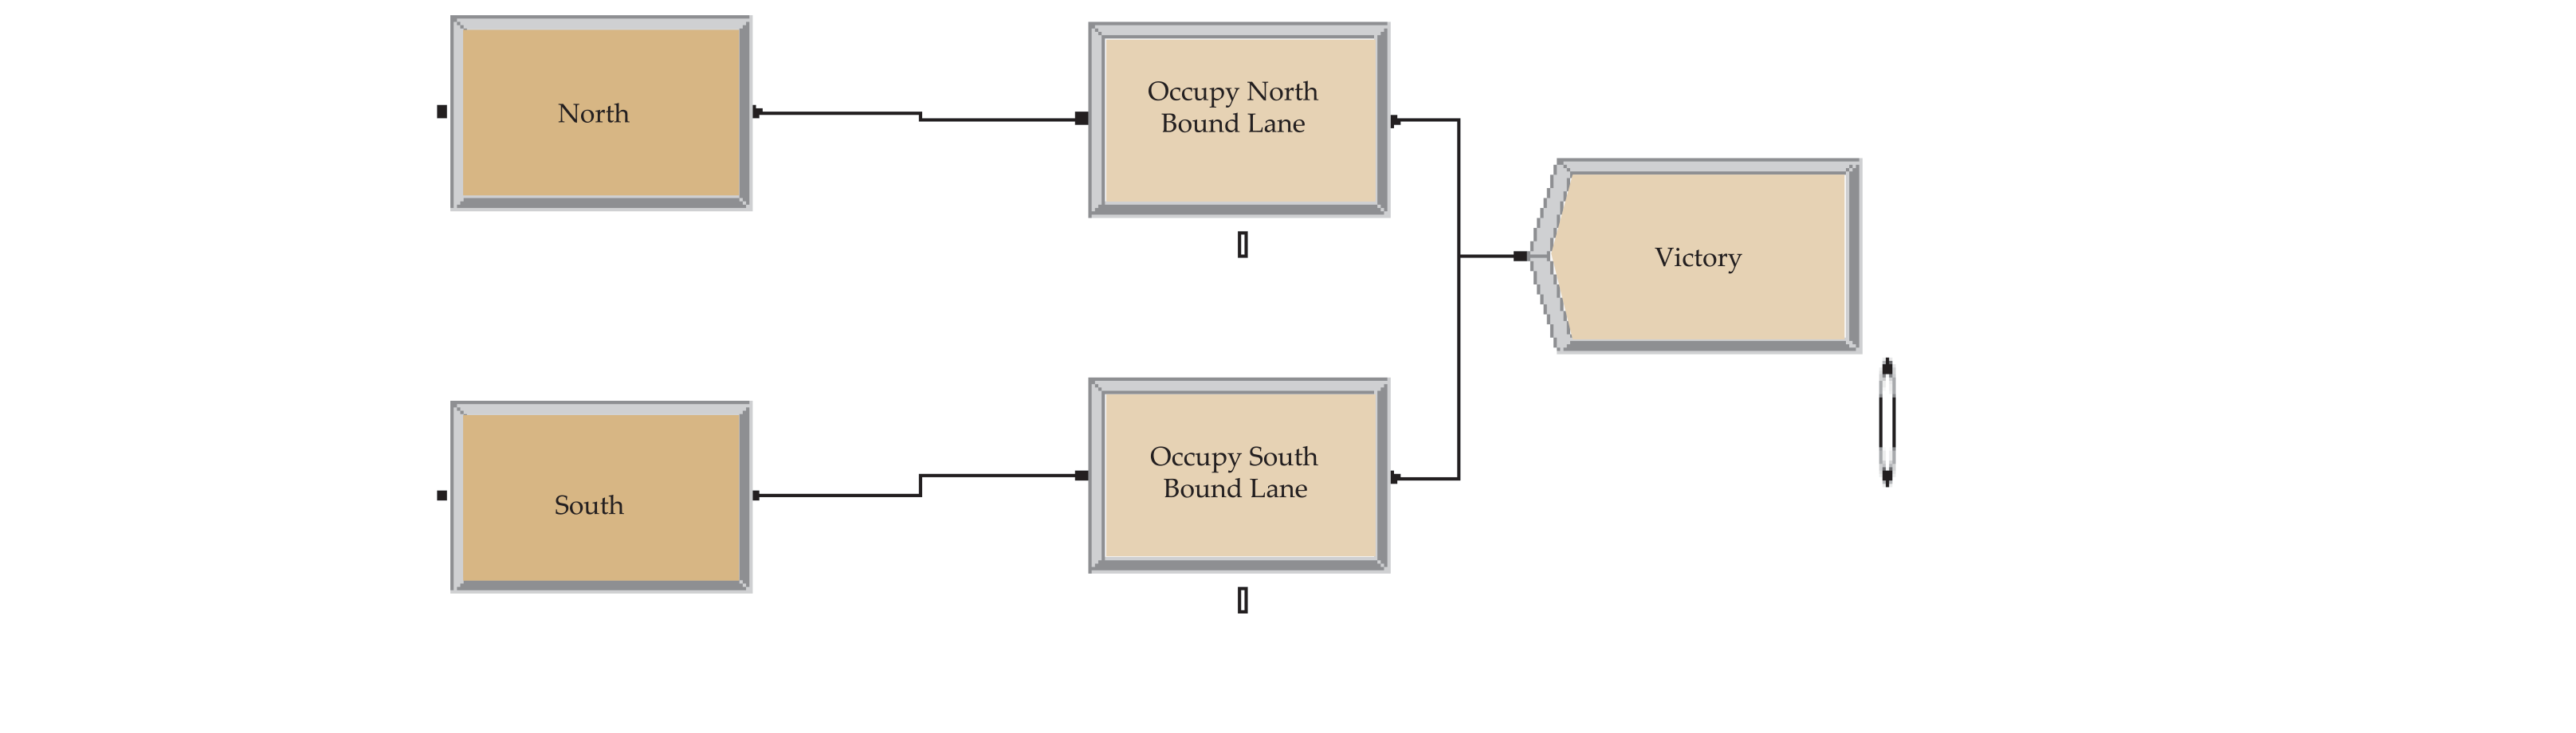
A two-lane highway is defined as one that has traffic in both directions (one lane going North and one lane South). The traffic rules do not legally allow vehicles to pass other vehicles by switching temporarily to the lane with incoming traffic. However, many vehicles do not adhere to these rules. Typically, they tend to pass the vehicle in the same lane, by crossing into the lane in the opposite direction. It then tries to switch back to the original lane, which cannot be accomplished, if the original lane is busy. All of this slows down the traffic resulting in traffic congestion, or may lead to a head-on collision.
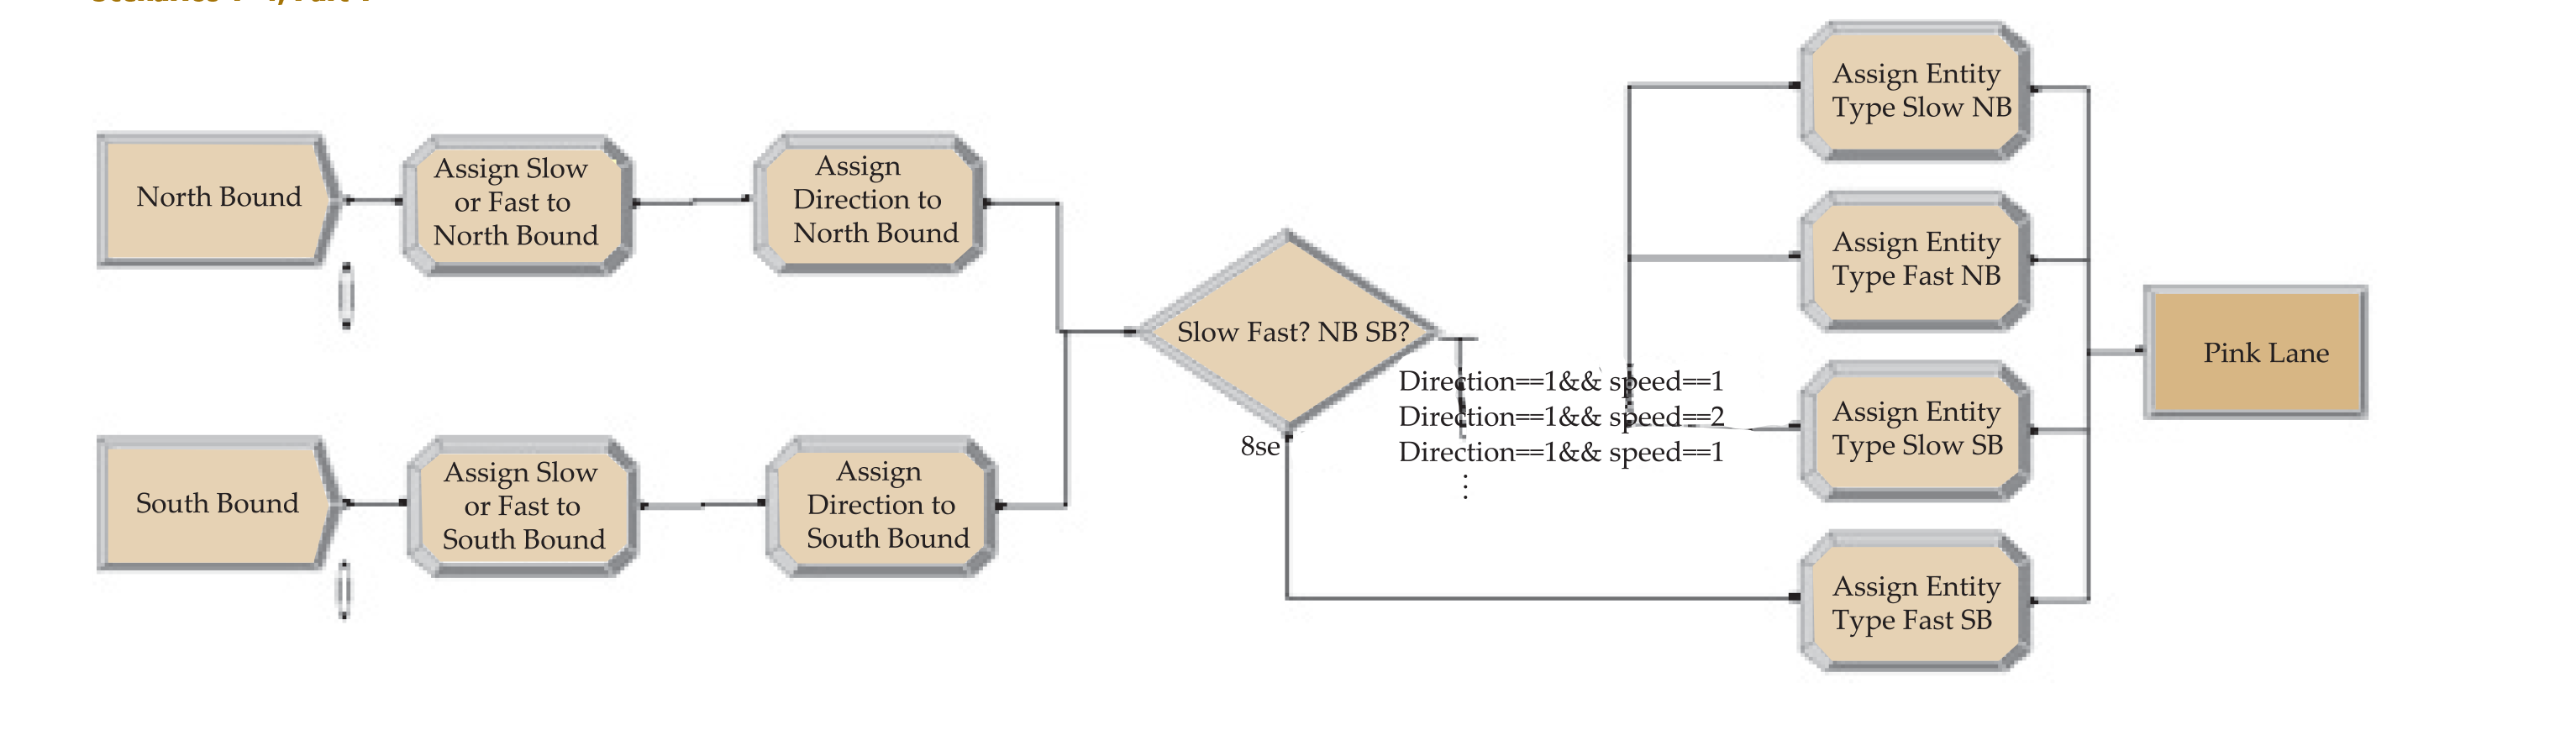
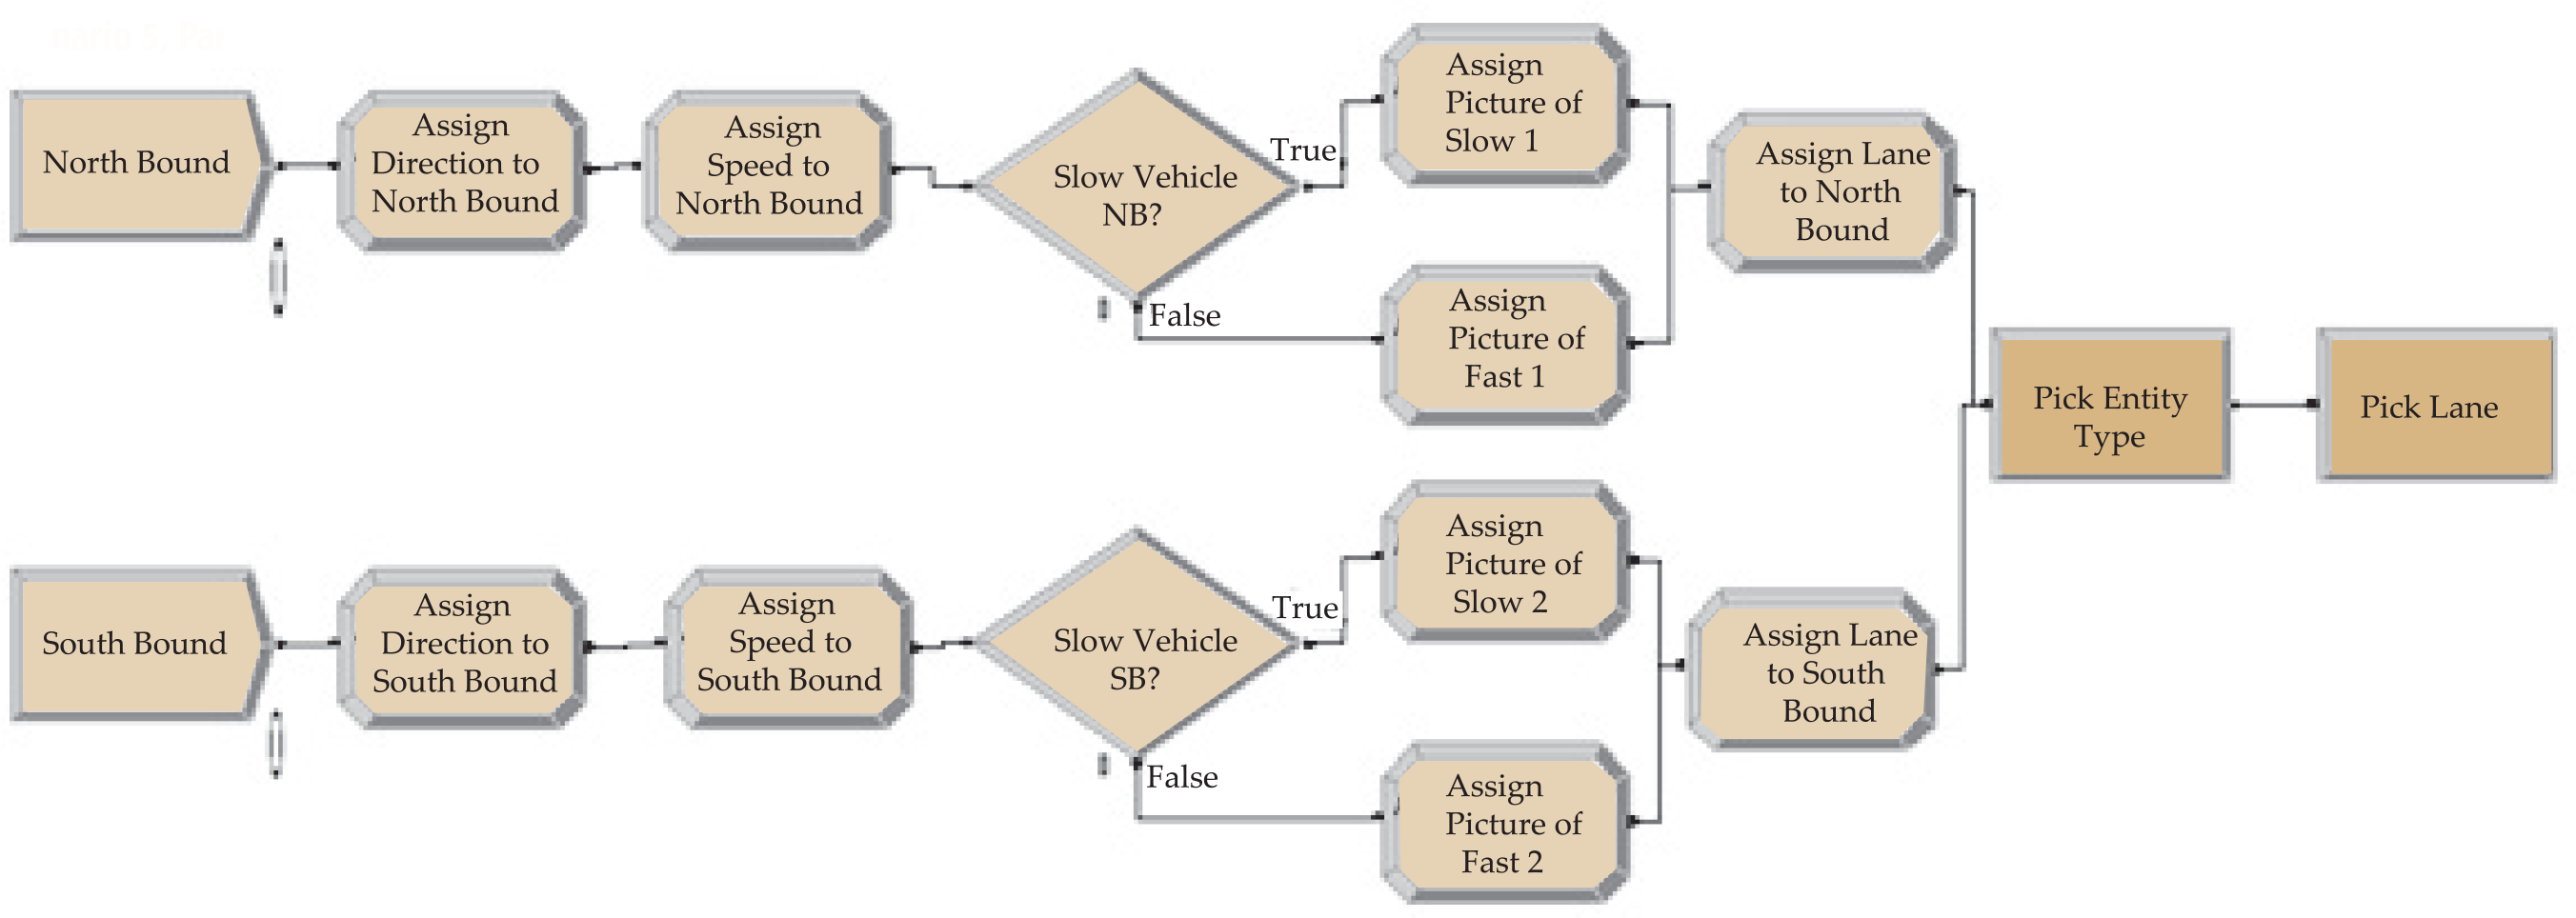
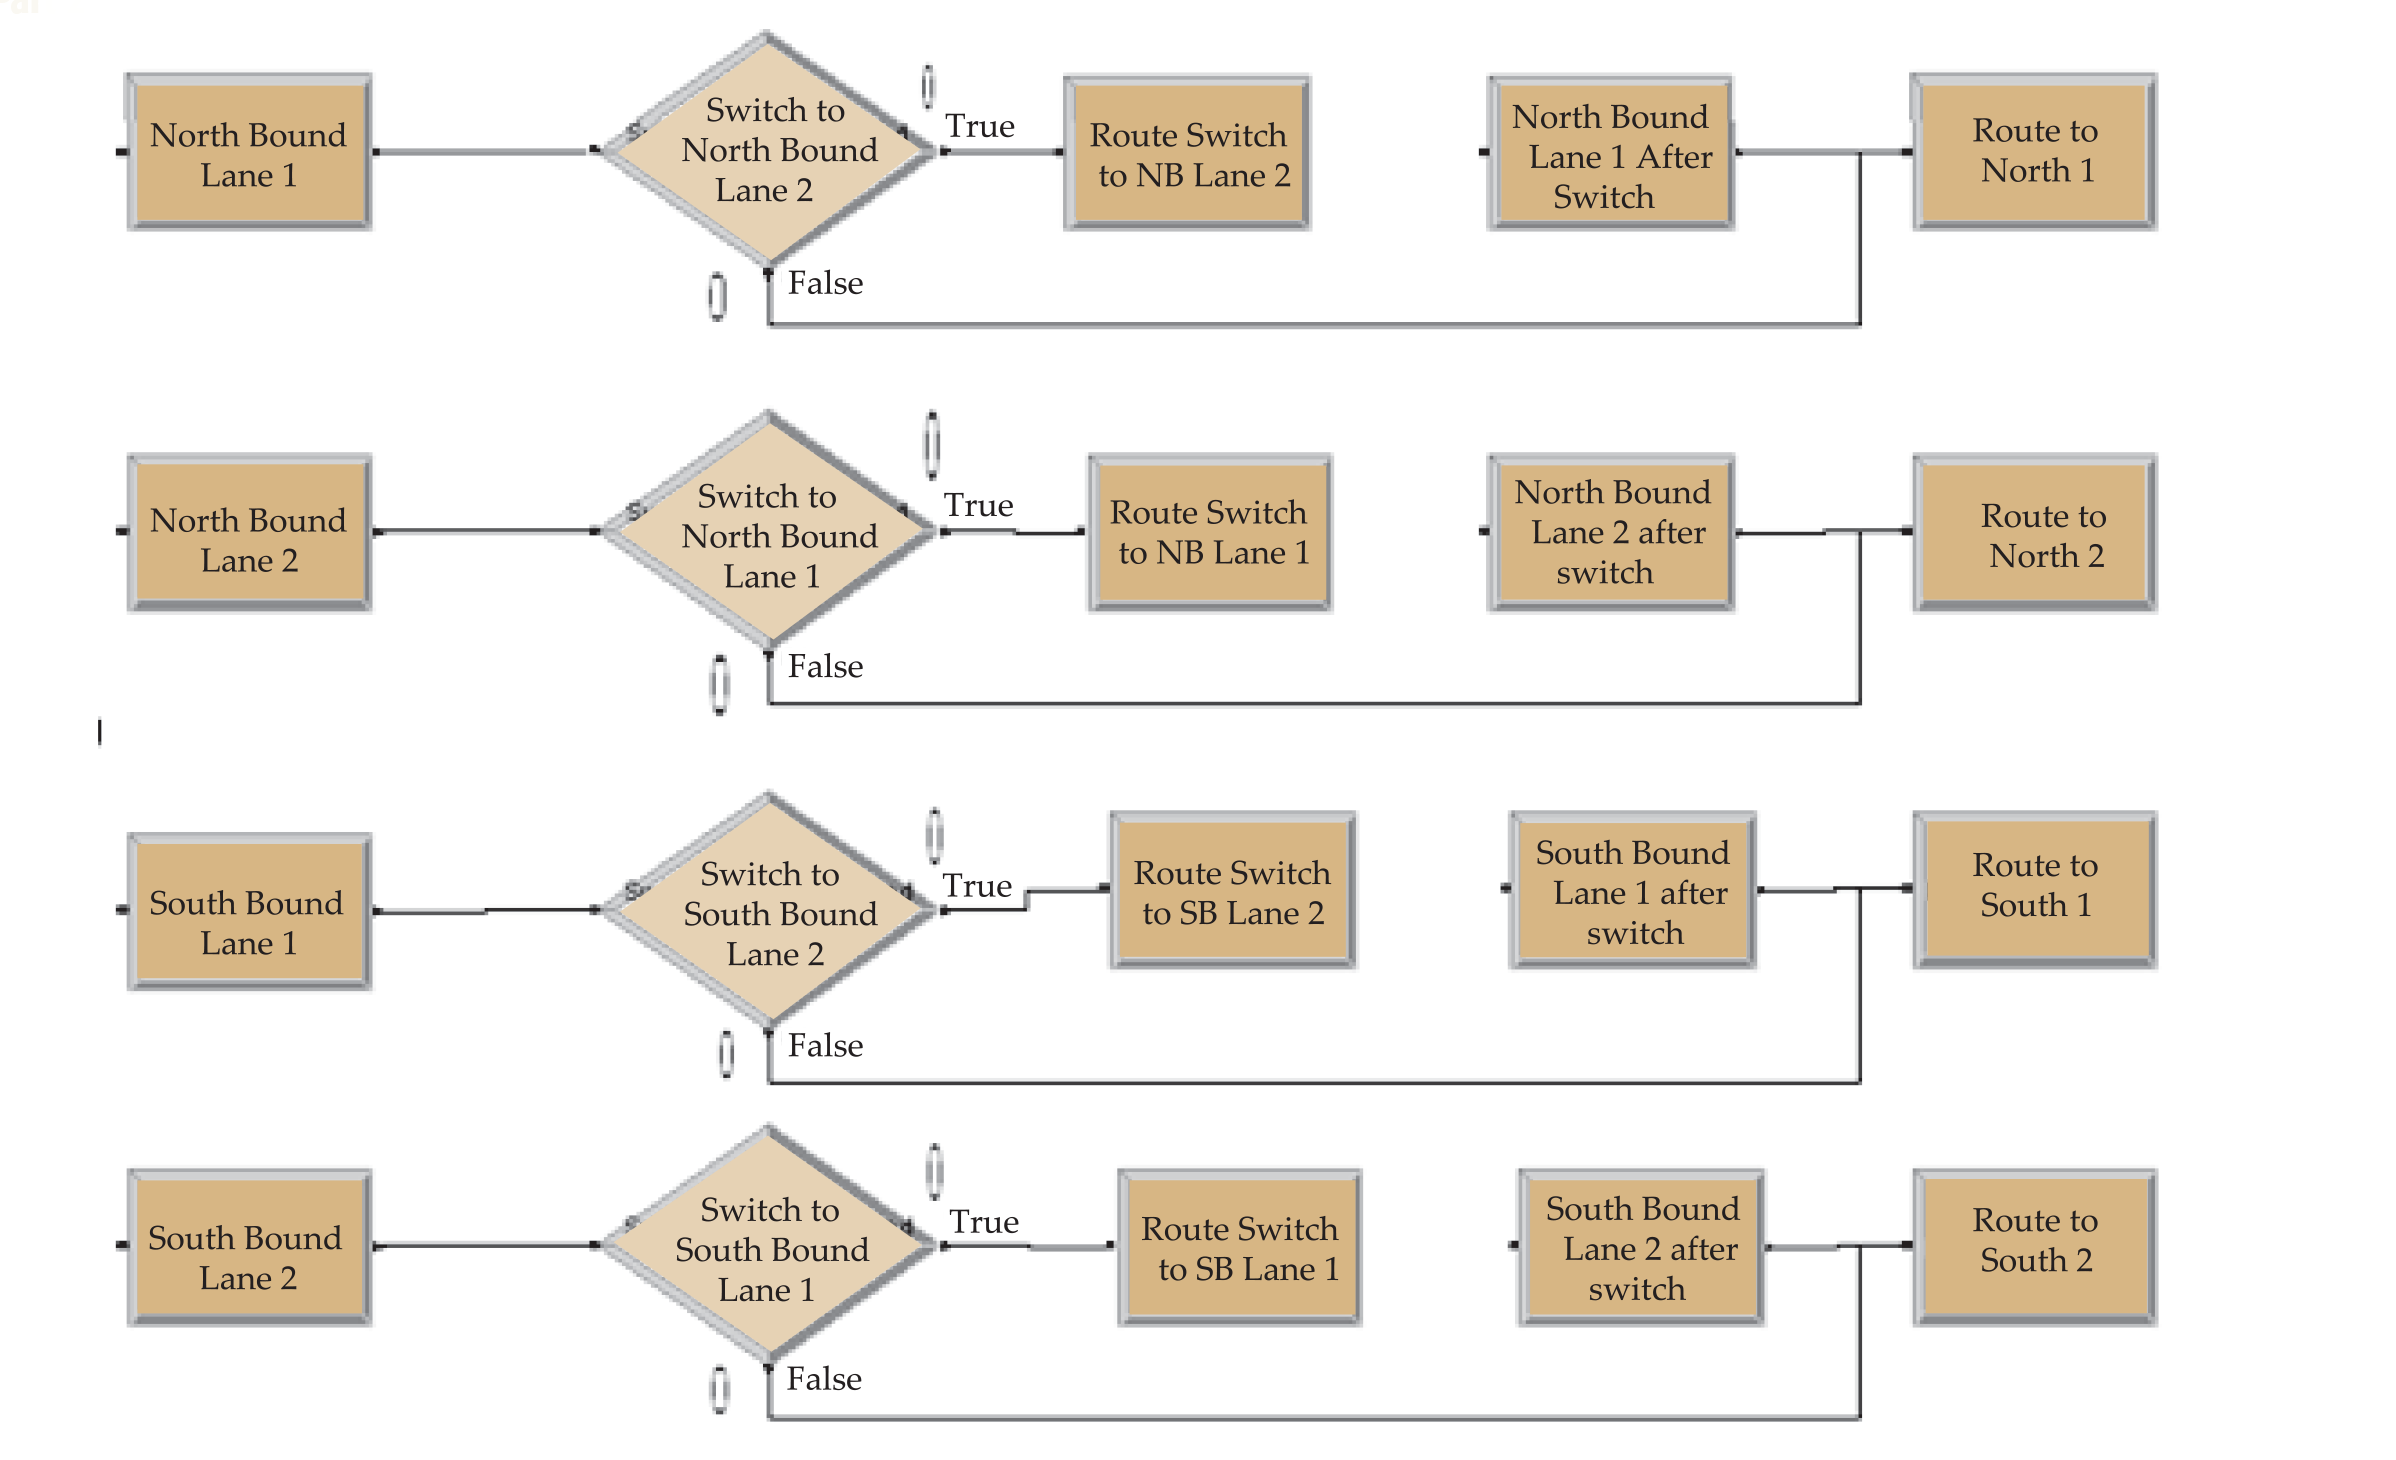
Main Features of the Model
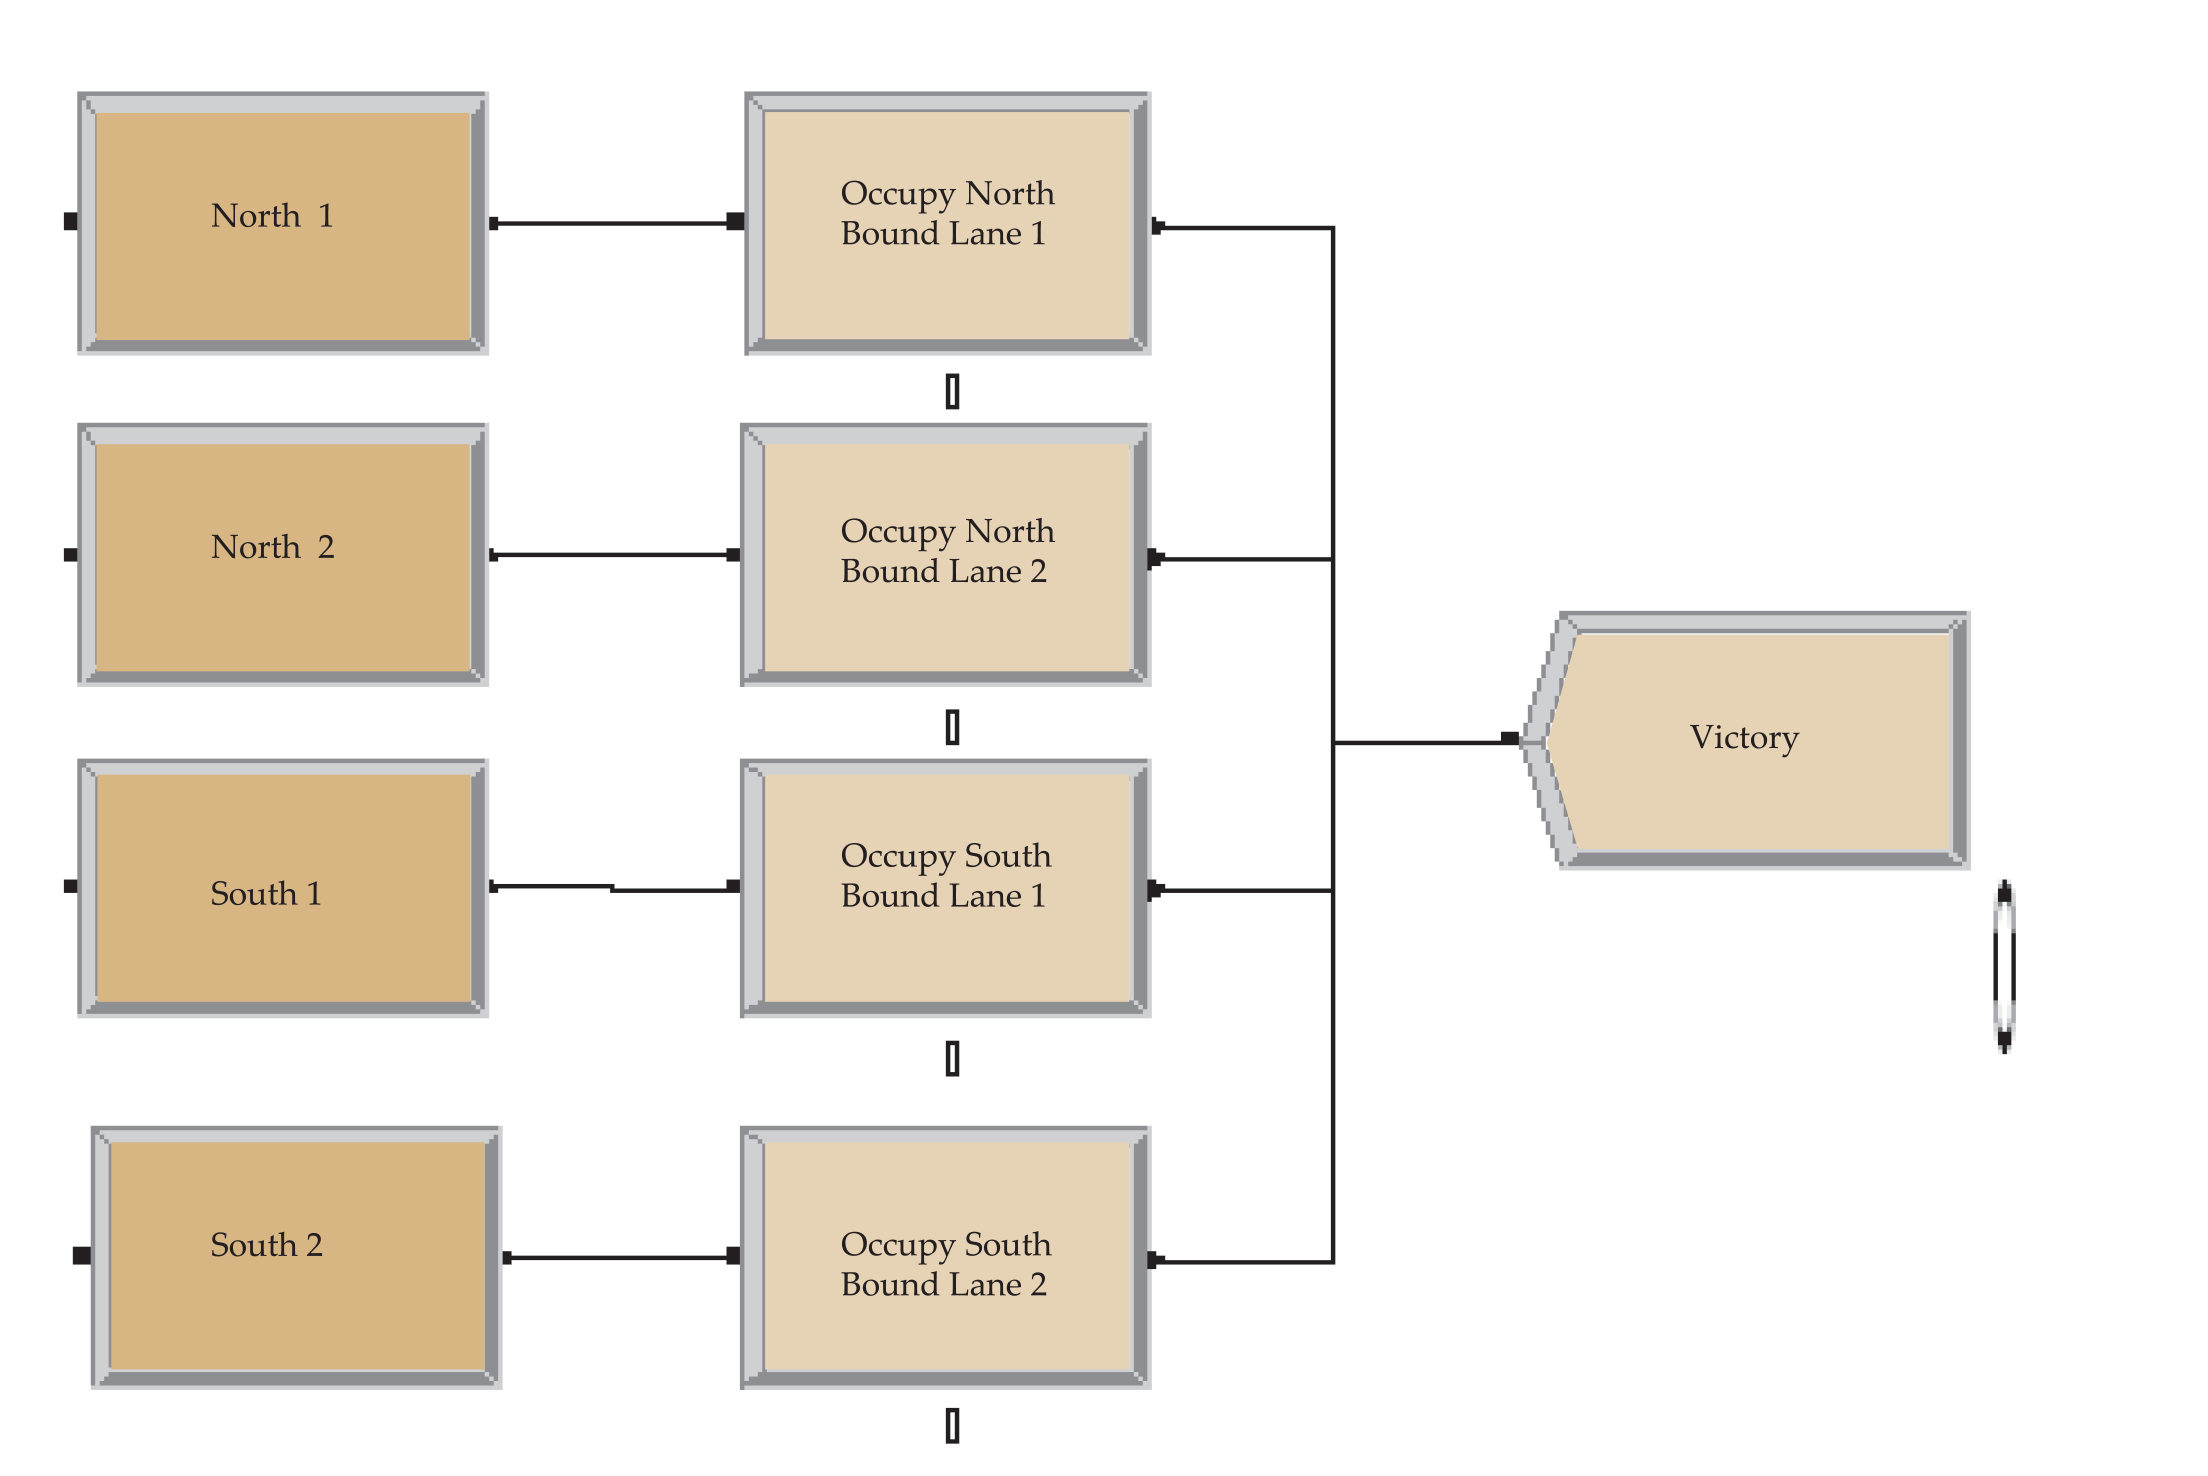
The simulation was modelled using ARENA software. The lanes were considered as resources. Each resource could accommodate only one vehicle at a time. Slow vehicles took a longer time to be processed when compared to the fast moving vehicles. Direction, lane, speed (1 or 2), and entity type were assigned. If the lane (resource) was busy, the vehicle switched. The false branch from the next switch decision within a decide module gave rise to a number that we called “possible accidents.” The objective was to reduce that number without significantly increasing the waiting time of the vehicles. The following five scenarios were considered: Base, No passing at all, No passing for slow traffic, Passing only for North-bound fast traffic, and Four-lane highway (implies upgrading and redesigning of the highway). The fifth scenario required a separate model. Refer to Appendix II for an illustration of the simulation models.
Major Data Needed (Input)
The following data was needed for simulating the scenarios in ARENA: (1) Mean time between arrivals of vehicles (both South-bound and North-bound); (2) The fraction of slow and fast vehicles (both South-bound and North-bound); (3) The process or value added times for slow and fast traffic (assumed to be 8 and 3 seconds, respectively); (4) The switch or transfer times (assumed to be 2 seconds).
Key Performance Measures (Output)
The following key performance measures were considered: (1) Waiting time for each entity type (categorized by direction, speed and lane); (2) Total time for each entity type that includes value added, waiting and transfer times; (3) Possible accidents.
Data Collected by Direct Observation
Different types of vehicles were counted by physically observing the traffic between 5:15 p.m. and 5:45 p.m. during three different weekdays on NH-47 between Thrissur and Palakkad. This data was used to calculate the mean time between arrivals, as well as the percentage of slow and fast vehicles in both directions.
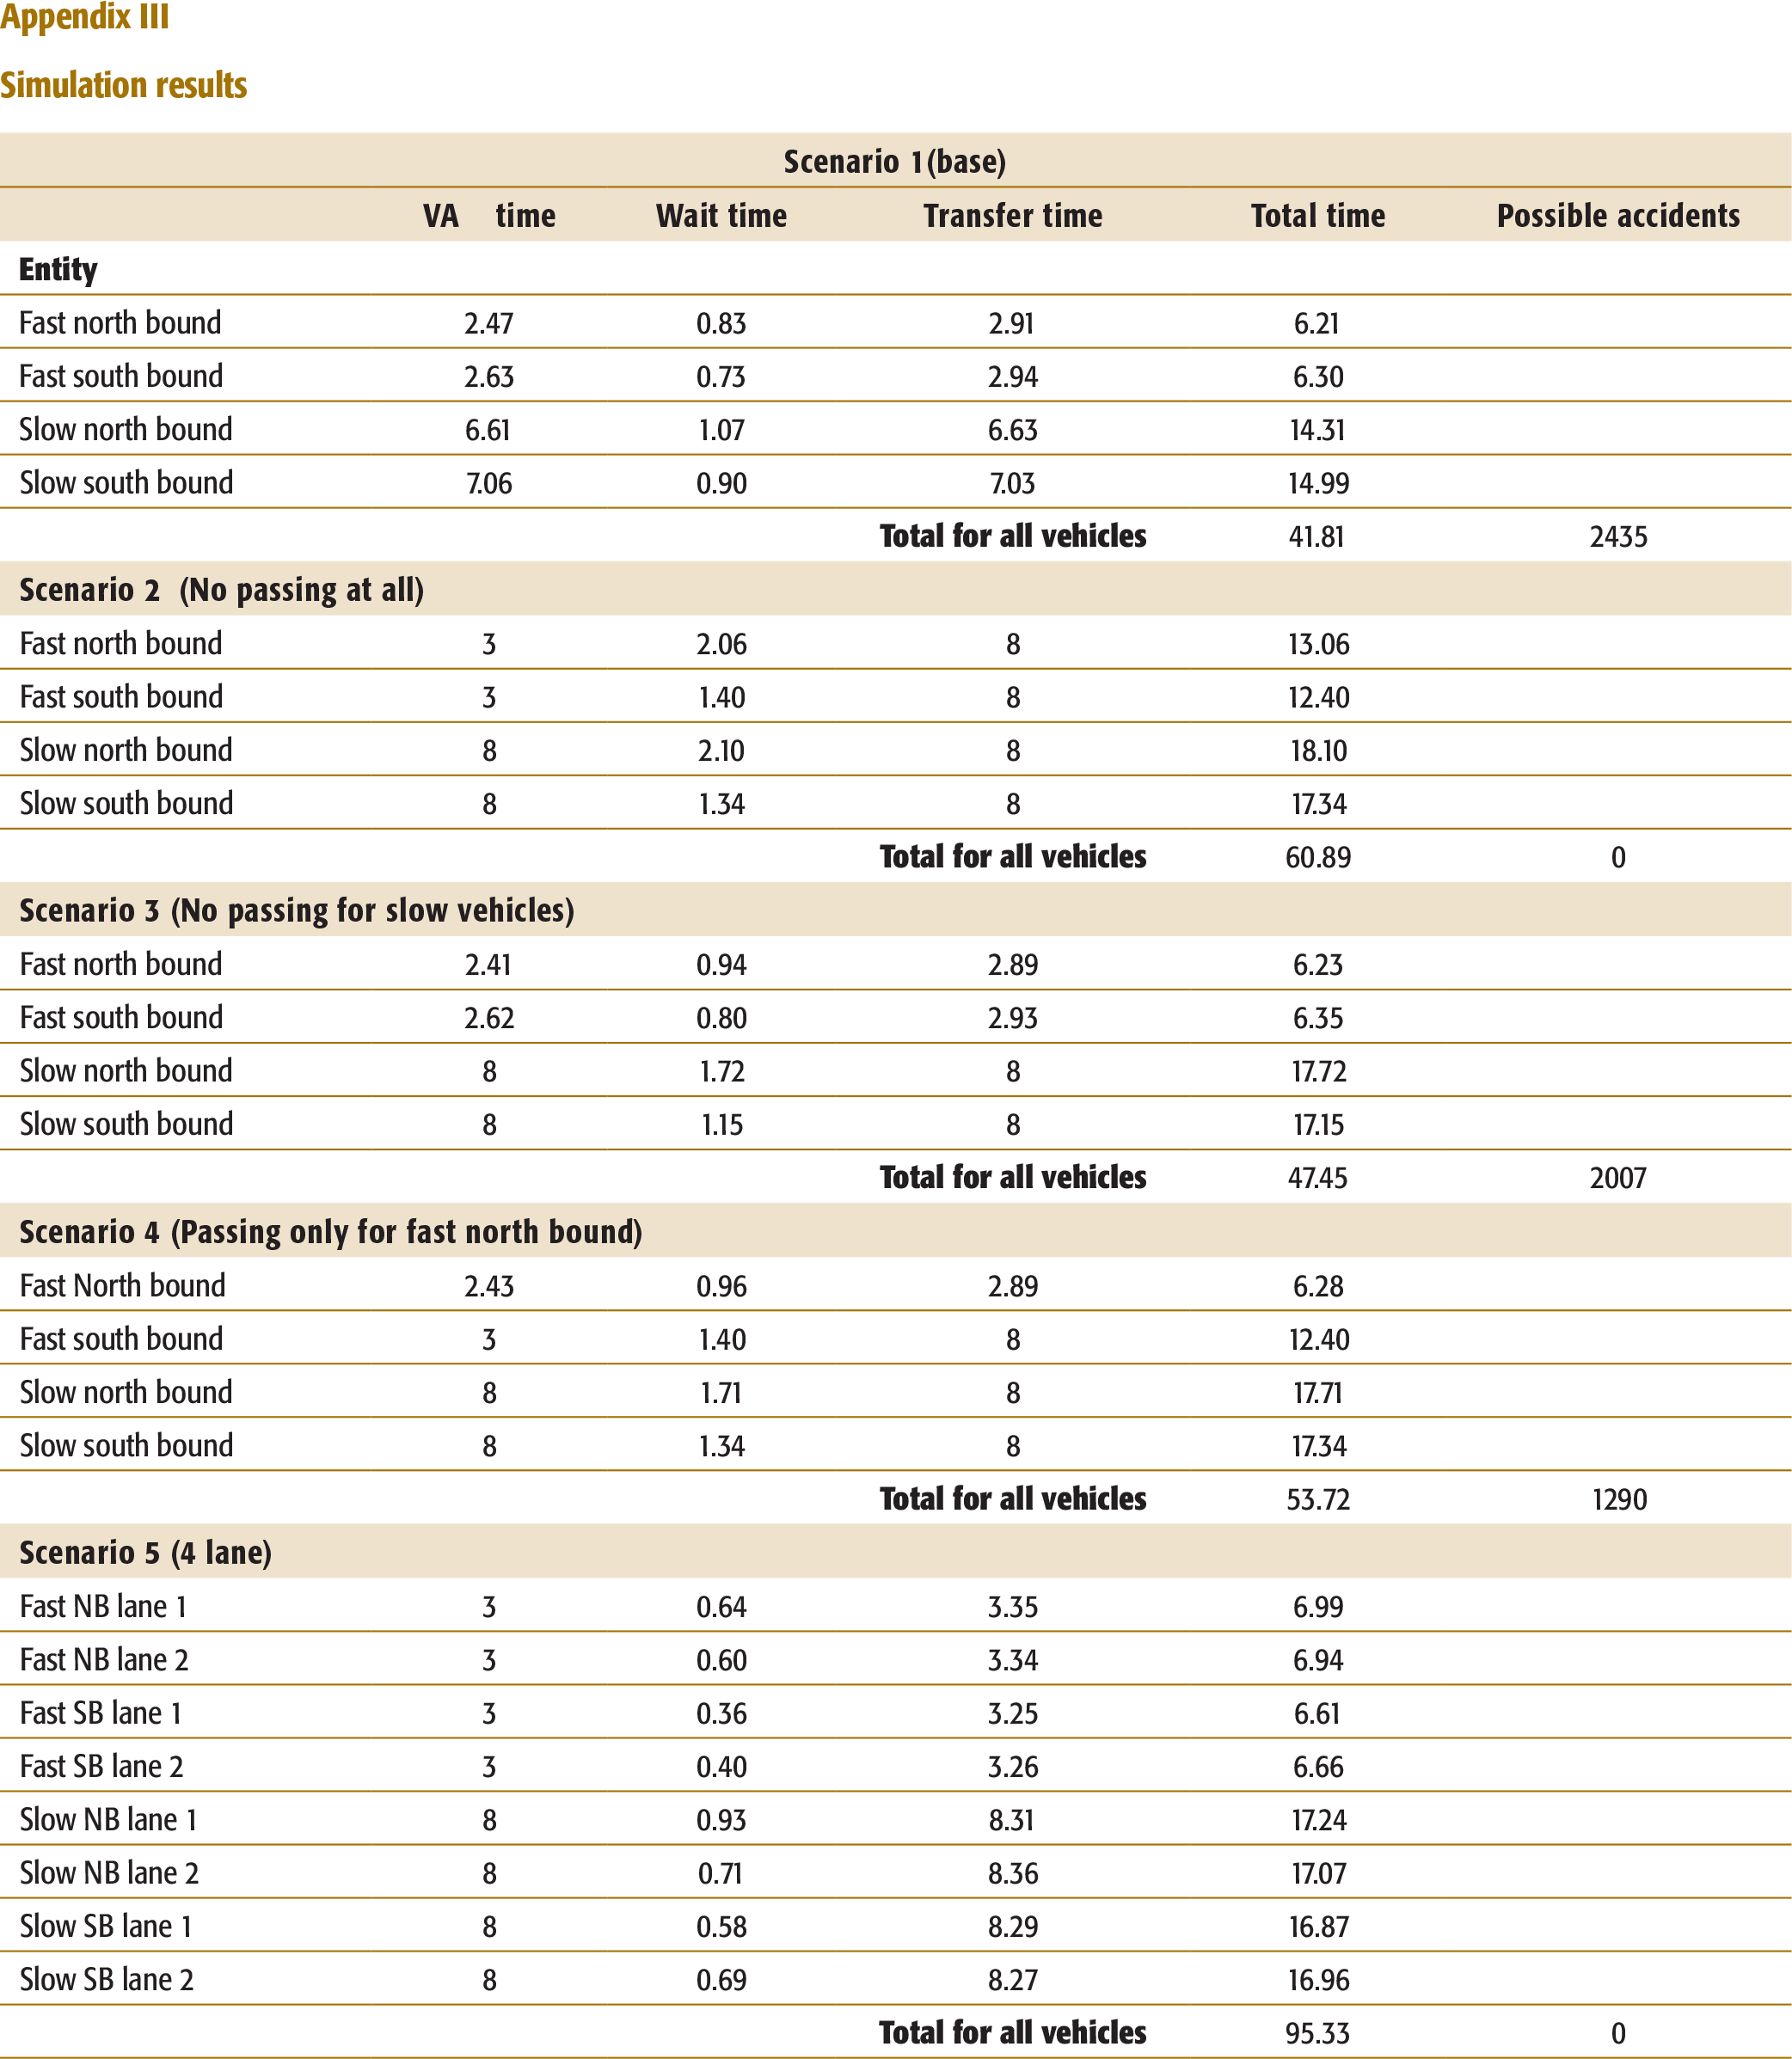
Simulation Results
The base scenario reflects the existing traffic situation and places no restriction on overtaking. Although the waiting time is the lowest for this scenario, it is the main reason behind traffic accidents on the highways. The second scenario is where no passing is allowed. This yields the highest waiting times, but presumably would result in zero accidents. So, the traffic was categorized into fast (tempos, KSRTC buses, private buses, cars, and two-wheelers) and slow vehicles (trucks). The third scenario is to allow fast vehicles to pass and prohibit slow vehicles from overtaking. This seems to be a good trade-off as it can be seen from the waiting times and the total travel time on the highway. The fourth scenario allows only fast North-bound vehicles to pass. North-bound was chosen because it has more traffic than South-bound. Nevertheless, as it can be seen from the simulation results, this significantly increases the waiting times for the South-bound traffic.
“Possible accident” implies that a vehicle that has switched to the opposite lane would not be able to come back to the original lane due to traffic. This would lead to two possible scenarios: (1) The vehicle would wait to get into the original lane and as a result it would force the traffic in the opposite direction to wait. (2) It would collide head-on with the vehicle coming from the opposite direction. “Possible accidents” are highest for the base scenario and none for the second scenario (where no passing is allowed). Even though the second scenario is preferred, it leads to increased waiting times. The third scenario looks promising, as it reduces potential accidents by 17 per cent without significantly increasing waiting times. While the fourth scenario reduces potential accidents by 47 per cent, this solution may not be acceptable to the commuters travelling South-bound.
Therefore, the third scenario (prohibiting slow vehicles like trucks from passing) seems to be the best option, but it still results in accidents. Thus we recommend Scenario 5, where we upgrade two-lane highways to four lanes (with two lanes in each direction). This decreases waiting times, eliminates head-on collisions, and reduces the “Possible accidents”. Scenario 5 could be expensive to implement due to the high costs involved in building the new lanes (construction, maintenance, land acquisition), as well as the relocation costs for residents living near the highways. See Appendix III for detailed simulation results.
Recommendations
Design of Roads
Design of roads is an aspect worth reviewing in order to reduce accidents on the roads of Kerala.
Conversion of one-way highway to a four-lane highway (two lanes in each direction) is one solution that can ease traffic accidents. The simulation model supports this by showing that the waiting time is reduced significantly. The simulation also shows the complete absence of the module “possible accidents”. The possibility of head-on collision is brought to zero in this model, because the rule permits changing lanes in the same direction as the traffic. Nonetheless, the trade-offs involved with increasing one-way to a four-lane highway cannot be neglected. Apart from the huge cost of construction and maintenance of the highway, land acquisition for expansion has cost, effort, time, legal and ethical implications.
Design of Traffic
Considering the problems in redesigning of the roads, redesigning of traffic seems more feasible. We now experiment with simulation models that implement restrictions on overtaking, conditionally and unconditionally. In this set of models, restrictions are imposed on passing (changing to the opposite lane while overtaking). Currently, there are no restrictions on passing and any vehicle can pass any other vehicle at any time. This is the base scenario for the simulation. In this scenario, if a vehicle sees another vehicle in the same lane, it tries to overtake that vehicle by changing to the lane with on-coming traffic (provided there is no vehicle in that lane). After switching to the opposite lane, it is necessary that they come back to the original lane immediately. However, the original lane may not have space for this vehicle, and that may result in two possible scenarios: Either this vehicle waits for the original lane to be available or it collides head-on with the vehicle from the on-coming traffic. In the first scenario, it slows down the traffic, sometimes confusing vehicles in the opposite lane, and even the vehicles in the original lane. The second scenario results in a head-on collision. Combined, these two scenarios constitute the module “potential accidents”. The objective of the simulation experiments is to minimize this number.
There are three variations from the base scenario. The first is where no passing is allowed for any vehicle. Even though this solution results in zero “potential accidents”, it would be rejected by the public because it adds to the waiting time of the fast moving vehicles. Another experiment allows passing only for fast vehicles in one direction (in this case, North-bound) that has higher traffic. But this was found to increase waiting times for South-bound traffic significantly. Thus, a reasonably good solution implied placing restriction on just the slow moving traffic.
An advantage of redesigning the traffic lies in the opportunity to implement changes that address the peak hour traffic, and any condition specific to the roads in consideration. Even though only highway traffic was studied for the simulation, with additional appropriate data, the results could be applied to state highways as well.
The Pareto analysis indicates that two-wheelers are involved in 41.4 per cent of the accidents. The regression analysis also revealed a high correlation (R-square = 87.9 per cent) between two-wheelers and the number of deaths. The corresponding regression equation is: Number died = 287.519 + 0.001462 * Total number of two-wheelers.
The above results indicate the significant role of two-wheelers in accidents. So, a possible solution is to have a separate lane for two-wheelers which may contribute significantly to the efforts of reducing the number of accidents. This would not incur huge costs, as it would involve reserving a part of the existing road space for two-wheelers.
Design of Road Networks
A couple of regressions were run to determine the correlation between the number of vehicles and accidents. An R-Square close to 80 per cent was found between the reciprocal of the number of registered vehicles and the number of accidents (Table 2d, Appendix I). An R-square of more than 83 per cent was discovered between the number of vehicles per kilometre and the number of accidents (Table 2e, Appendix I). The main reason behind traffic accidents was the significant increase in the number of vehicles without a corresponding increase in the road space. Thus, more roads need to be constructed, especially from the suburbs to the city. This would result in commuters taking different routes, and therefore, reducing traffic accidents.
The Kerala expressway was planned to connect the tips of Kerala’s northern and southern boundaries. This would benefit business and regular commuters. Unfortunately, the construction work is moving at a slow pace, as the infrastructure costs are extremely high; therefore, enhancing existing roads seems to be a better option.
The redesign of traffic provides an opportunity to implement changes that address the peak hour traffic. Even though only national highway traffic was studied for the simulation, with additional appropriate data, the results could be applied to state highways as well.
Design of Road Networks
The regression results show significant correlation between the number of vehicles and accidents, the number of vehicles per kilometre and the number of accidents. The main reason behind traffic accidents is the significant increase in the number of vehicles without a corresponding increase in the road space. Thus, more roads need to be constructed, especially from the suburbs to the city. This would result in commuters taking different routes, thereby reducing traffic accidents. The planned addition of over 12,000 kilometres of expressways in the next 10 years may help address some of such issues (Wikipedia, n.d.).
Due to high construction costs and the amount of time taken to build new expressways, we recommend enhancing the existing roads.
FUTURE RESEARCH OPTIONS
Though the following factors are not part of our research study, we briefly mention these miscellaneous recommendations that deserve consideration and could be a part of future research topic.
The Time of Day
The increase in accidents at night seems to be concentrated in two districts in Kerala and therefore further investigation in this area is required.
Enforcing Traffic Rules
The drivers and pedestrians should comply with the traffic rules and this must be strictly enforced. For instance, it is not uncommon to see two adults and two children on a two-wheeler, where only 2 adults and 1 child are legally allowed to travel by a two-wheeler. Further, concerned over the rising number of two-wheeler accidents, the Kerala High Court has suggested an amendment of the Motor Vehicles Act and Rules, prohibiting women in sarees from riding pillion on two wheelers and carrying more than one child on the vehicle (Sebastian, 2008).
Emergency Calling System
Having an efficient emergency calling system like the 911 in the United States and expanding the 108 emergency services to all the states across India (currently operational in about 20 states and two Union Territories in India), might help decrease the number of deaths and injured in accidents.
Prohibition of Alcohol
A study conducted by the Alcohol and Drug Information Centre (ADIC) has revealed that around 40 per cent of the road accidents in India in general and 72 per cent on the national highways are due to drunk driving (Edayaranmula, 2005). Kerala has one of the highest per capita consumption of alcohol in the country. Prohibition of alcohol may help reduce the road accidents to a great extent.
Improvement in Quality of Roads
Defective road condition affects two-wheelers the most and there could be a correlation between bad road conditions and two-wheeler accidents. Thus, it is suggested to construct better roads with quality materials and increase the frequency of road maintenance.
Enhancing Efficiency of Police:
Despite the fact that speeding and traffic violations are very common, the commuters are not held accountable for these violations like in western countries such as the United States. A large and efficient police force can help in strict implementation of laws for safety.
Curbing Corruption
Corruption may be in the form of bribing officials for granting drivers’ licence without taking the road test. There should be a process to strictly enforce the licensing procedure and take action against corrupt officials.
CONCLUSIONS AND FUTURE RESEARCH
To conclude, the traffic accident situation in Kerala is projected to worsen over the years based on the forecast of accidents and the number of deaths and injured in accidents. Among the different contributing factors, two-wheelers and vehicle overtaking are found to be the primary factors causing accidents. This research finds that redesign of the traffic is an effective way to address these two issues. We recommend reserving a separate lane for two-wheelers in suburbs and cities, and strictly enforcing the helmet law. For commuters on highways, it is recommended to implement restrictions on overtaking based on the speed of the vehicle and traffic specific to that region. The other recommendations are to improve the condition of roads and upgrading the two-lane highways to four-lane highways. We believe this would effectively address the traffic accidents currently faced by the state of Kerala.
The simulation models discussed in this article could be extended to include “the time of the day when accidents occur” besides the other miscellaneous factors discussed in the article as potential areas of future research. In addition, this methodology could be used for addressing similar traffic situations in other states/cities of India (Transport Research Wing, 2001–02). These recommendations and the underlying managerial insights might alleviate the traffic accidents in the country.
ACKNOWLEDGEMENTS
The authors wish to acknowledge the outstanding and invaluable feedback from anonymous referees whose suggestions have improved the quality of this article significantly. The second author, Sudesh Poduval would like to acknowledge the learning experience and use of the ARENA simulation software from Prof. Robert Saltzman’s class at San Francisco State University.
APPENDIX I
Road accident related statistics
Forecasts—number of accidents neural networks (Alyuda)
Forecasts—Number of deaths in accidents—neural networks (Alyuda)
Forecasts—Number injured in accidents—neural networks (Alyuda)
Regression summary output (number of accidents vs. number of deaths in accidents)
Regression summary output (number of accidents vs. number injured in accidents)
Regression summary output (number of two-wheelers vs. number of deaths in accidents)
Regression summary output (reciprocal of number of vehicles vs. number of accidents)
Regression summary output (vehicles per km vs. accidents)
Appendix II
Appendix III
Simulation results