
Abstract
Executive Summary
This article addresses two main questions: Does a value premium exist in emerging market like India? If so, how pervasive is it in different market conditions? Value premium is assumed to be the difference in stock returns of undervalued and overvalued firms with a unique industry profile.
The sample for the study consisted of 32 companies from the Information Technology (IT) sector, the stocks of which had traded continuously in the National Stock Exchange (NSE) during the period 2000–2010. Prowess and Capitaline constitute the sources for the firm-level financial data, and NSE web sources provide data related to share prices and market capitalization.
The study involved a two-step empirical procedure: an exploratory factor analysis and a regression modelling under Ordinary Least Square (OLS) method. Exploratory factor analysis identified earnings growth and Earnings Price (E/P) rate as the prime determinants of stock returns. Expected earnings growth significantly explained E/P rate under OLS regression framework. The study then estimated normal E/P rate for the individual stock and compared the same with the actual E/P. If the actual E/P for a particular stock was greater than its estimated E/P, it was inferred that the stock was undervalued, the reverse being the case for overvaluation.
The findings of this research provide empirical validity of use of E/P rate in identifying mispriced stocks in the Indian context. Undervalued stocks can produce better returns compared to overvalued stocks, and their success has been both persistent and impressive. E/P rate or P/E ratio is a valuable analytic device when properly interpreted. The publicly available E/P rate seems to possess information content and warrants an investor’s attention at the time of his portfolio formation or revision. The search process involving E/P rate suggests that the best buy would be the stock whose reported earnings per share is expected to grow most rapidly.
The question of whether value strategies outperform growth strategies has been a matter of empirical investigation for the last several years. Many academic researches provide conclusive evidence on this issue in different country contexts. As per the financial literature, the difference in return produced by these two investment strategies is the value premium. The fundamental analysts adjust their strategies towards this premium.
Value strategies trace their roots to Graham and Dodd (1934). One of the pioneer studies on the outperformance of growth by value was by Basu (1977). Chan, Hamao, and Lakonishok (1991) observed similar results on value stocks in Japan. Fama and French (1992, 1996) and Lakonishok, Shleifer, and Vishny (1994) proved the existence of strong value premium in average returns for the US stocks. By using data on the US, Japan, and European markets, Capaul, Rowley, and Sharpe (1993) found value premium pervasive in international stock returns. Bauman, Conover, and Miller (1998) extended the previous study by Capaul, Rowley, and Sharpe (1993) in terms of time and coverage (21 countries) and confirmed that value outperformed growth, though not necessarily in every country or in every year. Arshanapalli, Coggin, and Doukas (1998) reinforced the relation of such findings with international market further, but suggested that value strategies were not riskier than growth strategies. Abhyankar, Ho, and Zho (2006), by using US data, found strong evidence that value stocks stochastically dominated growth stocks during economic boom periods, but lacked such dominance during recession period. However, in the Indian context, the findings of Saji (2012) provided evidence on the outperformance of growth stocks by value stocks during market downturn. Deb (2012) made similar observation with regard to the existence of value premium in the Indian stock market. While Gulen, Xing, and Zhang (2010) showed time variations of expected returns, Athanassakos (2009) corroborated the findings of earlier studies by using Canadian data.
On reviewing the literature, it is obvious that the academic community has consensus on the outperformance of growth strategies by value strategies, but the underlying reasons for the performance are controversial. Fama and French (1996) attributed the higher returns of value strategies to their increased risk. They argued that the value stocks compensated investors for bearing high fundamental risks. Lakonishok et al. (1994) found cognitive biases in investor behaviour and agency costs as the major causes of higher rewards to value investing. Kothari, Shanken, and Sloan (1995) identified data selection bias as the reasons for superior performance of value investing, but Chan, Jegadeesh, and Lakonishok (1995) repudiated that argument. Dreman and Berry (1995) found analysts’ errors having an asymmetrical influence on high and low P/E stocks. Laporta (1996) stated that value stocks generated superior returns due to the behaviour attributes and expectation errors made by investors.
There also exists strong disagreement among academic research as to the choice of reliable indicator of market valuation of firms. Basu (1977) and Campbell and Shiller (1998) found Price to Earnings (P/E) ratio as a good predictor of equity returns. Chan et al. (1991) suggested that Book to Market (B/M) value and Cash flows to Price (C/P) were significant in variation of returns. Fama and French (1992) found firm size and B/M as the factors explaining the cross-sectional variations in returns, while Lakonishok et al. (1994) provided evidence only for B/M effect. Leledakis and Davidson (2001) stood for better predictability of returns by ratios of sales to price and debt to equity. Athanassakos (2009) showed P/E ratio as a better predictor of average equity returns than Price to Book (P/B) ratio.
This article does not offer alternative explanations to value versus growth investment strategies; instead, it aims to provide further evidence on the value premium, which has not been much explored in the Indian context. For the purpose of this study, value premium is assumed as the difference in stock returns of undervalued and overvalued firms with a unique industry profile. Two main questions are examined here: Does a value premium exist in an emerging market like India? If so, how pervasive is it in different market conditions?
Several factors make this study important. First, the period of the study, that is, from April 2000 to March 2010, when, in the strict sense, the Indian market had reached its present growth level. This period is significant for India because of other reasons as well. The prominent capital flow episode for the emerging market economies started in 2002 and almost ended in 2009 (Global Financial Stability Report, 2010). Cardarelli, Elekdag, and Kose (2010) specifically documented the importance of this period for emerging economies like India. To the best of our knowledge, no exhaustive study on value versus growth aspect, under a cross-sectional regression framework, has been carried out so far in the Indian context during this period.
Second, this study provides rigorous statistical treatment for analysing the issue under investigation. From factor identification to fixation of style-specific benchmark, the quantitative methodology pursued in the study is expected to proliferate in performance evaluation and attribution analysis.
Third, unlike most prior studies, which focus on the value premium on portfolio basis, this study focuses on it at the individual stock level. This definitely makes the investors more familiar with the firm-specific characteristics, which lead stock valuation in different market conditions.
Finally, earning fundamentals and stock returns of firms in the same industry (Information Technology) with identical product mix or product policies can provide comparison that is more meaningful at the firm level analysis.
DATA AND METHODOLOGY
Data
The sample for the present study consisted of 32 companies from the Information Technology (IT) sector, the stocks of which had been traded continuously (having minimum 15 days of trading in every month of the study period) in NSE (National Stock Exchange) during the period 2000–2010. The focus on IT firms was natural because it was the fastest growing sector in India during the study period. The contribution of IT/ITES industry to the GDP of the country soared up to a share of 7 per cent in 2008 from a mere 1.2 per cent in 1998 (NASSCOM-Deloitte, 2008). Therefore, the theories we aim to test derive asset pricing information from such growth-oriented investment decisions.
Data on the firms under study were collected from three sources: Prowess (Centre for Monitoring of Indian Economy) and Capitaline for data measuring company fundamentals; NSE database for data related to share price and market capitalization; and stock price data adjusted for stock splits and bonus issue.
To determine the potential predictor of stock returns, 12 exploratory financial variables (including beta and stock returns) were drawn from the existing literature and intuitive knowledge of the data. The variables included EPS, earnings growth, Return on Equity (ROE), Return on Capital Employed (ROCE), Debt to Equity ratio, Beta (market risk premium), Earnings Price (E/P) rate or Earnings yield, Book Value per share (BV), Price to Book value ratio (P/B), Market Capitalization (MC), Dividend yield and Average Stock Return (AR). The sum of cash flow received and price change over the year, as a percentage of the price of investment at the beginning, gave the annual return.
Methodology
The methodology pursued in the study involved a two-step empirical procedure: an exploratory factor analysis and regression modeling under Ordinary Least Square (OLS) method. Exploratory factor analysis intended to discover the common factors or latent variables among the variables considered for the study. In this case, factor analysis found its application as a data reduction technique and could identify the variables that were potentially significant in explaining the variations in stock returns. The ultimate aim of this methodology was to select independent variables, which could be included in the regression estimation framework. OLS regression technique can measure and estimate causal relation between the identified fundamentals and stock returns. Further explanations of the methodology elaborate with the results and discussions.
RESULTS AND DISCUSSIONS
Factor Analysis
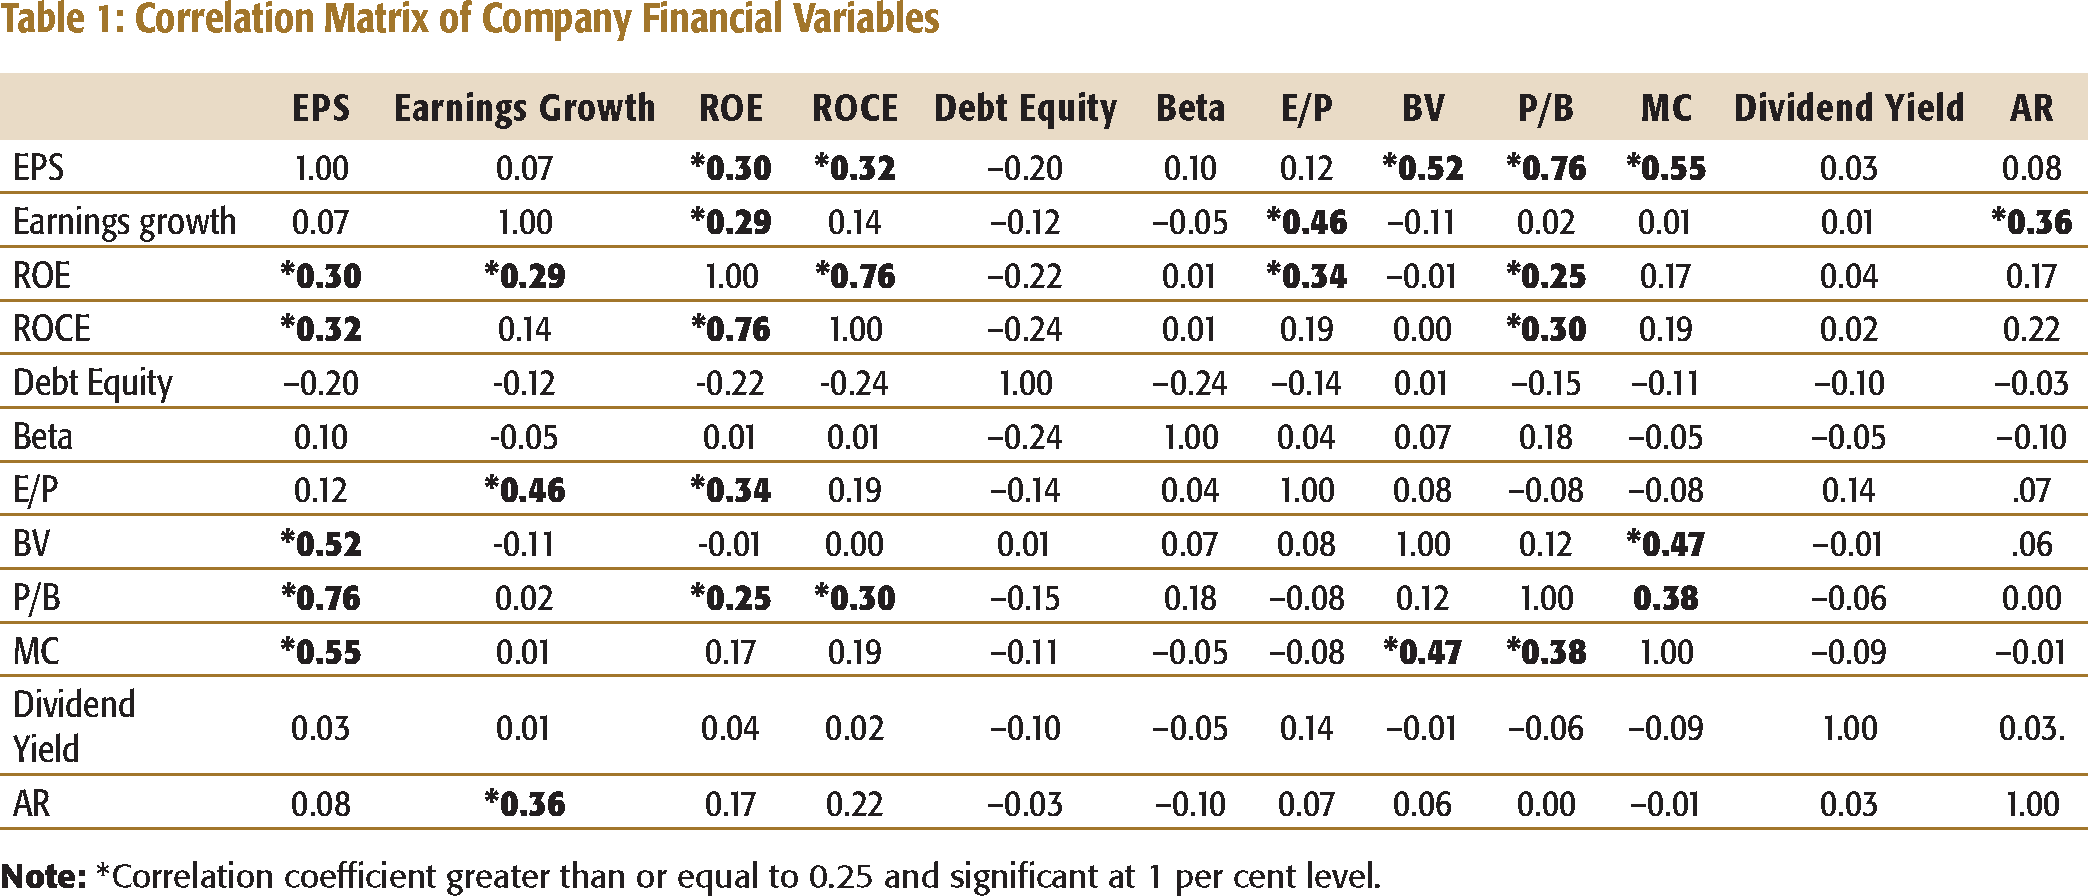
Exploratory factor analysis administered in the study investigated the dimension that would have caused correlations among the observed company fundamental variables. The factor extraction method of Principal Component Analysis (PCA) was opted to identify the critical factors. In PCA, the variables must correlate with each other for the factor model to be appropriate. So, a correlation coefficient matrix of selected variables was prepared at first for deciding the feasibility of PCA to the collected financial data and then a test proposed by Kaiser-Meyer-Olkin (KMO) (1974) and Bartlett (1937) was applied to see whether the sample variables were adequate for factor analysis. The correlation matrix and the results of KMO–Bartlett’s test are reported in Tables 1 and 2 respectively.
Correlation Matrix of Company Financial Variables
KMO and Bartlett’s Test of Sphericity
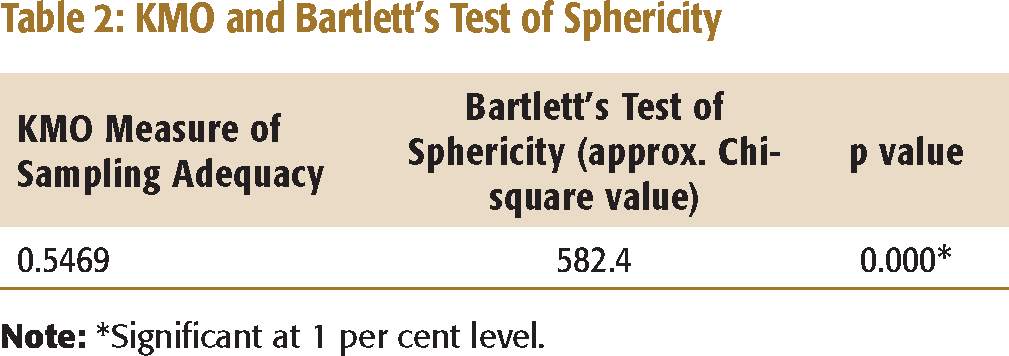
The KMO statistic reported in Table 2 represents the ratio of the squared correlation between the variables to the squared partial correlation between those variables. The KMO statistic varies between 0 and 1. Kaiser (1974) recommended values greater than 0.5 as acceptable. For the data used in this study, the value is 0.5469; hence, factor analysis is appropriate for the study.
The Bartlett’s measure tests the null hypothesis, that the original correlation matrix is an identity matrix. If the correlation matrix were an identity matrix, all correlation coefficients would be zero. For factor analysis to work, there should be some relationship between the variables and hence the correlation matrix should not be an identity matrix. Therefore, we hope to include some relationships between the variables in the analysis. For the data used in this study, Bartlett’s test is highly significant (p < 0.001), and therefore, factor analysis is appropriate for this study.
After testing the adequacy of the data and the explanatory variables, the study undertook factor analysis with the 12 company financial variables. For determining the number of factors, representing the financial data, eigen values were estimated. The eigen values associated with each factor represented the variance explained by that particular linear component. To have better interpretability of factors, the orthogonal factor rotation method Varimax was used. By following Kaiser’s (1974) rule of retaining factors with eigen values greater than unity, five factors were extracted from the data. Table 3
Varimax Rotated Factor Loading Matrix (2000–2010)
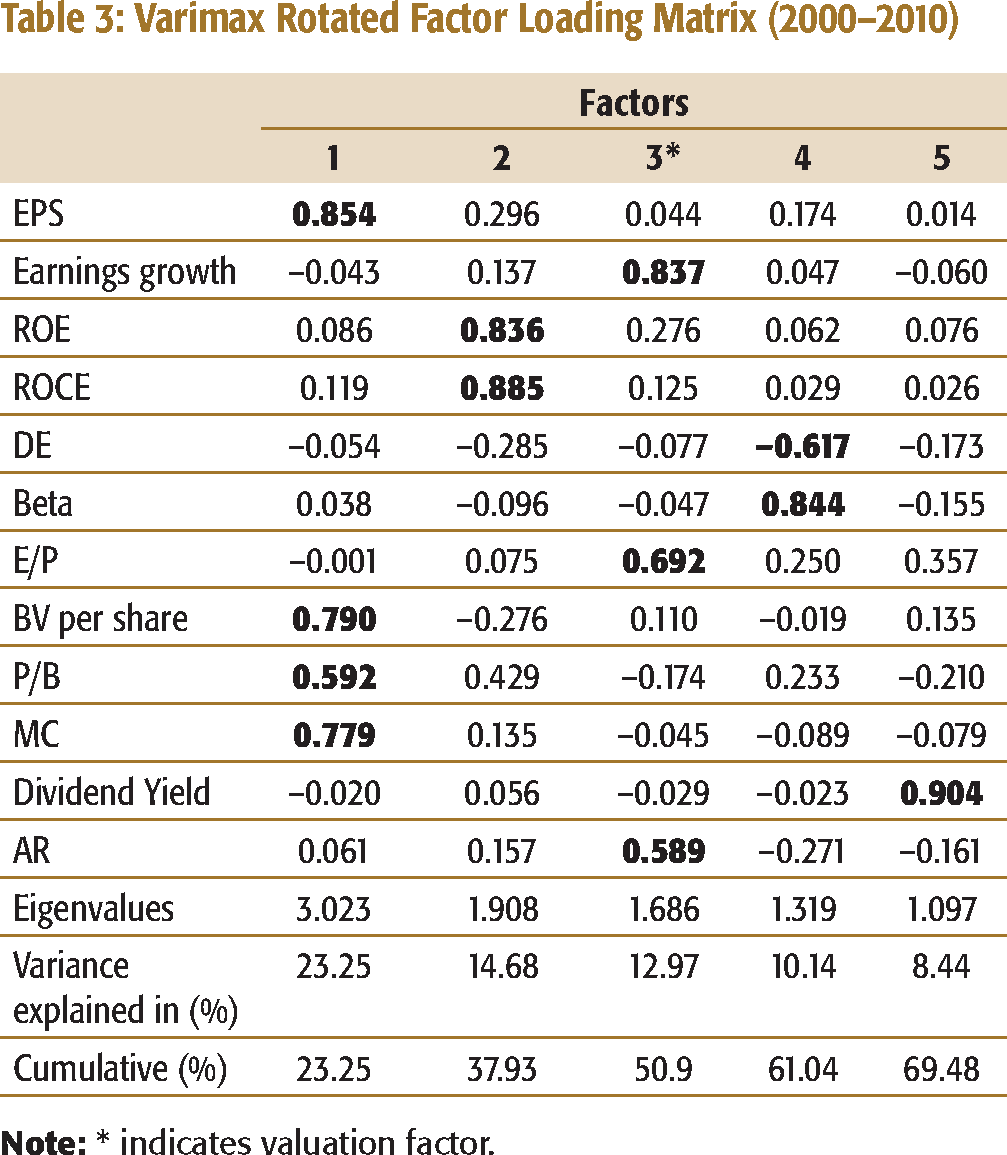
Since this study intended to verify the existence of value premium in the Indian context, we needed to focus only on the factor that would be loaded to stock returns, along with its probable determinants. Hence, Factor 3, labelled as the valuation factor, was the most relevant for further quantitative treatment as will be observed in the later part of the study. Valuation factor indicates how well the securities are valued in the market, and what determines its valuation and the valuation outcome. Earnings yield (E/P rate), earnings growth, and average return were positively loaded on valuation factor. Positive loading implies that the variables were positively correlated with the factor. Growth in earnings leads to larger increase in Earnings per Share (EPS) of firms relative to the market price of its share (increase in earnings yield/decrease in P/E ratio). An increase in this factor indicates that the company has high earnings per share, but the market price of its share is low which implies that the investment in it has good potential for growth in terms of capital appreciation in future. An increase in this factor over a period shall have a positive effect on the share price, thereby enabling the investors to enjoy increased returns from their investments.
Based on the findings of factor analysis, it was hypothesized that the financial variables included in the valuation factor constituted the major determinants of stock returns in India. To be precise, the variables—earnings growth and E/P rate—were considered as the prime parameters for tracking the price behaviour or returns of stocks in the Indian context. The validity of this hypothesis was further verified under a simple OLS regression framework.
Regression Analysis
Expected E/P Rate: Benchmark Estimate
The decision on a standard of comparison or an appropriate benchmark must follow the identification of stock return determinants. There are at least three possibilities for the appropriate benchmark. First, the observed determinant could be compared to the temporal benchmark; that is, its average over the previous several years. Here we may take the mean or the median value of that determinant overtime. The other two possibilities could be a cross-sectional benchmark, namely, an industry average and a theoretical benchmark developed under a standard regression framework. Since the earlier part of the analysis in this study found positive relationship between E/P rate and stock returns in India, an OLS regression can estimate a theoretical E/P (hereafter-expected E/P) rate.
One of the first studies to employ regression methodology for estimating PE (reciprocal of E/P rate) ratio is by Whitbeck and Kisor (1963). Their study found that projected earnings growth, expected dividend payout, and growth risk explained the differences in P/E ratios. Bower and Bower (1969) used a similar approach and found almost the same effects of earnings growth and payout on P/E ratio. Malkiel and Cragg (1970) studied the effects of historical growth of earnings, dividend payout ratio, and the stock’s rate of return relative to the market in determining P/E. Bernard and Thomas (1989) and Clare and Thomas (1995) used similar methodology to estimate the P/E ratio for a given set of fundamentals. Even though strong disagreements exist among equity researchers as to the relation between company fundamentals and P/E ratios, most of them have consensus as to the existence of causal relationship between expected growth rate and P/E ratios of companies in various markets. This study used the E/P rate rather than the P/E ratio as dependent variable because of many reasons. Some of the studies, for example, Litzenberger and Rao (1971), posited linearity in E/P (not in P/E). The study covered an episodic period of Indian market; hence, during the days of negative earnings, the measurement of P/E ratio in real mathematical terms is not possible. Moreover, the general approach pursued in factor analysis in the earlier section of this study found the co-movement of E/P rate and the growth rate of earnings.
Fundamental analysts generally consider the capitalization rate of the current stock earnings as the outcome of psychological as well as economic factors. The forecast rate of growth in reported earnings is likely to be the single most determinant of the price the investors are willing to pay. The absence of significant correlation between E/P rate and financial variables excluding earnings growth gives sufficient freedom to assume that E/P rate is the sole function of its expected growth rate of earnings. Thus, a simple regression model, which regress the E/P rate of selected firms against their expected earnings growth rate, can validate the fundamental theory. However, this type of analysis may indicate the relative level of E/P rate of selected stocks (compared with the E/P rate for a normalized level), but does not indicate the specific level of E/P rate that is appropriate for a certain stock.
For proceeding further, first we have to fit a single factor regression model explaining the causal relationship between the E/P and the expected earnings growth of a firm:

a and ui are constant and error term (which assumed to be zero) respectively
ϒi = Expected E/P rate
Xi = Expected earnings growth
βi = Impact of expected earnings growth on E/P rate
Expected Growth Rate of Earnings
The expected growth rate in earnings (EPS) is an important factor in equity valuation. If one expects a relatively stable cost and profit structure in the near future, the growth rate in earnings may equate with the projected growth rate in sales. However, as far as a growing service industry is concerned, this will never happen. This is because of the intensity of competition, increasing operating cost especially the employee cost, and the presence of heavy research and development expenditure in its cost structure. It is therefore rational to assume the expected growth rate of earnings in future as the function of the past earnings growth.
There are different approaches followed by analysts in ascertaining past earnings growth of firms. Sometimes they take arithmetic mean of growth rate of earnings of the firms for the past few years and, in some other cases, geometric mean instead of arithmetic average. For many investment problems that deal with rates of return, security analysts are interested in the geometric mean as opposed to the arithmetic mean. This is because arithmetic mean is always greater than the geometric mean. Nevertheless, in those cases when the individual growth rates are constant, the arithmetic mean and geometric mean will be the same (McEnally, 1986). For the purpose of analysis, one should use an average of earnings of ‘not less than five years’ (Graham & Dodd, 1934).
Previous researches in the area have used arithmetic mean of earnings growth under the assumption of constant average annual growth. The regression model used in this study also holds the same assumption, and hence arithmetic mean of the last five years (including the year of estimation) earnings growth rate was used as the expected growth of earnings in every fifth year.
>E/P Rate and Expected Earnings Growth: Regression Results
Table 4 displays the results of regression that included earnings growth as independent variable. The expected sign of the relationship between earnings growth and E/P is the same (positive) as in the factor analysis.
Earnings Price Rate and Expected Growth of Earnings: Regression Results
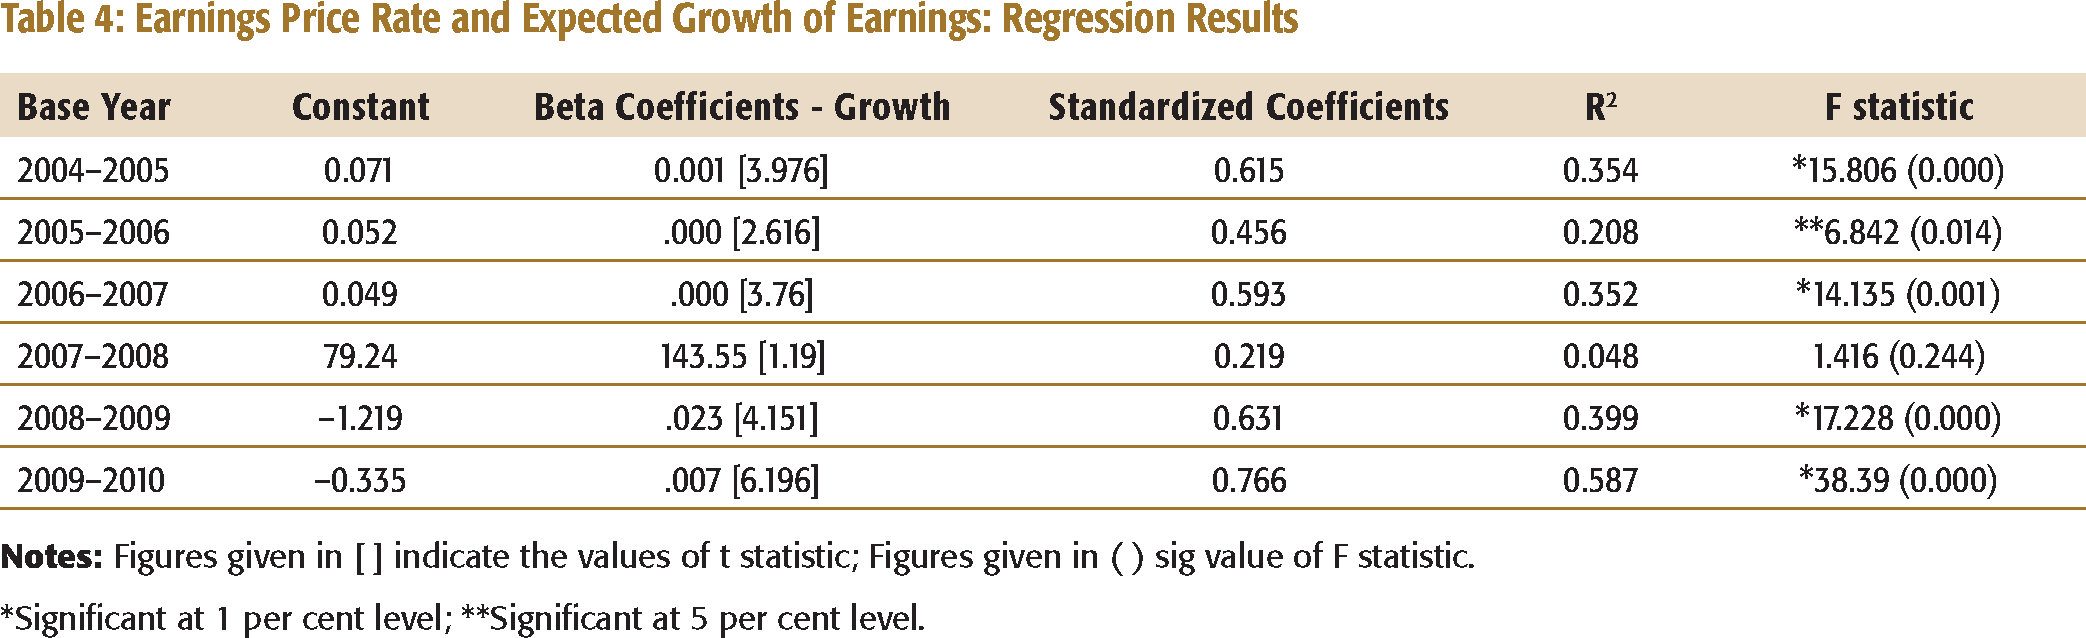
*Significant at 1 per cent level **Significant at 5 per cent level.
Comparison between Actual and Normal E/P Rates
The practitioners of value strategies often deny the efficient market hypothesis, which proposes the impossibility of earning excess returns in a market, which is efficient in terms of investment information. The value strategists also assert that P/E ratios, due to exaggerated investor expectations, may be an indicator of future investment performance and the use of which definitely helps investors in assessing the true worth of a stock and provides opportunity for them to take advantage of market disequilibria by acquiring low P/E (high E/P) stocks.
Once the analyst has determined the average relationship between the P/E ratio and the expected earnings growth for all stocks, then he can estimate the P/E ratio (Normal P/E ratio) for the individual stock and compare the same with the actual P/E. If the actual P/E for a particular stock is greater than its estimated P/E, he might conclude that the stock is overpriced, and if actual P/E is smaller than the Normal P/E, he will consider it as underpriced and may purchase with a reasonable expectation that its price will rise. If the actual P/E equals the Normal P/E, his claim is correct pricing of stock at the given market conditions. Since this study has used E/P rate, the conclusions of the comparison shall be just opposite of these investment judgements.
Actual E/P Rate and Expected E/P Rate of Stocks: A Comparison
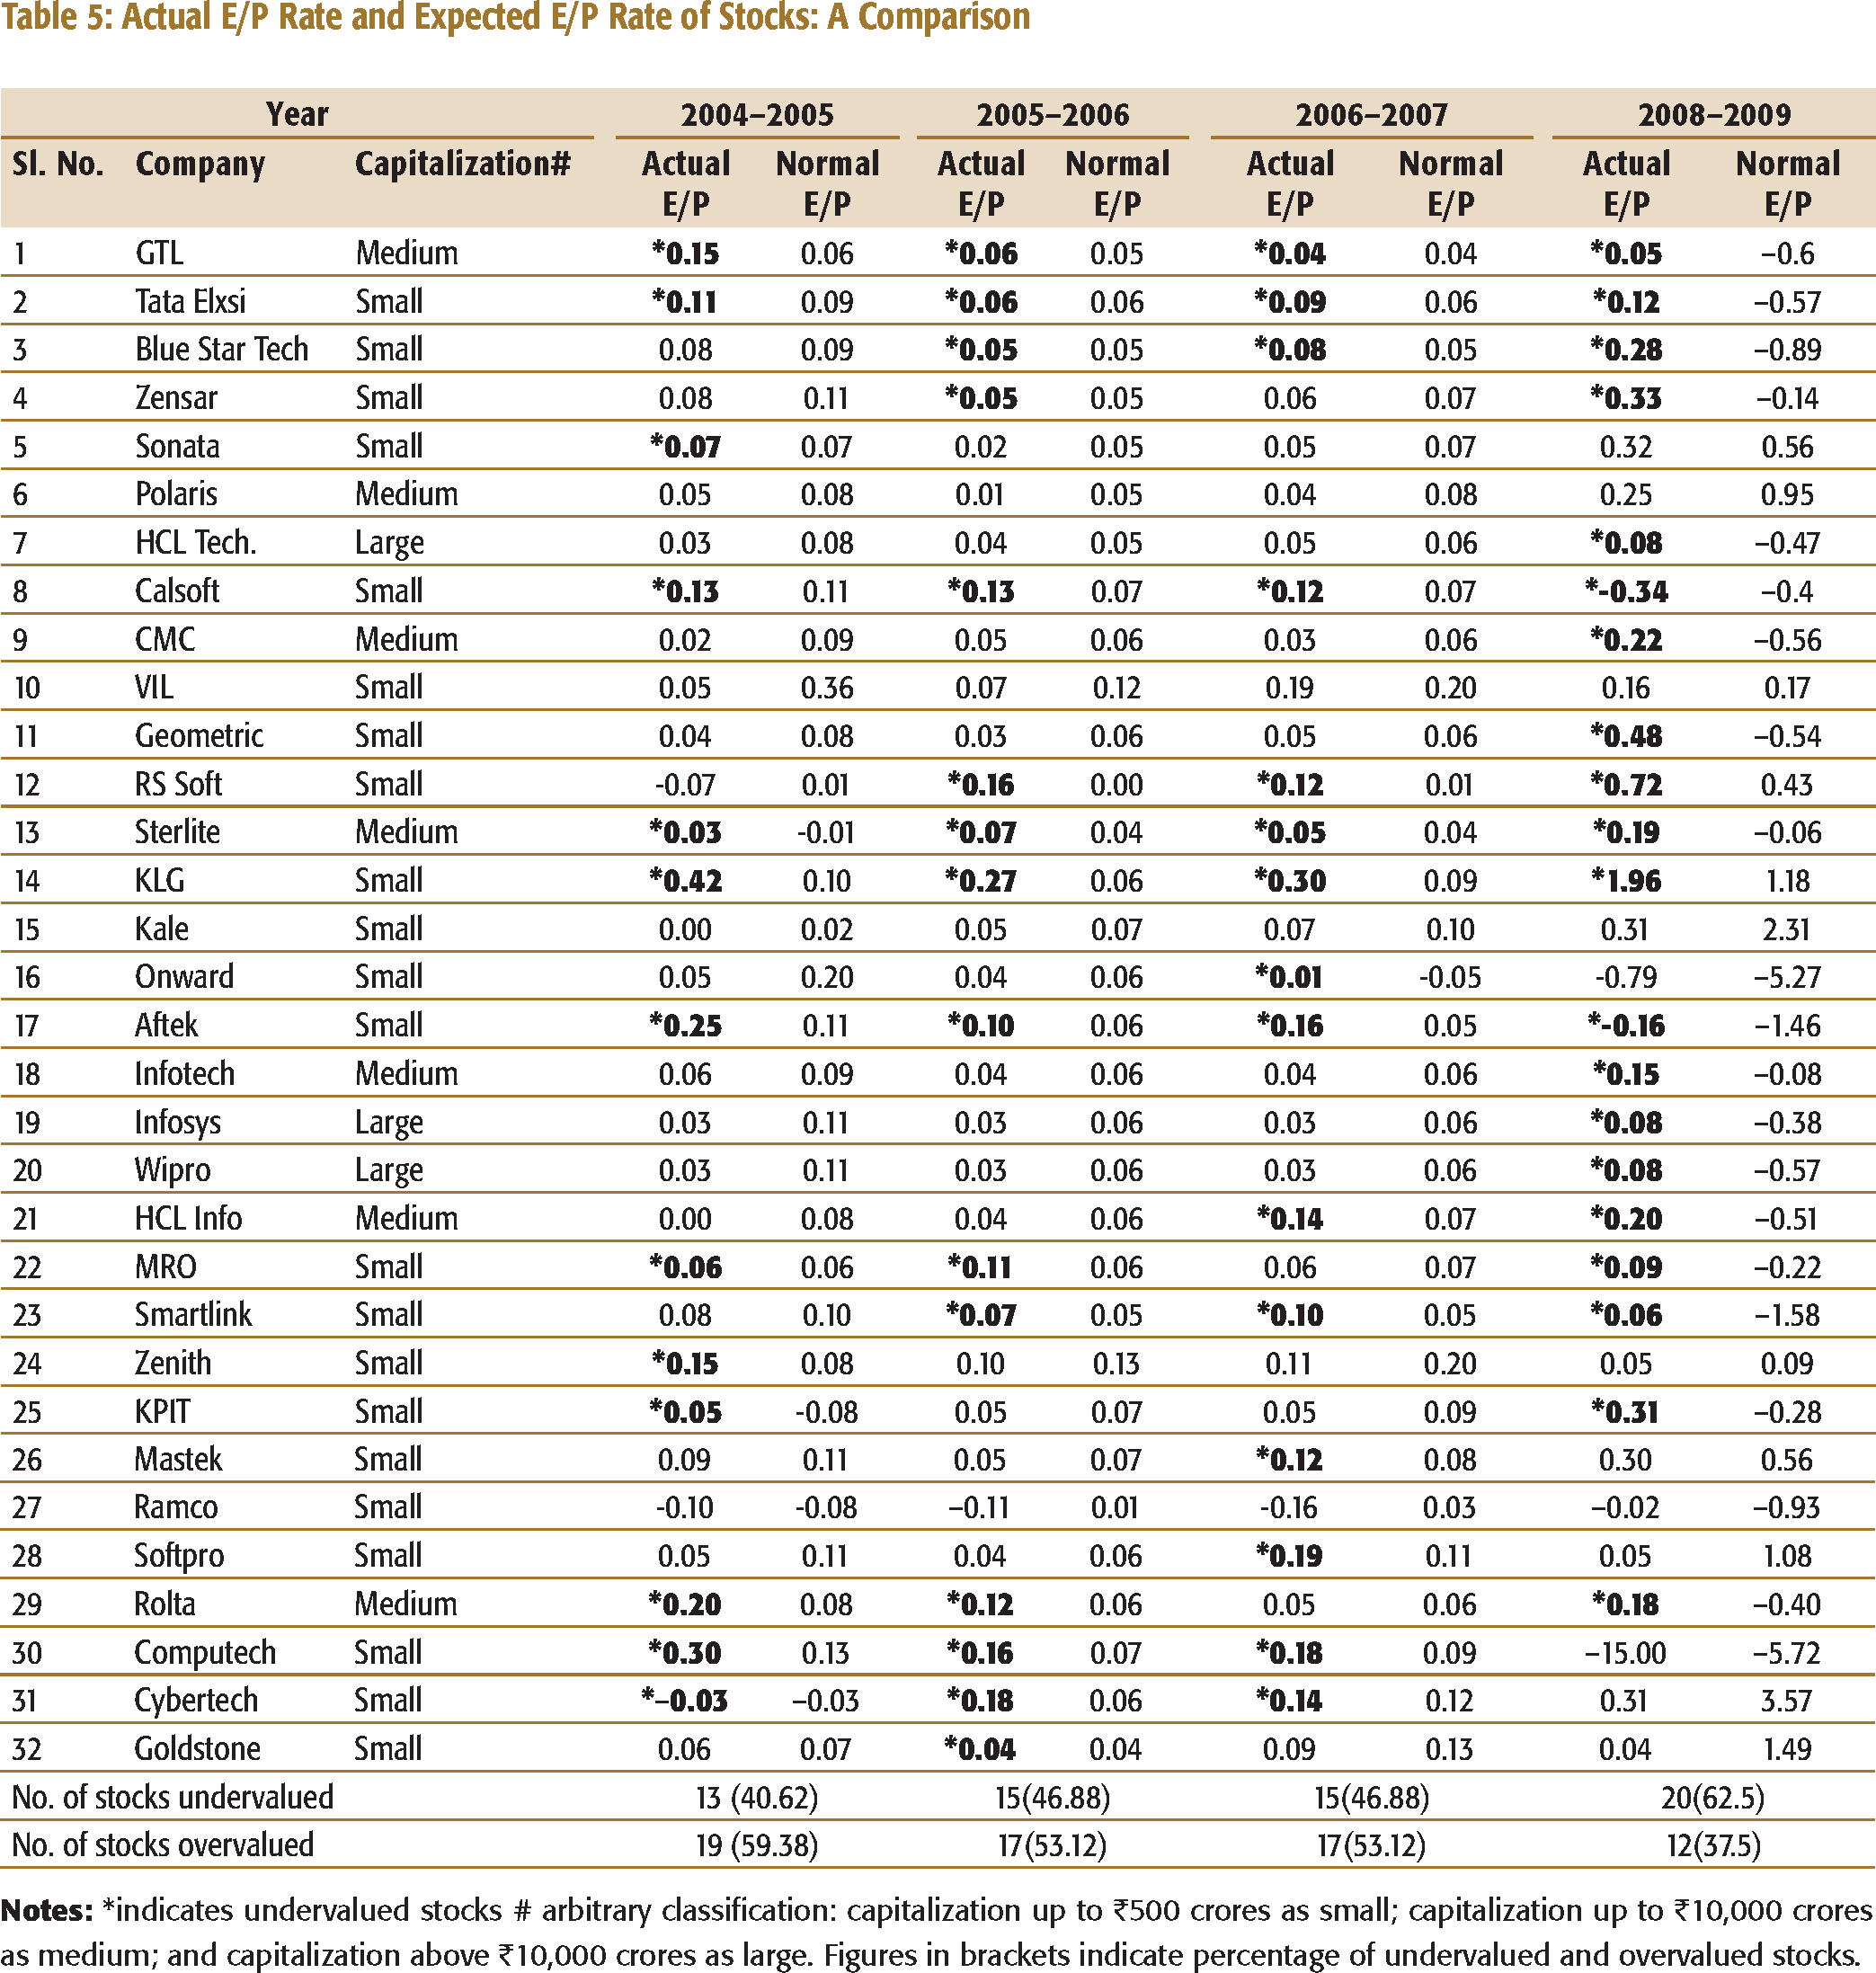
The analysis shows that 13 stocks were undervalued in 2004–2005, 15 stocks in 2005–2006, another 15 stocks in 2006–2007, and 20 stocks in 2008–2009. Stocks of certain medium- and small-sized companies like GTL, Tata Elxsi, California Softwares (Calsoft), Sterlite Technologies, KLG Systel, and Aftek were found to be undervalued in the market in all the four periods of analysis. It is worth mentioning that the market had overvalued some well-known stocks like Infosys, CMC, Wipro, and HCL Technologies in all years of observation. Similarly, stocks of some small companies (Computech and Cybertech) were successively undervalued by the market in all years except 2008–2009, the crisis year for the Indian economy as well as the Indian stock market. An overvaluation of small stocks during the financial crisis can be attributed to the play of traders/speculators who normally wish to trade in small stocks for capitalizing the opportunities created by the market imperfections.
Return Profile of Undervalued and Overvalued Stocks: A Comparison
Does the security valuation strategy based on E/P rate of fundamentalists really help the investors to produce better returns (value premium) in the subsequent year of market valuation of stocks? For answering this question, it was assumed that an investor should purchase the sample stocks on the first day of the accounting period subsequent to the year in which the valuation is done and hold it until the last trading day of that period. By taking the difference in the market values of the stocks on these two dates, plus any dividend declared and paid during the period, the return that he would have made from it, was computed. Such comparison was done only for four periods—2005–2006, 2006–2007, 2007–2008, and 2009–2010. No significant relations could be established between earnings growth and E/P rate in 2007–2008; hence, no comparison was made in the subsequent year (2008–2009). Similarly, the study covered up to March 2010; so, no comparison was undertaken for 2010–2011.
The analysis of Table 6 reveals that in 2005–2006, the return profile of undervalued stocks was outstanding compared to its counter group of overvalued stocks. Among the top 20 stocks in terms of producing return during the year, 10 stocks came from the undervalued group of its preceding year, 2004–2005. Out of these 10 stocks, three ranked as the top three well-performing stocks by delivering returns at an outstanding scale of 136.47 per cent to 374.38 per cent. The six undervalued stocks were included among the best ten stocks (in the sample) of the year. It is also very interesting to note that when the performance of 7 out of 19 overvalued stocks gave negative returns to their investors, the performance of only 1 among 13 undervalued stocks was negative.
Looking across the column of 2006–2007 in Table 6, a pattern of positive returns for undervalued stocks and negative returns for overvalued stocks can be observed. Moreover, the trend and pattern of performance of undervalued stocks in 2006–2007 is the same as 2005–2006. Out of the 18 stocks, which generated positive returns during that year, ten belonged to the undervalued group. The stocks that delivered high returns to their investors (here we mean more than 200 %) came only from the stocks assessed as undervalued in 2005–2006.
Return Profile of Undervalued and Overvalued Stocks
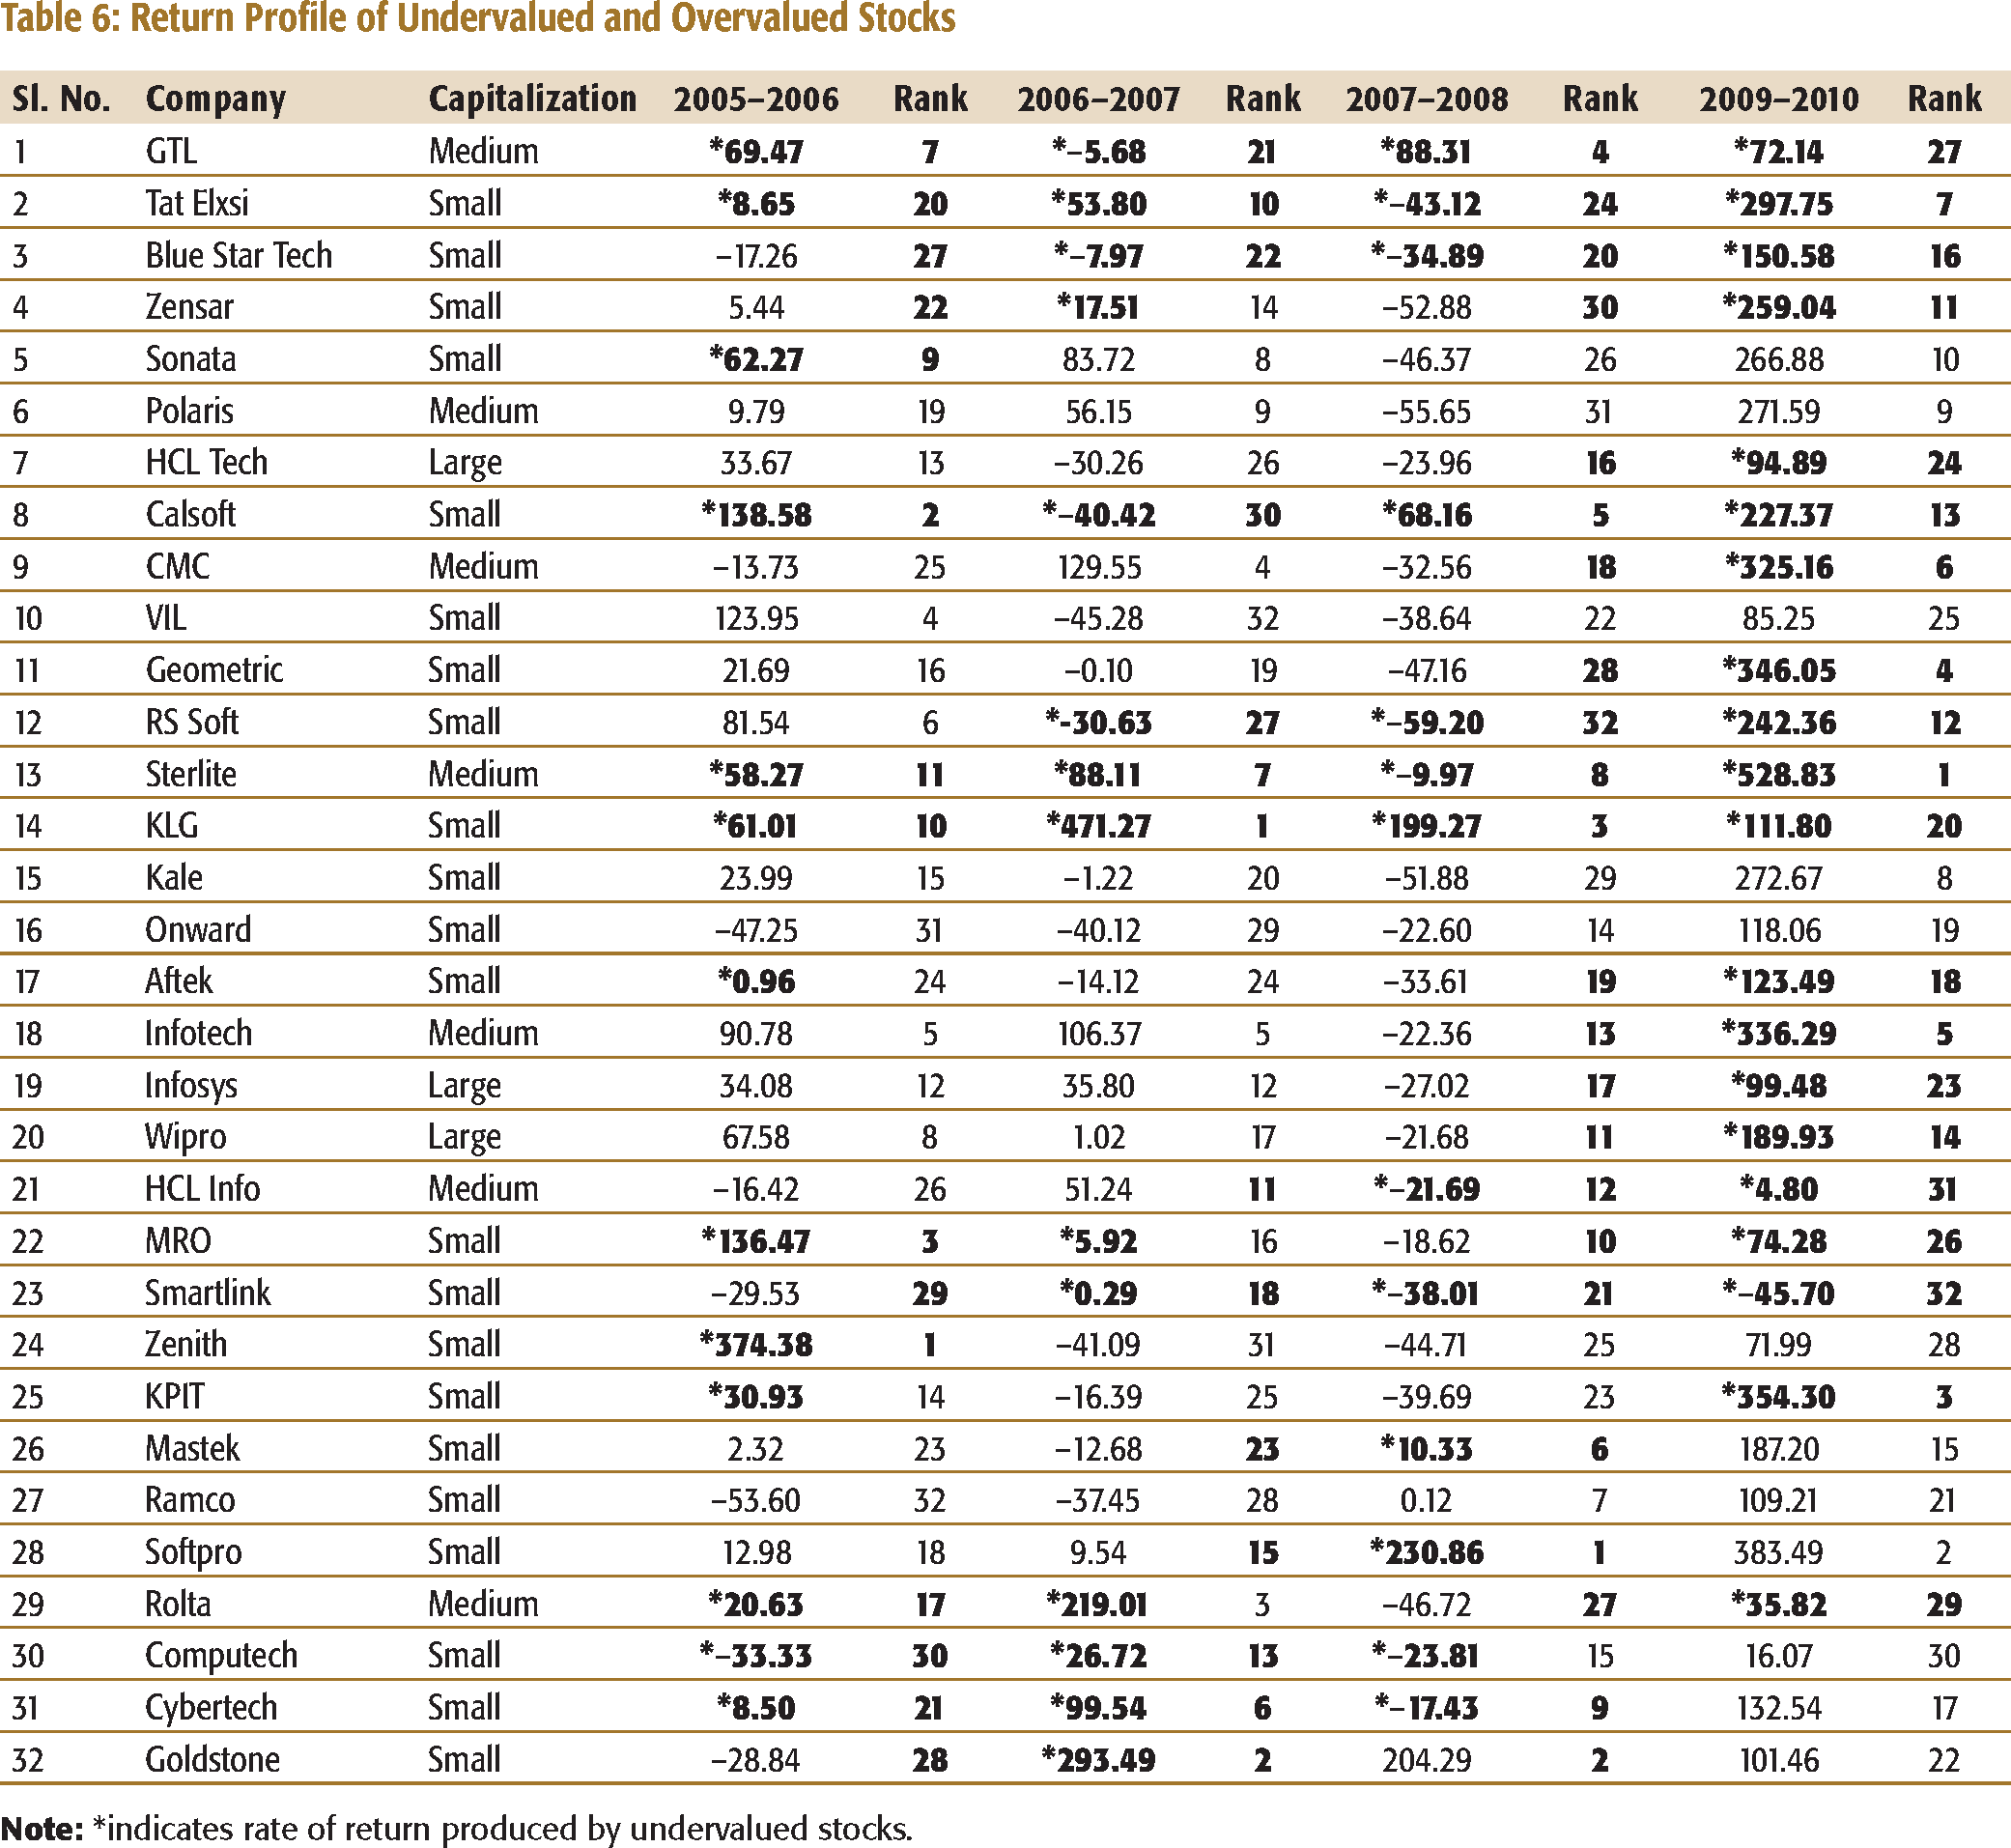
All stocks (except Smartlink) included in the sample were able to deliver relatively good returns to their investors in 2009–2010. To an extent, we can attribute this fact to the gradual revival of investor confidence after the shock that global economic recession exerted on Indian financial system, and to the reinstatement of the stable political system of the country. Both these factors led to rushed purchase of stocks that in turn made a surge in their market value. However, when we closely look into the pattern of their growth in value during this period, we can see that the growth rate was remarkably high in case of most of the stocks that were under-valued according to Table 5 by the same market in the preceding year. Of the five stocks, which occupied the foremost positions in terms of growth in value among the group, four were from the undervalued group. When six of the undervalued stocks were able to produce returns at a rate, which was 300 per cent or more, only one of the overvalued stocks was able to generate return to its investors at that scale. A close analysis of the results also reveals that the stock investments in small-sized firms earned significantly higher rates of return than the similar investments in large-sized companies. This finding is in conformity with the findings of Banz (1981).
Mean Annual Returns of Undervalued and Overvalued Stocks
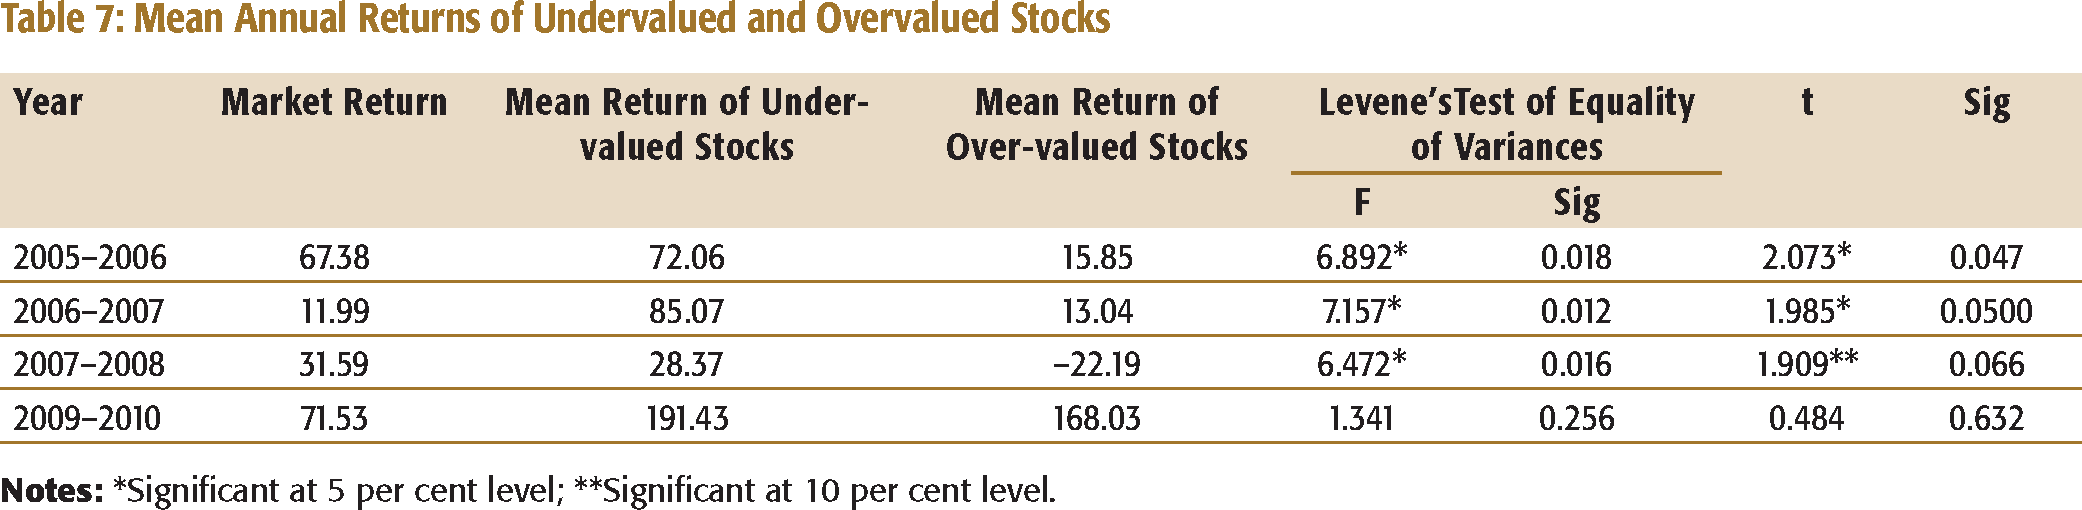
It is implicit from the analysis that during all the periods of observation (except in 2007–2008), undervalued stocks received returns (on average) at a rate which were much higher than the rate of return given by the market index. However, overvalued stocks were able to beat the market in terms of returns only in 2009–2010. In all the other years of observation, the performance of overvalued stocks was poorer than the overall market performance. The t-test checked the statistical significance of the difference in returns of the two groups of stocks. The test procedure demands the checking of the equality of variances of the groups for having inferences that are more useful. The Levene’s test of homogeneity of variance based on F statistic was used for this purpose, which rejected the null hypothesis that the variances of the groups under observation were the same. When the variances are not equal, one should use Welch’s modification test (Gastwirth, Gel, & Miao, 2009). Therefore, we chose the output of Welch’s test for drawing inference as to the significance of difference in stock returns. The Welch’s test found the difference in mean returns of undervalued and overvalued stocks statistically significant at 5 per cent level (in 2005–2006 and 2006–2007) and at 10 per cent level (in 2007–2008). In 2009–2010, the analysis has not observed the statistical significance of difference in the performance of two group stocks at any level. The continuity of the superior performance of undervalued stocks relative to the market, as well as overvalued stocks reinforce the validity of the argument of the investment strategists in the use of P/E ratio as the tool for earning excess returns from stock market investments.
CONCLUSION
From the above discussions, it may be right to conclude that value strategies outperform growth strategies in managing stock market investments in India. In other words, existence of value premium is evident in the Indian context. This paper finds earnings growth, E/P rate, and stock returns to be positively correlated. The estimation of E/P rate using earnings growth and the comparison of the same with actual E/P rate can identify mispriced stocks in the Indian context. Undervalued stocks can produce better returns than overvalued stocks, and their success has been both persistent and impressive. In each of the four years following the year in which the stocks were evaluated, the undervalued group had a mean return performance superior to that of the stocks labelled as overvalued in terms of its expected E/P rate. Therefore, the E/P rate or the P/E ratio is a valuable analytic device when properly interpreted. It is of primary importance in assisting investors in evaluating stock purchases and particularly helpful in the difficult analysis of the growth situations. The publicly available E/P rate seems to possess information content and warrant an investor’s attention at the time of his portfolio formation or revision. The search process involving E/P rate suggests that the best buy would be the stock whose reported earnings per share is expected to grow most rapidly. On a long-term perspective, investment in fundamentally strong companies, having low P/E ratio or high E/P rate, would definitely deliver better returns than those provided by other strategies. However, one should be more cautious in estimating the growth rate of earnings; otherwise, the outcome may not be as per the expectation. The other company financials do not seem to be of much significance in explaining the variations in stock returns in India.