
Abstract
Background
The diagnosis of lung cancer is based on the microscopic exam of tissue or liquid. During the recent decade, many biomarkers have been pointed to have a potential diagnostic role. These biomarkers may be assessed in blood, pleural effusion or sputum and they could avoid biopsies or other risky procedures. The authors aimed to assess the diagnostic performances of biomarkers focusing on micro-RNA and metabolites.
Methods
This meta-analysis was conducted under the PRISMA guidelines during a nine-year-period (2013–2022). the Meta-Disc software 5.4 (free version) was used. Q test and I2 statistics were carried out to explore the heterogeneity among studies. Meta-regression was performed in case of significant heterogeneity. Publication bias was assessed using the funnel plot test and the Egger's test (free version JASP).
Results
According to our inclusion criteria, 165 studies from 79 articles were included. The pooled SEN, SPE and dOR accounted, respectively, for 0.76, 0.79 and 13.927. The AUC was estimated to 0.859 suggesting a good diagnostic accuracy. The heterogeneity in the pooled SEN and SPE was statistically significant. The meta-regression analysis focusing on the technique used, the sample, the number of biomarkers, the biomarker subtype, the tumor stage and the ethnicity revealed the biomarker number (p = 0.009) and the tumor stage (p = 0.0241) as potential sources of heterogeneity.
Conclusion
Even if this meta-analysis highlighted the potential diagnostic utility of biomarkers, more prospective studies should be performed, especially to assess the biomarkers’ diagnostic potential in early-stage lung cancers.
Introduction
The diagnosis of lung cancer is commonly made on biopsies, surgical specimen or cytologies (bronchial liquid, pleural effusion). Since a decade, biopsies have been considered as evils and risky procedures, and many researches were performed in order to use non-invasive procedures to make a diagnosis of lung cancer. In this context, biomarkers represented a possible surrogate for tissue in order to perform the diagnosis.1–3
A biomarker is a physical, biological or molecular state defining a new entity, a prognostic group or predicting a response to a treatment. A good biomarker implies an improvement in the take-care process.2,4 Many samples can be used in the assessment of biomarkers in lung cancer including bronchial liquid, bronchoalveolar lavage (BAL), sputum, urine, pleural or peritoneal fluid or blood. Liquid biopsy has changed the management of lung cancer and represents an alternative to tissue in order to highlight therapeutic targets. 1 It also gained a place in the diagnostic field of lung cancer.
The most cited diagnostic biomarkers of lung cancer are represented by auto-antibodies, circulating tumor cells, exosomes, micro-RNA, metabolomics and proteomics.
Autoantibodies are defined as antibodies produced against abnormal tumor cell antigens. They are present in little amounts and are assessed using common laboratory techniques (ELISA). Many false negative cases have been reported.4,5 Circulating tumor cells are rare and are always surrounded by 106 to 107 leucocytes. Their presence and amount are independent from the tumor stage or the microscopic subtype.6–10 The exosomes are vesicles measuring 40–100 nm. They are present in many biological liquids consisting of plasma, serum, sputum, bile, BAL or amniotic liquid. They play a key role in angiogenesis, vascular permeability, epithelial–mesenchymal transition and resistance to chemotherapy. The assessment of exosomes is based on extraction techniques which consist of precipitation, ultra-centrifugation, chip-microfluidics and detection techniques in order to assess their composition. The detection techniques consist of real-time PCR, ELISA, flow cytometry or western blot techniques. The major challenges of diagnosis are represented by the fact that the extracted exosomes aren’t necessarily from tumor cells. 11 Micro-RNA are tissue-specific and cellular type-specific. They have a role in post-transcriptional regulation and are implicated in the carcinogenesis, the cell apoptosis or some viral infections. In addition to the messenger RNA, many non-coding RNA molecules have been assessed including ribosomal RNA, transfer RNA, small nuclear RNA, small nucleolar RNA and other RNA including large RNA. Micro-RNAs have been reported to play a key role in the diagnosis of lung cancer.10,11 Proteomics studies are defined as the analysis of protein and have represented an alternative to the DNA or RNA analysis because of the fact that the same genome can produce different proteomes. Metabolomic consists of the analysis of different metabolites and has been reported in the diagnosis of lung cancer. It consists of the assessment of different metabolites present in urine or sputum. 11 According to the literature, using diagnostic biomarkers is needed in three major circumstances consisting of the early diagnosis and the assessment of indeterminate nodules diagnosed by the low dose CT-scan, early diagnosis of recurrences and the diagnosis of multiple pulmonary nodules. The authors aimed to assess the diagnostic value of the micro-RNA, exosomal micro-RNA and metabolites biomarkers that were reported in lung cancer.
Methods
Data source and search
This meta-analysis was conducted under the guidelines of the Preferred Reporting Items for Systematic Reviews and Meta-Analyses (PRISMA). 12 To retrieve all eligible articles, PubMed, Embase databases and Cochrane Library were comprehensively searched during a nine-year period, from 2013 to 2022 with limitation to French and English language. The search medical subject heading (MeSH) terms employed for literature retrieval included: biomarkers OR microRNA OR exosomes OR metabolomic OR metabolites OR extracellular vesicles AND diagnostic OR diagnosis OR sensitivity OR specificity OR Receiver operating characteristic curve AND lung cancer OR non-small cell lung carcinoma OR large cell lung carcinoma OR squamous cell carcinoma. The reference list of eligible articles was also independently searched to obtain other valuable sources. According to inclusion criteria, titles and abstracts of all retrieved publications were screened and judged.
Study selection criteria
To be qualified for inclusion in this meta-analysis, articles must comply with all the following criteria: The articles were original articles consisting of cohort studies or case–control studies, articles evaluated the diagnostic value of the different biomarkers (microRNA, exosomes, metabolites) in plasma/serum, sputum, BAL, pleural effusion or blood for lung cancer diagnosis, the diagnosis of lung cancer was confirmed by the gold standard test which is the microscopic exam performed on biopsy or cytology and articles provided sufficient data (true negative (TN), true positive (TP), false negative (FN) and false positive (FP)). The major exclusion criteria were as follows: Studies assessing biomarkers in tissue, studies without gold standard test, studies published before 2013, technical reports, case reports, comments or letters with invalid data. Studies with duplicate data reported in other studies and reviews weren’t included.
Data extraction and quality assessment
Two investigators independently reviewed all the articles and extracted data from the selected articles: first authors’ name, publication year, characteristics of the biomarkers (source of control, number of cases and controls, sample types), assay methods, assay indicators, microscopic subtype, TP, FP, TN, FN cases and quality assessment information.
Quality assessment was based on the revised quality assessment of diagnosis, accuracy studies-2 (QUADAS-2) criteria. 13 The most relevant items were chosen to be assessed and two reviewers (MM and MMZ) used the quality of assessment checklist (Table 1). Any disagreements were resolved by discussion and consensus. The included articles were rated taking into account the four key domains: patient selection, index test, reference standard and flow and timing. 13 Study quality was assessed using the QUADAS-list, with each item scored as 1 for yes, −1 for no and 0 for unclear. Patient selection items focused on the representativeness of the patients who received the test and the justification of the withdrawals (maximum score = 2), the flow and timing domain focused on the time period between the reference standard and the index test (maximum score = 1), the reference standard domain focused on the capacity of the reference test to classify the target condition, the use of the reference test for all the patients regardless of the index test, the independence between the reference and the index test (maximum score = 4) and the index test domain focused on the condition of interpretation of the index test and the details about the uninterruptible and intermediate results (maximum score = 4). According to the items of quality chosen from QUADAS checklist, the maximum score accounted for 11.
The detailed quality assessment of the different articles included.
Statistical analysis
We used the Meta-Disc software 5.4 (free version) to conduct this meta-analysis. The pooled sensitivity (SEN) (TP/TP + FN), specificity (SPE) (TN/TN + FP), negative likelihood ratio (NLR), positive likelihood ratio (PLR) and diagnostic odds ratio (DOR) with the 95% confidence intervals were calculated.
At the same time, we constructed the summary receiver operator characteristic (sROC) curve and calculated the area under the SROC curve based on the SEN and SPE of each study.
Threshold effect
A threshold effect was assessed using the Moses model with calculation of the Spearman correlation coefficient.
Heterogeneity
Q test and I2 statistics were carried out to explore the heterogeneity among studies. P value <0.1 for q test or I2 value >50% represented substantial between-study heterogeneity. A random-effects model was used if significant heterogeneity existed (I2 value >50% or p < 0.1), otherwise a fixed-effects model was chosen. Based on the characteristics of the included articles, meta-regressions and subgroup analyses were performed to explore the sources of heterogeneity if necessary.
Publication bias
Publication bias was assessed using the funnel plot test and the Egger's test (free version JASP).
Results
Studies characteristics
A total of 898 articles were identified based on the search strategy adopted and were retrieved from PubMed, MEDLINE and the Cochrane database (Figure 1). After reviewing the titles and abstracts, removal of reviews, letters, non-English, non-human studies and unrelated articles, 123 full-text articles were obtained. Due to the lack of the gold standard test, assessment of only prognostic or therapeutic performances or incomplete data to reassess sensitivity and specificity, 79 full-text articles were included. After screening the references, no additional study was included. Finally, 165 studies from 79 articles were included, involving 22,224 participants. Twenty-one articles were considered as 2–8 studies because of the different biomarkers assessed.14–33 Mozzoni et al. assessed different biomarkers in different samples including plasma and exhaled breath. 34 Razzak et al., Tamiya et al., Fang et al., Yang et al. and Halvorsen et al. assessed different biomarkers with different controls including healthy participants, participants with inflammatory pulmonary diseases or participants with benign pulmonary nodules.35–39 Kim assessed a panel of biomarkers in different samples, BAL and sputum. 40 Jin et al. assessed different cases including NSCLC, adenocarcinomas and squamous cell carcinomas. 41 Liu et al. assessed different biomarkers using different techniques in different controls. 42 The data related to the diagnostic performance of biomarkers in lung cancer events eligible for inclusion are represented in Table 2. One hundred and nine studies (66.1%) assessed Asian participants and 56 studies (33.9%) included Caucasian participants. The gold standard test consisted of the microscopic diagnosis performed on tissues or cytologies. The event studies were lung cancer and 120 studies (72.7%) focused on non-small cell lung carcinomas (NSCLC), 29 focused on adenocarcinomas (17.6%), 15 studies focused on lung cancers (9.1%) and 1 study focused on squamous cell carcinomas (0.6%).
The flow chart shows the search strategy.
The diagnostic performance of the different studies included.
Fifty-four studies (32.7%) dealt with early stages (I/II) and 85 studies (51.5%) were about late and metastatic stages (III/IV) and 26 studies focused on all stages. The controls included consisted of healthy participants, participants with inflammatory pulmonary diseases or with benign pulmonary nodules.
Eighty-seven studies (52.7%) assessed a specific biomarker and 78 studies (47, 3%) assessed panels or classifiers. Biomarkers consisted of microRNA in 112 studies (67.9%), long non-coding RNA in 2 studies (1.2%), circular RNA in 4 studies (2.4%), exosomal micro-RNA in 31 studies (18.8%), metabolites in 9 studies (5.5%) and extracellular vesicle micro-RNA in 7 studies (4.2%). The techniques of diagnosis used consisted mainly of RT-PCR in 144 studies (87.3%). The other techniques used consisted of digital PCR in 11 studies (6.7%), mass spectrometry for proteomic assessment in 8 studies (4.8%) and tethered cationic lipoplex nanoparticles (tCLN) in 2 studies (1.2%).
The samples used consisted of plasma in 60 studies (36.4%), serum in 73 studies (44.2%), whole blood in 2 studies (1.2%), sputum in 21 studies (12.7%), BAL in 1 study (0.6%), exhaled breath in 2 studies (1.2%), peripheral blood mononucleated cells in 2 studies (1.2%) and pleural effusion in 4 studies (2.4%).
Quality assessment
Meta-disc 5.4 software was used to analyze the data by two writers. Different items related to four domains (patient selection, reference test, index test, flow and time) were picked up from the QUADAS-2 and were used to perform the quality assessment of the eligible studies. The maximum score accounted for 11. The mean score of the different studies included accounted for 3.45 (DS = 1.87) with extremes ranging from 2 to 11. The mean scores attributed, respectively, to the patient selection domain, the flow and timing domain, the reference standard domain and the index test domain accounted for 0/2 (SD = 0.0), 0.18/1 (SD = 0.384), 1.28/4 (SD = 0.451) and 1.05/4 (SD = 0.221).
Diagnostic performance
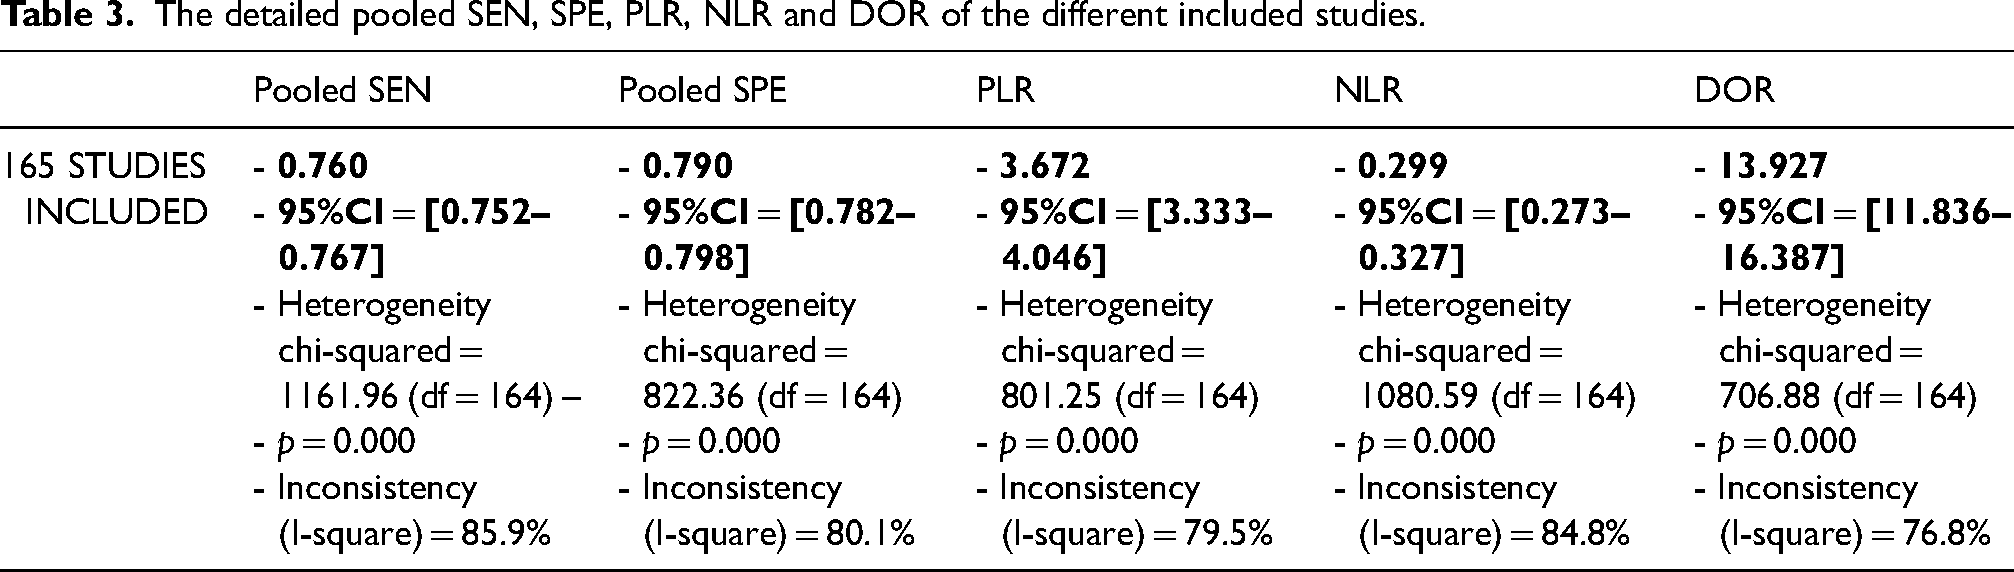
The Spearman correlation coefficient was −0.129 (p = 0.099), suggesting that the threshold effects were not statistically significant. The heterogeneity in the pooled SEN (I2 = 85.9%, p = 0.000) and SPE (I2 = 80.1%, p = 0.000) was statistically significant. Therefore, the pooled effect was analyzed by random effects model. The indexes were shown as follows: pooled SEN and SPE were 0.76 (95% confidence interval [CI]: 0.752–0.767) and 0.79 (95% CI: 0.782–0.798), pooled PLR and NLR were 3.672 (95% CI: 3.333–4.046) and 0.299 (95% CI: 0.273–0.327) and pooled DOR accounted for 13.927 (95%CI: 11.836–16.387). In addition, the sROC curve was shown to appraise diagnostic accuracy and the AUC was 0.859 suggesting that the different biomarkers assessed have a good diagnostic accuracy for diagnosing lung cancers (Figure 2). Table 3 illustrates the details of the different diagnostic parameters. To assess the different sources of heterogeneity, we conducted a series of analyses including publication bias, meta-regression and sub-group analysis.
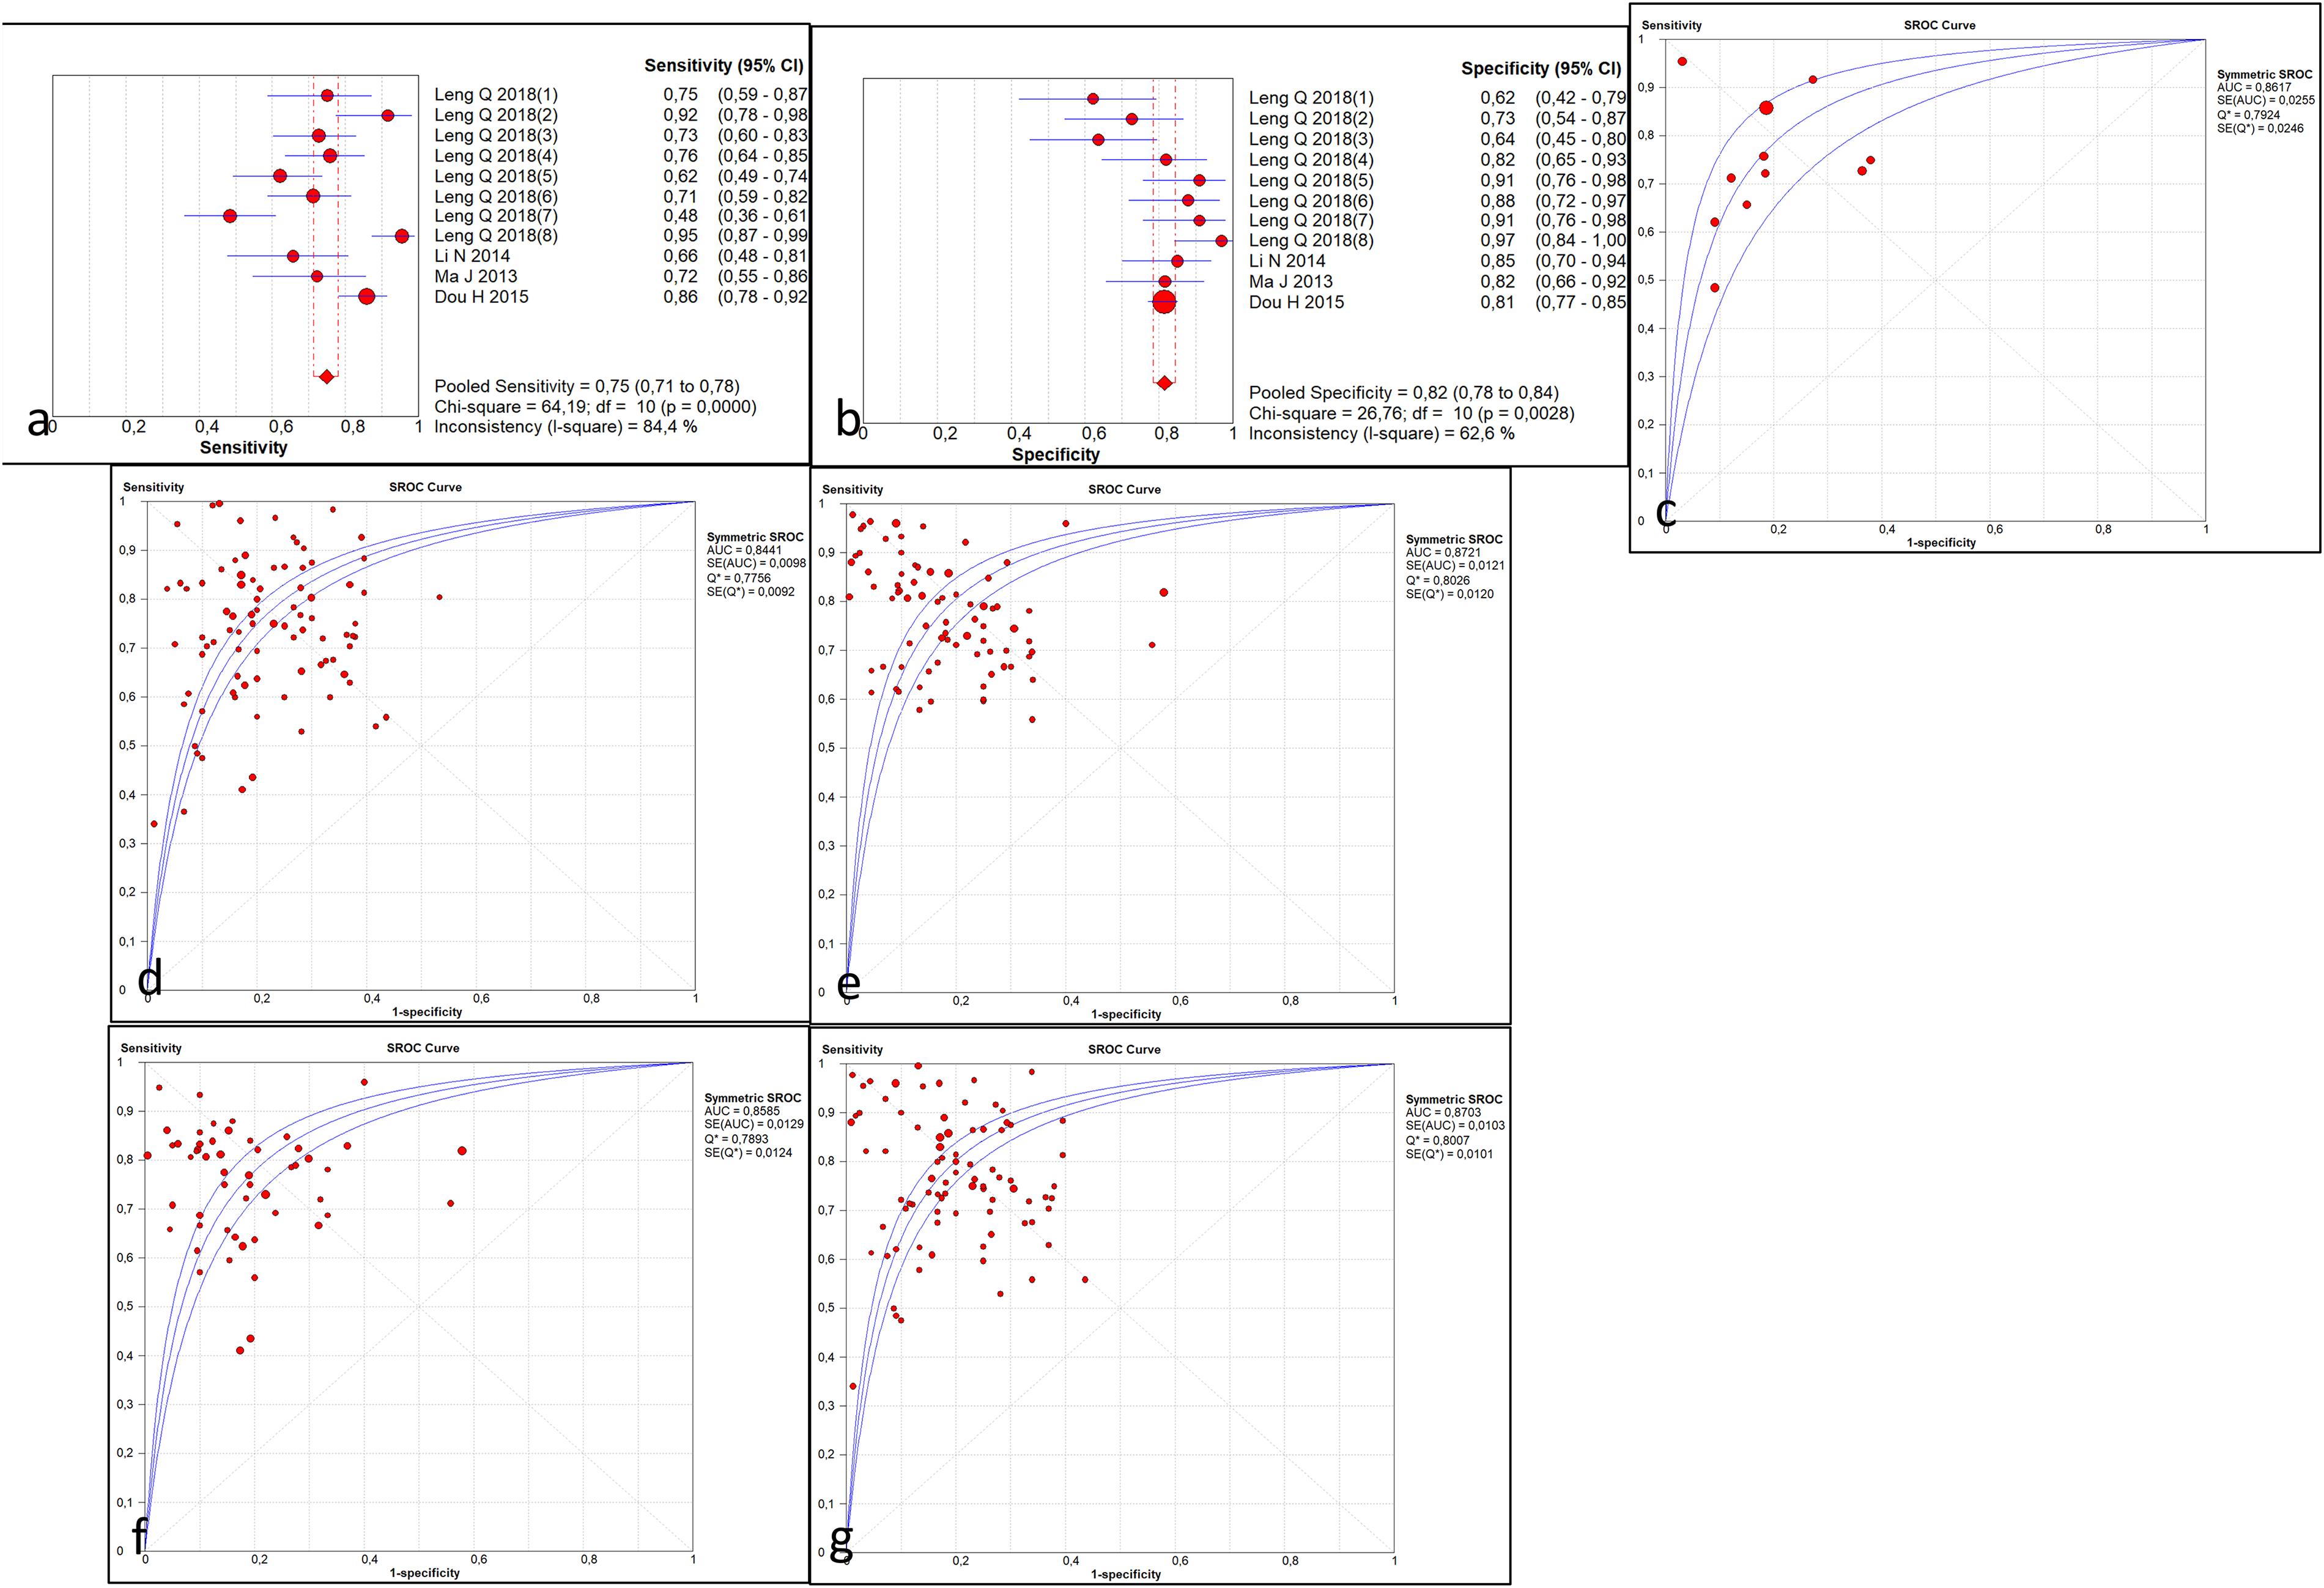
(a) The forest plot illustrating the SEN, (b) the SPE, (c) DOR, (d) the sROC curve of the different studies included.
The detailed pooled SEN, SPE, PLR, NLR and DOR of the different included studies.
Meta-regression analysis and publication bias
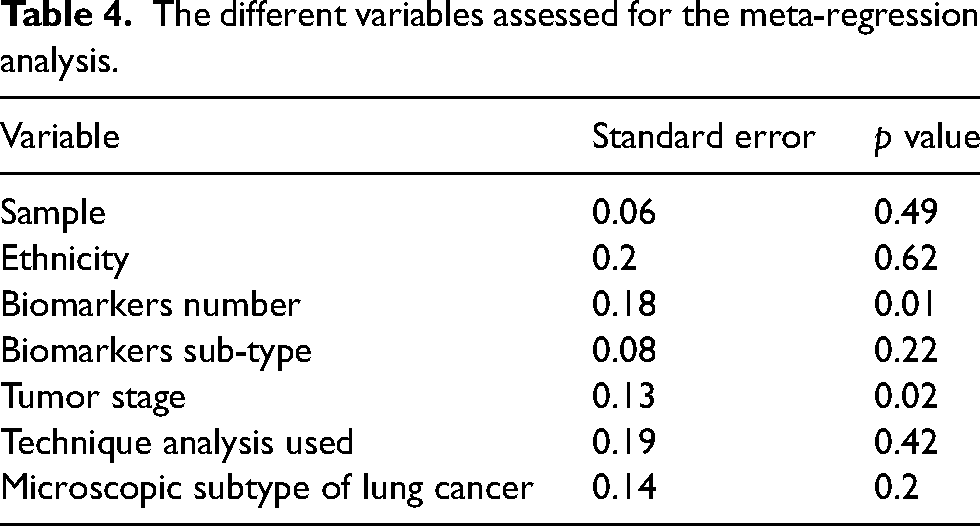
We conducted a meta-regression analysis to assess the potential heterogeneity due to the detection technique, the ethnicity of the participants, the number of biomarkers assessed (one biomarker or a panel), the biomarker subtype, the specimen used and the tumor stage. We found that both SEN and SPE were influenced by the biomarker number (p = 0.009) and the tumor stage (p = 0.0241). Table 4 illustrates these different findings.
The different variables assessed for the meta-regression analysis.
The funnel plot asymmetry test was used to perform the publication bias analysis which showed a symmetric funnel plot in Figure 3, meaning that the potential publication did not exist (Egger's test p = 0.341).
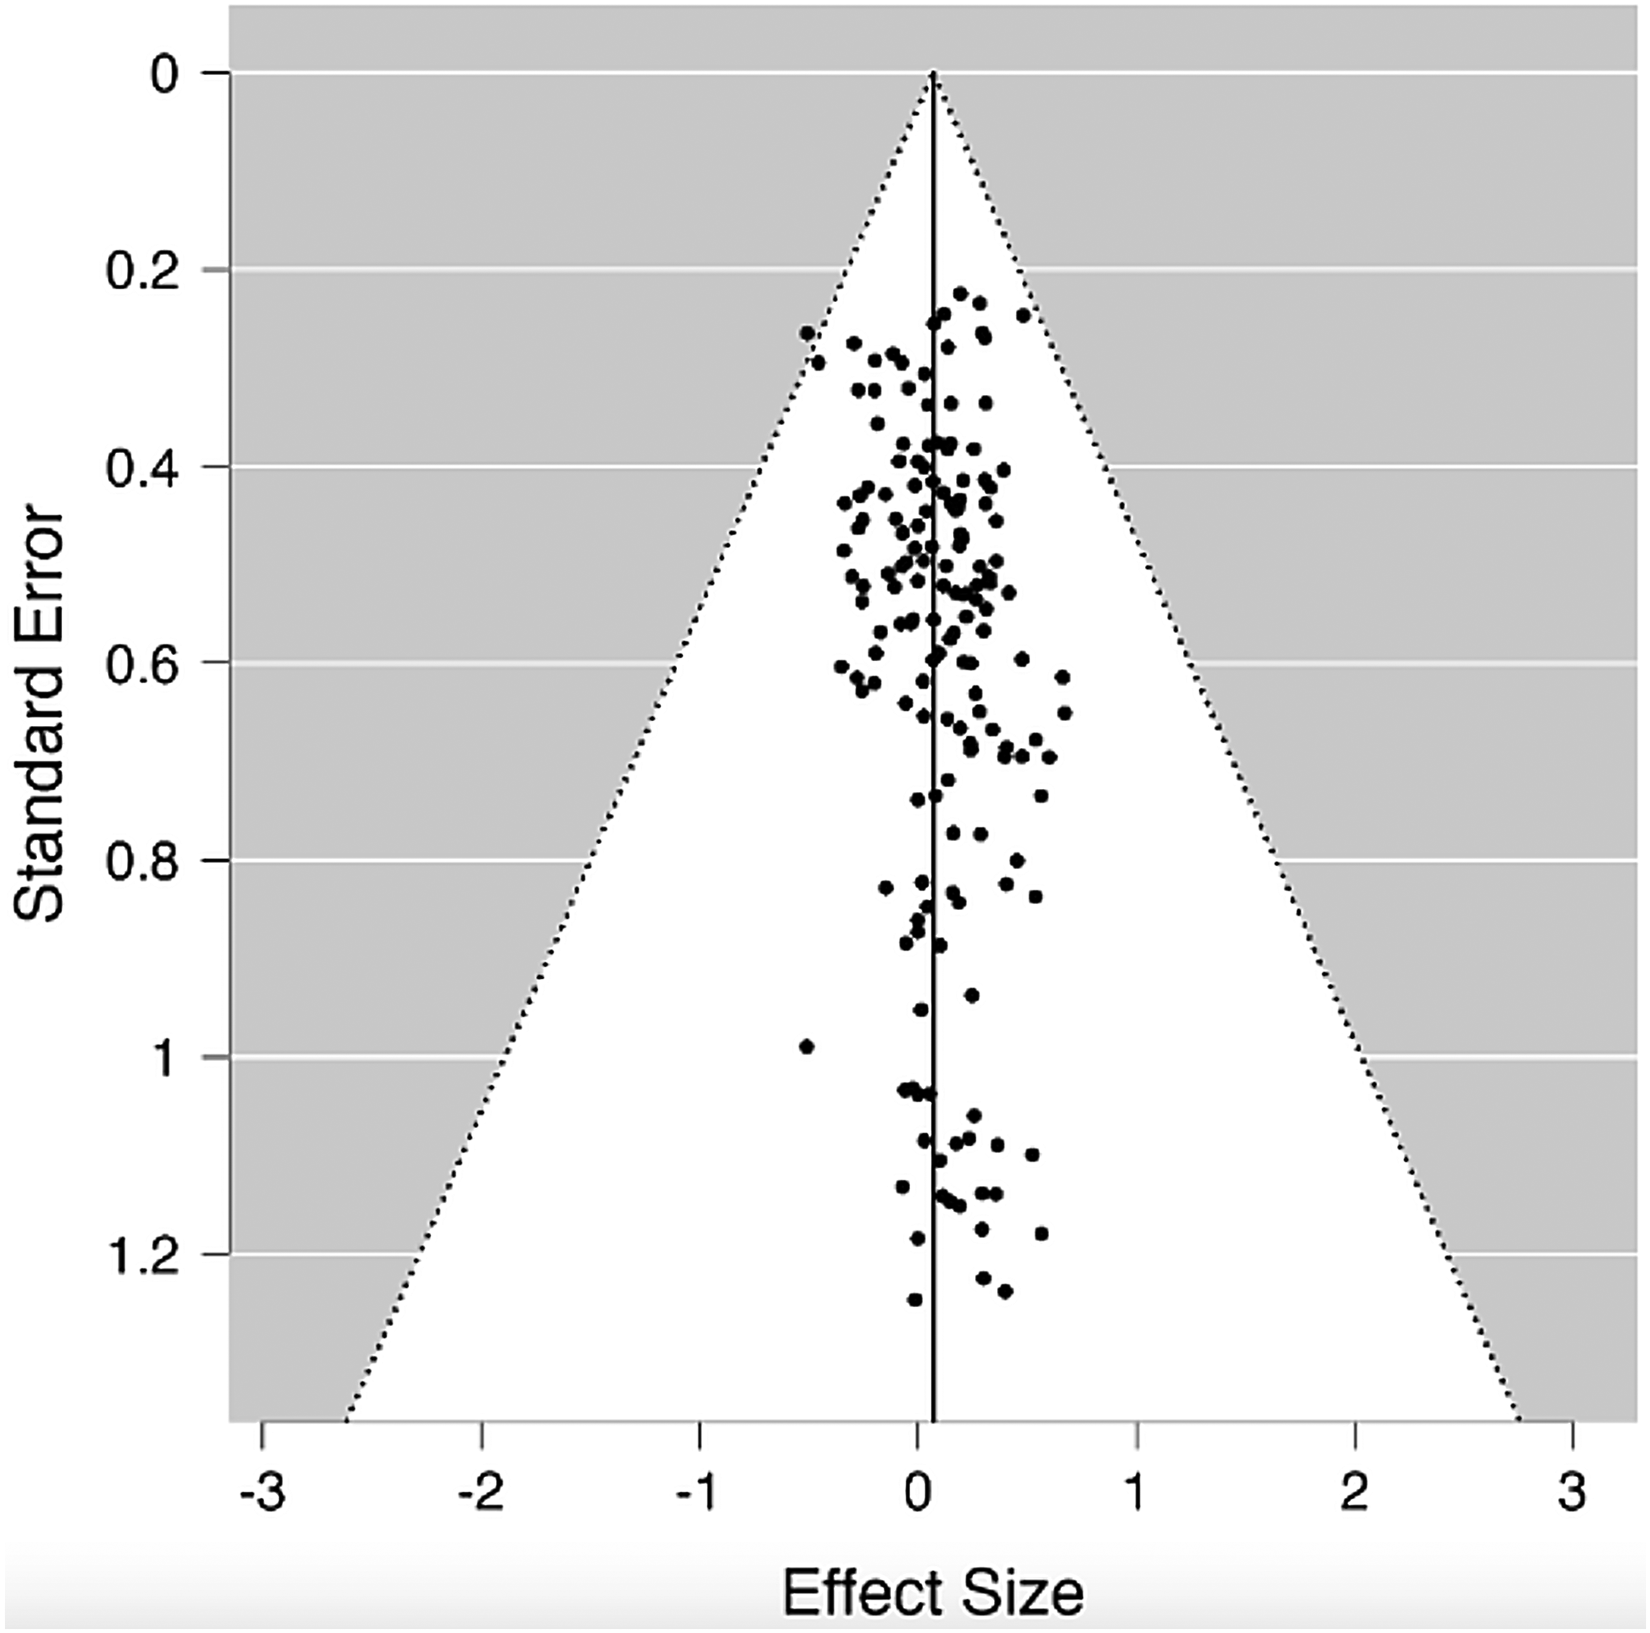
The funnel plot illustrating the absence of publication bias.
Sub-group analysis
A sub-group analysis was performed in order to assess the diagnostic performance according to the technique used, biomarkers number (one marker or a panel), the tumor stage, the biomarker subtype, the sample used and the biomarker subtype.
According to the technique used, pooled SEN, SPE and DOR accounted, respectively, for 0.758 (95%CI: 0.750–0.766), 0.800 (95% CI: 0.791–0.809) and 14.242 (95% CI: 11.996–16.910) in the RT-PCR group, 0.748 (95%CI: 0.713–0.781), 0.815 (95% CI: 0.784–0.843) and 14,522 (95% CI: 8.402–25.101) in the digital PCR group (Figure 4(a)–(c)), 0.801 (95%CI: 0.768–0.832), 0.664 (95% CI: 0.629–0.697) and 12.173 (95% CI: 4.805–30.837) in the mass spectrometry group and 0.708 (95%CI: 0.607–0.797), 0.667 (95% CI: 0.472–0.827) and 4.772 (95% CI: 1.968–11.572) in tCLN group.
(a) The forest plot of the sensitivities of the studies using digital PCR, (b) the forest plot of the specificities of the studies using digital PCR, (c) the sROC curve of the studies using digital PCR, (d) the sROC curve of the studies using multiple biomarkers or classifiers, (e) the sROC curve of the studies using 1 biomarker, (f) the sROC curve of the studies focusing on early-stage lung cancers, (g) the sROC curve of the studies focusing on late-stage lung cancers.
In the group of studies using one biomarker, the pooled SEN, SPE and dOR accounted, respectively, for 0.737 (95%CI: 0.726–0.748), 0.782 (95% CI: 0.770–0.793) and 11.508 (95% CI: 9.425–14.051). In the studies reporting a panel of biomarkers or classifiers, the pooled SEN, SPE and dOR accounted for 0.788 (95%CI: 0.777–0.799), 0.799 (95% CI: 0.787–0.811) and 17.914 (95% CI: 13.693–23.437) (Figure 4(d) and (e)).
The diagnostic performances (SEN, SPE, DOR) according to the biomarker subtype were estimated to 0.759 (95%CI: 0.749–0.768), 0.802 (95% CI: 0.793–0.812) and 14.454 (95% CI: 11.866–17.607) in the micro-RNA group, 0.689 (95%CI: 0.603–0.767), 0.864 (95% CI: 0.757–0.936) and 14.952 (95% CI: 6.633–33.708) in the long non-coding RNA, 0.724 (95%CI: 0.679–0.766), 0.738 (95% CI: 0.677–0.793) and 7.163 (95% CI: 3.860–13.292) in the circular RNA group, 0.756 (95%CI: 0.736–0.755), 0.806 (95% CI: 0.782–0.829) and 14.006 (95% CI: 10.167–19.294) in the exosomal RNA group, 0.834 (95%CI: 0.805–0.859), 0.683 (95% CI: 0.651–0.715) and 19.559 (95% CI: 6.961–54.957) in the metabolites group and 0.701 (95%CI: 0.649–0.750), 0.760 (95% CI: 0.705–0.809) and 9.875 (95% CI: 4.749–20.534) in the group of extra-cellular vesicle micro-RNA.
According to the tumor stage, the pooled SEN, SPE and DOR accounted, respectively, for 0.777 (95%CI: 0.767–0.788), 0.806 (95% CI: 0.794–0.817) and 15.587 (95% CI: 12.367–19.644) in the group of stages III and IV. In early stages (I/II), these diagnostic performances were estimated, respectively, to 0.750 (95%CI: 0.735–0.764), 0.790 (95% CI: 0.776–0.803) and 15.385 (95% CI: 11.695–20.239) (Figure 4(f) and (g)). In the studies, assessing all the stages, pooled SEN, SPE and dOR accounted for 0.717 (95%CI: 0.695–0.738), 0.729 (95% CI: 0.703–0.753) and 7.675 (95% CI: 5.406–10.895).
According to the sample used, the pooled SEN, SPE and dOR were estimated, respectively, to 0.772 (95%CI: 0.759–0.785), 0.776 (95% CI: 0.761–0.791) and 15.829 (95% CI: 11.869–21.111) in the studies assessing biomarkers in plasma, 0.756 (95%CI: 0.745–0.767), 0.794 (95% CI: 0.782–0.805) and 12.912 (95% CI: 10.028–16.625) in the studies using serum, 0.794 (95%CI: 0.723–0.854), 0.909 (95% CI: 0.783–0.975) and 50.911 (95% CI: 1.572–(−)1649.1) in the studies using whole blood samples, 0.743 (95%CI: 0.717–0.768), 0.814 (95% CI: 0.792–0.833) and 14.045 (95% CI: 10.531–18.730) in the group using sputum, 0.667 (95%CI: 0.569–0.754), 0.630 (95% CI: 0.523–0.729) and 3.413 (95% CI: 1.904–6.117) in the group using exhaled breath and 0.671 (95%CI: 0.593–0.742), 0.767 (95% CI: 0.640–0.866) and 10.774 (95% CI: 3.466–33.491) in the group using pleural effusion. Only one study used BAL and one study used peripheral blood mononucleated cells inducing their exclusion from the subgroup analysis.
All the details of the subgroup analysis are represented in Table 4.
Discussion
In this study, we aimed to assess the diagnostic performances of the micro-RNA and the metabolites in the diagnosis of lung cancers. For that issue, we performed a meta-analysis during a nine-year-period (2013–2022). According to our inclusion criteria, 165 studies from 79 articles were included. The pooled SEN, SPE and DOR accounted, respectively, for 0.76, 0.79 and 13.927. The AUC was estimated to 0.859 suggesting a good diagnostic accuracy. The heterogeneity in the pooled SEN and SPE was statistically significant. The meta-regression analysis focusing on the technique used, the sample, the number of biomarkers, the biomarker subtype, the tumor stage and the ethnicity revealed the biomarker number (p = 0.009) and the tumor stage (p = 0.0241) as potential sources of heterogeneity. A sub-group analysis was performed in order to assess the diagnostic performances according to the technique used, the biomarkers number, the tumor stage, the biomarker subtype and the sample used. The best diagnostic performances were highlighted in the studies using PCR digital techniques (SEN = 0.748, SPE = 0.815, DOR = 14.522), studies using panel of biomarkers or classifiers (SEN = 0.788, SPE-0.799, DOR = 17.914), studies analyzing long non-coding RNA (SEN = 0.689, SPE = 0.864, DOR = 14.952), studies focusing on metastatic and late stages (SEN = 0.777, SPE = 0.806, DOR = 15.587) and studies including whole blood samples (SEN = 0.794, SPE = 0.909, DOR = 50.911). We also assessed the quality of the different studies included using the most relevant items from the QUADAS-2 criteria. The included studies were rated taking into account the four key domains: patient selection, index test, reference standard and flow and timing. 12 The mean score of the different studies included accounted for 3.45/11 highlighting studies with the lowest scores attributed to the lack of information about the patient selection domain. This fact couldn’t be attributed to the low quality of the studies but should encourage authors to mention more details about the inclusion of the patients, the reference test and the index test in the methods section. In a meta-analysis focusing on the diagnostic and prognostic value of miR-155, Sha et al. reported that the quality assessment according to the QUADAS revealed that most studies were consistent with the quality criteria. The discordance with our results may be explained by the few number of studies included (12 studies). Concerning the different techniques of assessment used, the review of the literature revealed RT-PCR for micro-RNA and mass spectrometry for metabolites as the most used techniques. In our sub-group analysis, the digital PCR group seemed to have better diagnostic performances than the others. The plasma and the whole blood were also the most reported samples with high diagnostic performances in some studies. 89 In our meta-analysis, whole blood-based studies seemed to have higher diagnostic performances. The diagnostic performance of panels has been compared to the use of single biomarkers and revealed in many studies the superiority of using multiple biomarkers. 90 This fact was also highlighted in our meta-regression analysis and in the sub-group analysis. In this study, the sub-group analysis revealed better diagnostic performances of biomarkers in late lung cancers. Zhang et al. reported in a study assessing the diagnostic performances of exosomal miR-20b-5p and miR-3187, an AUC of 0.838 in early-stage cancers but they didn’t include late-stage cancers to compare them. 91 In a meta-analysis about the diagnostic value of microRNA-486, Shen et al. reported a better diagnostic value of mi-R in early-stage cancers but they included only two studies assessing late-stage cancers. 92 In another meta-analysis about the diagnostic value of micro-RNA 25 in patients with NSCLC, Li et al. reported that these biomarkers could be potential biomarkers in early lung cancers but, in their meta-analysis including six studies, only one study focused on early-stage lung cancer. 93
In almost all meta-analyses focusing on the biomarkers of lung cancer, in diagnostic, prognostic or therapeutic fields, the authors reported a significant heterogeneity. Huang et al. reported in a meta-analysis, about the potential diagnostic value of extracellular vesicle miRNA in NSCLC, that the meta-regression analysis revealed the origin countries, the publication year, the sample size, the source of control, the detection method and the specimen used as potential sources of heterogeneity. 94 In another systematic review about the circulating micro-RNA-145 as a diagnostic biomarker, Tao et al. reported the publication date and the sample as potential sources of heterogeneity. 95 Jiang et al. reported the smoking status, the number of biomarkers and the ethnicity as potential sources of heterogeneity. 96 In a meta-analysis focusing on micro-RNA-486, Shen et al. reported that the microscopic subtype was also a potential source of heterogeneity. 92
The diagnostic performances in this study are almost the same than those published in other meta-analyses focusing of micro-RNA, exosomal micro-RNA or extracellular vescile micro-RNA even if the inclusion criteria or the period of study may be different.94,96–100
Conclusion
Even if this meta-analysis highlights the diagnostic potential of microRNA and metabolites in lung cancer, it also reinforces the need for consistent prospective studies in order to assess that finding especially in early-stage lung cancers in order to increase the rate of lung cancers resected totally surgically and to improve their prognoses.
Footnotes
Authors’ contributions
MM performed the review of the literature, the statistical analysis and wrote the manuscript, MMZ performed the review of the literature and red the final version of the manuscript, MA and IB contributed to the writing of the manuscript and red the final version, FM participated to the quality analysis of the articles included and corrected the final version of the manuscript, AM validated the statistical study and corrected the final version of the manuscript.
Declaration of conflicting interests
The author(s) declared no potential conflicts of interest with respect to the research, authorship, and/or publication of this article.
Funding
The author(s) received no financial support for the research, authorship, and/or publication of this article.
Ethical approval
Not applicable.
Informed consent
Not applicable.