
Abstract
This study evaluated the convergent and discriminant validity of scores from screening tools for depression (Traumatic Symptom Checklist for Children [TSCC], Massachusetts Youth Screening Instrument-Second Version [MAYSI-2], Reynolds Adolescent Depression Scale-Second Edition [RADS-2], Adolescent Psychopathology Scale, Short Form [APSSF-Short Form]) and suicidality (Suicidal Ideation Questionnaire Junior High School Version [SIQ-JR], MAYSI-2) with adjudicated youth in a south-eastern U.S. state. We also evaluated if convergent and divergent correlational relationships were statistically invariant across ethnic groups. Correlations evaluating convergent validity within subscales measuring depression and suicide ideation were r = 0.38–0.56. Correlations evaluating divergent evidence across depression and suicide ideation were r = 0.32–0.58. Concerning convergent correlations, both depression subscales and suicide ideation subscales were nearly 0.1 higher for White youth compared to African American youth. Results indicate that caution is needed when selecting screening tools and the importance of utilizing multiple sources of information, varied methods, and data from multiple settings. Additional results and implications are noted.
Keywords
For a decade, the high rate of incarcerated youth with a mental disorder has been well established, with prevalence rates at approximately 70% (Seiter, 2017). As such, the importance of mental health screening cannot be understated. Screening serves two important purposes (Swank & Gagnon, 2017). First, it provides the information to identify youth in need of immediate mental health services and supports. Second, it provides data for the identification of youth that are at-risk for mental disorders and in need of a comprehensive evaluation. The screening of all incarcerated youth is supported by the National Commission on Correctional Health Care (NCCHC, 2022) within their Standards for Health Services in Juvenile Detention and Confinement Facilities.
The characteristics of incarcerated youth further support the use of mental health screenings. For example, more than one-quarter of incarcerated youth have mental disorders at intake that necessitate immediate attention (Shufelt & Cocozza, 2006). More specifically, detained youth are at significant risk for self-harm (Archer et al., 2010) with rates of suicidal ideation at 10% to 19% and previous suicidal attempts between 10% and 22% (Abram et al., 2008; Bhatta et al., 2014; Livanou et al., 2019; Sedlak & McPherson, 2010). For adjudicated youth, those that have “been found by a judge in juvenile court to have committed a violation of the criminal law” (16th Circuit Court of Jackson, Mississippi, 2024), 30% reported suicidal ideation or behavior and 12% stated they had previously attempted suicide (Penn et al., 2003).
It is noteworthy that 25% of youth experience solitary confinement while incarcerated (Sedlak & McPherson, 2010), wherein they are isolated in their cell 23 hours per day with almost no human contact. There is a strong relationship between solitary confinement and suicide (Hayes, 2009). In fact, Hayes (2009) reported that 50% of incarcerated youth suicides took place when youth were in solitary confinement and 62% of youth committing suicide while incarcerated had previously been placed in solitary confinement. The frequency that solitary confinement is used with youth and the associated risk of suicide makes the importance of suicide screening even more critical.
While data vary across studies, Domalanta and colleagues (2003) identified that as many 25% of incarcerated youth had moderate depression and 22% had severe depression. Other studies and a meta-analysis indicate prevalence rates for depression at 10% to 17% and dysthymic disorder at 5% (Beaudry et al., 2021; Fazel et al., 2008; Livanou et al., 2019; Teplin et al., 2002). However, the data are almost exclusively from detention facilities and not from facilities where youth have been adjudicated delinquent. What is evident is that if left unidentified and untreated, incarcerated youth with depressive disorders, are at significant risk for problems with psychosocial functioning, interpersonal relationships, poor academic outcomes, and suicide (Ryan & Redding, 2004).
Screening
There are a number of screening tools with acceptable evidence of score reliability and score interpretation validity that either focus exclusively on suicide risk (Suicidal Ideation Questionnaire Junior High School Version [SIQ-JR], Reynolds, 1987) or symptoms of depression (Reynolds Adolescent Depression Scale-Second Edition [RADS-2], Reynolds, 2002; Traumatic Symptom Checklist for Children [TSCC], Briere, 1996), as well as screening tools that include both of these important constructs (Adolescent Psychopathology Scale, Short Form [APSSF], Reynolds, 1998; Massachusetts Youth Screening Instrument-Second Version [MAYSI-2], Grisso & Barnum, 2006). The MAYSI-2 is the most widely used screening tool in juvenile correctional facilities for adjudicated youth (Swank & Gagnon, 2017). However, there are concerns with the sole reliance on the MAYSI-2 (LaBelle et al., 2024).
Given the available research, there is a need to continue to provide additional evidence of validity for these measures to assess depression and suicidality constructs within the juvenile justice population (Archer et al., 2010). Within normative samples, scores of depression and suicidality constructs measured on the SIQ-JR, APS-SF, TSCC, and MAYSI-2 have been shown to have adequate convergent and divergent validity evidence with scores from other measures of adolescent depression and suicidality (Briere, 1996; Hathaway, 1982; Kovacs, 1979; Reynolds, 1987). However, there has also been limited research and mixed findings on the concurrent validity evidence of scores from these measures when used with youth in the juvenile justice system.
To date, few studies have addressed these validity issues for any combination of the aforementioned screening tools within the United States and none of the studies focused on adjudicated youth. Because there is some evidence related to the accuracy of screening tools with minority youth (LaBelle et al., 2024), it is also necessary to assess the convergent and divergent correlational relationships across ethnic groups. If the validity evidence of the scores from screening tools varies for African American youth as compared to White youth, this may further disadvantage this already vulnerable group (Louden et al., 2017).
Through this study, the authors hope to provide descriptive insights on using these prevalent screening tools and subscales for the relationship between suicide ideation and depression traits, focusing on this unique population of incarcerated youth with a discussion on ethnicity. The convergent and divergent validity evidence gained through the multitrait-multimethod matrix (MTMM; Campbell & Fiske, 1959) compares how a specific measure relates to other measures. In examining the correlations between the depression scales and suicide ideation scales with the MTMM method, we can provide evidence on how multiple reliable scores can converge or diverge from each other. For practitioners to make informed decisions concerning which or which combinations of mental health screening tool(s) to use, this study will address the following research questions (RQ) for male adjudicated youth:
RQ1: What evidence is there for convergent validity of the measurements?
Are scores on the scales intended to measure depression strongly and positively correlated with each other?
Are scores on the scales intended to measure suicide ideation strongly and positively correlated with each other?
RQ2: What evidence is there for divergent validity of the measurements?
Are scores on scales intended to measure different constructs (i.e., depression vs. suicide ideation) less correlated with each other as compared to the convergent relationships?
RQ3: To what degree is the convergent and divergent validity evidence invariant across ethnic groups?
Method
Sample
The sample was drawn from participants in a larger study that focused on the efficacy of a literacy intervention with adjudicated youth in a rural secure juvenile correctional facility (JCF) in a southeastern U.S. state (n = 464; see Houchins et al., 2018). Male youth, ages 12 to 18, typically stayed at the facility for 6 to 9 months. A maximum of 150 males were at the facility at any given time. Upon entry into the facility, youth were eligible for the larger and this study if they had not passed the state reading assessment and had also not received a high school diploma or passed the General Educational Development (GED) test. Because the sample was derived from those that were eligible for the literacy intervention, 39 youth were omitted from the overall sample because they had passed the GED test or the state-required reading test. Ethical standards for this study were in accordance with and approved by the University of Florida. Informed assent was received from all youth and informed consent from was received from the guardian of each youth. No youth or guardians refused participation.
Of the 464 youth incarcerated during the literacy study, screening data were available for 384 youth that had the following characteristics: African American (n = 207, 54.5%), White (n = 137, 36.1%), Latino (n = 31, 8.2%), Other (n = 5, 1.3%), and Unknown (n = 4, 1.0%). Due to the low number of Latino, Other, and Unknown youth, this study focused on African American and White youth. The age of youth in this study ranged from 13 to 18, with an average age of 15.88 years and most being 15 (n = 92), 16 (n = 93), or 17 (n = 109) years of age. In addition, 45.6% (n = 173) were identified with an educational disability.
Measures
The following measures were chosen to focus on depression: RADS-2 (Reynolds, 2002), TSCC (Briere, 1996), APSSF, (Reynolds, 1998), and MAYSI-2 (Grisso & Barnum, 2006). In addition, the following screening tools were chosen to focus on suicidality: SIQ-JR (Reynolds, 1987), APSSF, and MAYSI-2. For each specific RQ, the aforementioned screening tools were used according to its measurement of depression, suicidality, or both. Details of each instrument and subscale are described below. Abbreviations of the measures used for each domain or construct, along with example questions, are provided in Table 1.
Description of the Subscales Used in the Current Analysis.
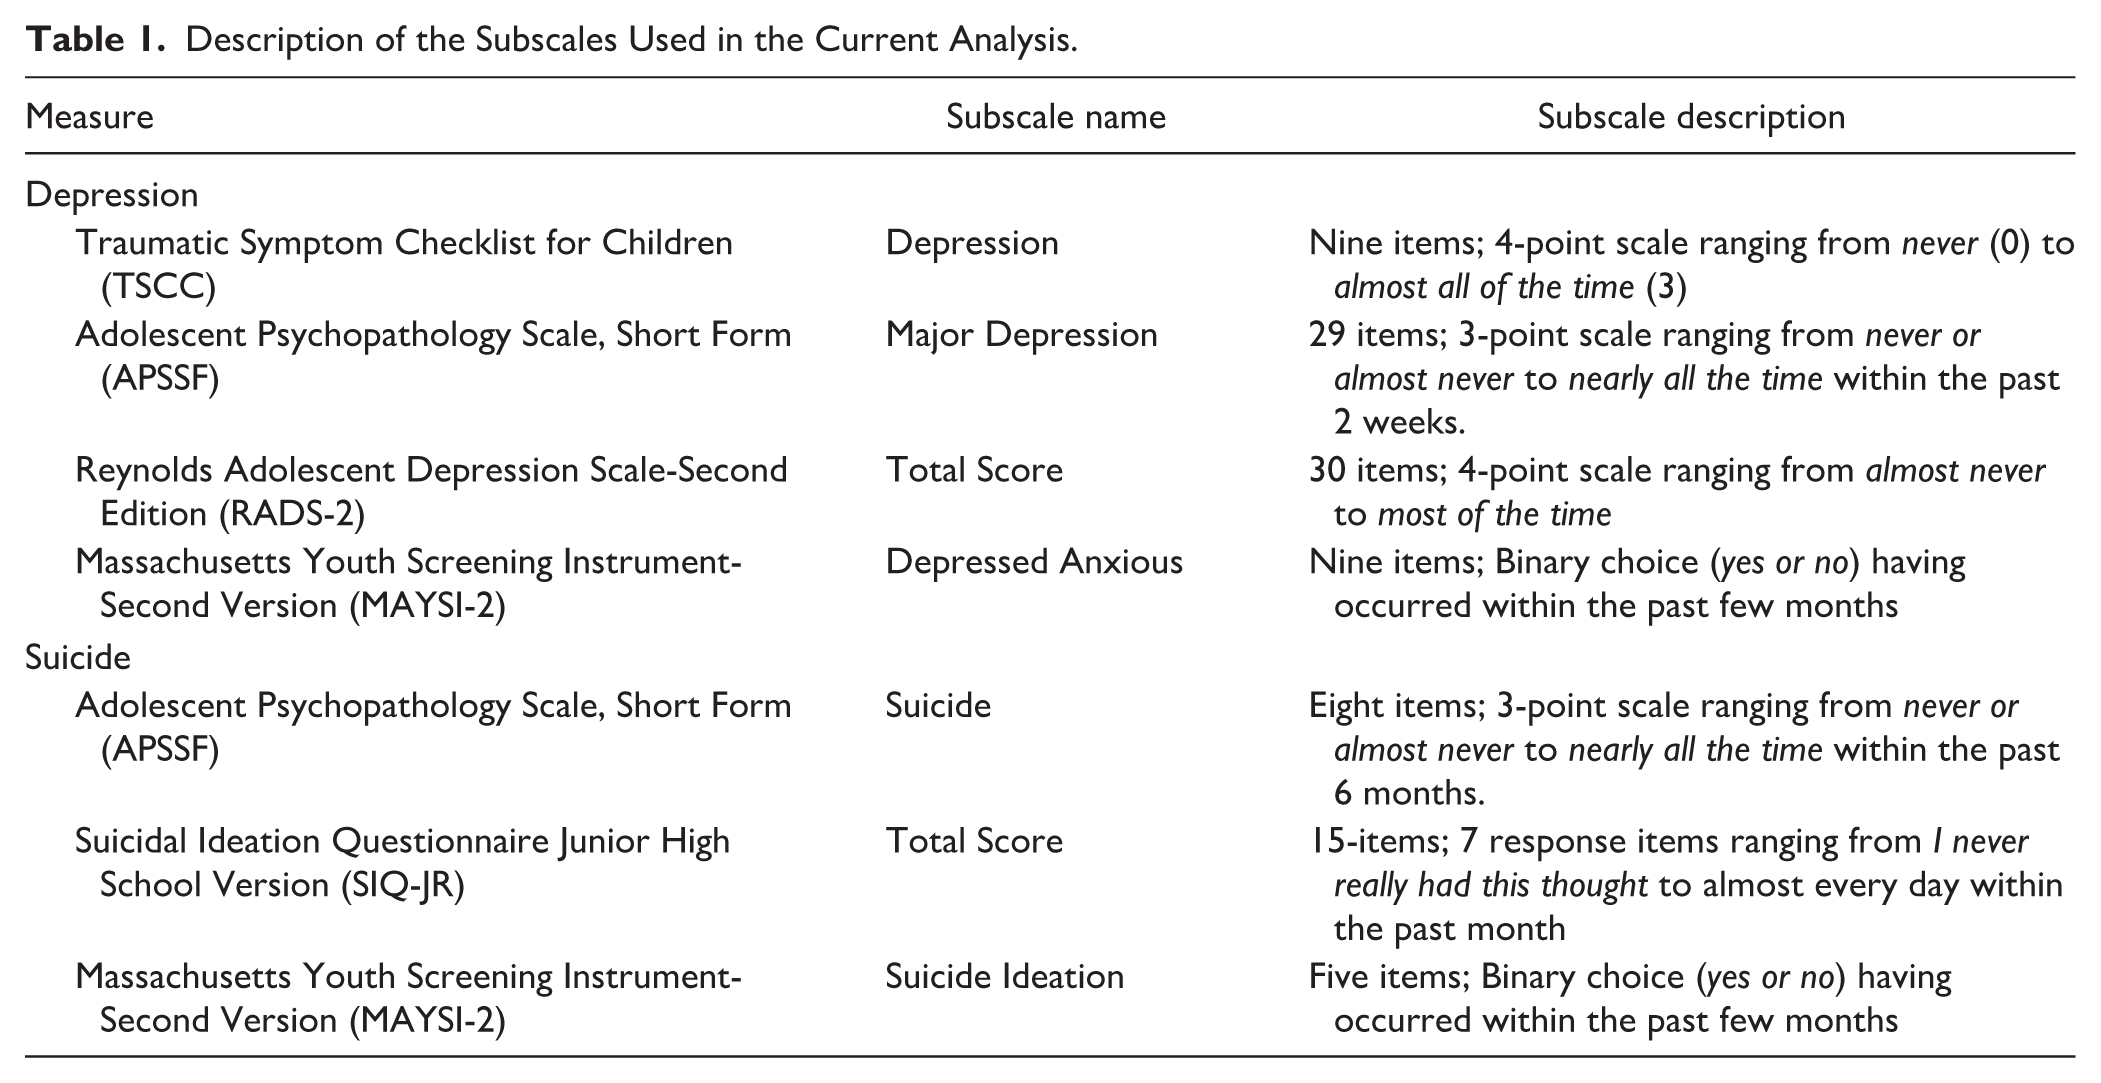
In terms of the specifics of each screening tool, the TSCC is a 54-item self-report measure of trauma symptoms and related psychopathology in children and adolescents between the ages of 8 and 16 (Briere, 1996). The TSCC consists of six subscales: Anxiety (ANX), Depression (DEP), Anger (ANG), Posttraumatic Stress (PTS), Dissociation (DIS), and Sexual Concerns (SC). Each item is rated on a 4-point scale ranging from never (0) to almost all of the time (3). Score classification and severity of symptoms on the TSCC is determined based on t-score values with a determination that a t-score over 65 is considered to be clinically significant (Briere, 1996). The TSCC subscale of interest in this study is Depression (DEP), has been found to produce data with high internal consistency (α = .86) as well as convergent validity with the Children’s Depression Inventory (r = .73) and Child Behavior Checklist, Internalization (r = .82; Briere, 1996).
The SIQ-JR is a 15-item self-report screening instrument designed to assess suicidal ideation in adolescents grades 7 to 9 (Reynolds, 1987). Items on the SIQ-JR are on a 7-point scale ranging from I never had the thought (0) to almost every day (6). The SIQ-JR total score indicates the number and frequency of suicidal thoughts interpreted with norms for both grade and gender. Score classification and severity of condition for the SIQ-JR is based upon raw total score with a score of over 31 indicating the need for further evaluation of psychopathology and suicide risk (Reynolds, 1987). The SIQ-JR has been found to produce data with a high internal consistency (α = .94). Scores on the SIQ-JR have adequate convergent validity with other measures of adolescent depression, including the Children’s Depression Inventory (r =.65; Kovacs, 1979) and RADS (r = .55; Reynolds, 1987). Scores from the SIQ-JR have excellent data reliability and validity in evaluating suicidal ideation in inner city adolescents and justice involved youth (Kemp et al., 2021; Reynolds & Mazza, 1999).
The MAYSI-2 is a brief screening instrument designed to assess the mental health needs of adolescents ages 12 to 17 in juvenile justice facilities (Grisso & Barnum, 2006). The MAYSI-2 does not provide a total score, rather it consists of seven subscales: Alcohol/Drug Use, Angry-Irritable, Depressed-Anxious, Somatic Complaints, Suicidal Ideation, Thought Disturbance, and Traumatic Experiences. Score classification and severity of condition for the MAYSI-2 are based upon a raw score total within each domain. A caution cut-off score may indicate possible clinical significance and the warning cut-off indicates that the youth’s score was exceptionally higher than expected compared to other youth in the juvenile justice system. The MAYSI-2 depressed-anxious (DA) subscale having a caution cut-off of 3 and warning cut-off of 6. The MAYSI-2 suicide ideation (SI) subscale has a caution cut-off of 2 and a warning cut-off of 3 (Grisso & Barnum, 2006). The MAYSI-2 subscales of interest in this study, DA and SI have produced scores with acceptable internal consistency (ranging from .74 to .88) when utilized in the juvenile justice population (Ford et al., 2008). Within the standardization sample, DA and SI subscale scores were reported to have adequate, but limited convergent validity with subscale scores measuring similar traits on the Child Behavior Checklist-Youth Self Report (ranging from .43 to .55; Achenbach, 1991) and Millon Adolescent Clinical Inventory (ranging from .49 to .61; Millon, 1993).
The APS-SF is a 115-item multidimensional measure of psychopathology and personality in adolescents ages 12 to 19 (Reynolds, 1998). The APS-SF consists of 12 clinical scales and two validity scales. Six of the clinical scales measure Diagnostic and Statistical Manual for Mental Disorders, 4th edition (DSM-IV) symptomatology associated with major depressive disorder, behavioral disorders, generalized anxiety disorder, post-traumatic stress disorder, and substance abuse disorders. The remaining six clinical scales are not based upon DSM-IV disorders, rather they measure related problems including eating disturbance, suicide, academic problems, anger/violence proneness, self-concept, and interpersonal problems. Symptoms are rated based upon their occurrence within the past 6 months and frequency of symptoms on a 3-point scale ranging from never or almost never to nearly all the time. Score classification and severity of condition for the APS-SF is determined using t-score values with the following score classifications: under 60 (normal), 60 to 64 (subclinical), 65 to 69 (mild), 70 to 79 (moderate), and above 80 (severe; Reynolds, 1998). Subscale scores of interest in this study, Major Depression (DEP) and Suicide (SUI) have high internal consistency (ranging from .86 to .89; Reynolds, 1998). The DEP and SUI subscale scores have moderately strong convergent validity with similar subscale scores on the Minnesota Multiphasic Personality Inventory (Hathaway, 1982).
The RADS-2 is a 30-item self-report measure that assesses the severity of depressive symptomatology in adolescents ages 11 to 20 (Reynolds, 2002). The RADS-2 provides a total depression score, as well as four depression related subscales: Dysphoric Mood, Anhedonia/Negative Affect, Negative Self-Evaluation, and Somatic Complaints. Test items are rated on a 4-point scale ranging from almost never to most of the time. Score classification and severity of symptoms on the RADS-2 is based upon t-score values with the follow score classifications: under 61 (normal), 61 to 64 (mild range), 65 to 69 (moderate), and above 70 (severe; Reynolds, 2002). The scale of interest in this study, RADS-2 total depression score, produce scores that have high internal consistency (α = .94). The RADS-2 total depression scores have strong convergent validity with scores on the Major Depression Subscale of the APS (r = .74; Reynolds, 1998) and total scores on the Suicidal Ideation Questionnaire (r = .68; Reynolds, 1987, 1987, 2002).
Data Collection
Data were collected over 31 months as part of the noted larger literacy study. At intake into the facility (within 7 days), youth were administered the aforementioned mental health screenings, due to the possibility that their mental health may have an effect on their ability to benefit from the literacy intervention. Because many incarcerated youth have difficulties with reading (Davis et al., 2014), each screening was read to students. The total score of each subscale is reported and used in the analysis. Of the 464 youth incarcerated during the study, data were available in the variables of interest for 384. Since we were using the MTMM method, we present the sample size of youth responding to both subscales in Table 2 and the percentage of missingness out of the total 384 samples.
Sample Size of Participants Who Responded to Both Subscales (n = 384) and Missingness in the Subscales.
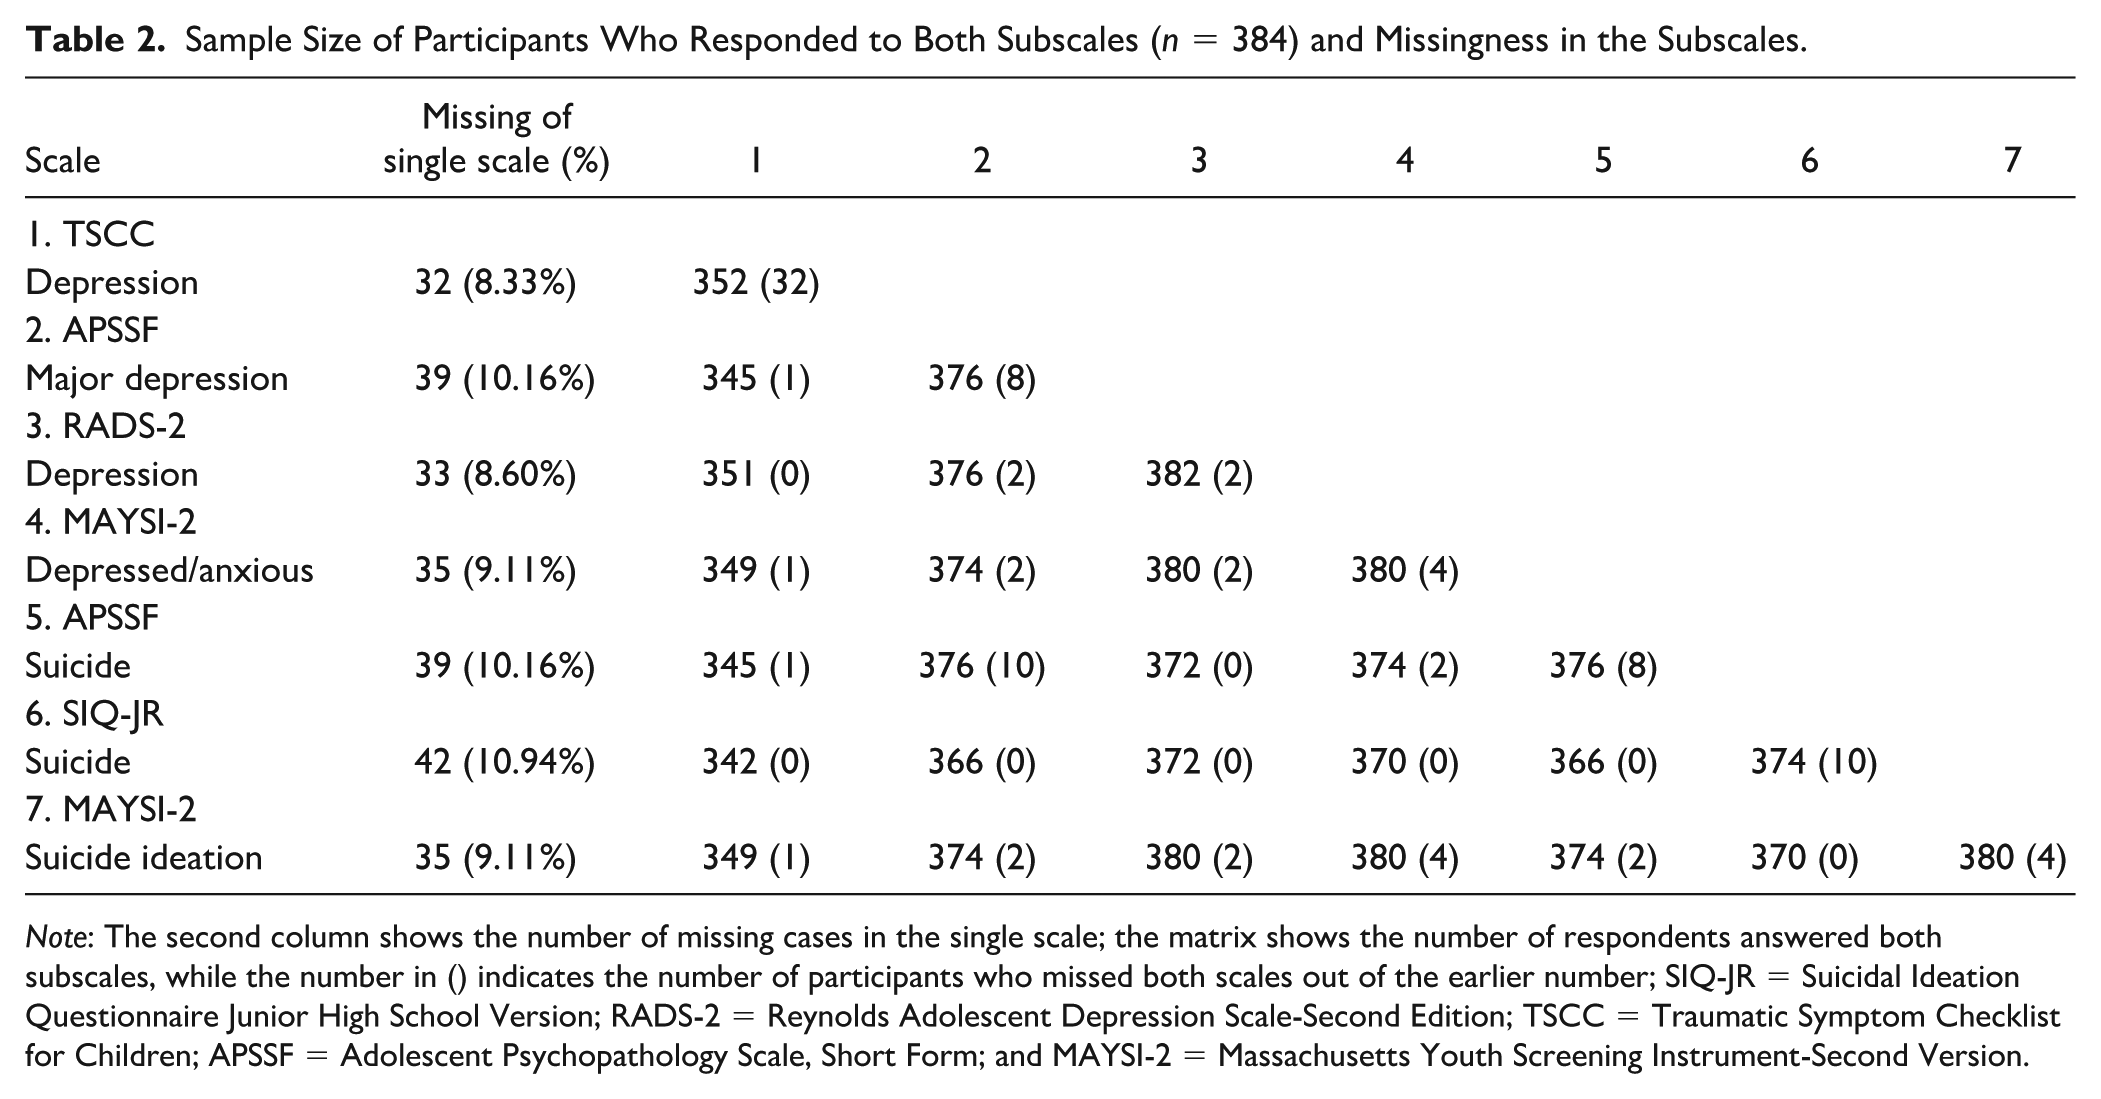
Note: The second column shows the number of missing cases in the single scale; the matrix shows the number of respondents answered both subscales, while the number in () indicates the number of participants who missed both scales out of the earlier number; SIQ-JR = Suicidal Ideation Questionnaire Junior High School Version; RADS-2 = Reynolds Adolescent Depression Scale-Second Edition; TSCC = Traumatic Symptom Checklist for Children; APSSF = Adolescent Psychopathology Scale, Short Form; and MAYSI-2 = Massachusetts Youth Screening Instrument-Second Version.
Handling Missing Data and Descriptive Statistics
The missing data were first tested with Little’s test to decide on the nature of the missingness. The patterns of missingness for each variable turned out to be Missing at Random (MAR). Some variables used in this study displayed more than 5% missingness, hence we conducted multiple imputation (MI; Rubin, 1978), as this method does not reduce the variability of the dataset. During the MI, all variables in the datasets other than the participants’ identification variable were included in the imputation matrix. For continuous variables, we used the predictive mean matching imputation and for binary variables we used logistic regression imputation. MI imputes values for each missing data point and we repeated the imputations five times to obtain five imputed datasets. All remaining analyses were implemented on the imputed datasets, and the results reported are pooled across the imputed datasets. The MI was implemented in R using package mice (Van Buuren & Groothuis-Oudshoorn, 2011).
In Table 3, we presented the mean and standard deviation of the total sample for each subscale of the whole sample. In Table 4, we presented the mean and standard deviation broken down by ethnicity group of interests.
Descriptive Statistics of Subscales.
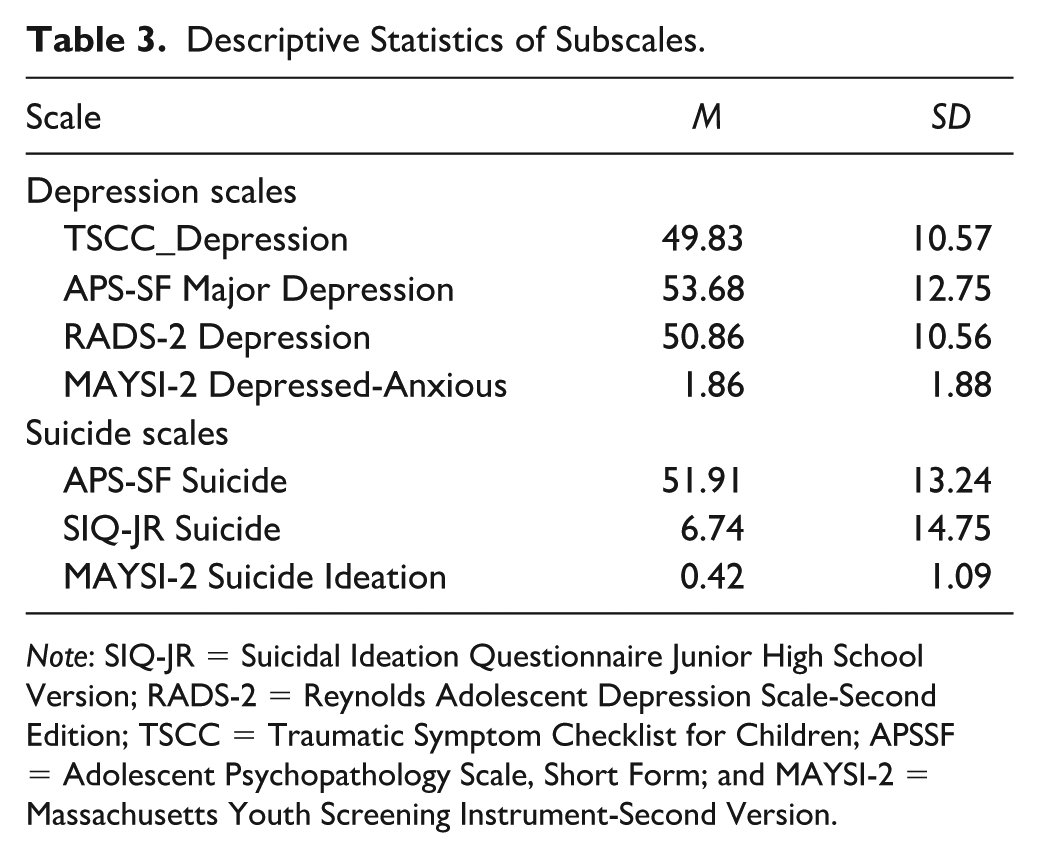
Note: SIQ-JR = Suicidal Ideation Questionnaire Junior High School Version; RADS-2 = Reynolds Adolescent Depression Scale-Second Edition; TSCC = Traumatic Symptom Checklist for Children; APSSF = Adolescent Psychopathology Scale, Short Form; and MAYSI-2 = Massachusetts Youth Screening Instrument-Second Version.
Descriptive Statistics of Subscales for White and African American Groups.
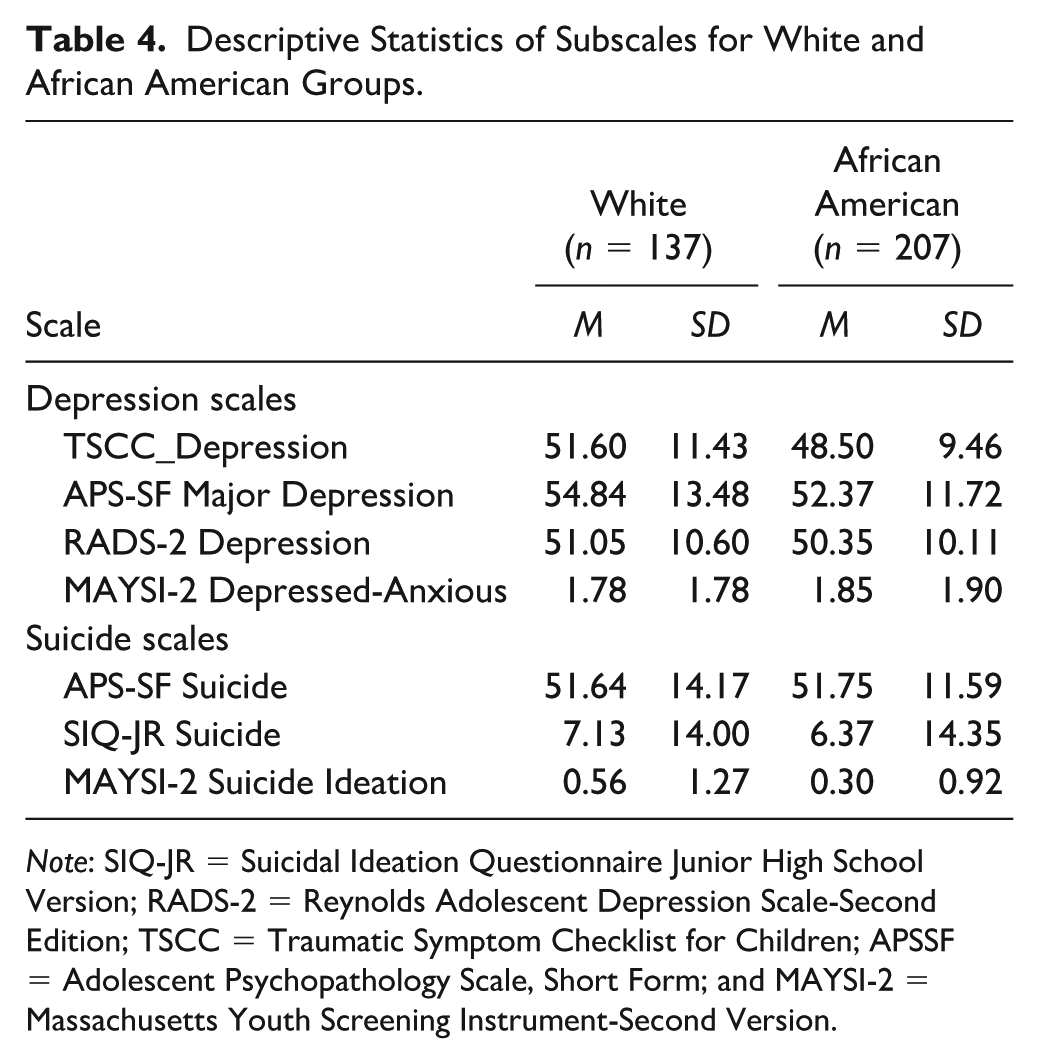
Note: SIQ-JR = Suicidal Ideation Questionnaire Junior High School Version; RADS-2 = Reynolds Adolescent Depression Scale-Second Edition; TSCC = Traumatic Symptom Checklist for Children; APSSF = Adolescent Psychopathology Scale, Short Form; and MAYSI-2 = Massachusetts Youth Screening Instrument-Second Version.
Data Analysis
We used the MTMM (Campbell & Fiske, 1959) analytic approach to answer RQs 1 and 2. We conducted correlation analyses to build the MTMM matrix. In each matrix, we correlated the scores within the depression subscales, as well as within the suicide ideation subscales (RQ 1). We then correlated scores across these two sets of subscales (RQ 2). The correlations within the same construct of depression or suicide ideation would show evidence for convergent validity, while the correlations across constructs would show divergent validity (Campbell & Fiske, 1959). We used Pearson’s correlation for the correlation coefficients between all subscales with the exception of the correlations between the MAYSI subscales with other variables. We used Spearman’s correlation coefficient in those instances, as it is better suited for capturing the relationship between an ordinal variable and continuous variable. These analyses were conducted on the whole sample to answer RQs 1 and 2, whereas RQ 3 was answered with the same analysis procedure as above, but by breaking the sample down into ethnic groups before estimating the correlations. All correlations were compared across groups with a z-test for statistical significance. All the analysis was conducted in R (R core team, 2020), version 4.0.2. The correlation analysis and the comparison of correlations used the R base package.
Results
Research Questions 1 & 2
The results of the MTMM analysis are presented in Table 5 for all participants. In the tables, the convergent correlations for the depression construct are in the triangle with dotted lines, the convergent correlations for the suicide ideation construct are inside the triangle with dashed lines, and the divergent correlations are in the dash-dot rectangle. In Table 5, statistically significant correlation coefficients are marked with an asterik, indicating that the convergent or divergent correlation is significantly different from zero. The reliability of the subscales are in the parentheses of the diagonals in the table.
Multitrait-MultiMethod (MTMM) Matrix for Correlations of All Participants (n = 384).
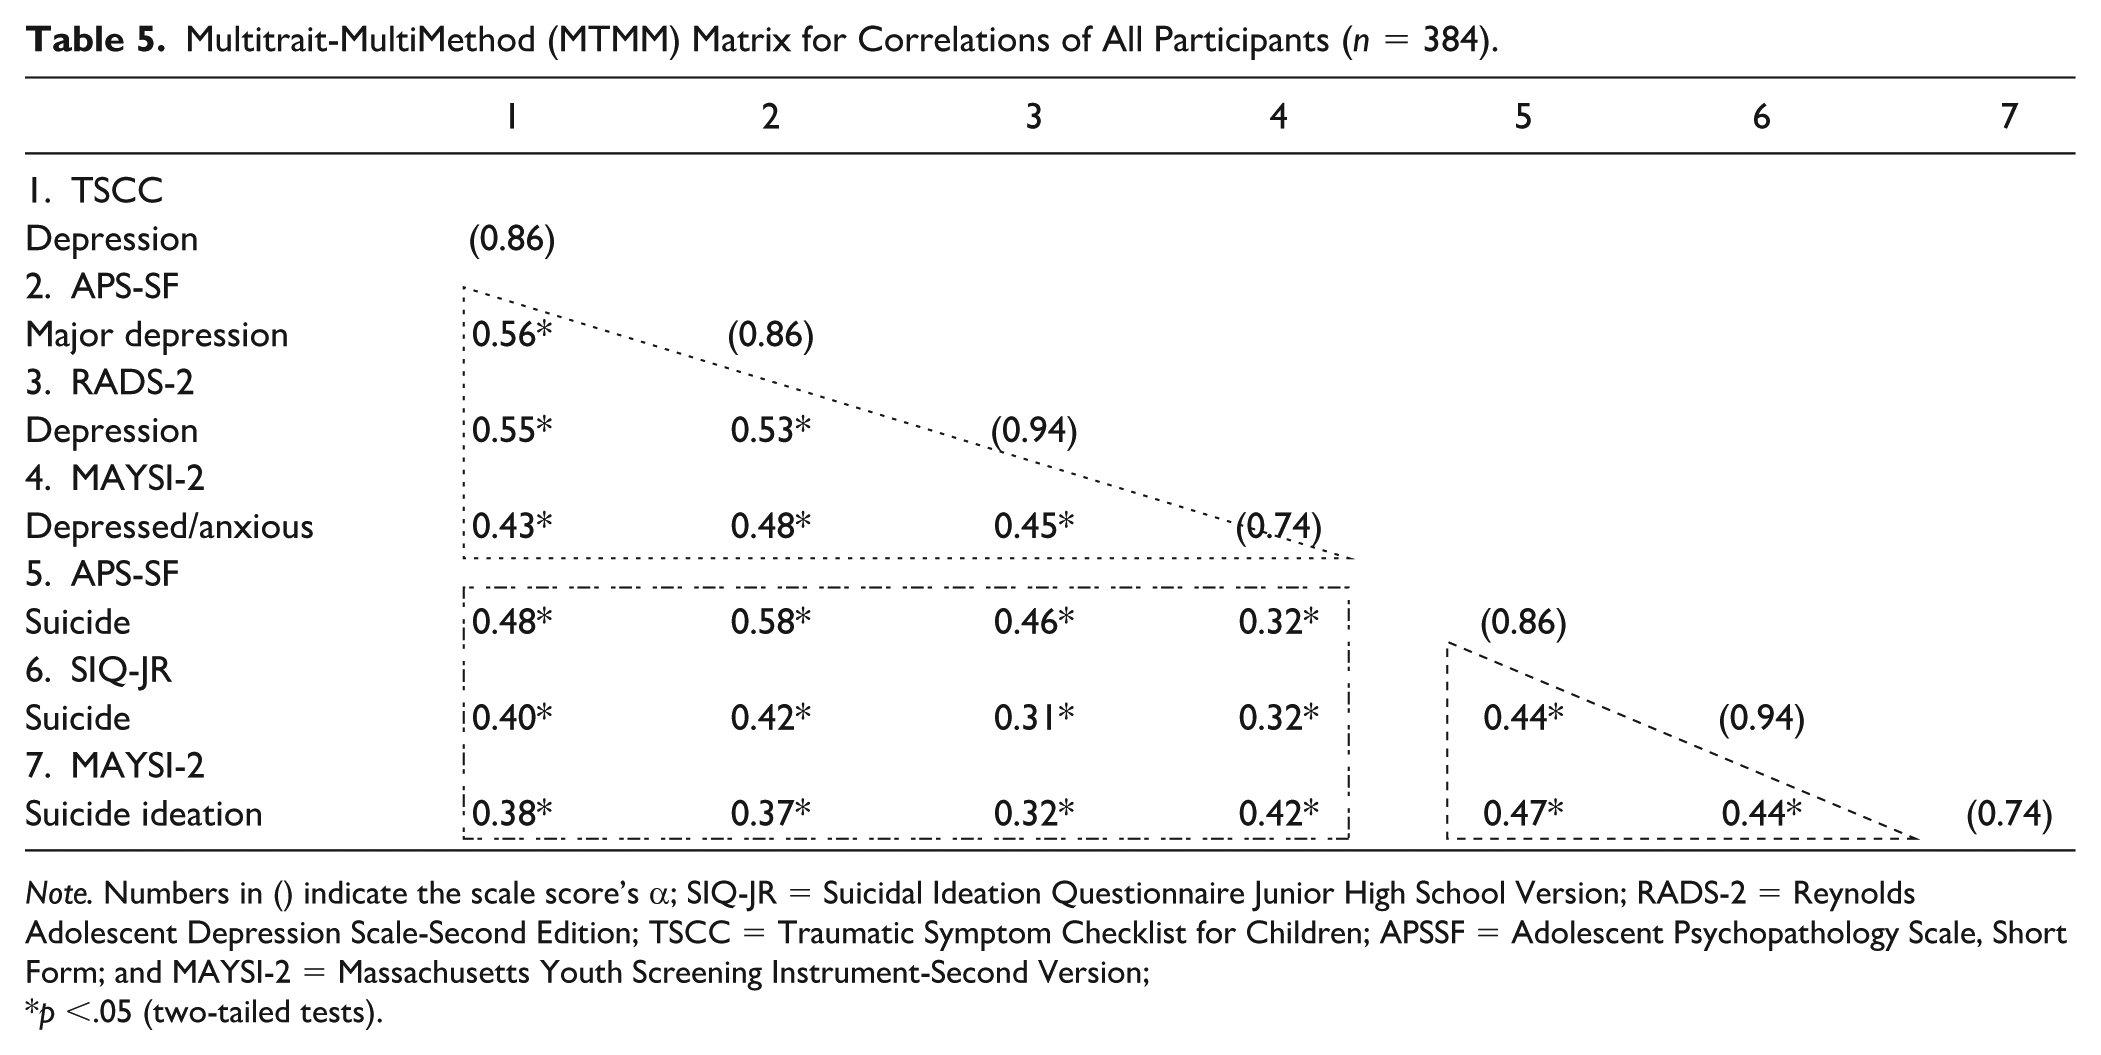
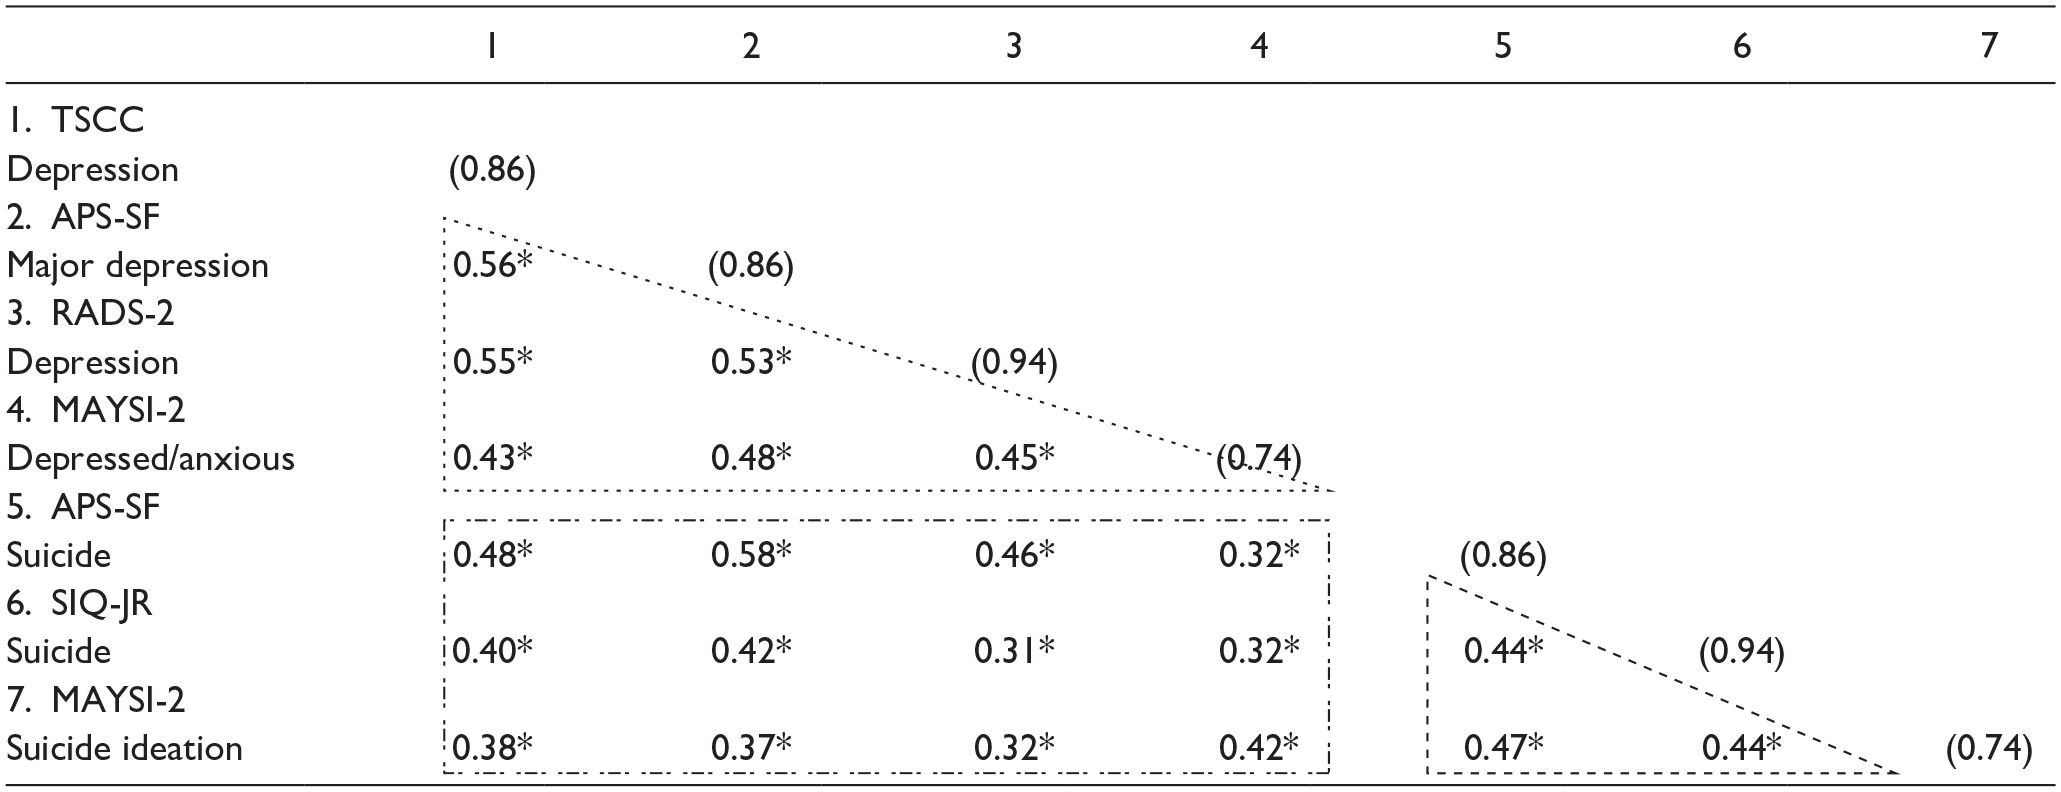
Note. Numbers in () indicate the scale score’s α; SIQ-JR = Suicidal Ideation Questionnaire Junior High School Version; RADS-2 = Reynolds Adolescent Depression Scale-Second Edition; TSCC = Traumatic Symptom Checklist for Children; APSSF = Adolescent Psychopathology Scale, Short Form; and MAYSI-2 = Massachusetts Youth Screening Instrument-Second Version;
p <.05 (two-tailed tests).
For all participants (n = 384), the magnitude of the correlations evaluating convergent validity evidence (RQ 1) within subscales measuring the depression construct and suicide ideation subscales are all between r = 0.38 and r = 0.56, which are considered moderate, positive correlations. When examining the correlations inside the triangles for depression subscales and suicide ideation subscales, it is evident that all of the correlations showed statistically significant correlations from zero. The correlation between TSCC_Depression and APSSF_Depression is the highest (r = 0.56, p <.05). The lowest convergent relationship for the depression scores is TSCC_Depression and MAYSI2_Depressed-anxious with r = 0.42 (p < .05), and the lowest for the convergent relationships for the suicide ideation scores is r = 0.38 (p < .05) between MAYSI2_Suicide ideation and SIQ-JR_Suicide.
The magnitude of the correlations evaluating divergent evidence (RQ 2) across depression scores and suicide ideation scores are all between r = 0.31 and r = 0.58, which are in the range of a weak to moderate, positive relationships. These correlations showed some evidence of divergent validity of the subscale scores, as they are meant to measure different, but related constructs. Among all of these correlations, the highest is between APSSF_Depression and APSSF_Suicide (r = 0.58, p < .05).
Research Question 3
When breaking down the samples based on ethnic groups, we examined the MTMM correlation matrix separately for the White (n = 137) and African American (n = 207) youth, then we compared their correlations. We answered RQ 3 with the results displayed in Tables 6 and 7. The correlations of the two groups showed similar data patterns to the previous results in Table 5 for all participants. One thing that should be noted is that the correlations inside the convergent triangles for depression subscales are nearly 0.1 higher in the White group as compared to the African American group, while suicide ideation subscale correlations were nearly 0.2 higher in the White group than in the African American group. It indicates that compared to the African American group, the convergent correlations are stronger in the White group within each of the constructs of depression and suicide ideation. When we compared this set of convergent correlations, we found that the relationships between all suicide ideation subscales, to be more specific, the APSSF_Suicide and SIQ-JR_Suicide, APSSF_Suicide and MAYSI-2_Suicide ideation, and SIQ-JR_Suicide and MAYSI-2_Suicide ideation, are statistically significant. This indicates that the White and the African American youth had different convergent relationships in our data. When looking at the rectangles for the coefficients about divergence, the correlations between MAYSI-2_Depressed-anxious and TSCC_Depression in the White group is statistically significantly different from those in the African American group.
Multitrait-MultiMethod (MTMM) Matrix for Correlations of White Participants (n = 137).
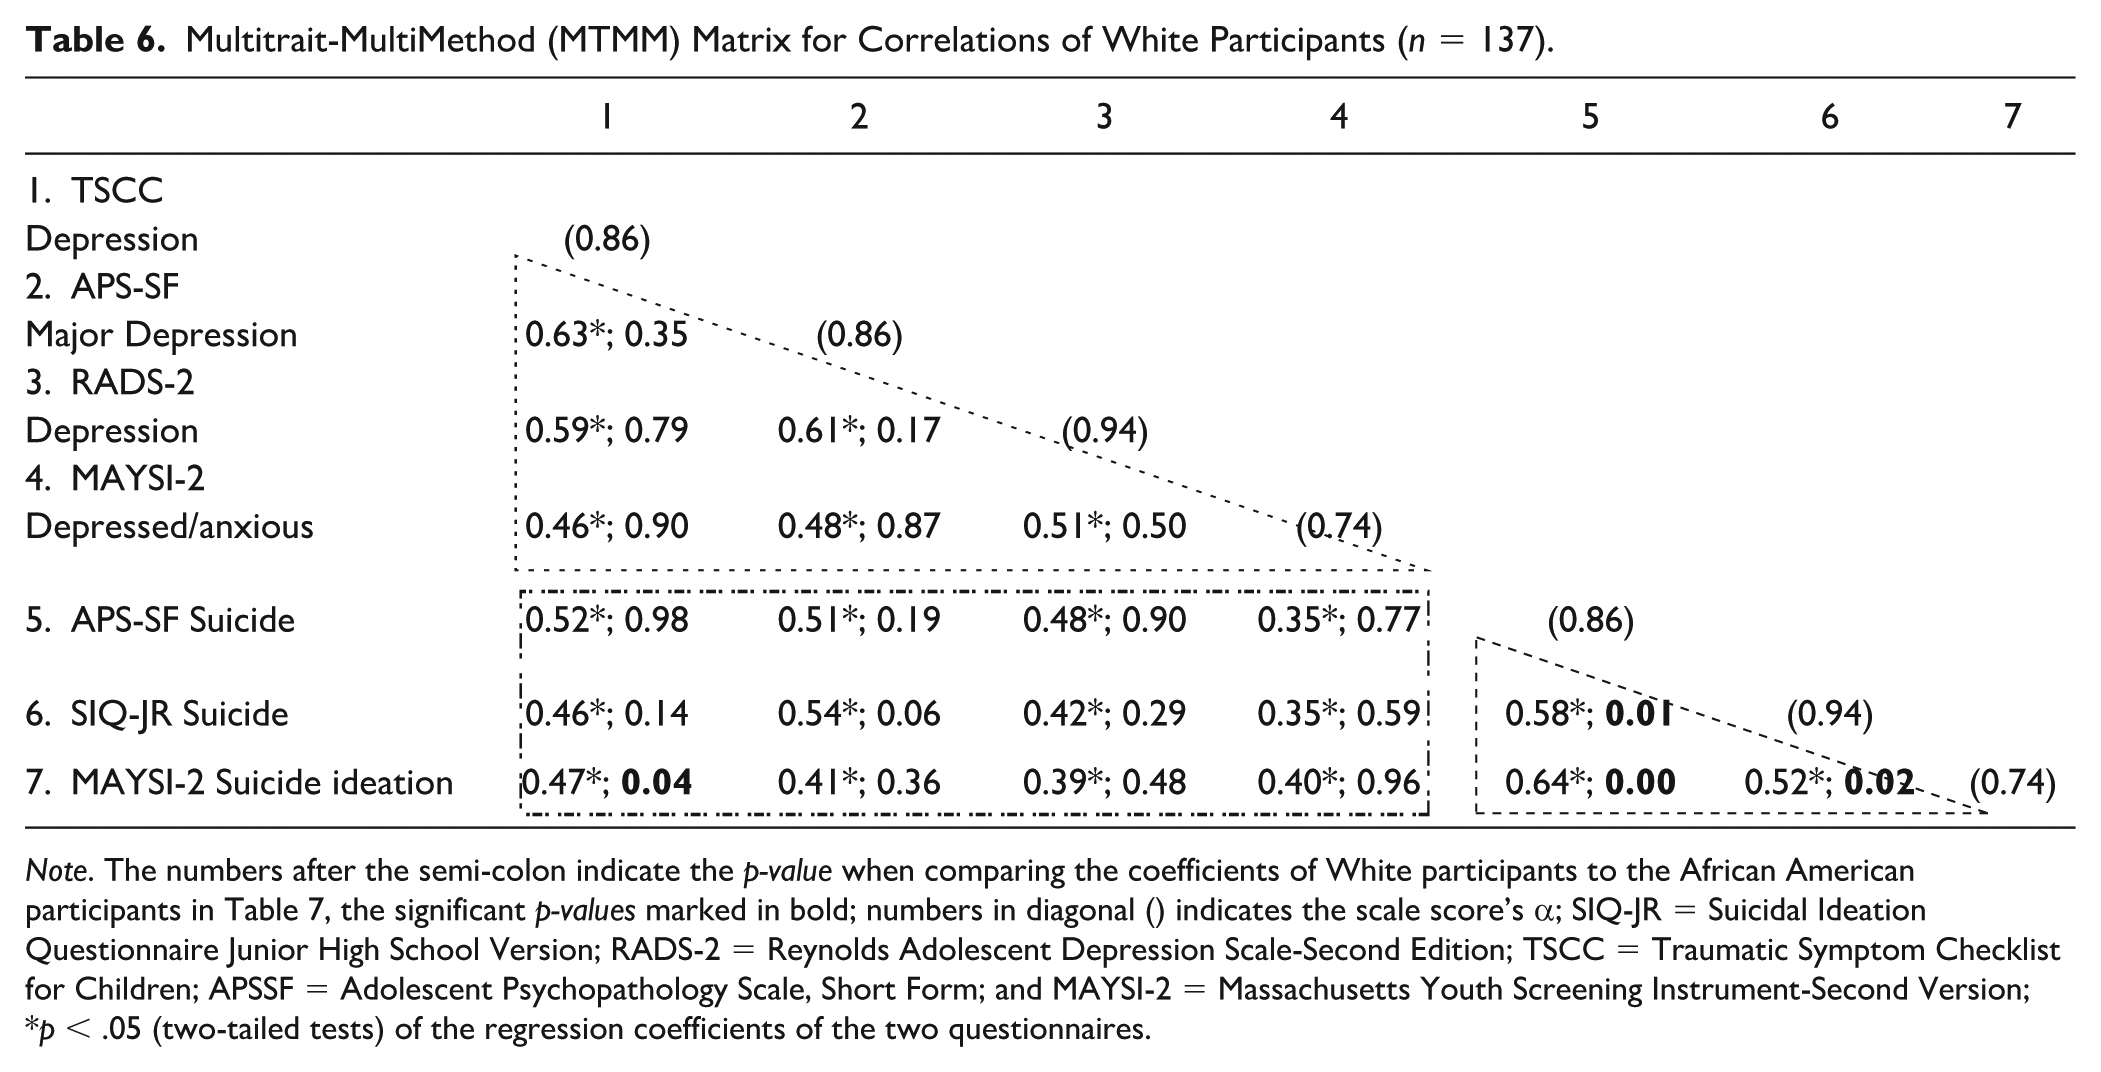
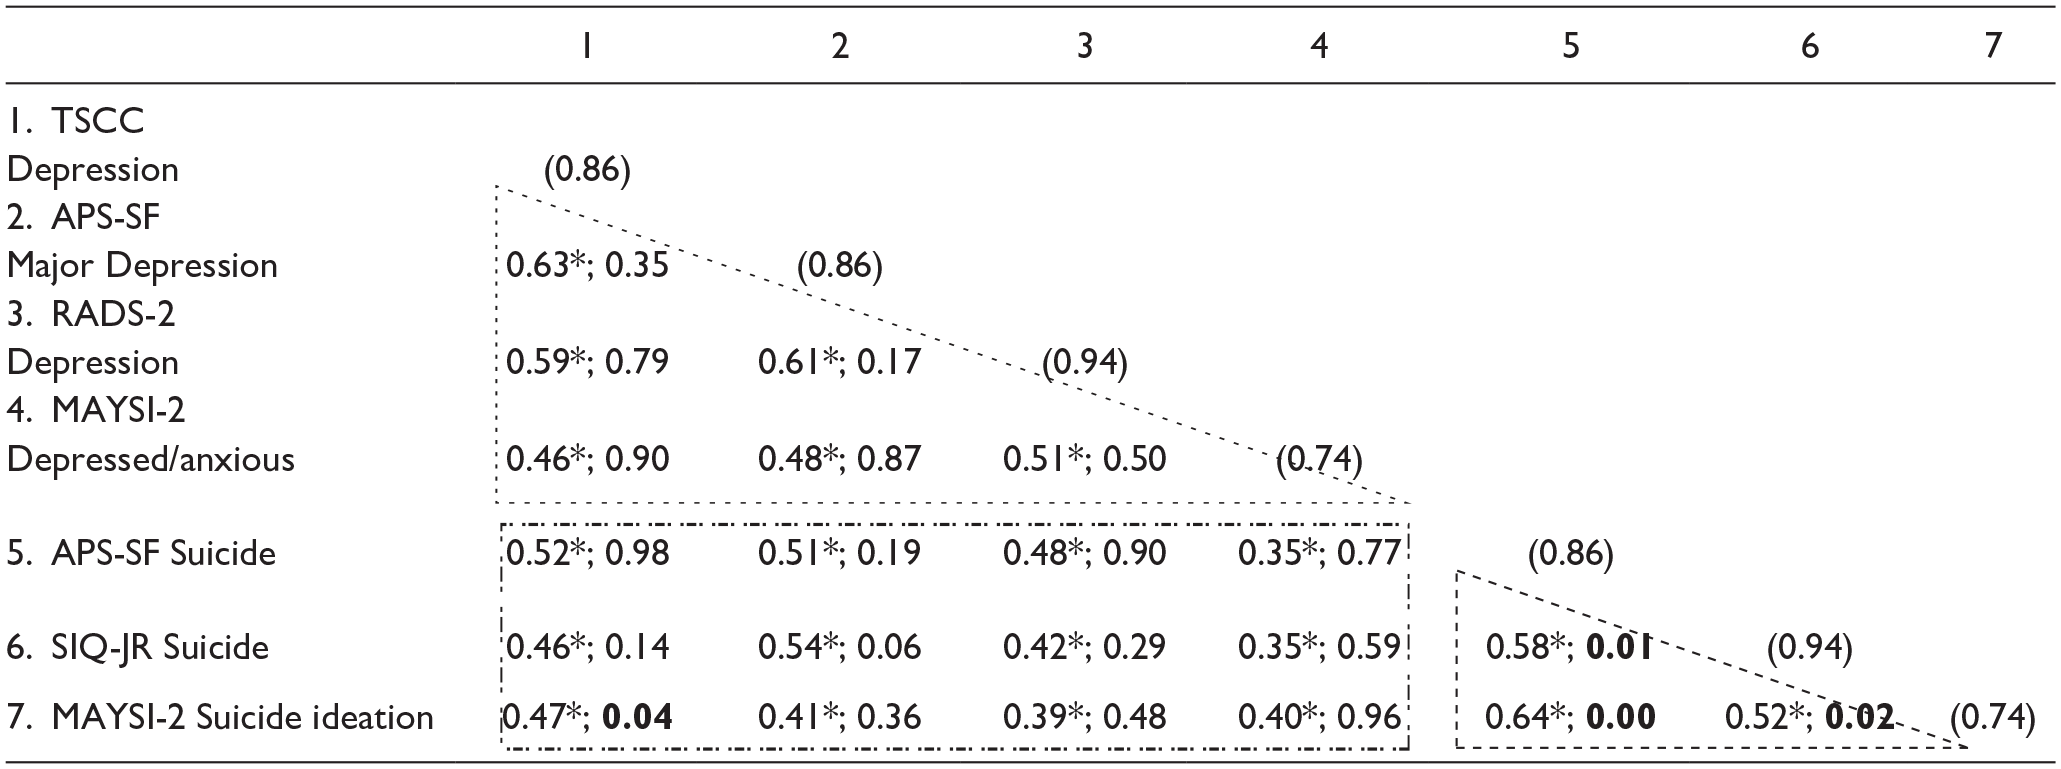
Note. The numbers after the semi-colon indicate the p-value when comparing the coefficients of White participants to the African American participants in Table 7, the significant p-values marked in bold; numbers in diagonal () indicates the scale score’s α; SIQ-JR = Suicidal Ideation Questionnaire Junior High School Version; RADS-2 = Reynolds Adolescent Depression Scale-Second Edition; TSCC = Traumatic Symptom Checklist for Children; APSSF = Adolescent Psychopathology Scale, Short Form; and MAYSI-2 = Massachusetts Youth Screening Instrument-Second Version;
p < .05 (two-tailed tests) of the regression coefficients of the two questionnaires.
Multitrait-MultiMethod (MTMM) Matrix for Correlations of African American Participants (n = 207).
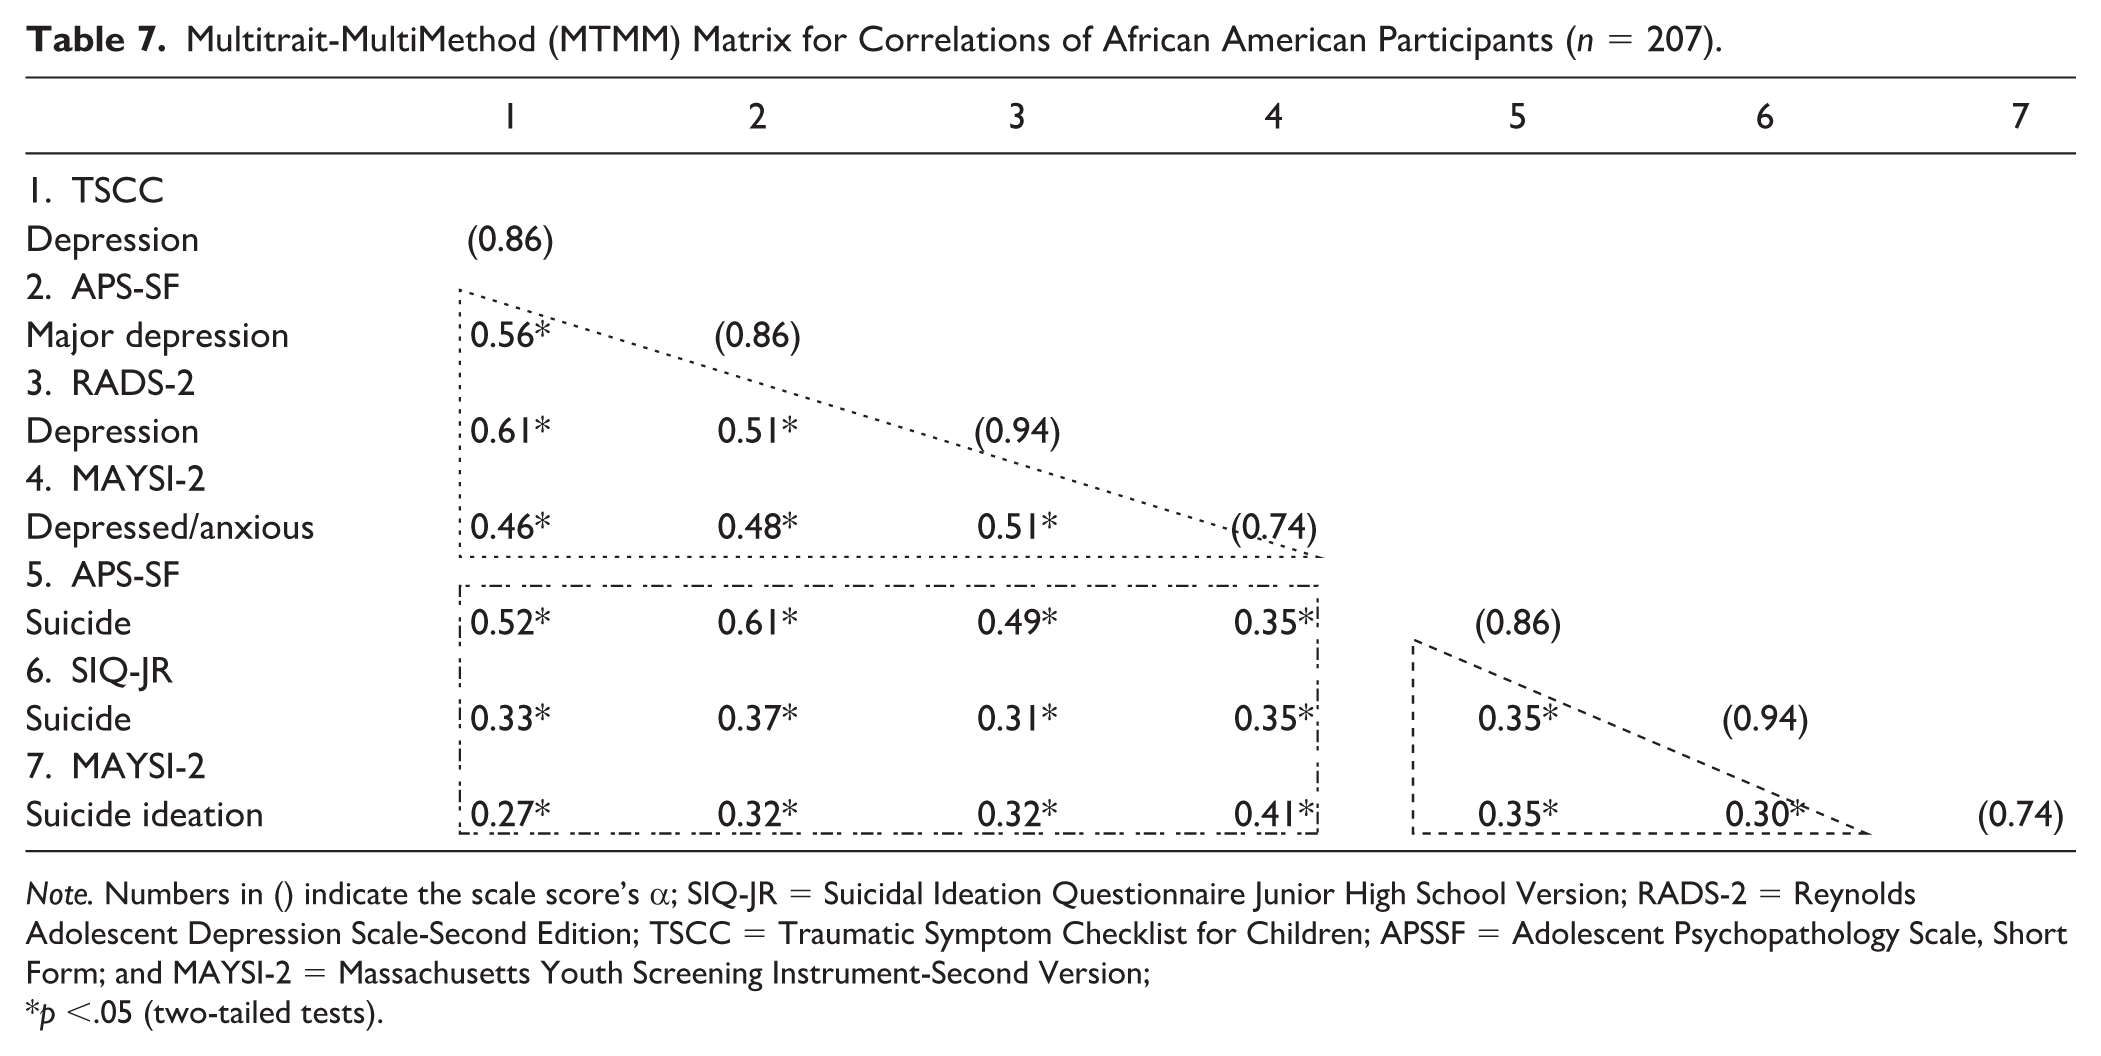
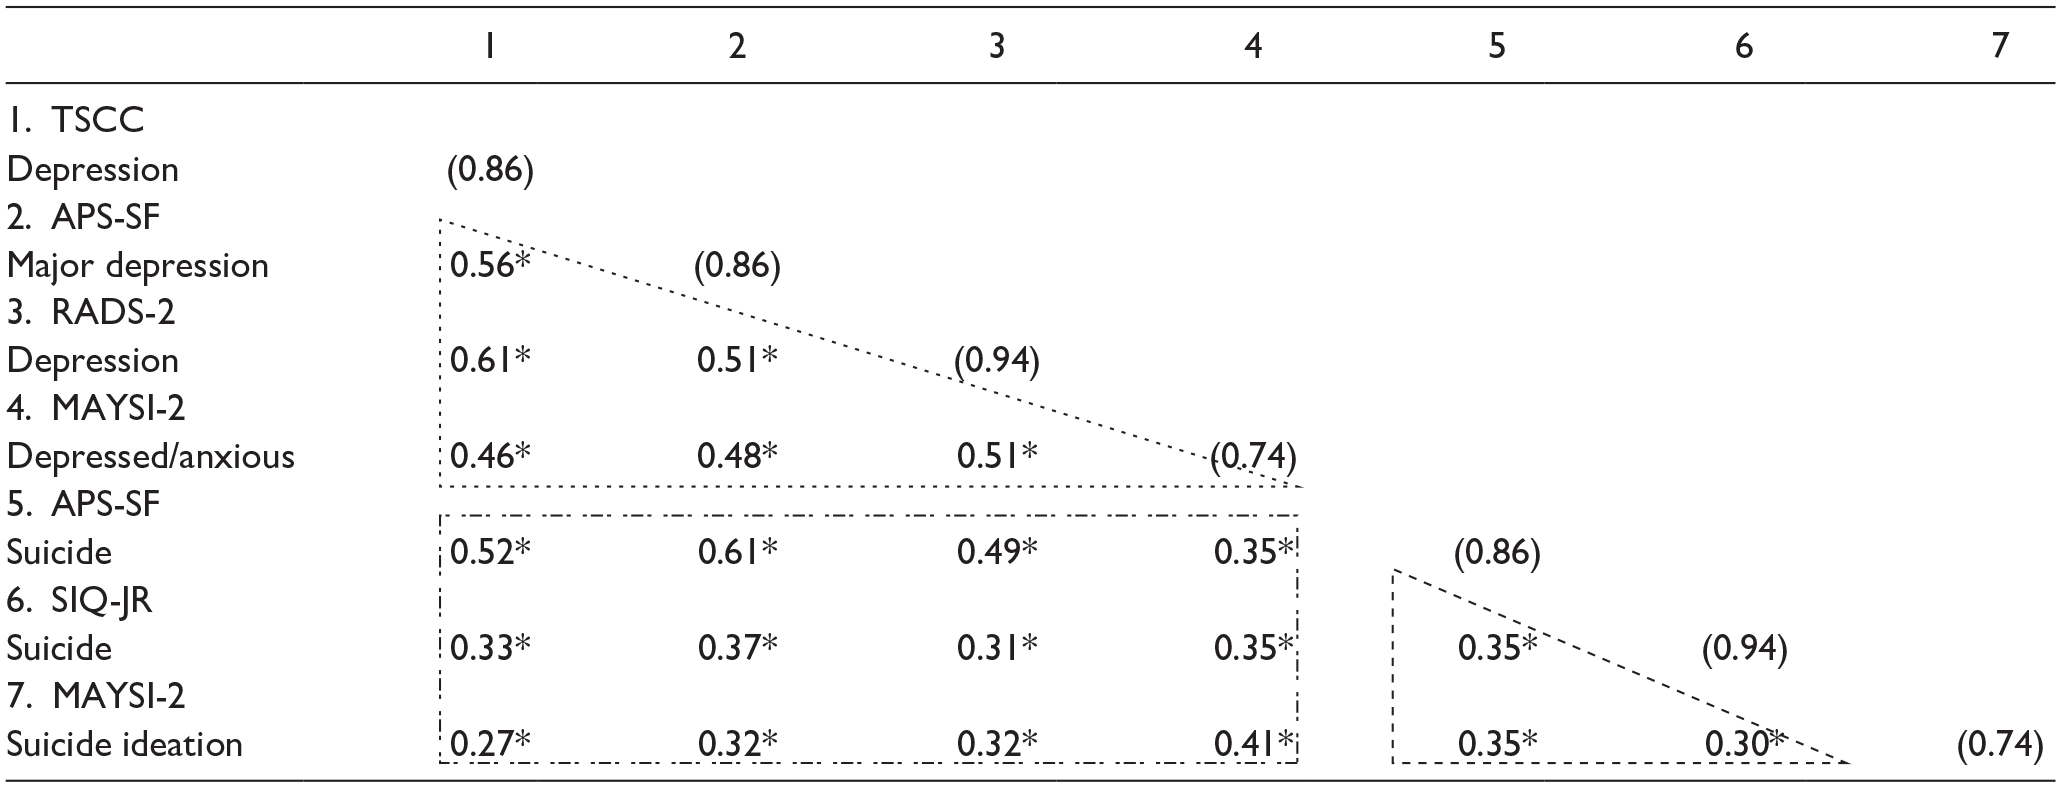
Note. Numbers in () indicate the scale score’s α; SIQ-JR = Suicidal Ideation Questionnaire Junior High School Version; RADS-2 = Reynolds Adolescent Depression Scale-Second Edition; TSCC = Traumatic Symptom Checklist for Children; APSSF = Adolescent Psychopathology Scale, Short Form; and MAYSI-2 = Massachusetts Youth Screening Instrument-Second Version;
p <.05 (two-tailed tests).
Discussion
Mental health screening at intake into a JCF is fundamental to identifying youth in need of immediate intervention and those that require a complete evaluation. Moreover, given the disproportionate and extremely high prevalence of mental health disorders, risk of suicide, and almost complete lack of research concerning adjudicated youth, it is crucial to better understand the psychometrics of common screening tools. As such, this study examined the convergent and divergent validity of depression and suicidality constructs on screening measures. There was some evidence of convergent validity, but the evidence is not sufficiently strong such that we can conclude the scores represent the intended constructs in identical ways across all measures. The convergent evidence is somewhat weakened by divergent evidence that is only slightly lower. Restated, one would expect stronger relationships between scales that measure the same construct as compared to scales that measure two different constructs. We found some evidence of this (see triangled values in Table 5, as compared to rectangle values in the same table), but the correlation magnitudes had more overlap than anticipated. However, given the relationship between the constructs of depression and suicidality, weak to moderate evidence of divergent validity was expected. It is not clear why the estimates of convergent validity are lower in adjudicated youth compared to norm samples collected by test developers using nationally representative samples of detained youth. Future research needs to replicate the research in additional JCF for adjudicated youth with greater numbers of participants.
We also examined the degree to which the convergent and divergent correlations on these measures varied by ethnic group. Similar to the full sample, convergent validity estimates for White and African American youth were both found to be generally moderate when strong relationships would be preferred. A statistically significant difference was found when comparing convergent validity estimates between African American and White participants, with African American participants having a nearly 0.1 lower estimate across depression and nearly 0.2 lower across suicidality measures. This indicates that despite these measures having limited construct representation across measures, it was poorer for African American participants. It is unclear what is contributing to these significant differences, but it indicates that the use of multiple screening tools does not improve reliability in identifying safety concerns in this population. Hence, any decisions made for these youth based on such measurements may lack strong validity evidence. Additional research is needed to understand why these measurement differences are occurring and, therefore, how the measurement tools can be improved to allow for more validity evidence attached to any use of the scores.
Limitations
The findings of our study should be considered within the context of several important limitations. Specifically, all of the screening tools were read to students, which could have affected student self-reports. However, all study participants were included in the larger reading study due to difficulties with reading and generally, up to 39% of incarcerated youth have a learning disability (Quinn et al., 2005), which often affects students’ reading comprehension. Given these facts, it was acknowledged that a poor fit between a measure’s readability and the respondents’ reading age may affect each measure’s validity and reliability (Kraus et al., 2022). It was also taken into consideration that reading the screening questions aloud, “would be considered an accommodation because reading is not part of the defined construct (science inquiry) and the scores obtained by the student on the test would be assumed to be comparable to those obtained by students testing under regular conditions” (Joint Committee on the Standards for Educational and Psychological Testing of the American Educational Research Association, the American Psychological Association, and the National Council on Measurement in Education, 2014, p. 190).
Additional limitations include the fact that we did not estimate a reliability coefficient for scores from each instrument. Rather, we used Cronbach’s alpha estimates from test publisher professional manuals, as we did not have item level data. In addition, there are some analytical judgmental decisions that could differ substantially among researchers implementing our method. For example, when fitting the cumulative generalized models, we only considered linear relationships whereas others may choose to evaluate non-linear relationships as well. Despite these limitations, the results provide important clinical implications.
Clinical Implications
The core philosophy of the juvenile correctional system is that youth can and should be rehabilitated (Gagnon, Ross Benedick, et al., 2022). Included in this promise is the provision of appropriate mental health services, which begins with appropriate screening at intake. Results of this study highlight the limitations of current screening tools; a situation that is particular concerning, given that it could result in missing a participant with depression and/or suicidal ideation, which can have dire consequences in this population. The results align with researchers’ (Richardson et al., 2015) assertion that the limitations of screening measure only allow tentative conclusions for incarcerated youth.
What becomes evident is the complexity of choosing appropriate screening tools and the necessity of supplementing the screening with additional sources of information. According to the American Psychological Association, it is best practice in social emotional assessment to utilize comprehensive assessment strategies to include measuring youth’s behavior using multiple sources (self/family/teacher) and methods (rating scale/observation/record review/interview) across multiple settings (home/school/community) (American Psychological Association & Task Force on Psychological Assessment and Evaluation Guidelines, 2020). It is important for the screening professional to be aware of situation-specific elevation of concerns, particularly for youth in the juvenile justice system. Importantly, it is recommended for all data collected from behavior rating scales to be corroborated through observation and clinical interview with the child and caregiver informants. Granted, implementation of such processes within a juvenile corrections setting are complicated by financial constraints (Gagnon, Mason-Williams, et al., 2022), limitations to the number and training of staff (Swank & Gagnon, 2017), and difficulties with engaging parents/guardians (Burke et al., 2014). Nevertheless, the limitations of current screening tools described in this study necessitate a more robust approach, if we are to ensure youth emotional health, well-being, safety, and to realize the promise of rehabilitation.
Footnotes
Declaration of Conflicting Interests
The author(s) declared no potential conflicts of interest with respect to the research, authorship, and/or publication of this article.
Funding
This study was conducted as part of Project LIBERATE, funded by the Institute of Education Sciences (IES), Award #R324A080006. The opinions expressed here are the authors’ and do not necessarily represent those of IES or the U.S. Department of Education.
Ethical Approval
All procedures performed in studies involving human participants were in accordance with the ethical standards of the institutional and/or national research committee and with the 1964 Helsinki Declaration and its later amendments or comparable ethical standards.
Informed Consent/Assent
Informed assent was received from all youth and informed consent from the guardian of each youth.