
Abstract
This research note explores the impact of international migration on global population distribution since the 1990s. The impact of migration on population distribution is a function of both the intensity as well as the effectiveness of migration, that is the imbalance between flows and counter-flows. The presence of reciprocal flows is a well-recognized feature of international migration systems; however, this dimension has been difficult to capture at the global level due to a lack of origin-destination flow data. In this research note, we apply metrics developed for the analysis of internal migration to global migration flows to explore the impact of international migration on global population distribution over time, and across levels of human development. In the five years to 2020, international migration redistributed 0.39 percent of the world's population (28 million people) despite 1.38 percent (101 million) changing country of residence. This has declined from 0.56 percent of the global population in 1990–1995. This decline in impact is underpinned by a reduction in migration effectiveness, that is, the migration system is becoming more balanced over time. The impact of migration was greatest for flows between countries at Very High levels of human development, reflecting high migration intensity and exchanges between countries at Low and Very High levels of human development, reflecting significant asymmetry of flows. Our results suggest systematic shifts in both the level and pattern of flows across the development ladder, with flows becoming more intense and balanced with higher levels of human development.
Introduction
Shifts in global population distribution have long been rooted in a “slow demography paradigm” (Billari 2022) whereby gradual shifts in population size and structure occur in response to differentials in fertility and mortality. In contrast, migration has the potential to generate rapid shifts in population size, composition, and distribution, particularly at the local level. This was demonstrated to dramatic effect during the COVID-19 pandemic, with widespread international border closures impacting global migration flows (González-Leonardo et al. 2023). Until recently, systematic quantification of the impact of international migration on population distribution was inhibited by the lack of global data (Willekens et al. 2016). The last decade has seen significant advances, with estimates of migration stocks as well as bilateral migration flows produced (Abel and Cohen 2019). New data have provided surprising insights into the trends and patterns of international migration. The most striking of these has been the relative stability in the volume or intensity of global migration flows (Abel and Sander 2014; de Haas et al. 2019).
Notwithstanding, recent decades have seen significant changes in global migration flows. Migrants are now drawn from an increasing number of origins (Czaika and de Haas 2014) and concentrate in a more limited set of destination countries (de Haas, Castles and Miller 2019), producing a denser global migration network (Tranos, Gheasi and Nijkamp 2015). Although most migration movements continue to occur between neighboring countries (UN 2019), more migrants now travel over greater distances (Czaika and de Haas 2014). The direction of flows has also shifted as new origins and destinations emerge (de Haas, Castles and Miller 2019). One aspect of international migration yet to be systematically examined is its impact, that is, the degree to which migration is redistributing the global population. Developed for the analysis of internal migration (Bell et al. 2002), the measures the spatial impact of migration are a function of the product of the intensity (i.e., how much movement) and effectiveness of migration (i.e., the degree of asymmetry in flows).
International migration is largely motivated by economic forces, although demographic, environmental, policy, and political factors also play a role (Sander et al. 2013). The volume of migration reflects conditions at the origin and destination, mediated by distance-cost, and is expected to change over time as countries develop. At origins, emigration has been shown to demonstrate an inverted-U shape relationship with development (Clemens 2014). Initially, the volume of emigration tends to be low as individuals lack the resources to move abroad (Massey 1988). Emigration increases as countries become wealthier, enhancing people's capacity to migrate and raising aspirations (De Haas 2010). At higher levels of development, emigration declines due to reduced economic returns on migration, although emigration is likely to remain higher than in low-income countries (de Haas 2020). In receiving countries, immigration is expected to increase linearly with development, with countries becoming progressively more attractive as migrant destinations (de Haas 2010). At the global level, the intensity of migration is expected to increase during the initial process of global development, before declining. Intensity is, however, unlikely to return to previous levels, with significant ongoing circulation driven by intense trade flows and cumulative causation in migration (Massey et al. 1993).
The effectiveness of international migration, that is, the degree to which flows are offset by counter-flows, is a well-recognized aspect of migration dating back to Ravenstein's seminal works (Ravenstein 1889; Fawcett 1989). Like intensity, effectiveness is a function of conditions at both origins and destinations. The effectiveness of international migration will be low but volatile between less developed countries, a function of the small volumes of permanent economic migration involved (although they may be significant temporary flows) (Chapman and Prothero 1983), but also the susceptibility of systems to shocks such as conflict and disaster-induced displacement. Migration effectiveness is expected to increase as emigration to high-income countries intensifies but is not yet offset by reciprocal flows to less developed countries, including return migration. For countries at later stages of development, effectiveness may decline as spatial equilibrium is reached resulting from balancing immigration and emigration levels. This is not a foregone conclusion: for internal migration we see variable patterns of migration at higher levels of development such as the initiation of counter urban flows, increasing effectiveness (Rees et al. 2017). In the case of international migration, selective migration policies may increase effectiveness, at least temporarily, as new sources of migrants are targeted. In concert, progressive changes in intensity and effectiveness will drive changes in the spatial impact of migration on the global population distribution but is as yet unclear how these two facets will combine to generate spatial impact.
In this research note, we explore the impact of migration by applying metrics developed in the field of internal migration analysis (Bell et al. 2002) to recent estimates of international bilateral flows prepared by Abel and Cohen (2019). We analyze the intensity, effectiveness, and spatial impact of international migration between countries to determine whether spatial impact has increased or decreased since 1990. We then investigate links between development and the spatial impact of migration by analyzing migration between countries at various levels of human development in the period 2015–2020. We conclude with a summary of the major differences of migration impact and avenues for future work.
Dataset
The last decade has seen significant methodological advances in the estimation of global migration. There are two main types of estimates: stock estimates, which capture the number of migrants in a country at a specific point in time, and flow estimates which capture the movement of people in, out, and between countries in a given interval. Bilateral migrant stock estimates for 232 countries for the years 1990, 1995, 2000, 2005, 2010, 2015, and 2020 have been produced by the United Nations, with the latest set released in 2022 (UN 2022b). Stocks are estimated from place of birth data collected by national censuses and population registers and adjusted to account for refugee statistics. For countries with missing data, stocks are estimated using data from a similar country or group of countries. Bilateral stock estimates provide a wealth of information on the global distribution of international migrants, but they do not capture the flows driving changes in migrant stocks over time. Estimates of bilateral migration flows can be generated from stocks using a range of methods. In this study, we use the bilateral estimates produced by Abel and Cohen (2019) using the method developed by Azose and Raftery (2019) for 229 countries for the intervals 1990–1995, 1995–2000, 2000–2005, 2005–2010, 2010–2015, and 2015–2020. The recent assessment by Abel and Cohen (2019) found that estimates produced using the Azose and Raftery method (2019) performed best when validated against a range of external data. Critically these data capture both refugee flows and return migrants.
Data were downloaded from https://doi.org/10.6084/m9.figshare.c.4470464 (01/05/2020).
Measuring Spatial Impact
The cumulative impact of international migration on global populations is captured in global migration stock data. In 2020, an estimated 281 million migrants or 3.6 percent of the world's population were living outside their country of birth in 2020. This has increased from 153 million or 2.9 percent in 1990 (UN 2022b). Measures of cumulative impact obscure the degree to which migration is more or less impactful during specific intervals as the level and direction of flows respond to socio-demographic and economic change. To capture the short-term impact of migration, interval-based measures derived from flow data are needed. Migration impact can be defined as the degree to which a population is redistributed by migration within a defined period. It is a product of the intensity of migration (i.e., how much movement) and the degree to which migration is offset by counter-flows, termed migration effectiveness. The crude migration intensity (CMI) captures the propensity to move in a population. It is calculated as the number of migrants as a percentage of the population at risk, that is a percentage of those who could have made such a move (Bell et al. 2002). For this paper, the population at risk is approximated as the start of period population based on estimates produced by the United Nations Population Division (UN 2022b).

The MEI is a summary metric capturing the degree of reciprocity in a system of origin-destination migration flows.

The MEI falls between 0 and 100. A high score implies that international migration is redistributing population between countries, while low values mean that global migration flows and counterflows are balanced and have limited impact on the distribution of global populations (Bell et al. 2002). A migration system with high intensity but low effectiveness, and vice versa, has a low spatial impact. A system with high intensity and high effectiveness will lead to significant redistribution of population due to international migration.
The combined impact of intensity and effectiveness is captured by the aggregate net migration rate (ANMR). The ANMR relates the total volume of net migration gains in all countries to the population at risk, P so that:

The ANMR can also be calculated as a product of the CMI and the MEI:

Global Trends in International Migration
Figure 1 shows the CMI, MEI, and ANMR for six five-yearly intervals beginning in 1990. Global migration intensity (i.e., CMI) has been stable over this period decades, marginally declining from 1.39 percent in 1990–1995 to 1.26 percent in 1995–2000 and 2000–2005 before trending upwards to1.37 in 2005–2010 and 1.41 percent in 2010–2015. In 2015–2020, the CMI declined to 1.38 percent. This coincides with the beginning of the COVID-19 pandemic, which the UN estimates slowed the growth of international migration by 27 percent in impacted years (UN 2022a). The overall impact on the five-year intensity, 2015–2020, however, is modest.
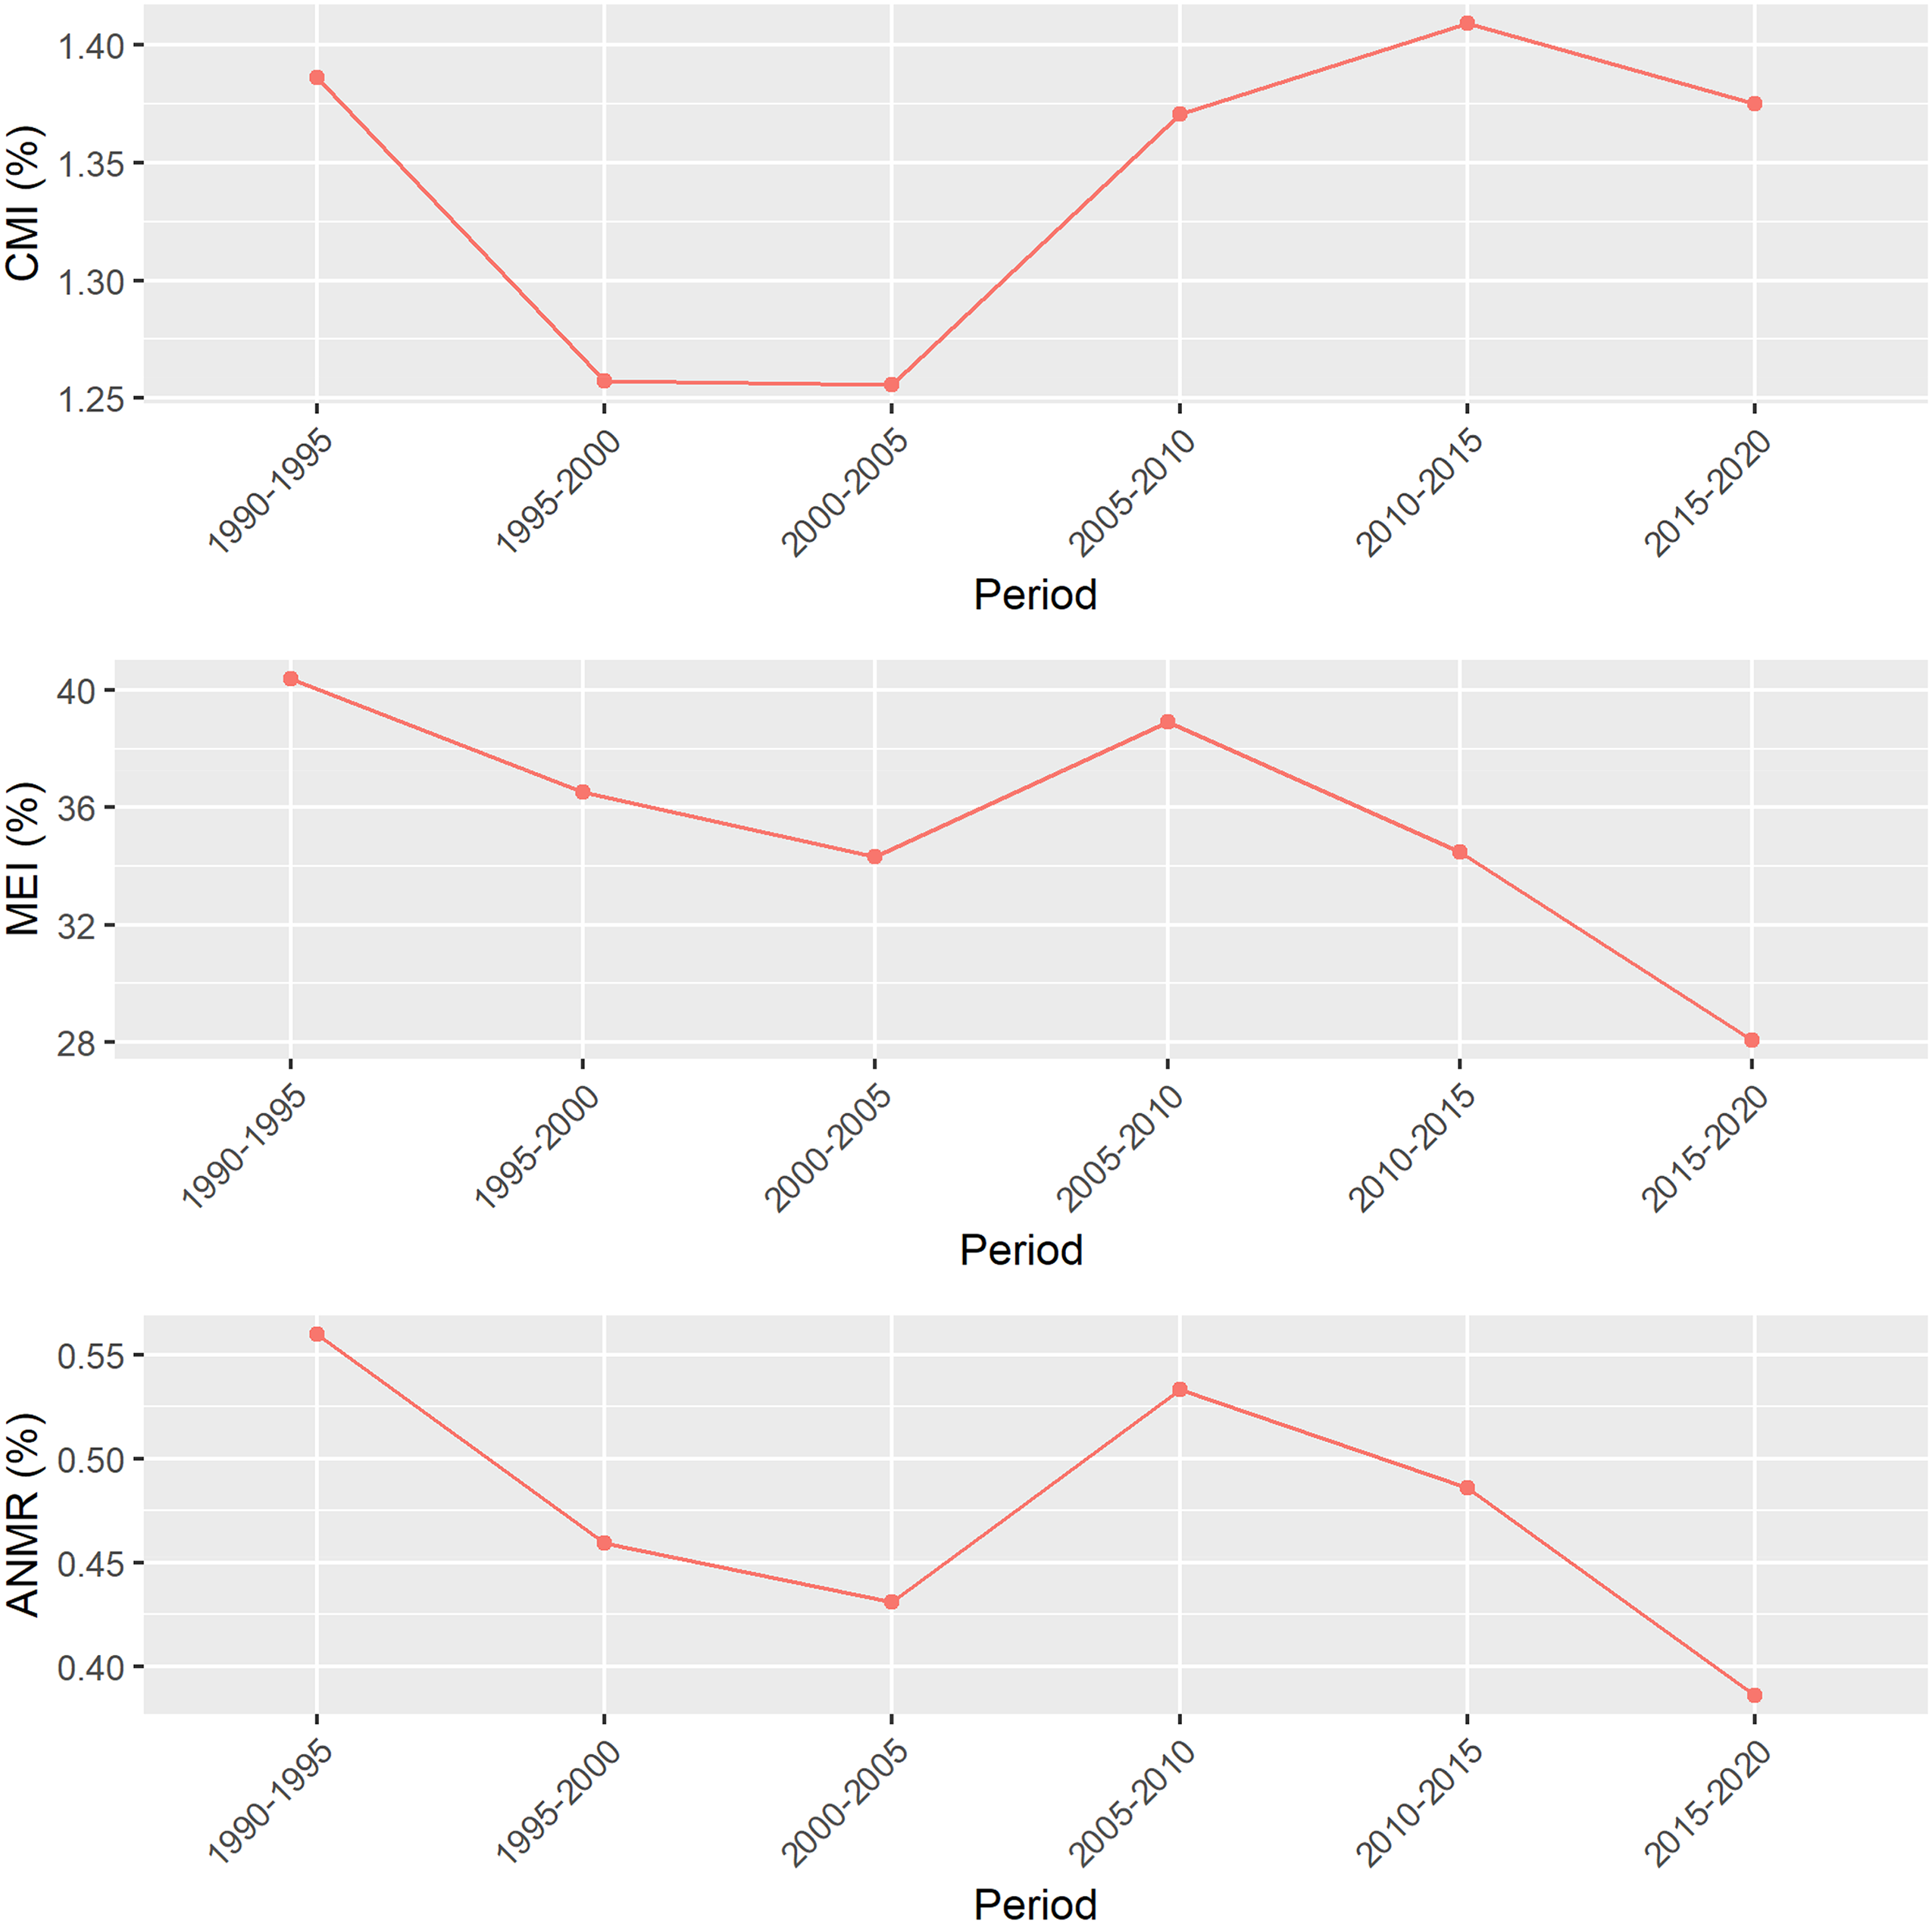
CMI, MEI, and ANMR, all countries, 1990 to 1995 and 2015 to 2020. Source: Authors’ calculations based on Abel and Cohen (2019) data.
Shifts in global intensity reflect the contribution of specific origin-destination flows. Figure 2 shows the largest 25 origin-destination flows in each interval using the same scale across the six periods. In the period 1990 to 1995, fully 29 percent of global flows were contributed by the top 25 origin-destination pairs. Flows from Mexico to the United States of America contributed the largest single share, but there were significant flows into Afghanistan from Pakistan and Iran, as well as from former soviet bloc countries into the Russian Federation. The period 1995 to 2000, a nadir in global migration intensity, corresponded with attenuation of flows emanating from several countries in sub-Saharan Africa, including South Sudan and Rwanda and a significant reduction of inflows to countries including the DR Congo and Afghanistan. Global intensity remained stable in 2000 to 2005, however the pattern changed with India emerging as a significant source of migrants with large flows directed towards neighboring countries of Pakistan and Bangladesh as well as the United Arab Emirates. In the period 2005 to 2010, an increase in global intensity was driven by the emergence of Bangladesh as a major global source of migrants. In 2010 to 2015, Syria was as an important contributor to global intensity in the period because of the Syrian conflict, and Pakistan also emerged as a significant origin. The most recent period, 2015–2020, saw Venezuela emerge as an important source of migrants, with large flows to Columbia, Peru, and Chile. Pakistan remained an important source country, with significant flows to the Saudi Arabia, the United States, and India.
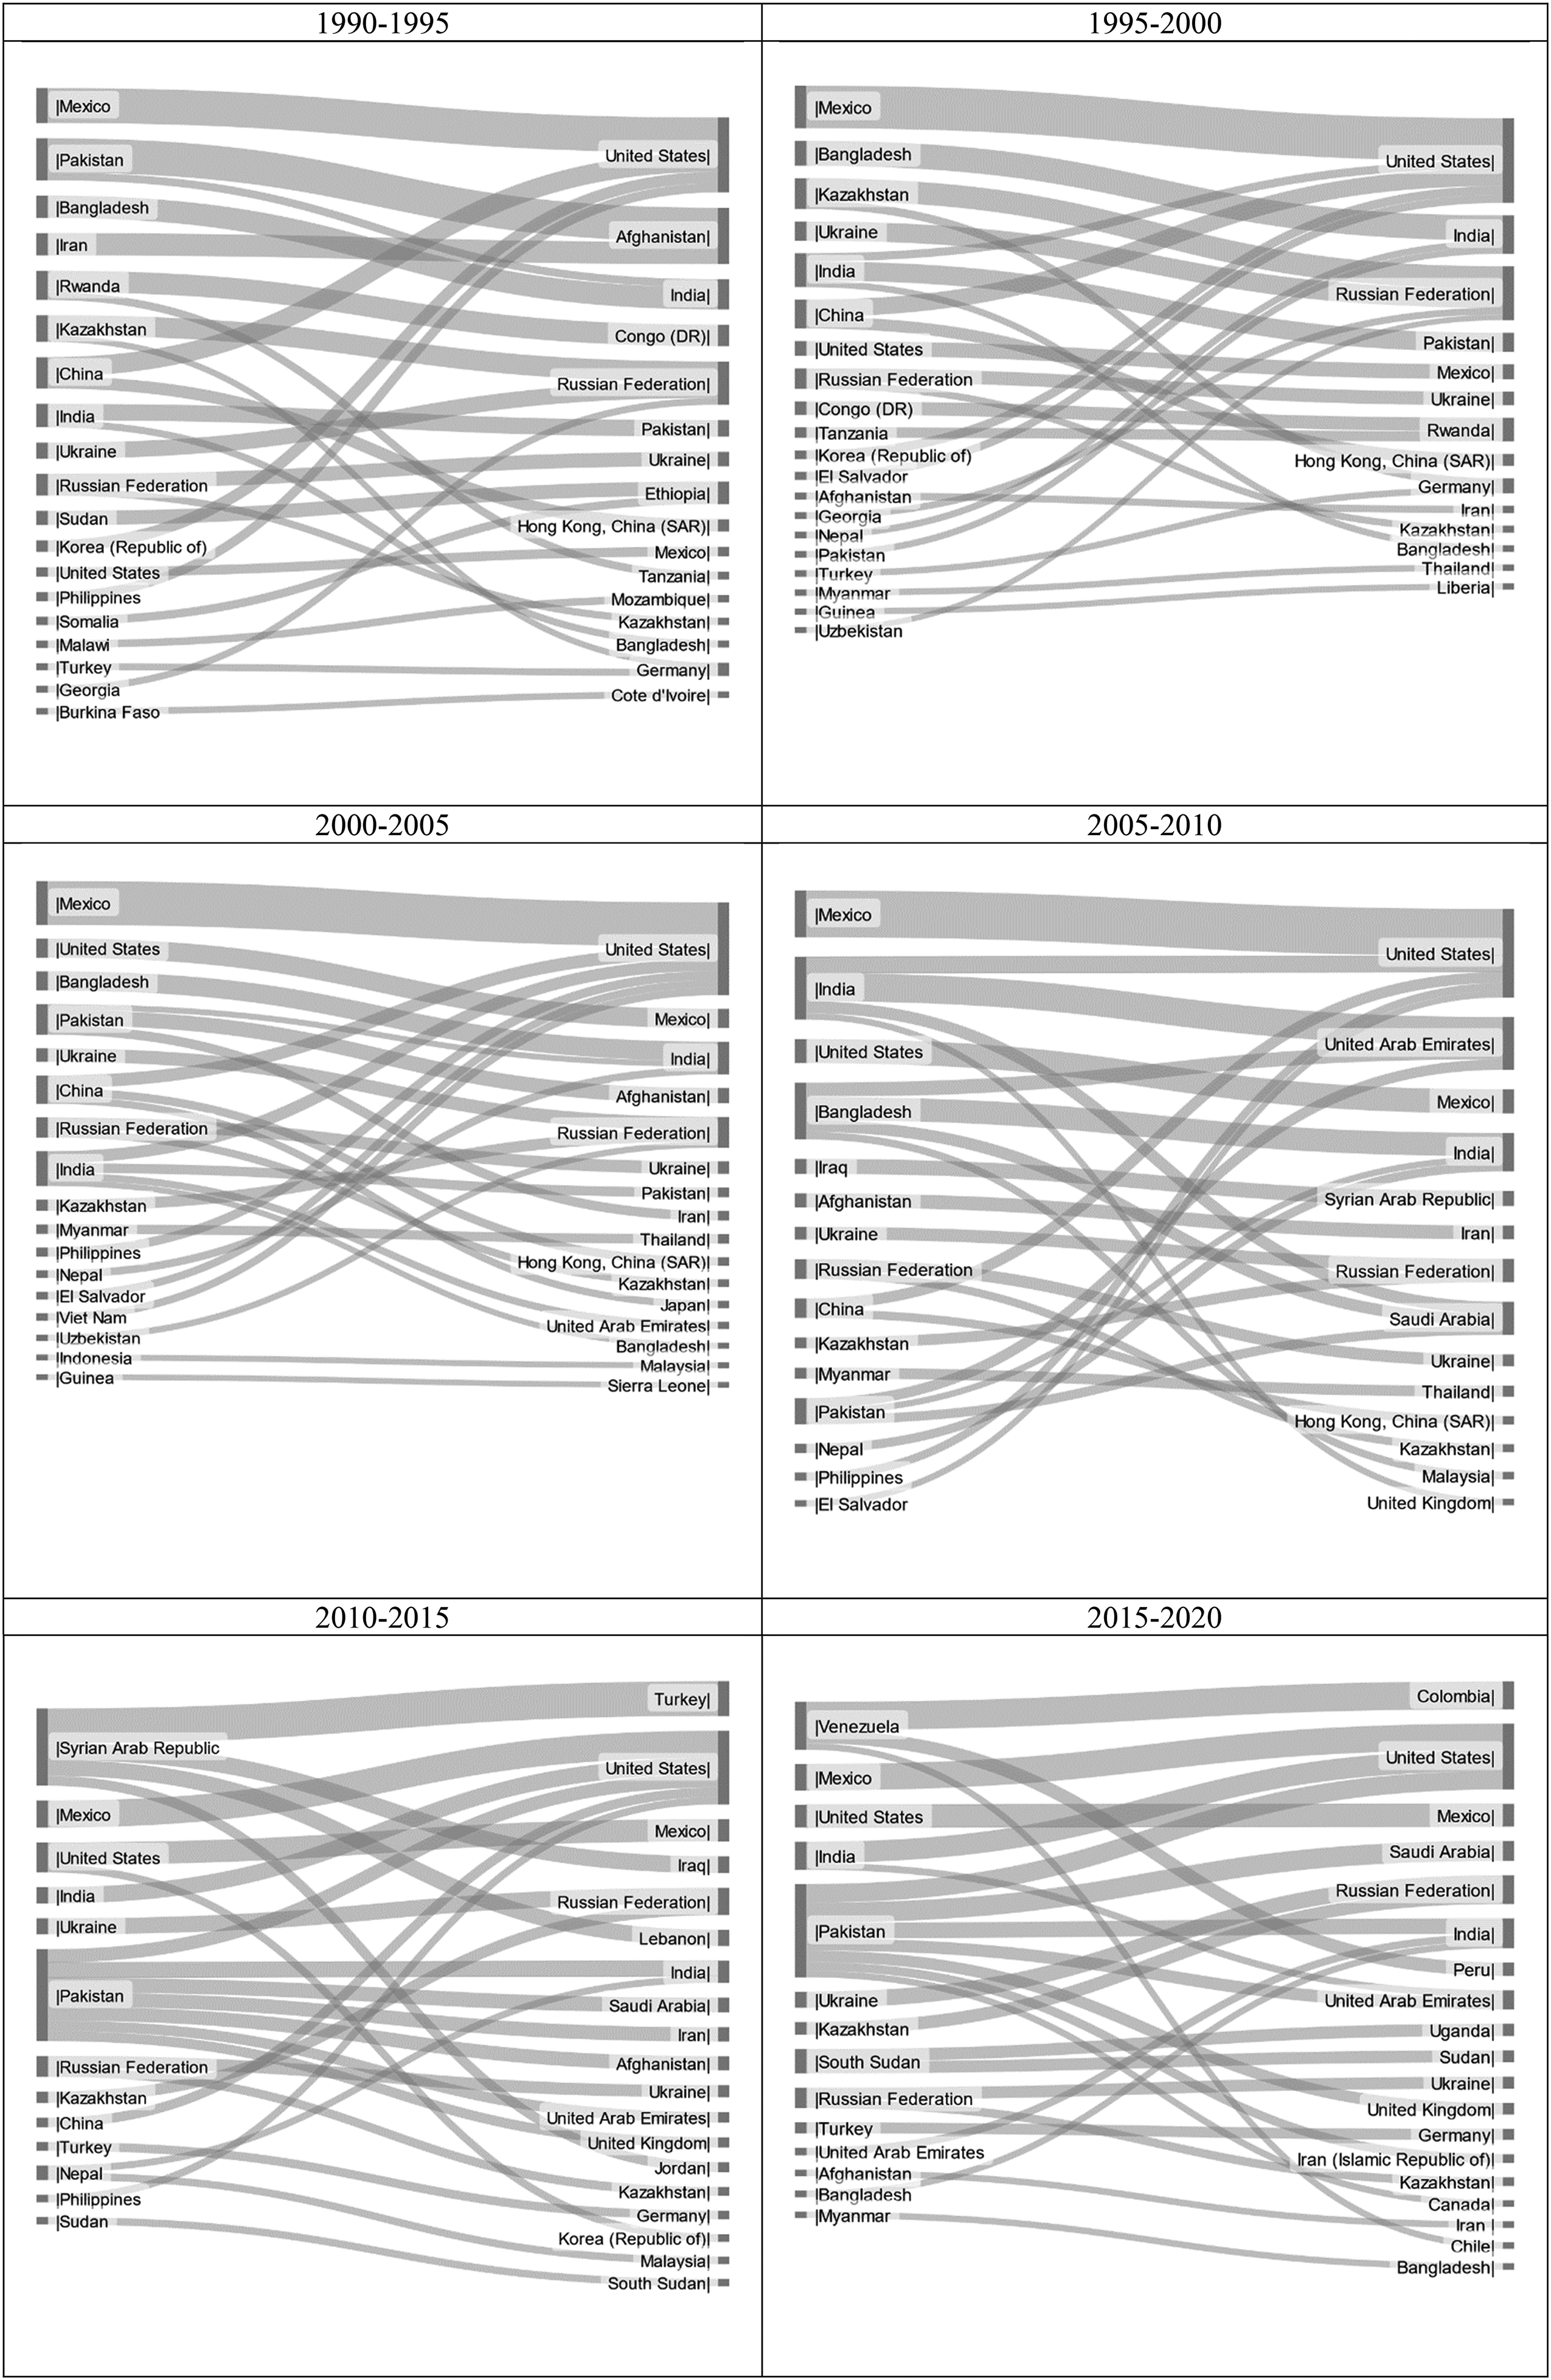
Top 25 origin-destination flows, 1990–1995, 1995–2000, 2000–2005, 2005–2010, 2010–2015, and 2015 to 2020. Source: Authors’ calculations based on Abel and Cohen (2019) data.
Migration effectiveness, the degree to which flows are offset by counter flows, declined by almost a third between 1990 and 2020, from 40 percent in 1990–1995, to 28 percent in 2015–2020, thus migration is becoming less effective at redistributing the global population over time. In the early 1990s (Figure 3), high effectiveness coincided with the dissolution of the Soviet Union with large-scale repatriation of refugees and ethnic minorities to countries including Afghanistan, Germany, and the Russian Federation (Heleniak 2004). Global effectiveness declined in the period 1995–2005, with the United States, and China, the largest contributors. Spain emerged as an important driver of effectiveness in the period 2000–2005. Effectiveness temporarily increased in 2005–2010 as the UAE emerged as an important global destination. In 2010–2015, efficiency was supported by emigration from Pakistan and the Syrian Arab Republic. In the most recent period, flows from Pakistan and Venezuela were major drivers of effectiveness, however it remained below what was observed in the 1990s. Across all periods, the United States of America has been a major contributor to global effectiveness, peaking in 1995–2000, however, exchanges have become increasingly balanced over time. This is echoed at the global level, with an increasingly reciprocal system of migration flows.
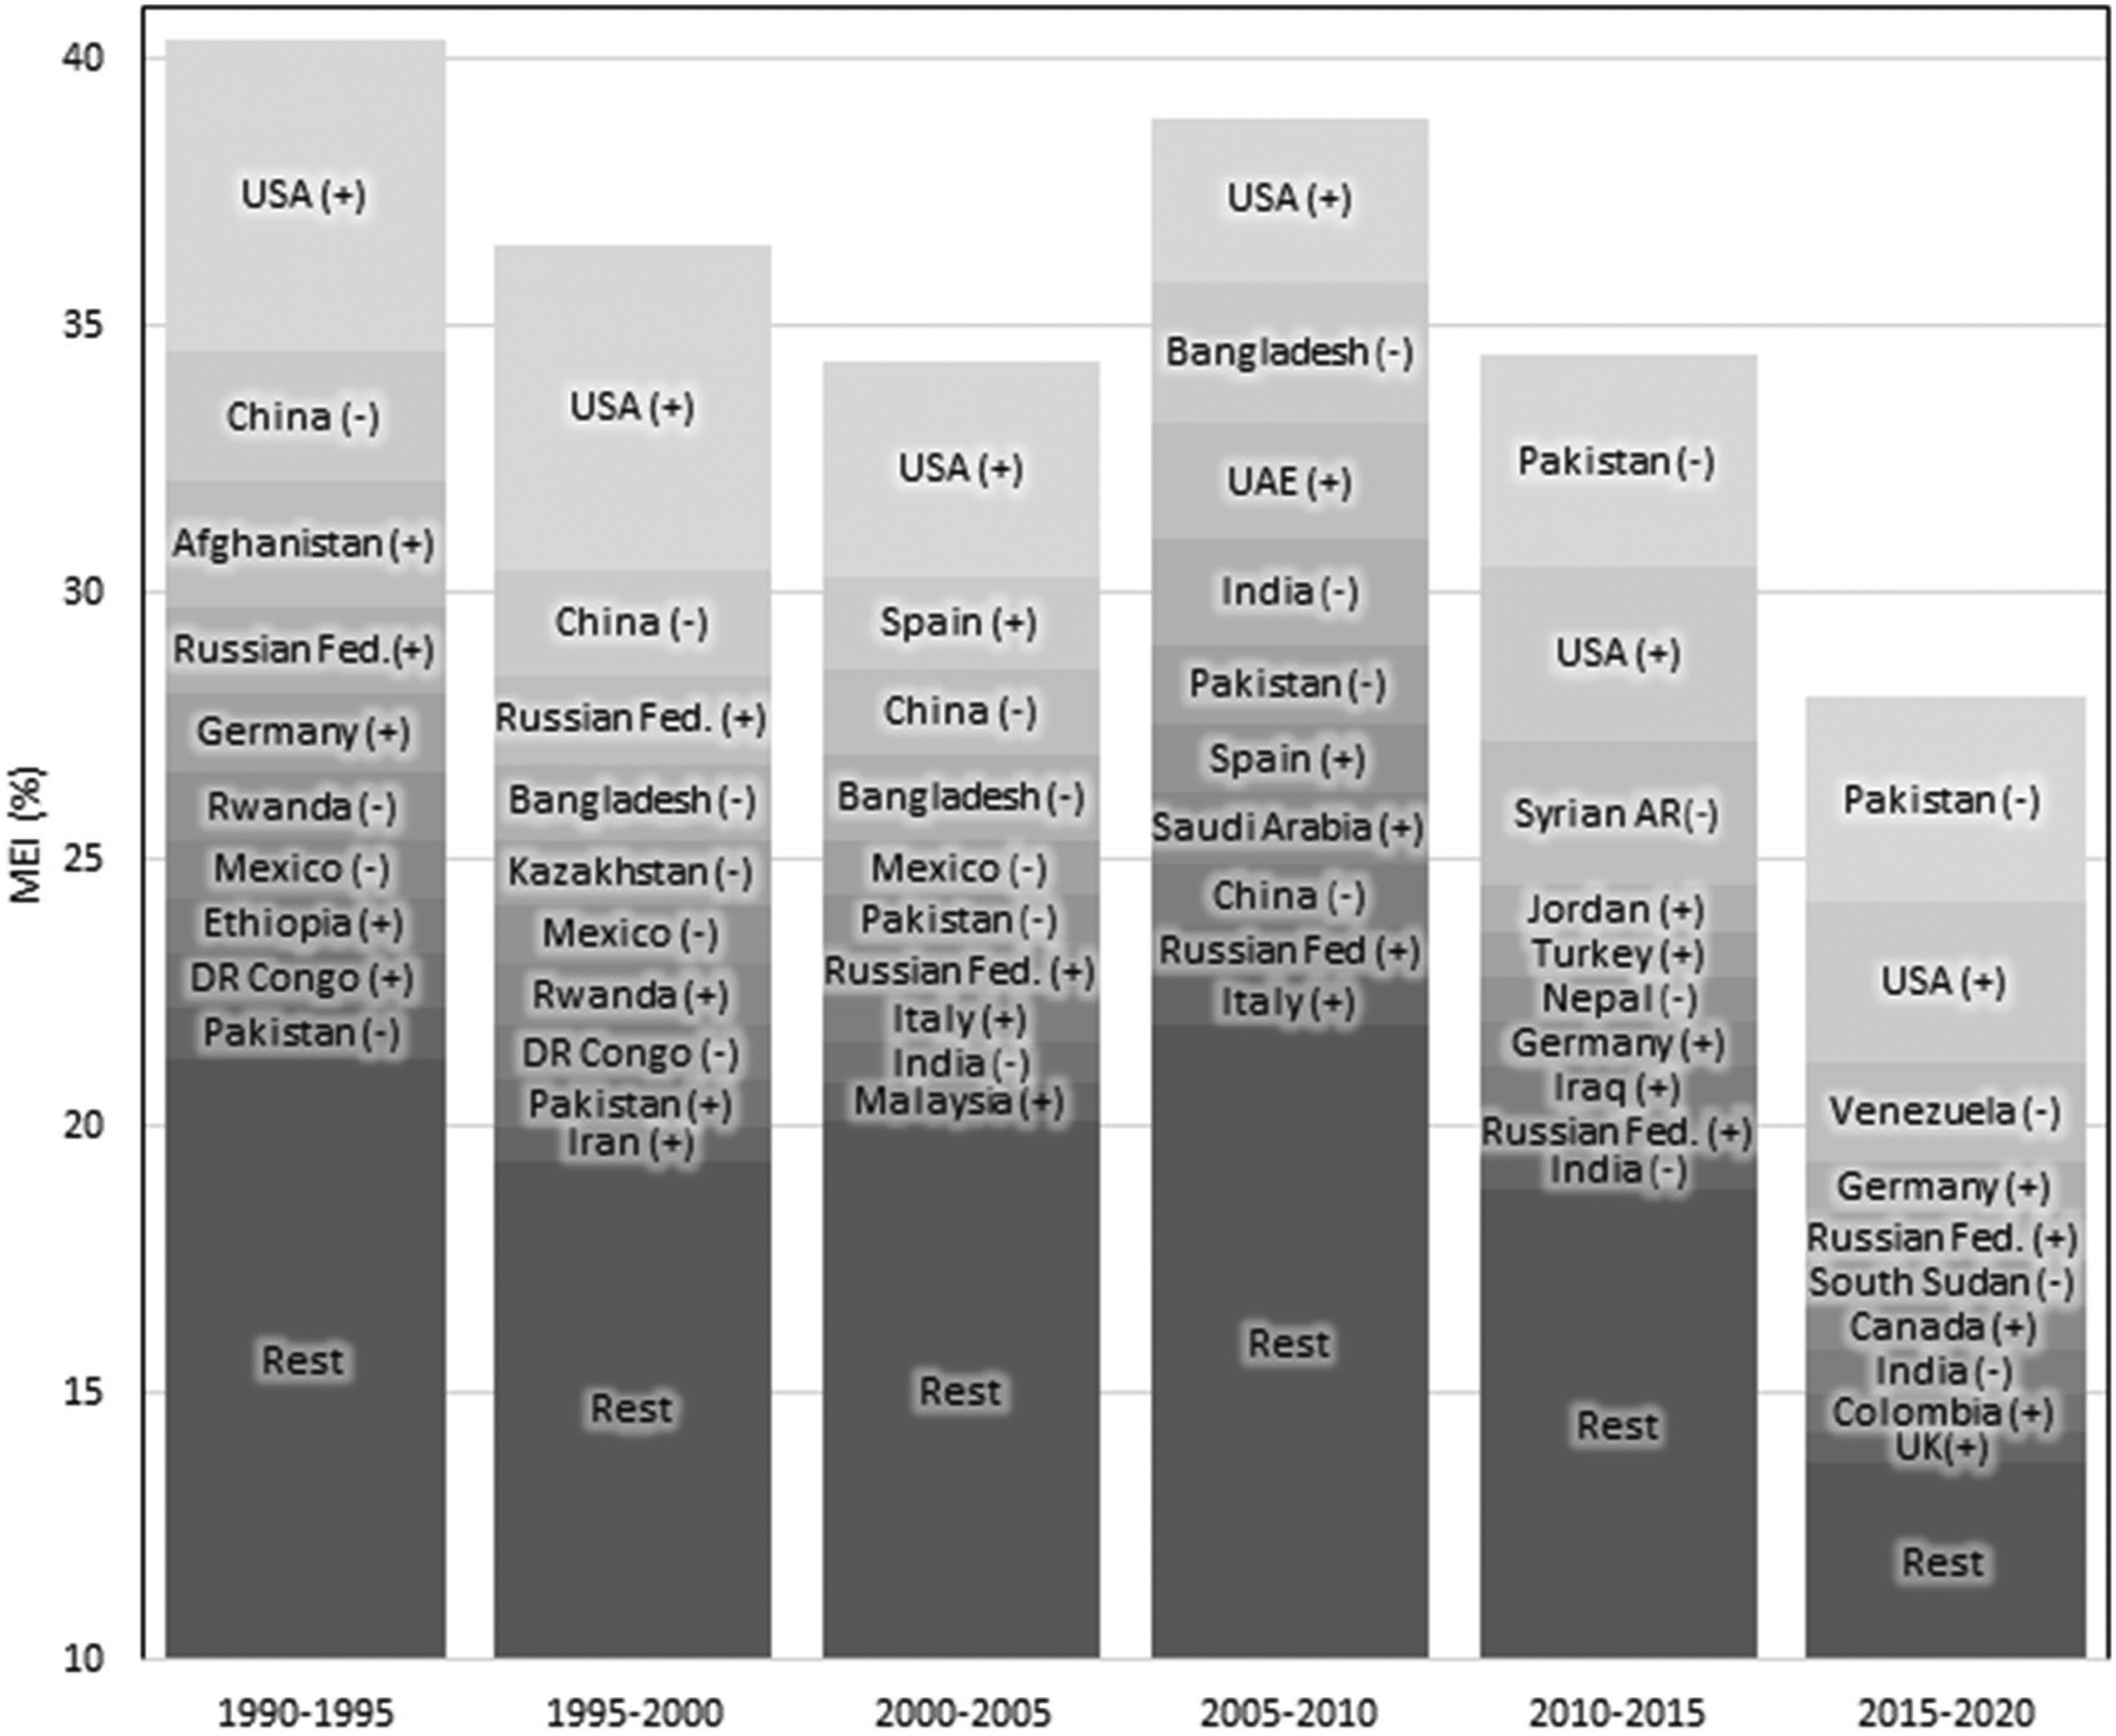
Country-specific contributions to global MEI, 1990–1995, 1995–2000, 2000–2005, 2005–2010, 2010–2015, 2015–2020 top ten countries. Source: Authors’ calculations based on Abel and Cohen (2019) data.
Stable migration intensity coupled with declining effectiveness has lessened the spatial impact of international migration over time. In other words, fewer people are being redistributed between countries by international migration. In the period 1990 to 1995, fully 0.56 percent of the global population (over 29 million people) was redistributed by international migration. This dropped to 0.43 percent in 1995–2000, reflecting a nadir in intensity matched by a decline in effectiveness. Impact subsequently rebounded due to an increase in intensity and effectiveness in 2005–2010, before declining due to declining effectiveness. The drop in impact in the latest period is a result of continued decline in effectiveness with 0.39 percent of the population being redistributed through international migration in 2015–2020 (28 million people). In 2015–2020 international migration had less of a global impact on population redistribution than it did three decades ago.
Migration Impact by Levels of Human Development
Global trends potentially obscure links between migration impact and development. To better examine this association, we calculate the CMI, MEI, and ANMR for subsystems of migration delineated according to the level of human development at origins and destinations in 2020. Development is a multidimensional concept which encompasses both economic and non-economic factors (King and Collyer 2016). To this end, we categorize countries using the Human Development Index (HDI), which combines life expectancy, education, and per capita income into a single summary measure. This is preferred to both the United Nations Department of Economic and Social Affairs regional classification of countries as More, Less, and Least Developed, which has been critiqued with respect to its use in migration scholarship (Ingleby, Singleton and Wickramage 2019) and World Bank Income groupings which are impacted by short-term fluctuations in exchange rates. HDI correlates strongly with other income-based measures of development (Klugman, Rodriguez and Choi 2011). Countries are classified as having a Low (<0.55), Medium (0.550–0.699); High (0.700–0.799) or Very High (>0.80) level of development based on their HDI score. Figure 4 shows the membership of each class.
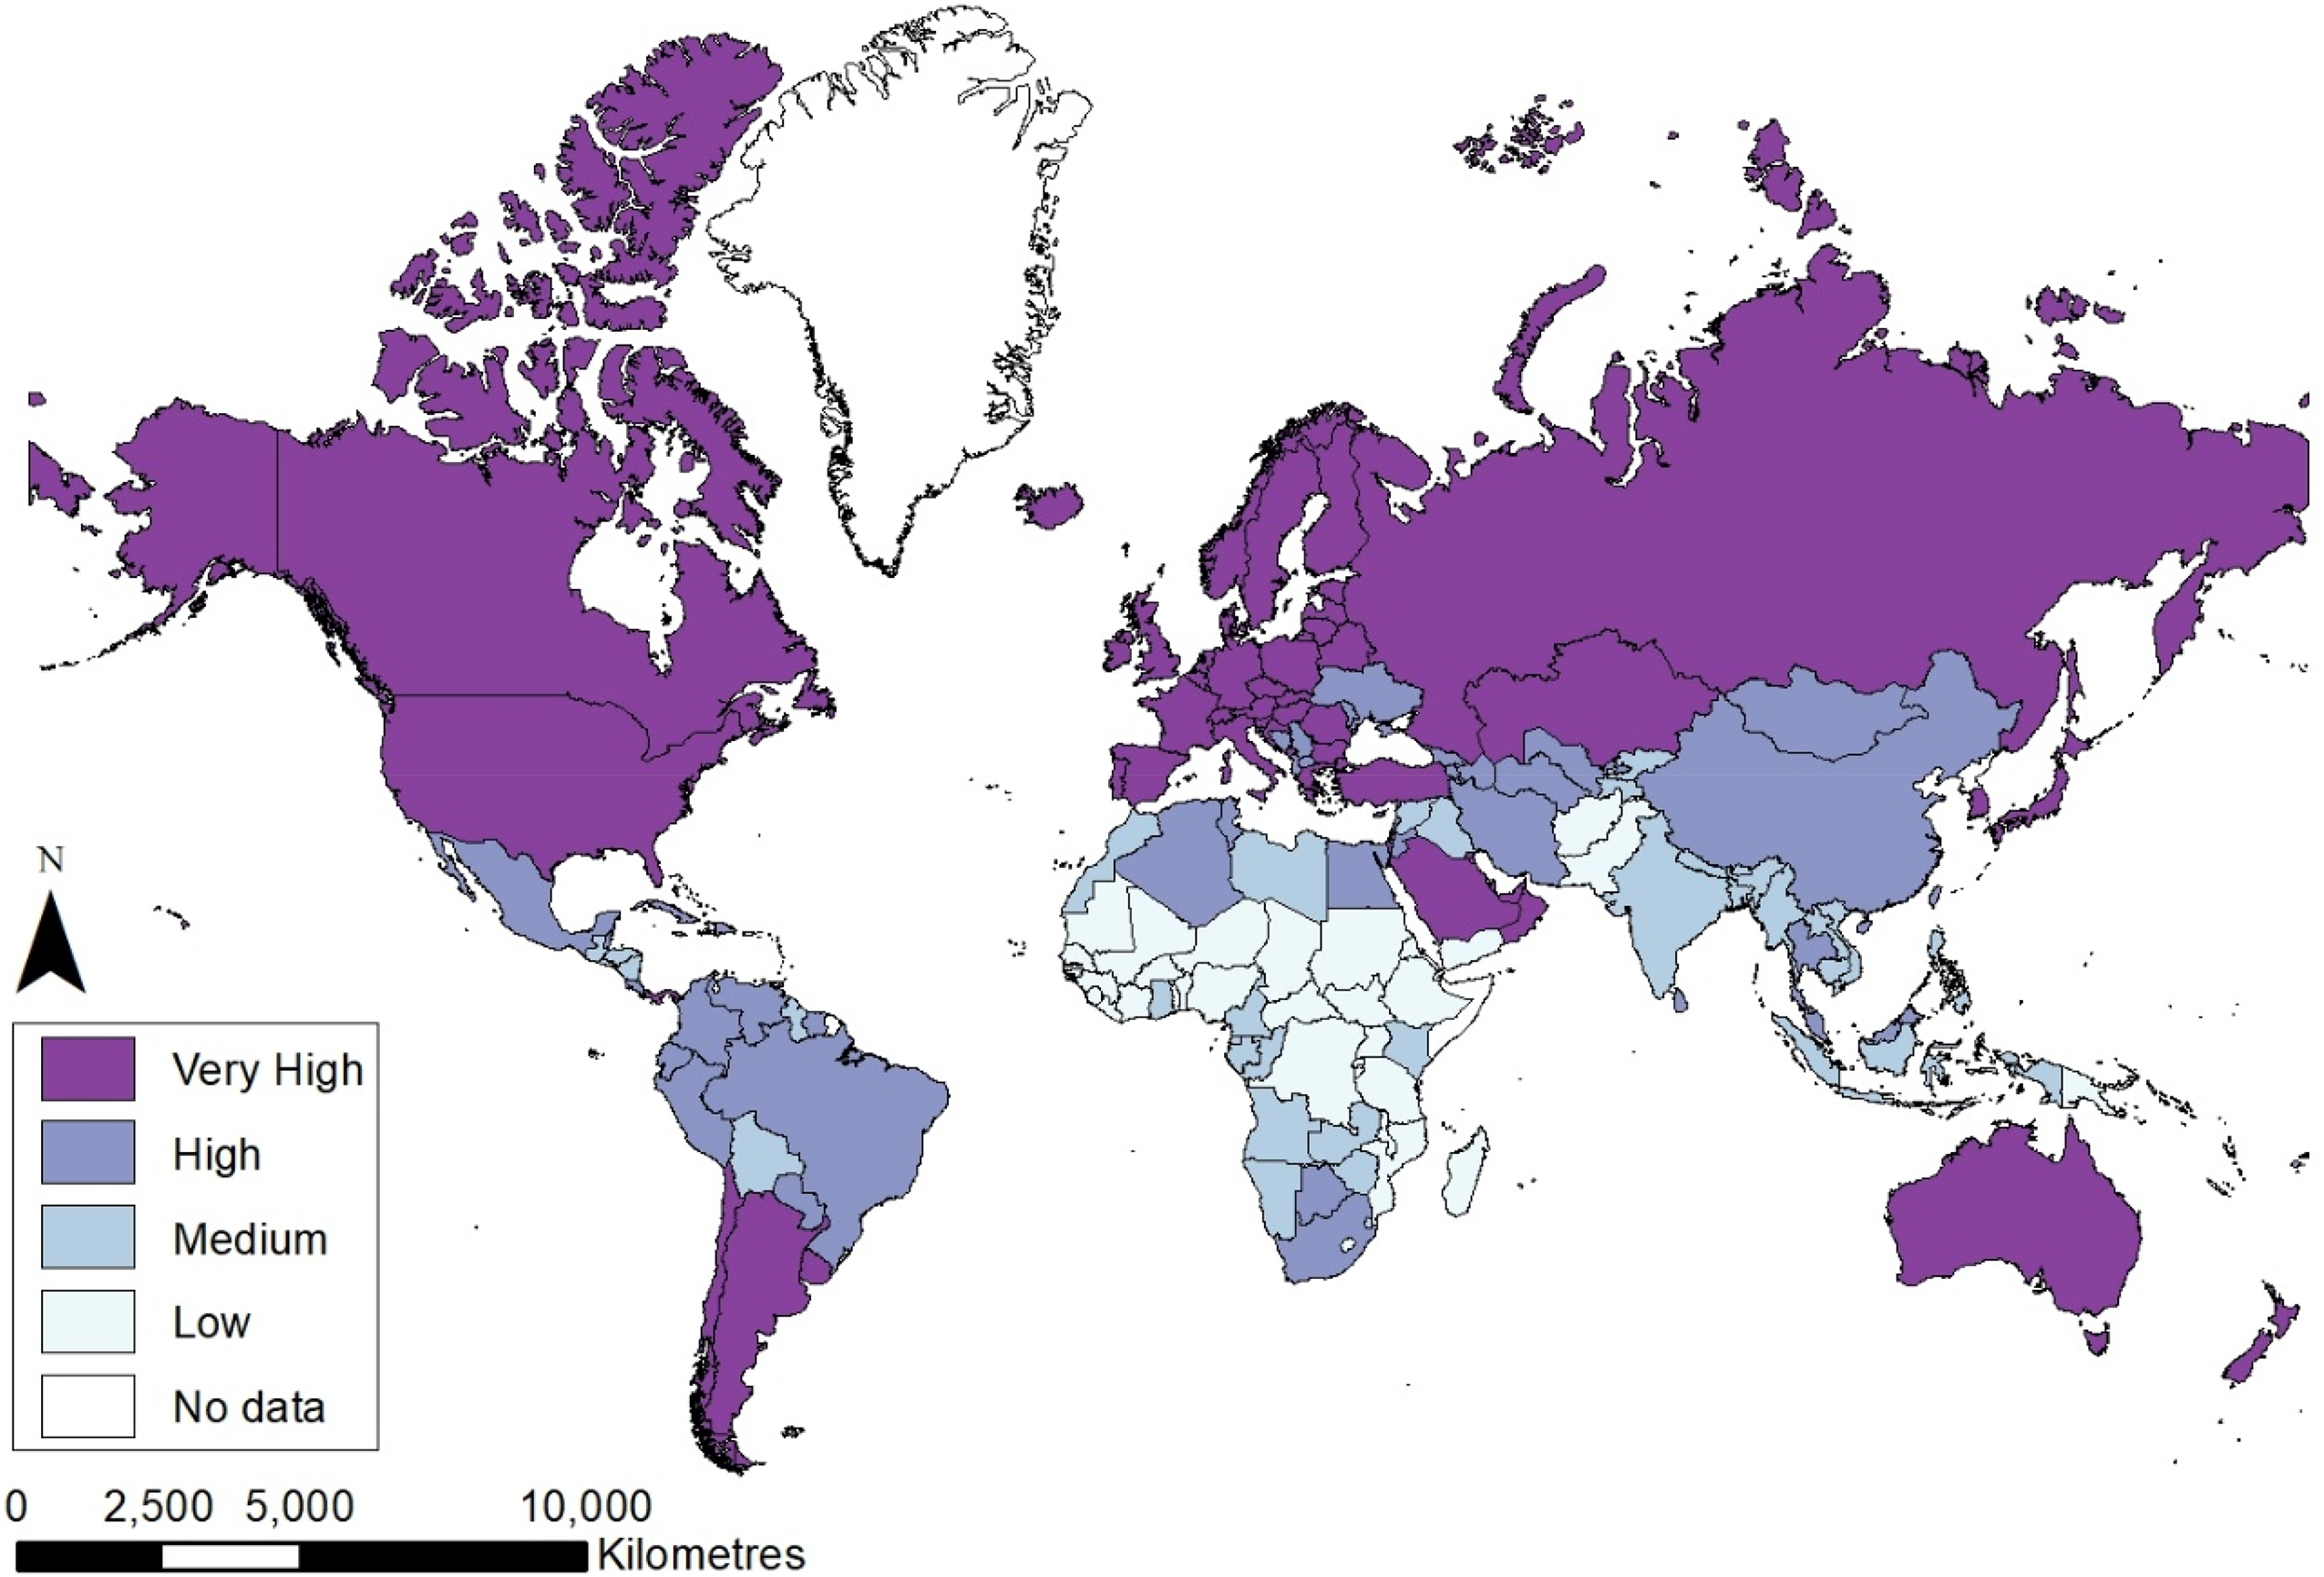
Level of human development based on HDI, 2020.
Figures 5 and 6 show the relative contributions of migration intensity (CMI) and effectiveness (MEI) to migration impact (ANMR) for ten distinct sub-systems of global migration during 2015–2020. These sub-systems comprise flows between countries within the same levels of human development (Low, Medium, High, and Very High) shown in Figure 5, and exchanges between countries at distinct levels of human development (Low and Medium, Low and High, Low and Very High, Medium and High, Medium and Very High, High and Very High) shown in Figure 6. The surface of the plots represents the ANMR, and the contour lines (0.1, 0.2, 0.3, and 0.4) link points of equal migration impact. The diagonal line represents points at which intensity and effectiveness contribute equally to impact based on the maximum intensity observed in the system.
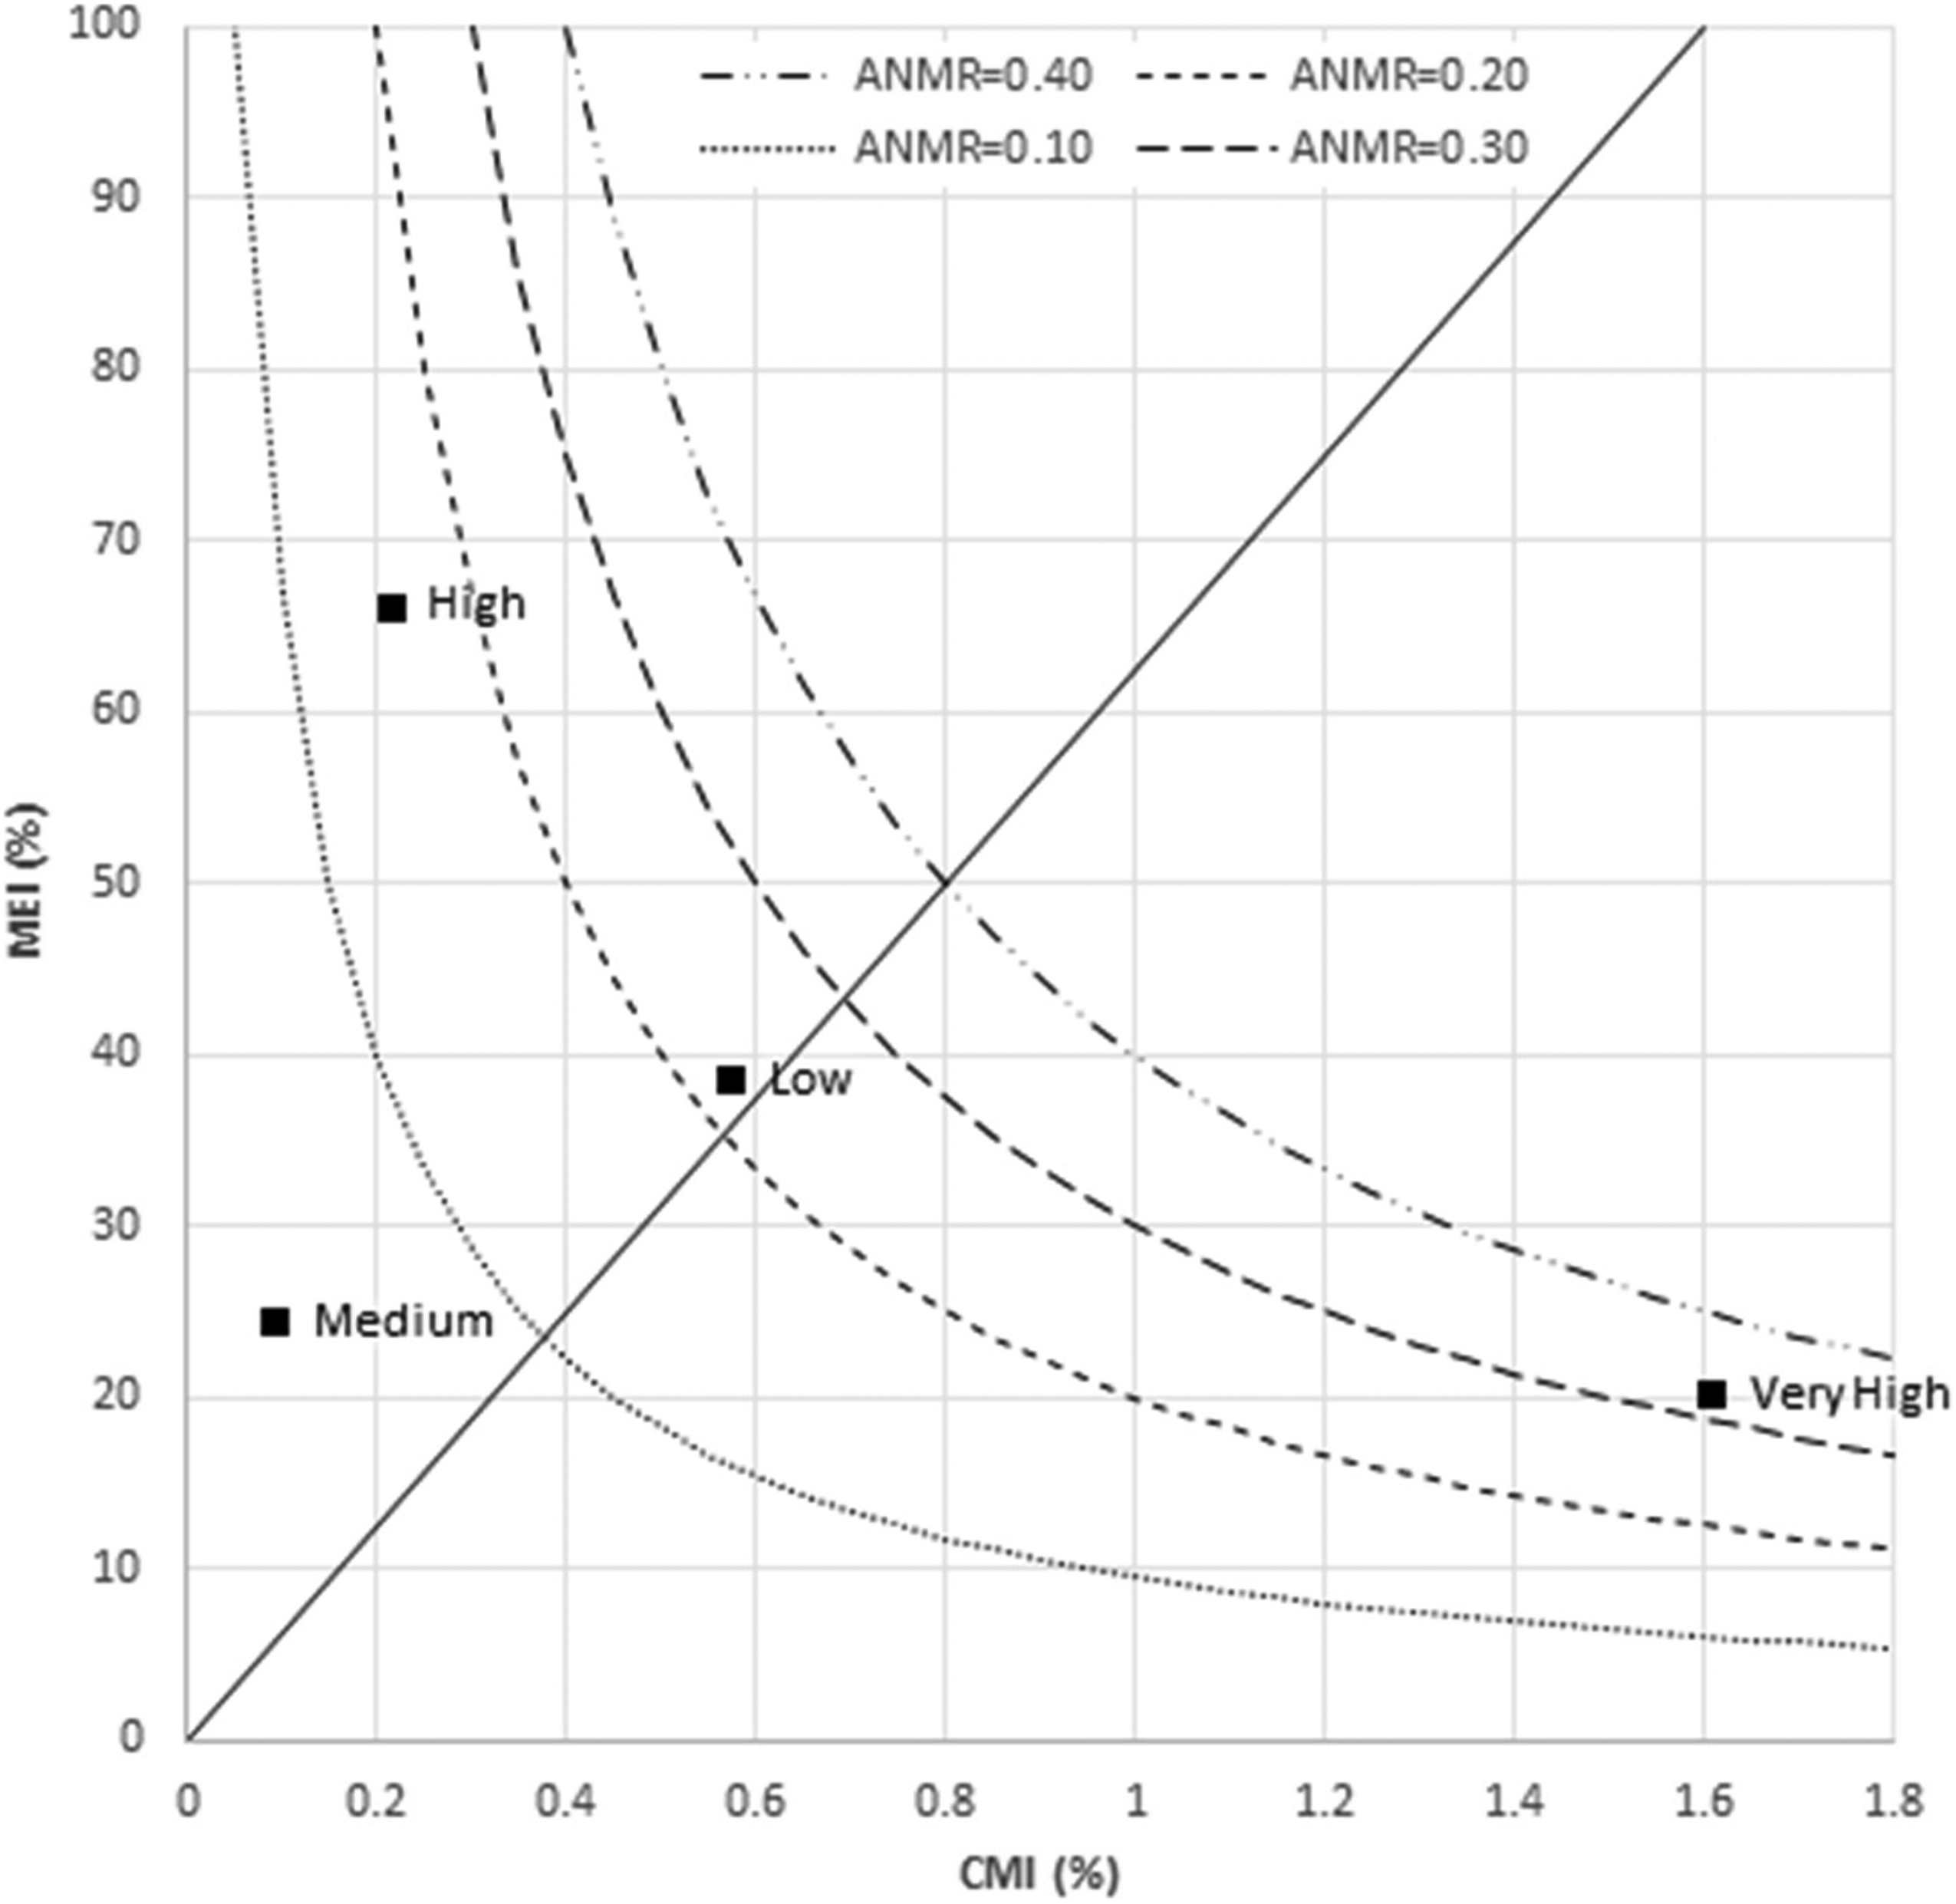
Average levels of migration intensity, effectiveness and impact for exchanges between countries at the same level of development, 2015–2020. Source: Authors’ calculations based on Abel and Cohen (2019) data.
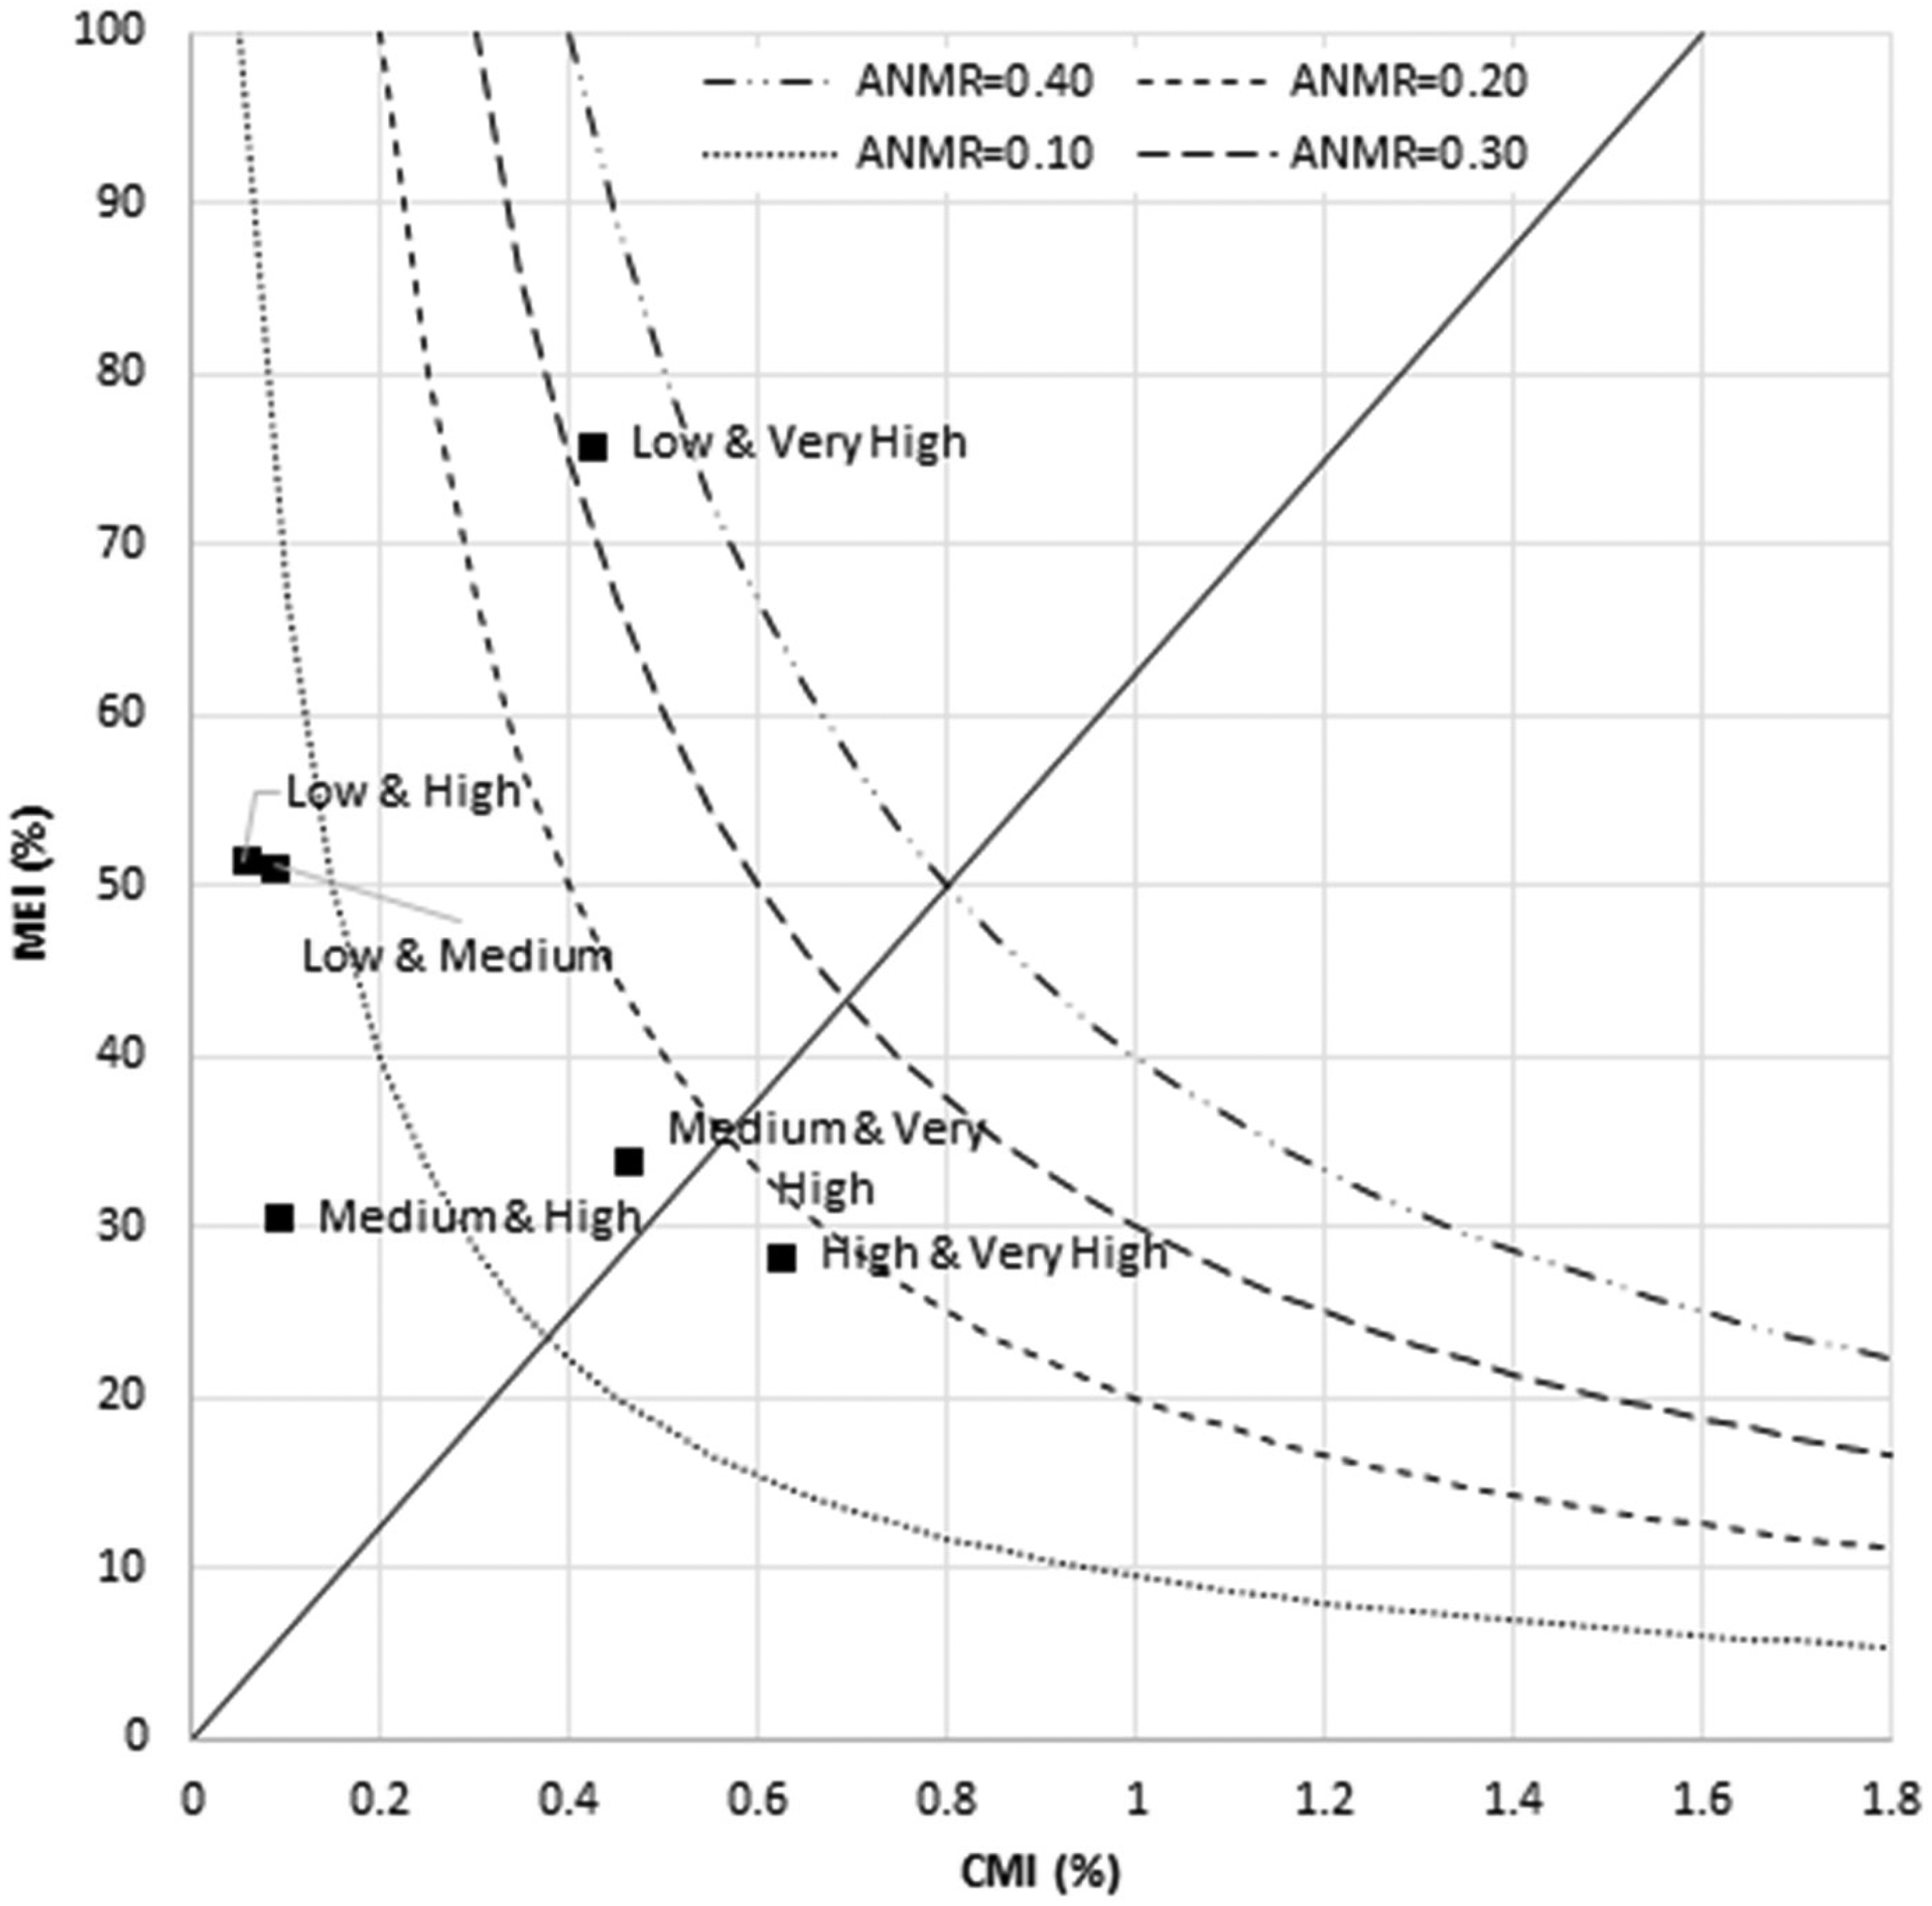
Migration intensity, effectiveness and impact for exchanges between countries at different levels of development, 1990–1995 to 2015–2020. Source: Authors’ calculations based on Abel and Cohen (2019) data.
From Figure 5, it is seen that the most substantial impacts for countries at the at the same levels of development are for exchanges between countries at Very High levels of development with 0.32 percent of the population redistributed between countries. Impact is driven by elevated levels of migration intensity (CMI = 1.6 percent), offset by low levels of migration effectiveness (MEI = 20 percent) (as indicated by the position in Figure 5). High intensity reflects increased capacity of residents in high income countries to move (de Haas 2020), lower barriers to international migration, for example between countries in the European Union and close geographic proximity of countries in this system, reducing the cost of migration. Although migration flows are relatively balanced across the system, several countries have highly asymmetrical flows, including the gulf states of Saudi Arabia, the United Arab Emirates, Qatar, and Oman.
The impact of migration is lower between countries at High levels of human development, with just 0.14 percent of the population redistributed between countries. This is around one-third that observed between countries at Very High levels of development, with just 0.57 percent of population moving in the five years 2015–2020. What accounts for this low intensity? High income, at least in global terms increases the capacity to move but this is not reflected in overall intensity. Explanations include the lack of economic gains to migrants moving between countries at this level of development and the geographic separation of many countries in this grouping increasing the distance-cost of migration. Notwithstanding, migration is highly effective with 67 people redistributed for every 100 people moving between countries in this sub-system. This may be a short-term effect, however, with effectiveness in this period driven by large refugee flows emanating from Venezuela.
Migration between countries at Medium levels of human development has little distributional impact, with just 0.09 percent of the population redistributed between countries in this sub-system. Both intensity (0.14 percent) and effectiveness (MEI = 24 percent) are low, however it is the later that contributes most to overall impact. Explanation may again be sort by reference to economic and geographic factors including the lack of economic gains of migration relative to the cost of moving. Migration flows between countries at Low levels of development have the second largest overall impact for flows within the same level of development, with 0.22 percent of the population redistributed between 2015 and 2020. Intensity is much lower (CMI = 0.57 percent) than observed between countries at Very High levels of development, but higher than observed for other subsystems. This may be partly explained by the geographic concentration of countries in sub-Saharan Africa, increasing interactions between countries, as well as the artificial nature of many national borders (Adepoju 1998). It also reflects high volumes of refugee flows: almost a third of flows in this system originate from South Sudan, with Sudan and Uganda the major recipients. Overall impact is boosted by effectiveness (MEI = 38 percent), with this reflecting the unidirectionality of refugee flows during this period.
Impact between countries at distinct levels of development (Figure 6) varied between 0.02 percent for flows between countries at Low and High, and Medium and High levels of development, to 0.32 percent between countries at Low and Very High levels of development. Flows between countries at High and Very High levels of development redistributed 0.18 percent of the population while flows between countries at Medium and Very High levels of development and countries redistributed 0.16 percent. For flows across the development hierarchy, impact is mostly driven by effectiveness, and this is most acute when the development gradient is steepest. Flows between countries at Low and Very High levels of development redistributed 0.32 percent of the population between 2015 and 2020 driven by extremely high of effectiveness (MEI = 76 percent). This asymmetry was underpinned by significant outflows from Pakistan to the Gulf States (e.g., Saudi Arabia, UAE). Inflows to a select group of receiving countries including the United States, the United Kingdom and Canada also contributed to the significant imbalance in migrant flows. Effectiveness is also the main driver of impact for flows between Low and High and Low and Medium levels of development.
By contrast, intensity tends to increase as the overall level of development in the system rises, likely due to the increased capacity of residents to move. The highest intensities are observed for flows between countries at High and Very High levels of development, and in contrast to all other groupings, intensity is the principal driver of migration impact.
Conclusion
International migration is set to be an important driver of global population redistribution far into the 21st century leading to both fast demographic change (Billari 2022), but also sustained redistribution of the global population over time. Through this lens, this research note has sought to quantify the overall impact of international migration on the global population distribution across development levels. Impact is defined as the percentage of the population redistributed in a five-year period and is a function of both the overall intensity, and the effectiveness, of migration. The global impact of international migration has declined since the 1990s. This decrease has been primarily driven by an overall decline in migration effectiveness over the study period, as flows have become more balanced. At the global level, the changes wrought by international migration have been gradual or “slow.” The decline in impact is not, however, felt uniformly across the globe due to differences in the intensity and effectiveness of migration at different development levels. Our results revealed that migration impact is greatest between countries at Very High levels of development and between countries at Low and Very High levels of development; however, the mechanisms vary. At Very High levels of development, migration impact is driven by high intensity. There are several factors likely contributing to this including the greater capacity of individuals to migrate and lower barriers to mobility. High migration intensity at later stages of development was foreshadowed in Zelinsky's (1971) hypothesis of the mobility transition which posited vigorous accelerating circulation in advanced societies. The presence of significant circulation is supported by the decline in effectiveness among countries at Very High levels of development due to increased reciprocity of flows. Following Zelinsky (1971), high intensity may not persist over time as communication systems increasingly substitute for migration, however, this has not yet been observed.
For migration between countries at different development levels, impact is driven by high effectiveness, most marked when the development gap is greatest (i.e., migration exchanges between countries with Low and Very High levels of development). This asymmetry declines as conditions at origins and destinations come into balance but is again offset by increasing intensities as conditions at origins improve. The upshot is that although impact has declined in recent decades, migration will continue to impact global population distribution in the short to medium term, driven initially by asymmetry of flows and later by increasing intensity as the capacity of populations to migrate increases. If these secular trends materialize, it suggests that international migration too can be thought of as part of the slow demographic paradigm, despite the ability of migration to drive fast demographic change at the national and subnational levels.
The importance of bilateral estimates of international migration flows to understanding global migration cannot be underestimated. In contrast to internal migration, where origin-destination matrices have long been available, the lack of data has inhibited our understanding of this volume, patterns, and impact of international movements. Critically, they also limited our ability to examine migration subsystems that can shed light on future migration processes. The availability of interval-based origin-destination flow data for migration opens new research avenues, including the application of a suite of tools and metrics developed in the field of internal migration research.
More broadly, widespread availability of international migration data presents opportunities for cross-fertilization of techniques between researchers studying international and internal migration, something that has been pursued by several scholars in recent decades (King and Skeldon 2010). As data continues to improve, we can look forward to an increasingly integrated account of global movements, both internal and international, and temporary and permanent, and gain richer insights. We may also look to finer grained data that captures the redistribution impact of migration at the sub-national level, particularly urban areas, where the impact of migration is most acute. There are also opportunities to better integrate research into the impacts of migration compared with other components of demographic change, namely fertility and mortality as well as shifts in age structure to global changes in population distribution.
Footnotes
Declaration of Conflicting Interests
The author(s) declared no potential conflicts of interest with respect to the research, authorship, and/or publication of this article.
Funding
The author(s) disclosed receipt of the following financial support for the research, authorship, and/or publication of this article: This research was funded by the Australian Government through the Australian Research Council (www.arc.gov.au) Discovery Project scheme, DP200102367. The funders had no role in study design, data collection and analysis, decision to publish, or preparation of the manuscript.