
Abstract
Quantifying undocumented populations is a persistent challenge globally. A shortage of reliable estimates limits analysis of unauthorized migrations, effective policy responses, and measures to counter anecdote-fueled immigration debates. Malaysia exemplifies the struggles of geographically exposed and institutionally constrained countries attempting to manage undocumented migration through policies based on limited data and little evaluation. To provide time series data enabling migration policy analysis and to contribute an innovative methodological approach, this article estimated Malaysia's undocumented population since 1963 by modeling the relationship between rice consumption per capita and economic development. The modeled relationship, together with known rice consumption patterns, implies an undocumented population of 2.6–2.75 million in 1963 and 6.28–8.24 million in 2017. These findings suggest that existing unauthorized migration estimation methods produce significant undercounts and that Malaysia's hidden population is much larger than believed. They also demonstrate the potential for consumption-based methods to address undocumented population data gaps globally.
Introduction
“Undocumented,” “unofficial,” “unauthorized,” “irregular,” or “illegal” migration is a definitionally contentious and statistically fraught concept that generally captures persons whose entry, residence, or employment outside their native country occurred or is occurring outside the regulatory norms of the sending and/or receiving country (usually the latter) (IOM 2022). That is, these definitions seek to identify people who are in a country without full legal status, including those who crossed an international border without appropriate authorization and those who entered legally but whose authorization is no longer valid. Undocumented migrants are often demonized by governments as a threat to sovereignty and migration policy legitimacy and included among the most vulnerable populations by non-government organizations, due to their limited rights and access to essential services (IOM 2019).
Capturing migration activity occurring outside national regulatory systems is inherently challenging, as undocumented migrants purposefully evade official data collections and interactions with government more generally (IOM Global Migration Data Analysis Centre 2020). Attempts to quantify undocumented migrants must, nonetheless, bear some relationship to official collections to provide a lawful population baseline, which, in turn, influences the definitional choice of the group being estimated. For methodological reasons that will become clear later, this article defines and counts undocumented persons as those outside the census population. For countries with a relatively robust census methodology, the overwhelming majority of the non-census population would be undocumented migrants but may also include natives and legal migrants not participating in the census survey. 1
Leading global estimates of undocumented migrants take one of two broad methodological approaches derived from official or institutional interactions. One approach reports or extrapolates from revealed migrant identifications, including enforcement activity detections, voluntary regularization programs, border entry rejections, visa overstays, or registrations with refugee/asylum bodies (Vespe, Natale, and Pappalardo 2017; IOM Global Migration Data Analysis Centre 2020). The second, or residual, approach estimates the lawful (or documented) migrant population and subtracts this estimate from the total non-citizen population recorded in population surveys or censuses. Within this approach are different methods for calculating the lawful population and accounting for census errors, including taking evidence from other surveys or assigning legal status using other administrative data (e.g., Passel 2019; Borjas 2017; Spence et al. 2020). This approach has significant microdata requirements and assumes that the population survey largely captures, but does not separately identify, undocumented migrants and that sampling errors can be adjusted for ex-post (World Bank 2019b).
Both approaches have serious limitations, particularly when applied to emerging destination countries with greater data constraints. Revealed undocumented migrant estimates lack credibility, both methodologically (capturing an unknowable share of the undocumented population that is a direct function of official interactions) and politically (subject to manipulation). Residual estimates are more robust but similarly anchored to official surveys and data that, even where available, reliable, and reflecting best practice, are biased toward underestimation.
This article offers an innovative approach to estimating the stock of undocumented persons 2 — the overwhelming majority of whom are migrants — across time for a major receiving country, Malaysia. The approach offered here effectively reverses the residual approach's assumption, treating the census population as exclusive of undocumented persons and subtracting it from a total population estimate derived empirically from consumption patterns. It does so by estimating the relationship between rice consumption (as food) per capita (hereafter “RCPC”) and economic development, using five countries for which rice is a staple food, for which per capita estimates are trivially affected by total migration, and which together mirror Malaysia's economic development levels from 1963-2017. The implied surplus of actual rice consumption over that predicted by Malaysia's development level is, then, converted into undocumented population estimates, using plausible alternative assumptions for undocumented persons’ RCPC. Put simply, if more rice is being consumed in Malaysia than its development level and RCPC patterns imply, that excess rice consumption represents the undocumented population stock.
The results suggest that Malaysia's undocumented population was around 2.6–2.75 million in 1963 and 6.28–8.24 million in 2017. The 2017 estimates equate to 17–21 percent of Malaysia's total population, with the beginning and end periods representing population share peaks and 1988 the period low at 11–13.5 percent. Year-on-year stock variations (net additions or subtractions) were generally less than 250,000 persons but reached upwards of 750,000 in the context of major economic, political, or policy shifts. The estimates’ size and variability are high, relative to previous attempts (e.g., Lee and Leng 2018), but appear plausible, given the underestimation biases of traditional approaches, the estimation of all persons not just workers, and accordance with Malaysia's migration and economic history.
While a within-country methodological comparison is not possible, given data constraints, the results suggest that revealed and residual estimation methods underestimate undocumented migration. Undocumented migration in Malaysia appears to have been more prevalent and dynamic than previously understood, and long-standing government efforts to reduce irregularity (including through enhanced border controls, stricter penalties, regularizations, and amnesties) have had limited success. This article's longitudinal estimates provide data to better evaluate migration determinants and policies in Malaysia (and Thailand, which is included as a robustness comparison), enabling analysis that has not been possible heretofore.
More broadly, this article offers an alternative methodology for estimating undocumented populations grounded in reputable and independent international data and less politicized national sources. Alternatives to national migration data are essential for estimations involving countries with less sophisticated data collections and concerns regarding the reliability and political independence of statistical institutions. This article's method also obviates the need for reconcilable microdata and supplementary population surveys that are available in few countries. While the specific model is not readily extendable to the more prominent destinations of the United States and Europe, it provides a replicable blueprint for similar consumption-based estimation approaches for countries across the development spectrum.
The next section situates this article within the literature on undocumented migration estimation, the Malaysian migration and census context, and rice consumption patterns. The third section details the methodology and data, and the fourth summarizes the results. The fifth and final section discusses the findings, potential explanations, applications, and limitations before summarizing the article's contribution and providing directions for future research.
Background
Quantifying Undocumented Migration
Undocumented migration, as defined in the introduction, is a major global concern subject to considerable multidisciplinary research interest (e.g., McAuliffe 2017; Jacobsen, Karlsen, and Khosravi 2020; Sanchez and Achilli 2020). Undocumented migrants are also a significant concern for leading non-government organizations that support vulnerable populations and for governments whose authority and credibility are threatened by a loss of regulatory control over unauthorized arrivals (e.g., IOM 2019; Jolly, Thomas, and Stanyer 2020). Despite significant stakeholder interest in undocumented migration, it remains a difficult phenomenon to quantify (IOM Data Analysis Centre 2020). Definitional differences and significant constraints on data supporting estimation mean that there are no global estimates of undocumented migrants. Data across countries and time are extremely limited and, in many cases, lack analytical rigor, and estimates are particularly limited outside of the United States and Europe (Black 2021).
Leading undocumented migrant estimations can be categorized into two methodological groups. The first represents what could be termed the revealed approach to estimation, which is based on undocumented persons’ reported interactions with institutions and extrapolations derived from these interactions. Institutional interactions come in different forms, including enforcement activities (workplace and housing raids, identification checks), voluntary regularizations and amnesties, border patrols, reconciliation of mismatching entry and exit data, and non-government organization registration data (asylum and refugee applications) (IOM Global Migration Data Analysis Centre 2020). For example, Malaysia's official estimations take the ratio of “illegal” immigrants to legal immigrants identified through targeted workplace inspections and extrapolates this ratio across the migrant population (Chan 2018), ignoring that targeted enforcements are not random population samples or singularly point-in-time (undertaken over a period of weeks or months in which migrants may be double counted). The European Commission (2021) reports statistics for refugees, asylum-seekers, and irregular border crossings, but these statistics miss those immigrants who enter legally or cross the border illegally and remain unidentified. Several other studies and the International Organization for Migration similarly provide estimates which measure revealed regulatory non-compliance more than undocumented migration (Massey and Capoferro 2004; Koser 2010; Vespe, Natale, and Pappalardo 2017; IOM Global Migration Data Analysis Centre 2020).
Other approaches fitting the revealed category rely on migrant registration and surveying and are often undertaken specific to sub-populations, such as trafficked persons or refugees (McAuliffe and Laczko 2016; McAuliffe, Weeks, and Koser 2017; Münstermann and van der Vorst 2017). Small-scale surveys of migrant communities also provide valuable firsthand information on localized populations and behaviors, but small sample sizes make them difficult to extend to national populations (Muniandy 2015 and Franck 2019 provide good examples for Malaysia).
The second, more sophisticated, residual approach has been popularized in the United States, where researchers take the population survey as capturing all resident non-citizens and use administrative data to identify authorized from unauthorized migrants (e.g., Passel 2019; Warren and Warren 2013). Estimates of lawful persons are typically required, due to difficulties reconciling data on residents and arrivals (Jasso and Rosenzweig 2020). As population surveys and administrative data are not perfectly reconcilable, migrants are assigned authorized status based on “logical imputation,” using their background characteristics, such as date of entry, citizenship status, and spouse, and official interactions, such as access to social security and government or licensed employment. A prominent example of logical imputation estimation is from Jeffrey Passel and the Pew Research Center, which subtracted algorithm-generated estimates of lawful immigrants in the United States from the total non-citizen population before adjusting for survey estimates of census undercounting (Passel 2019). Warren and Warren (2013) provide a summary and adaptation of similar early approaches, including Passel's pioneering estimates, while Borjas provides recent adaptations with labor market applications (Borjas and Cassidy 2019 ; Borjas 2017). The residual approach has also been extended to Europe (Connor and Passel 2019) and deployed for individual countries, including Spain (Gálvez-Iniesta 2020) and the United Kingdom (Jolly, Thomas, and Stanyer 2020). The logical imputation method has detractors, with comparisons against survey-based residual population estimates evidencing significant differences (Spence et al. 2020). Regardless of the specific method, however, residual approaches rely on the availability of detailed microdata and the belief that population survey coverage errors can be adjusted for.
The revealed and residual approaches each have limitations, with respect to both concept and application to other countries (Tapinos 1999). They are based on direct or assumed interactions with official actors, excluding the sizeable population of migrants (and their employers/supporters) that avoid local administrators and law enforcement. Revealed estimates extrapolated from enforcement activities suffer selection biases based on the convenience of activities and incentives for those undertaking them. Those collecting the data or undertaking enforcement activities may profit from manipulating the true numbers, as may politicians whose reputations and popularity could be discredited by unfavorable figures. Residual estimates assume that the population survey is inclusive of undocumented persons and/or that participation errors can be corrected through separate evidence of coverage gaps (e.g., Passel 2019). While beneficial, the correction adds an assumption that surveys of identified migrants are truthful and representative of the full undocumented population. Residual estimates have found support in reconciliations with regularization data (Gelatt, Fix, and Van Hook 2018), but both estimate and reconciliation courageously assume identified migrants are representative of the true undocumented population.
While the residual approach produces plausible estimates for the United States, the consequence of conceptual biases may be greater in countries with less robust statistical institutions. Replicating the residual approach involves assumptions and demands on data availability and reliability that are not easily met. Reliable estimates of the “authorized” migrant population are often impossible in developing countries, due to collection gaps, irreconcilable datasets, access constraints, and credibility concerns (IOM and McKinsey & Company 2018). An alternative approach is needed.
Improving undocumented migrant statistics is critical to better understanding migration and development policy effectiveness. Without meaningful data, policies for preventing, controlling, formalizing, integrating, or uplifting undocumented migrants are based on speculation and anecdotal effect (together with political motives), rather than rigorous evaluation. By not accounting for additional populations, development metrics such as gross domestic product per capita and inequality may misrepresent true outcomes. There is a clear and sizeable statistical void that must be filled to unlock insights into an important development area. This article contributes a novel estimation approach and estimates for a major host country, Malaysia, with supplementary estimates for Thailand.
Malaysia
Sitting at the geographic and economic heart of developing Southeast Asia, Malaysia has a long and challenging history with migration (Devadason and Chan 2014; Kaur 2015; Kassim 2017). Together with Singapore and Thailand, Malaysia is a major receiving country and central to the region's migration corridors (Walmsley, Aguiar, and Ahmed 2013). It has vast land and sea borders with less-developed and populous neighbors, including Indonesia, Thailand, and the Philippines, whose populations have sought opportunities in their relatively prosperous and stable neighbor through both formal and informal channels (Carruthers 2017; Kassim and Zin 2011). Malaysia also has difficulties combatting visa overstaying, which, alongside the expansion of source countries to other parts of Southeast Asia, South Asia, and China, has broadened the potential pool of unauthorized migrants (Low and Salwa Mokhtar 2017).
A former British colony, Malaysia gained political independence in 1957 but had large inflows of Chinese and Indian migrant labor that predate independence (Garcés-mascareñas 2008; Kassim 2014). Ethnic tensions have been ubiquitous since independence, with Malay-favoring positive discrimination policies in place since 1969 (Lee 2017). Another product of the colonial period, East Malaysia's boundaries contain a degree of arbitrariness in separating (at the time) quite similar and connected communities in Borneo (Eilenberg 2011). The communities that formed Malaysia and Indonesia more broadly share an intertwined history with essentially unrestricted people movements prior to colonization and nationhood (Kaur 2004). While Malaysia inherited much of the British administrative architecture, post-independence migration policy gaps meant that early migrants were undocumented by default (Kaur 2008; Chin 2016). Aside from Filipino arrivals in the early 1970s, the almost exclusively Indonesian immigrants in Malaysia raised few eyebrows prior to 1976, when their encroachment on urban centers, alongside an influx of Vietnam War refugees, brought greater attention to immigration (Kassim 1987).
It was not until 1984 that migration concerns in Malaysia spurred a bilateral agreement with Indonesia and guidelines around foreign worker employment (Kaur 2004). Supplementary measures included the first regularization and enforcement exercises seeking to formalize and deter illegal immigration, beginning what would become a frequently recurring cycle of regularizations and amnesties followed by raids, detention, and deportations (Kassim and Mat Zin 2011).
Amid continuing migration control concerns, a more comprehensive immigration policy approach followed in 1991–2 (Kassim 2014). Reforms mixed begrudging acceptance that Malaysia's booming economy temporarily needed migrant labor with a range of disincentives to both permanent hiring (including levies, red tape, short-term contracts, sectoral restrictions, and equal wages) and undocumented movements (further regularizations and enforcement activities). These reforms created a clearer distinction between authorized and unauthorized migration, albeit with limited incentives for migrants to participate in the formal system (Chin 2002; Kaur 2015).
The decades since have seen Malaysian migration policies shift through phases of regularization and crackdown, expansions in the allowable sectors and source countries for foreign workers, temporary hiring freezes, changes to levy rates and who pays, the introduction and periodic enforcement of punitive penalties, and frequent changes to the processes, conditions, and responsibilities surrounding migrant employment (Del Carpio et al. 2013; Devadason and Chan 2014; ILO 2016; Kassim 2017). Policy instability and stringency have imposed additional costs, afforded few rights, and provided little certainty for migrants and employers, many of whom opt or are forced out of the formal system. Informality is further enabled by regulator ineffectiveness and corruption (Franck 2019; Buang 2020). In all these ways, several factors have combined to leave Malaysia vulnerable to undocumented migration. Historical legacies, geographic vulnerability, and economic prosperity have combined to present migration policy challenges for Malaysia similar to those confounding migrant recipient countries globally (Angenendt 2008; Chamie 2020).
Efforts to reduce undocumented migration and de-politicize migration generally in Malaysia are impeded by data availability and reliability. There are, for example, very limited official immigration data prior to 1993, when work permits were introduced, and there are consistency and credibility concerns surrounding published foreign worker statistics (Lee and Leng 2018). Labor force survey results are inconsistent with permit data, and census data are more reliable but difficult to use, due to changing definitions of ethnicity and citizenship over time (Nagaraj et al. 2015).
Periodic definitional changes notwithstanding, Malaysia has a relatively robust census methodology inherited from British colonial administration and refined in modern times with reference to international best practice (Baffour, King, and Valente 2013; Kasim 2018). The census has experienced significant changes, including the unification of separate West and East Malaysian collections in 1970, the move from a dual to single stage, and a shift from a de facto to de jure approach (from place of interview to usual residence) in 1991 and from exclusively interview-based (household visits) to mixed methods (adding pick-up/drop off and online) in 2010 (Baharudin 2021). Inclusion criteria is all persons who had or intended to stay in Malaysia for six months of the census year (Department of Statistics Malaysia (DOSM) 2022). Estimates of census undercount range from around 7 percent prior to 1964 (Brown 1971) to 4 percent in 1970 (Hirschman 1983), and the aforementioned methodological improvements over time suggest undercount reductions since. Malaysia has undertaken post-enumeration or coverage surveys for each census since 1970, but counting errors are not routinely published (Kasim 2018). Comparison with similar countries further suggests an undercount in the 2 to 6 percent range typical of robust collections (Kukutai and Thompson 2015). That is, the census provides a reliable approximation of the official population.
Undocumented migrant numbers, by contrast, are not routinely estimated by Malaysian officials but arise occasionally in association with policy changes. Estimates by officials and scholars are based upon regularizations, deportations, amnesties, runaways, and other enforcement operations. Estimates from prominent Malaysian scholars follow an almost linearly decreasing pattern over time that is difficult to reconcile with anecdotal reports. 3 A notable exception to the decreasing pattern came in 2014, when the then Minister for Human Resources provided a 4.6 million figure for undocumented workers (against 2.1 million documented foreign workers), although there was little methodological transparency surrounding how this figure was generated (Low 2017). Available data on official foreign workers and undocumented persons in Malaysia are presented in Figure 1, although it must be stressed that the undocumented data points are not comparable across time but reflect different methodologies and, in some cases, multi-year averaging. Permit data here exclude the small share of “expatriate” workers and refugees. Unlike countries with additional migration categories, foreign workers in Malaysia almost exclusively represent the official non-expatriate migrant population (as citizenship, residency, and non-labor temporary migration are significantly restricted in Malaysia).
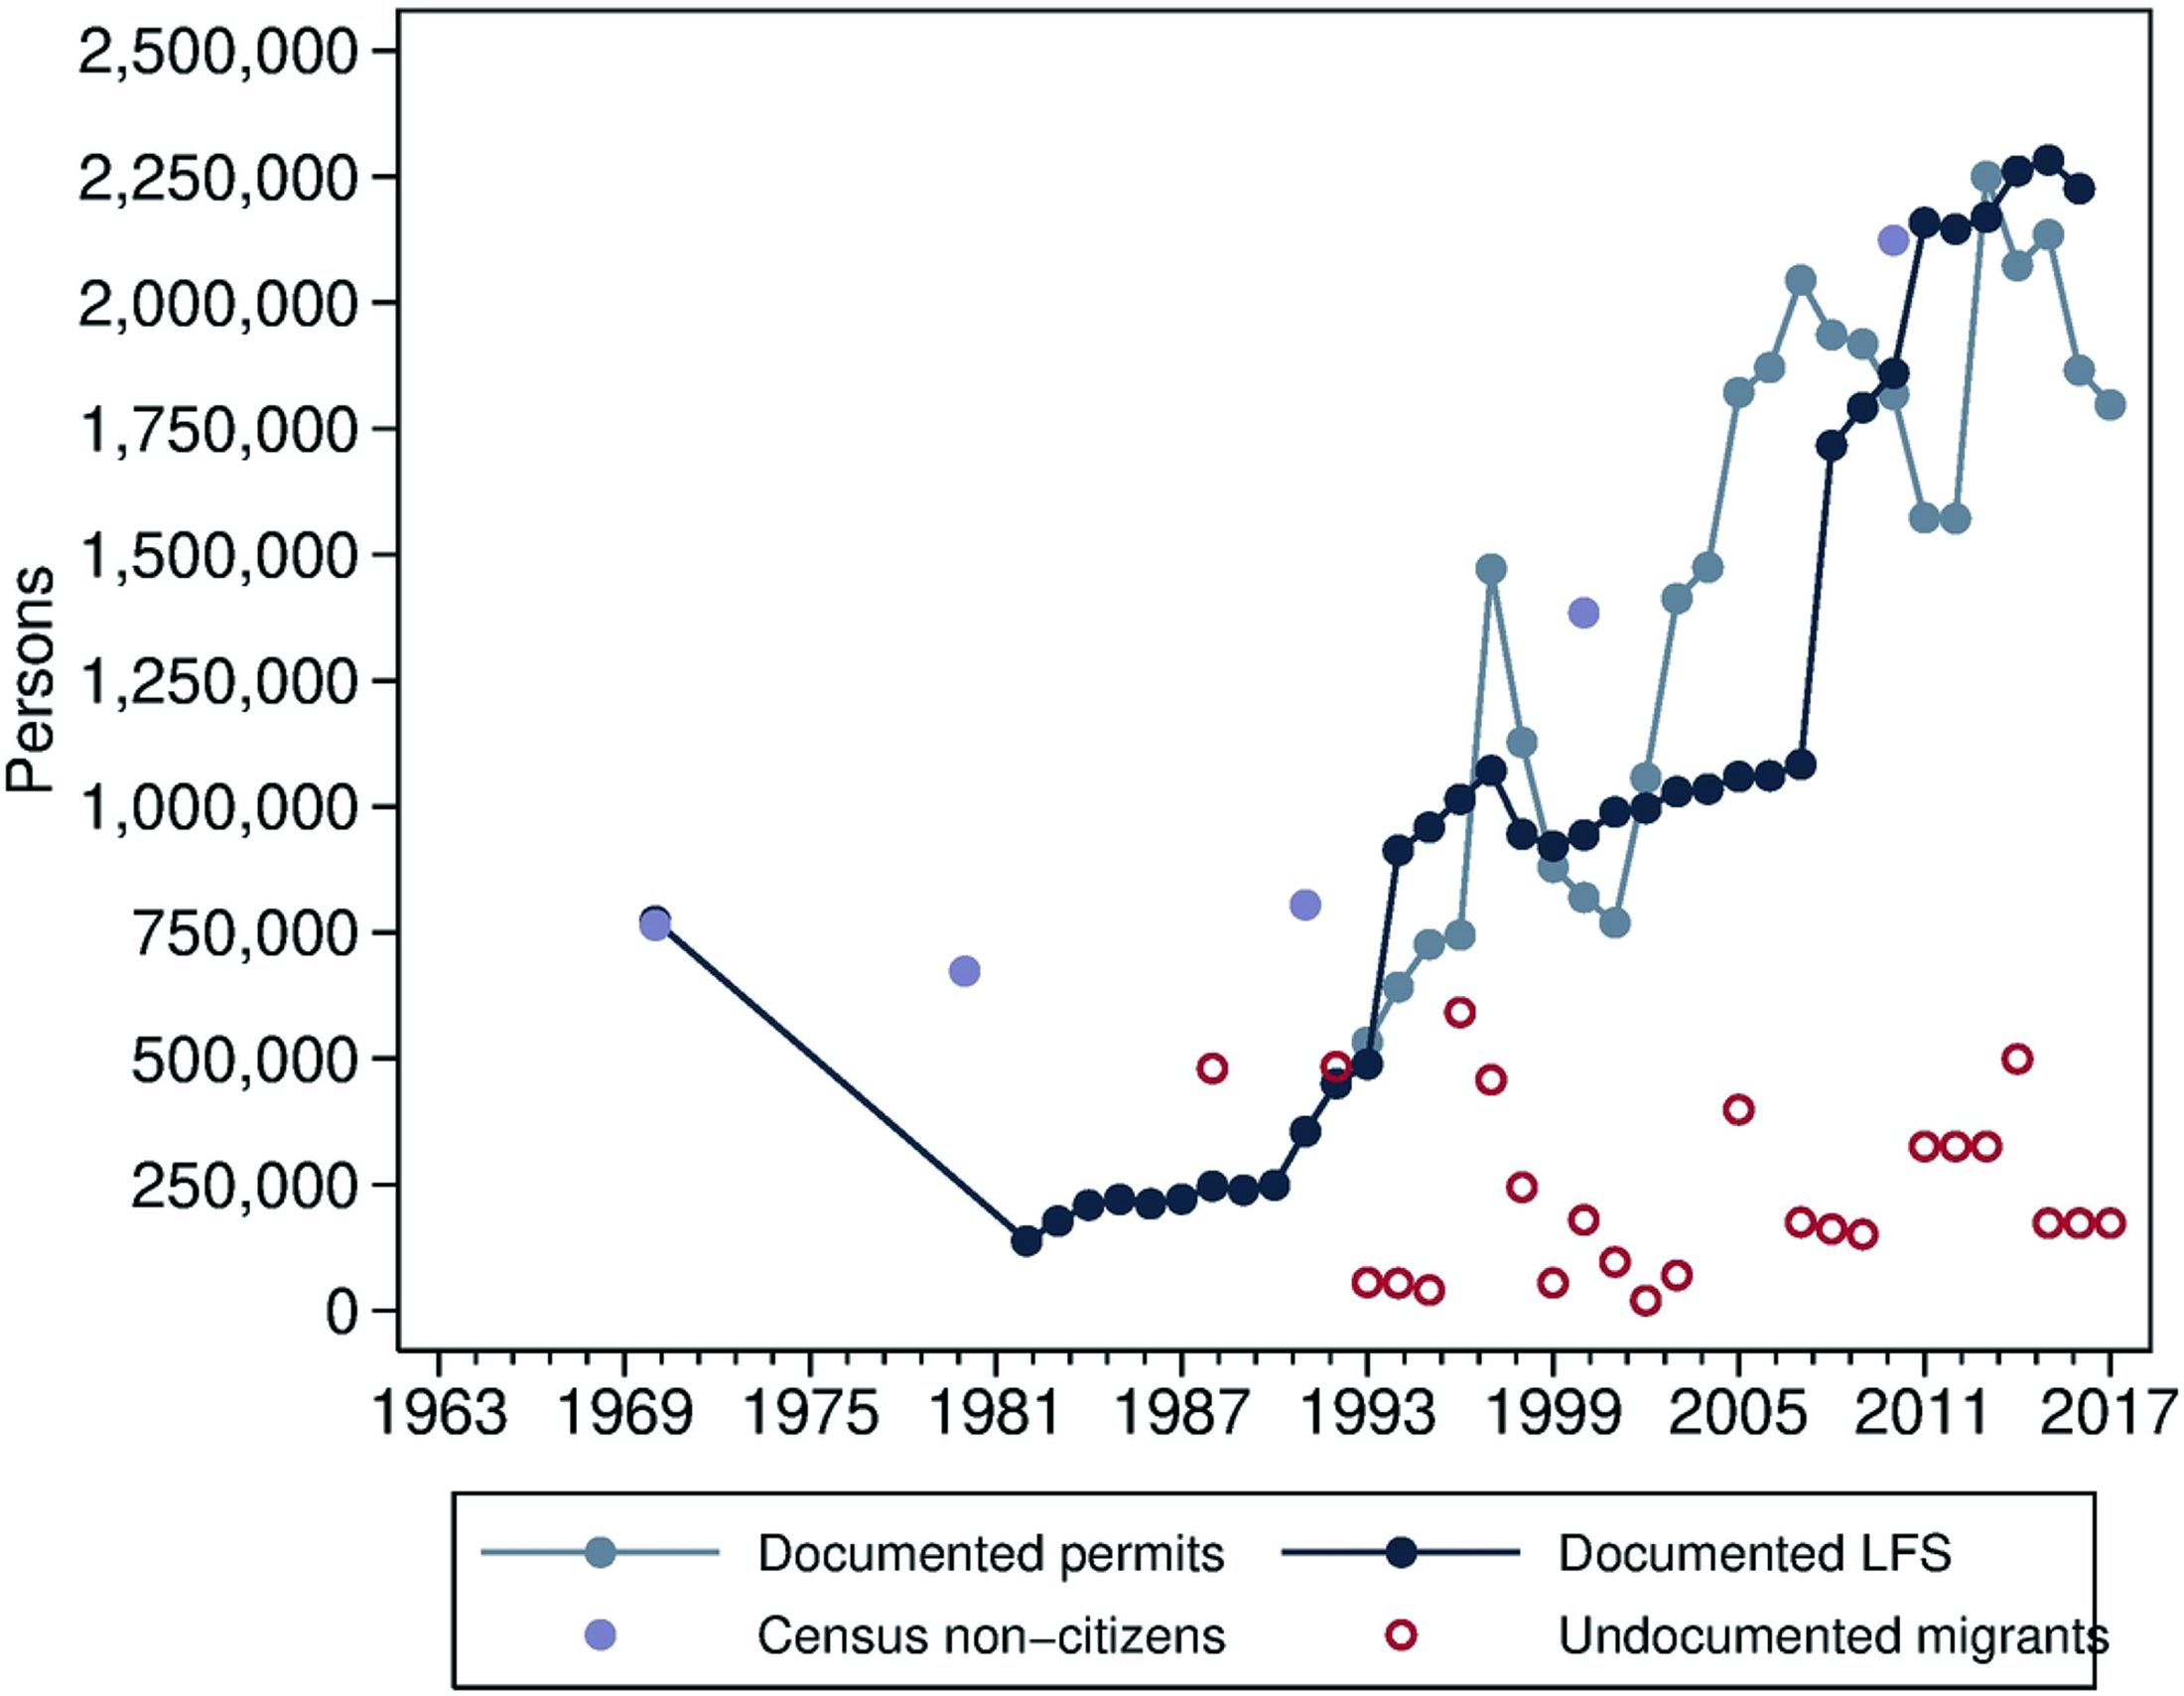
Official foreign workers and undocumented persons in Malaysia. Sources: DOSM (2020a, 2020b), Sayed Mahadi (2014), Kassim (2017), World Bank (2019b).
There have been two notable attempts to provide point-in-time undocumented migrant estimates in Malaysia. The first combined the Labour Force Survey (of households) workforce distribution with citizen-to-foreigner ratios from National Employment Returns (business surveys), estimating total foreign workers in the 3.8–5.5 million range for 2016 (of whom about 2.1 million were documented; Lee and Leng 2018). This study, however, emphasized concerns with migrant undercounting in all official datasets and mentions unpublished estimates, based on mobile SIM cardholder nationality that suggests total foreign workers could be as high as 7 million in Malaysia. The second attempt by the World Bank produced three empirical estimates of “irregular” foreign workers in the country (World Bank 2019b): an aggregate data residual approach (residual method but without access to microdata) stock estimate of around 1.5 million in 2017, a build-up approach that produced a flow estimate of 850,000 in 2017, and a stock estimate of 1.4 million in 2017–18 based on an analysis of remittance transactions.
The third, most innovative and rigorously produced, World Bank estimate was constrained by data availability and overly optimistic beliefs regarding migrant utilization of formal remittance channels. Remittance data rely on interactions with service providers that require full personal identifiers (including identity cards), with the authors acknowledging (and unable to estimate) the share of undocumented migrants using alternative remittance channels (unregulated providers, carrying money over the border personally or through friends, relatives, or runners) or not sending remittances at all. Indeed, the authors further acknowledge that the nationality of undocumented migrants identified through remittances relatively overweighted migrants from geographically distant countries, providing further indication of substantive use of informal methods not captured by their estimation. Evidence from ethnographic studies similarly suggests extensive use of informal methods (Muniandy 2015).
Point-in-time estimates based on delayed data release may provide a reasonable approximation of current numbers and are useful for validating other estimates but, without repeat observations, lack the policy analysis applications of time series data. For Malaysia, and essentially everywhere outside the United States, analysis of migration policy is constrained by the lack of longitudinal data on undocumented persons, and improving migration data is a global priority (UN 2018; United Nations Statistical Commission 2019). Additionally, Malaysian estimates capture the subset of “workers” rather than “persons.” This article offers longitudinal stock estimates of all undocumented persons derived from less biased and politically sensitive international consumption datasets, with the next section describing the consumption patterns exploited.
Rice Consumption and Development
Rice is Asia's staple food (Bandumula 2017). The world's leading rice producers and consumers are Asian countries, and rice has an unrivalled status in feeding the masses, with both production and consumption highly regulated and subsidized across the region (FAO 2018). Since at least the 1970s, most Asian countries, including Malaysia, have adopted policies to minimize price and supply fluctuation, including price ceilings, centralized importing, stockpiling, and distribution of rice. These policies have had significant budgetary costs but have broadly succeeded in their purpose, with periodic global price and supply shocks having limited transmission into domestic markets (Sharma 2003; Pletcher 1989; Jha, Srinivasan, and Landes 2007; Myung-Hwan 1993; Timmer 1996). Such distortions are equally beneficial to the statistical analysis in this article.
Analysis on a global scale shows rice consumption per capita (RCPC) increasing over time, as economic development 4 has lifted people out of poverty (Timmer, Block, and Dawe 2010). This pattern is far from universal, however, with per capita consumption first increasing then declining with income, decreasing with urbanization and population growth, and displaying the characteristics of an inferior good alongside drastic real price declines (as fixed prices and economywide inflation combine). On a global scale, these insights evidence an inverted U-shaped relationship between RCPC and development that is fairly smooth, in part due to the market price and supply interventions mentioned earlier (Timmer, Block, and Dawe 2010). Rice's unparalleled combination of stability, salience, and criticality within Asia make it an ideal candidate for inferring population patterns.
The accuracy of per capita estimation, including that pertaining to rice consumption, relies on true population statistics. While global consumption patterns are unbiased by population movements, per capita estimates may be skewed in countries with large undocumented populations. Figure 2 illustrates potential bias by comparing Malaysia and Thailand — two countries at the center of large migration corridors — with Japan and South Korea — two insular countries with relatively limited undocumented migrant populations (Dong-Hoon 2012; Kondo 2015). 5 While this chart makes no adjustments for demographics, diets, prices, or time trends (which are accommodated later), on face value, Malaysia and Thailand have not experienced declining RCPC consistent with their development trajectories. That an apparent levelling off in RCPC coincides with significant developments in Malaysia's (and Thailand's) migration and economic history is unsurprising. The likely explanation providing the starting point for this article's estimation is that Malaysia's true RCPC would look very different if it reflected the actual resident population, inclusive of undocumented persons.
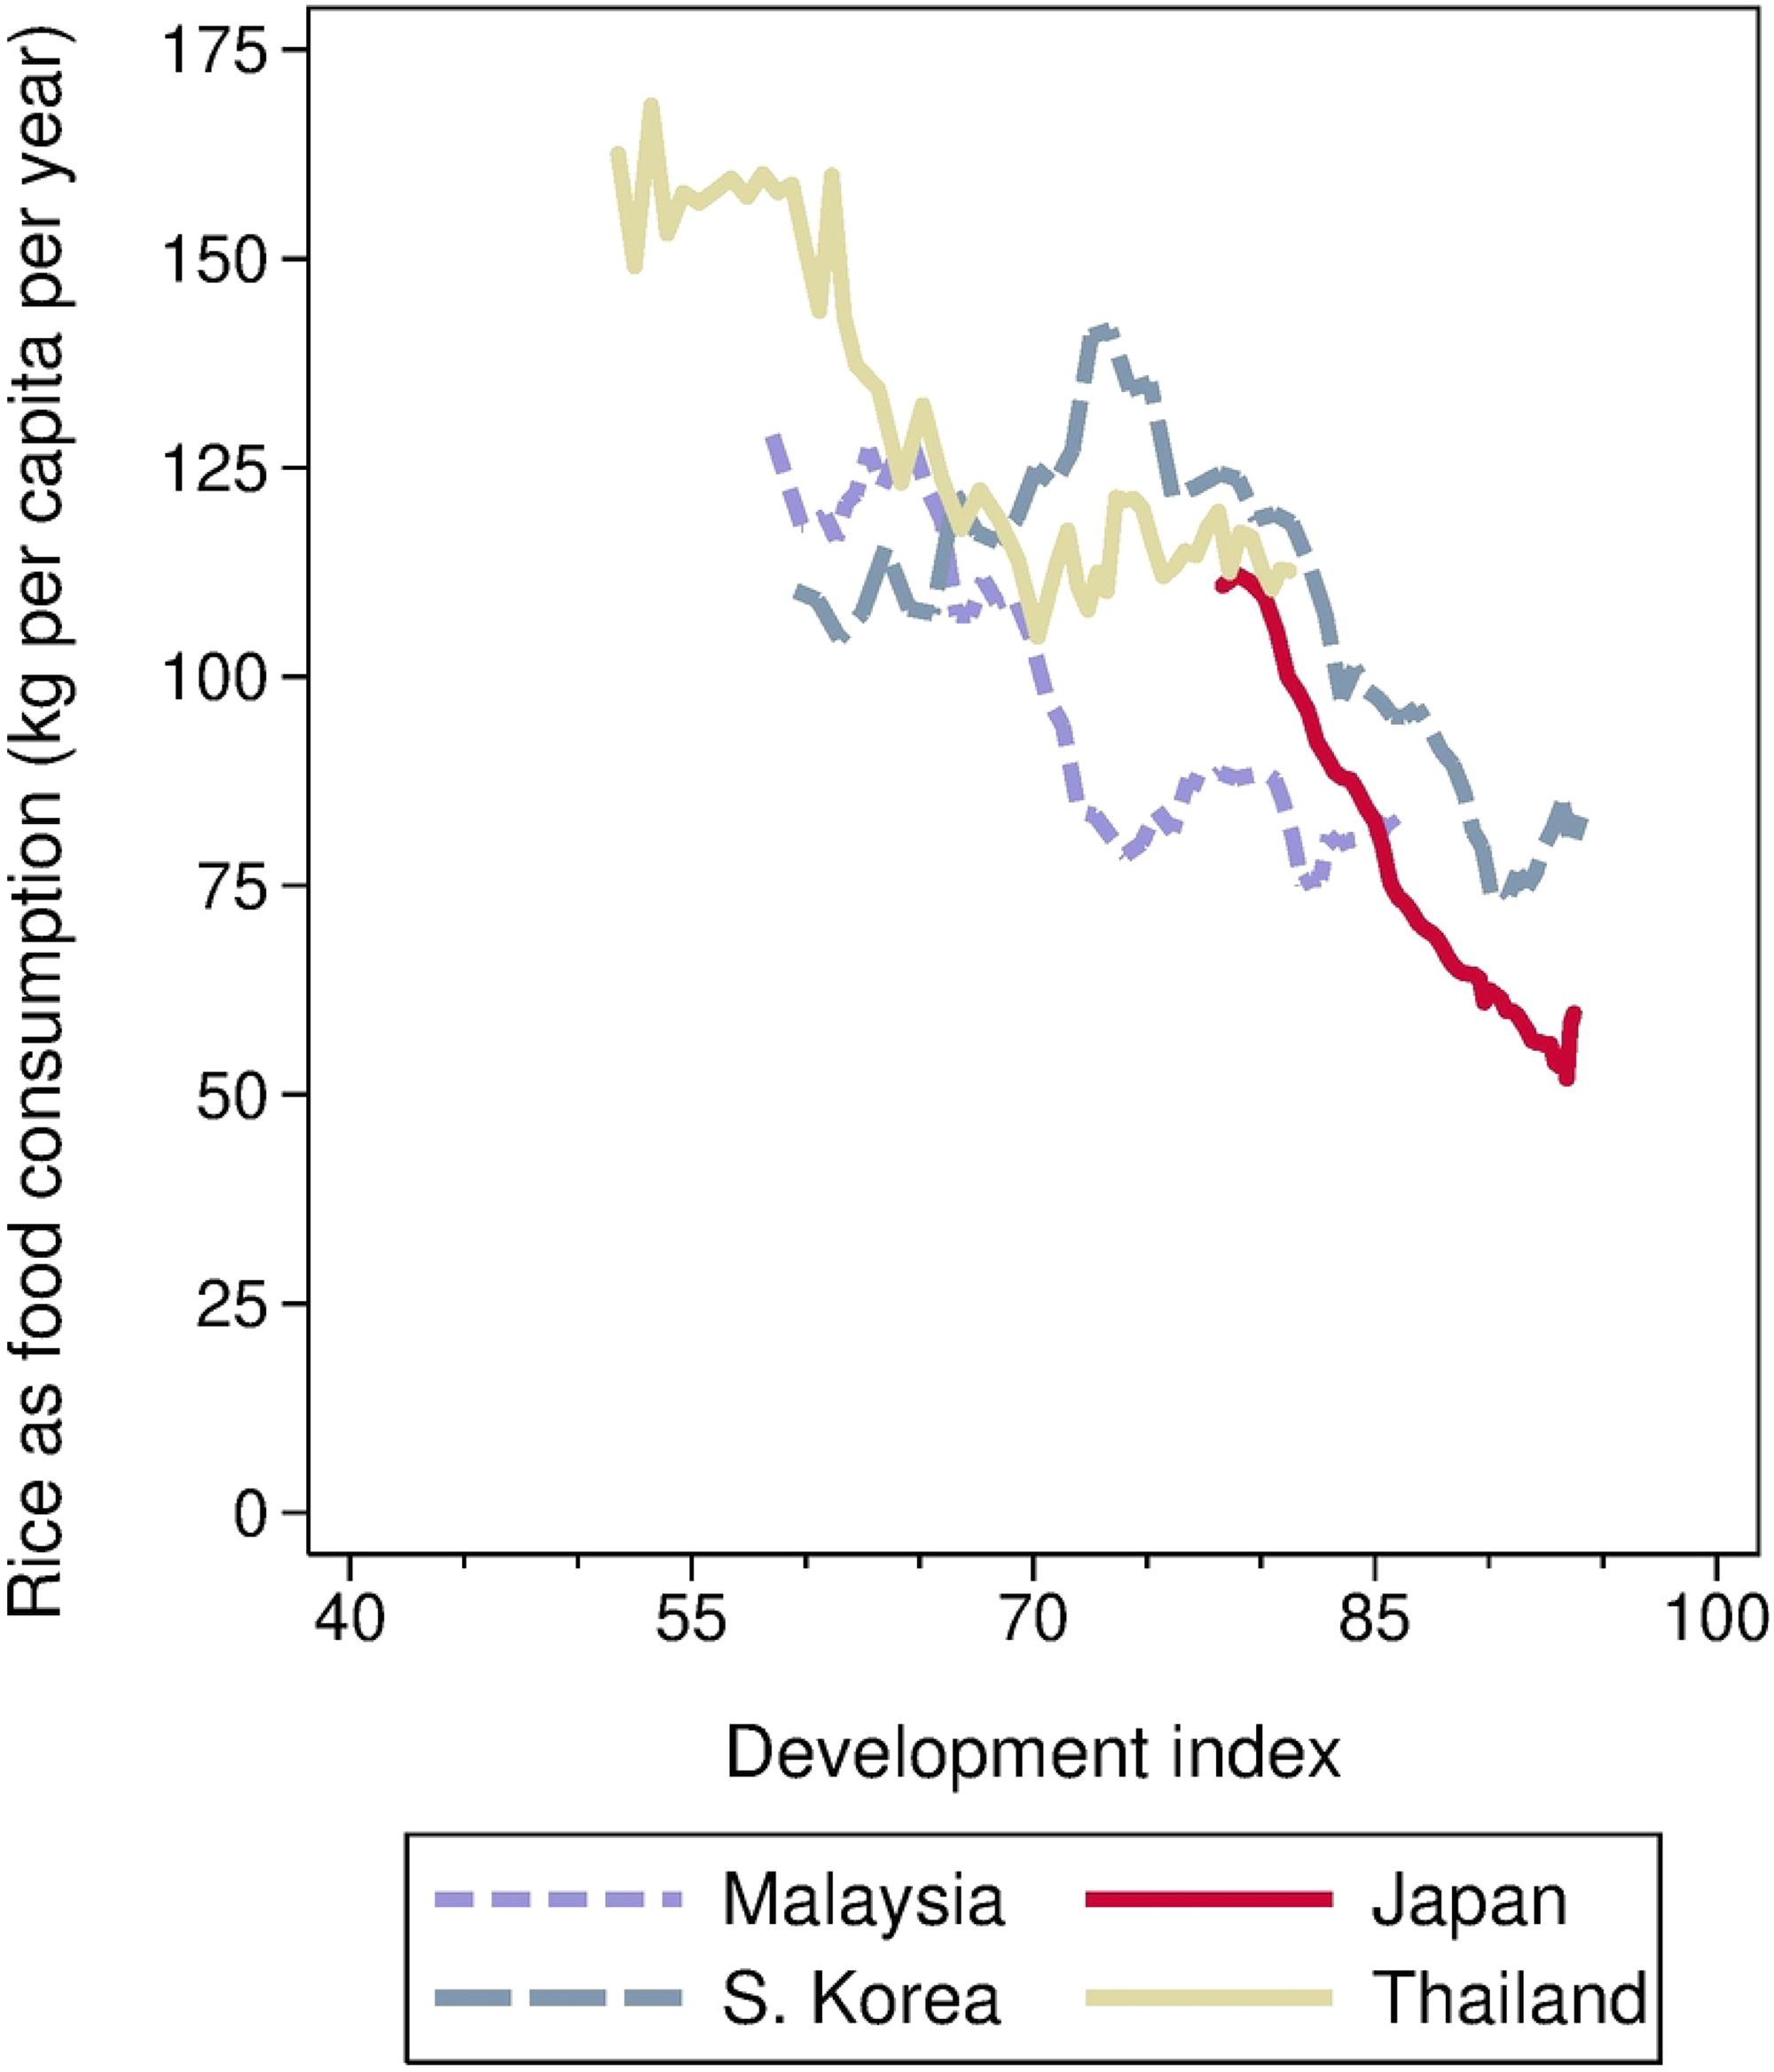
RCPC and development in selected countries. Sources: Author using FAO (2019), World Bank (2019c), Feenstra et al. (2015), UNIGME (2019).
Household survey evidence also contradicts Malaysia's arrested decline in aggregate RCPC. Japan provides, by far, the most comprehensive RCPC data, with at least annual nutritional surveys since 1946 (National Institute of Health and Nutrition 2020). Individual daily rice consumption in Japan increased by about 120 grams between 1946 and the early 1960s, when it peaked at around 365 grams. It declined steadily to around 160 grams in 2000 before a methodological change created a break in the time series (although the downward trend continued). Household survey evidence from Taiwan (Huang and Bouis 2001), South Korea (Jun et al. 2016; Yun, Kim, and Oh 2017), and Thailand (Kosulwat 2002) is equally compelling, with RCPC declining amid development-driven diet diversification.
Malaysian evidence is, unfortunately, limited, with household consumption surveys only having been undertaken twice, in 2003 and 2014 (Ministry of Health Malaysia 2003, 2014). In contrast to the smaller decline and levelling off in Malaysia's aggregate RCPC, household nutritional surveys suggest that the rice share of consumption is falling (Goh et al. 2020). These surveys also suggest a slight increase in average daily rice consumption (from 210 to 250 grams) for those that eat rice and exclusively among men (Kasim et al. 2018). There has been a significant decrease in both the population of men (around 5 percent) and women (10 percent) reporting rice consumption (down from 96–97 percent), suggesting that the overall RCPC inclusive of non-eaters may have fallen. The slight increase in daily rice consumption for a subset of men alone appears consistent with the influence of immigration from less developed countries, although migrant households’ participation rate in the surveys is unclear. The following section explains how international datasets for rice consumption, population, and development are combined to estimate Malaysia's undocumented population.
Methodology and Data
Estimating Malaysia's undocumented population involved a three-step approach. The first step estimated the expected relationship between RCPC and economic development levels over time. The second took the difference between actual (recorded) rice consumption and that predicted by the RCPC-development relationship and total official population to obtain a residual quantity of rice consumption attributable to the undocumented population. The third converted the residual quantity into undocumented person estimates, using various alternative assumptions for undocumented persons’ RCPC.
Anchoring the first-stage estimation on rice consumption has several advantages. Consumption, in general, is relatively unbiased with respect to migration and documentation, as all persons must consume essential goods and the associated data are based on goods movements (production, stock changes, and trade) that routinely capture undocumented persons. Rice is the staple food of Malaysia, its major immigrant source countries, and other Asian countries included in the estimation (Bandumula 2017). Governments in Malaysia and across the region intervene in rice markets to ensure availability and affordability, which reinforces rice's importance among the low-income households that make up Malaysia's immigrant population (Sharma 2003; Pletcher 1989; Jha, Srinivasan, and Landes 2007; Myung-Hwan 1993; Timmer 1996). Interventions also mitigate the impact of supply shocks, adding weight to assertions about population reflecting demand changes. There are also data availability advantages in terms of a long, historical panel dataset that itself is relatively unbiased and reliable, compared to traditional migration-related estimates that can be politically sensitive. 6
Consumption patterns alone are insufficient to infer population changes. Instead, a relationship through which consumption becomes reflective of population changes is needed, with RCPC and development providing that relationship, as previously discussed. To model this relationship, the estimation approach required an appropriate sample of countries for which rice is a staple food, which together cover Malaysia's levels of economic development over time and for which per capita estimates are relatively unaffected by undocumented migration. The last condition is the most critical, but also the most restrictive, and limits the sample to five countries with such large populations and/or insular societies that large migrant movements have very little influence on per capita estimates (Japan, South Korea, India, China, and Indonesia; Supplemental Appendix Figure A.1 depicts net migration's negligible influence on population change for these countries). The limited available evidence on net undocumented migration in these countries suggests it is less than 0.5 percent of population in all cases (UNESCAP 2017; de la Vega 2015; Kondo 2015; Kukutai and Thompson 2015; Dong-Hoon 2012).
Data on milled rice as food consumption were obtained from FAOStat (FAO 2019) and population data from the World Bank (World Bank 2020), spanning the period 1961–2017. It should be noted, however, that while data from 1961–2013 are consistent, the final four years reflect a slightly different methodology, as the FAO changed its approach. The years 2014–2017 were consequently fitted, using a comparable alternative dataset available for the overlapping years (FAO-OECD 2019).
Notwithstanding the identified commonalities between the sample countries, simply proceeding with the raw RCPC data risks confounding biases from country differences not captured by development. Two particular concerns are addressed through adjustments to the raw RCPC data. First, populations with more children and elderly persons would be expected to eat less rice, with demographic structure and food consumption per capita displaying a slight inverted U-shaped relationship. Consequently, the RCPC was multiplied by an age-calorie adjustment factor developed using population census data (the percentage of population by age group; UN 2020) and recommended calorie intake by age group (averaged across activity level and gender; Office of Disease Prevention and Health Promotion 2015), with between-census years computed using age-dependency ratio data (noting the almost-perfect correlation of 0.96 between computed age-calorie adjustment and age dependency data; World Bank 2019c). The age-calorie adjustment factor, thus, reflects the ratio of the population-weighted average calorie intake of the population (by country and year) relative to the average calorie intake of a hypothetical population equally distributed across age groups.
Second, rice's relative importance in the diet may differ between countries for cultural, geographic, or production reasons. For a given development level and price, rice consumption may remain systematically more important to the diet in one country than another. To mitigate against this potential distortion, the RCPC data were adjusted by a multiplication factor derived from the relative share of calories per day accounted for by rice vis-à-vis all other foods as a deviation from the sample mean (also FAO 2019 data). The deviation was calculated from the overall sample mean, rather than the mean for each time period, to make it time and development neutral. The raw RCPC data were multiplied by both factors to complete the adjustments, with the effect of these adjustments shown in Supplemental Appendix Figure A.2.
Consistent with a methodological approach asserting the unreliability of Malaysia's per capita statistics, the stalwart measure of economic development — GDP per capita — would not have been suitable. Instead, the development index deployed here draws on leading indexes in using education and health measures. Specifically, the youth mortality rate (deaths per thousand persons before age 15; UNIGME 2019) and human capital index (from Penn World Tables 9.1; Feenstra et al. 2015) were combined with equal weighting into a development index. The development index and its square were included in the model after preliminary analysis confirmed a quadratic function as the optimal fit (consistent with the expected inverted U-shape).
A measure of price variance was included as a model control. In the absence of a single panel dataset for domestic rice prices and in recognition of world price pass-through varying considerably across countries due to government interventions (Sharma 2003), real rice price indexes were constructed for each country from a variety of sources. 7 The price variable entered the model in first differences, as the indexes are not comparable between countries at levels, with price variability better suiting the model construction in any event.
To complete the first-stage RCPC-development relationship model, time and country dummies were included to control for residual trends, including supply shocks. Mathematically, the relationship model can be expressed as:

The results from equation (1) provide the predicted ADRCPC path across development. Predicted values for Malaysia's development levels for the years 1963–2017 were, then, computed, controlling for Malaysia's price changes and time effects. Note that the modeled time and price effects were also used to adjust the actual (recorded) Malaysia data to ensure comparability with the predicted values.
Using these results, the second step calculated the official population's implied rice consumption (in kilograms) and subtracted it from actual (recorded) consumption. This step involved reversing the price, trend, age, and diet calculations to return the predicted values to ordinary RCPC terms and multiplying the result by the official (census-extrapolated) population. The result was, then, subtracted from total consumption to produce an annual residual attributable to the undocumented population.
The third step estimated the number of undocumented persons implied by residual rice consumption. While the average RCPC for undocumented persons is unknown, reasonable assumptions can be derived from the first-step estimates for the official population combined with adjustments for migrant characteristics. As RCPC choice could significantly affect the undocumented population estimates, several RCPC assumptions are presented.
The modeled assumptions were (i) full acclimatization — undocumented persons were assumed to follow the same predicted RCPC path as the official Malaysian population. This assumption provides an unrealistic baseline that ignores migrant characteristics. The Indonesia-predicted (modeled) RCPC (ii) used Indonesia as a proxy for all migrants, as Indonesia is the leading source country for Malaysia's legal immigrants (and enforcement data suggest that it commands an even greater share of undocumented migrants). This second assumption used the modeled RCPC for Indonesia while the third used aggregate RCPC according to FAO/World Bank data (iii). Household survey/expenditure adjustment (iv) assumed that as immigrants to Malaysia, especially undocumented migrants, tend to be lower skilled and poorer than Malaysian citizens, they devote a greater share of expenditure on rice. To adjust for relative expenditure, the Malaysian RCPC path (v) was multiplied by the latest household survey expenditure ratio of 60:43 (non-citizens:citizens expenditure on rice) (DOSM 2017). The modeled RCPC assumption (vi) used the modeled average RCPC (across the five countries) to represent the undocumented population RCPC. The modeled expenditure adjustment applied the household survey/expenditure adjustment to the modeled average RCPC. All estimates were subsequently adjusted for aging in a manner similar to the age-calorie adjustment factor but using extrapolated demographic data specific to Malaysia's known migrant population (UN 2019).
Results
Malaysia Estimates
The estimated regression results for ADRCPC are presented in Table 1, and Figure 3 plots the predicted values alongside corresponding values for Malaysia. The development index and its square are both statistically significant and follow the expected inverted U-shaped relationship. The predicted peak in ADRCPC is around a development index of 74, which is quite early in the development context and equivalent to Malaysia in about 1988 or South Korea in 1979. The coefficient for real rice price change was statistically insignificant and very small in magnitude. Time fixed effects were significant in selected years early in the estimation period, most notably around the 1973–74 global food crisis. That later shocks were not statistically significant perhaps indicates the effectiveness of consumption-smoothing strategies implemented since then. Explanatory power is high for a simple model, vindicating the modeling strategy.
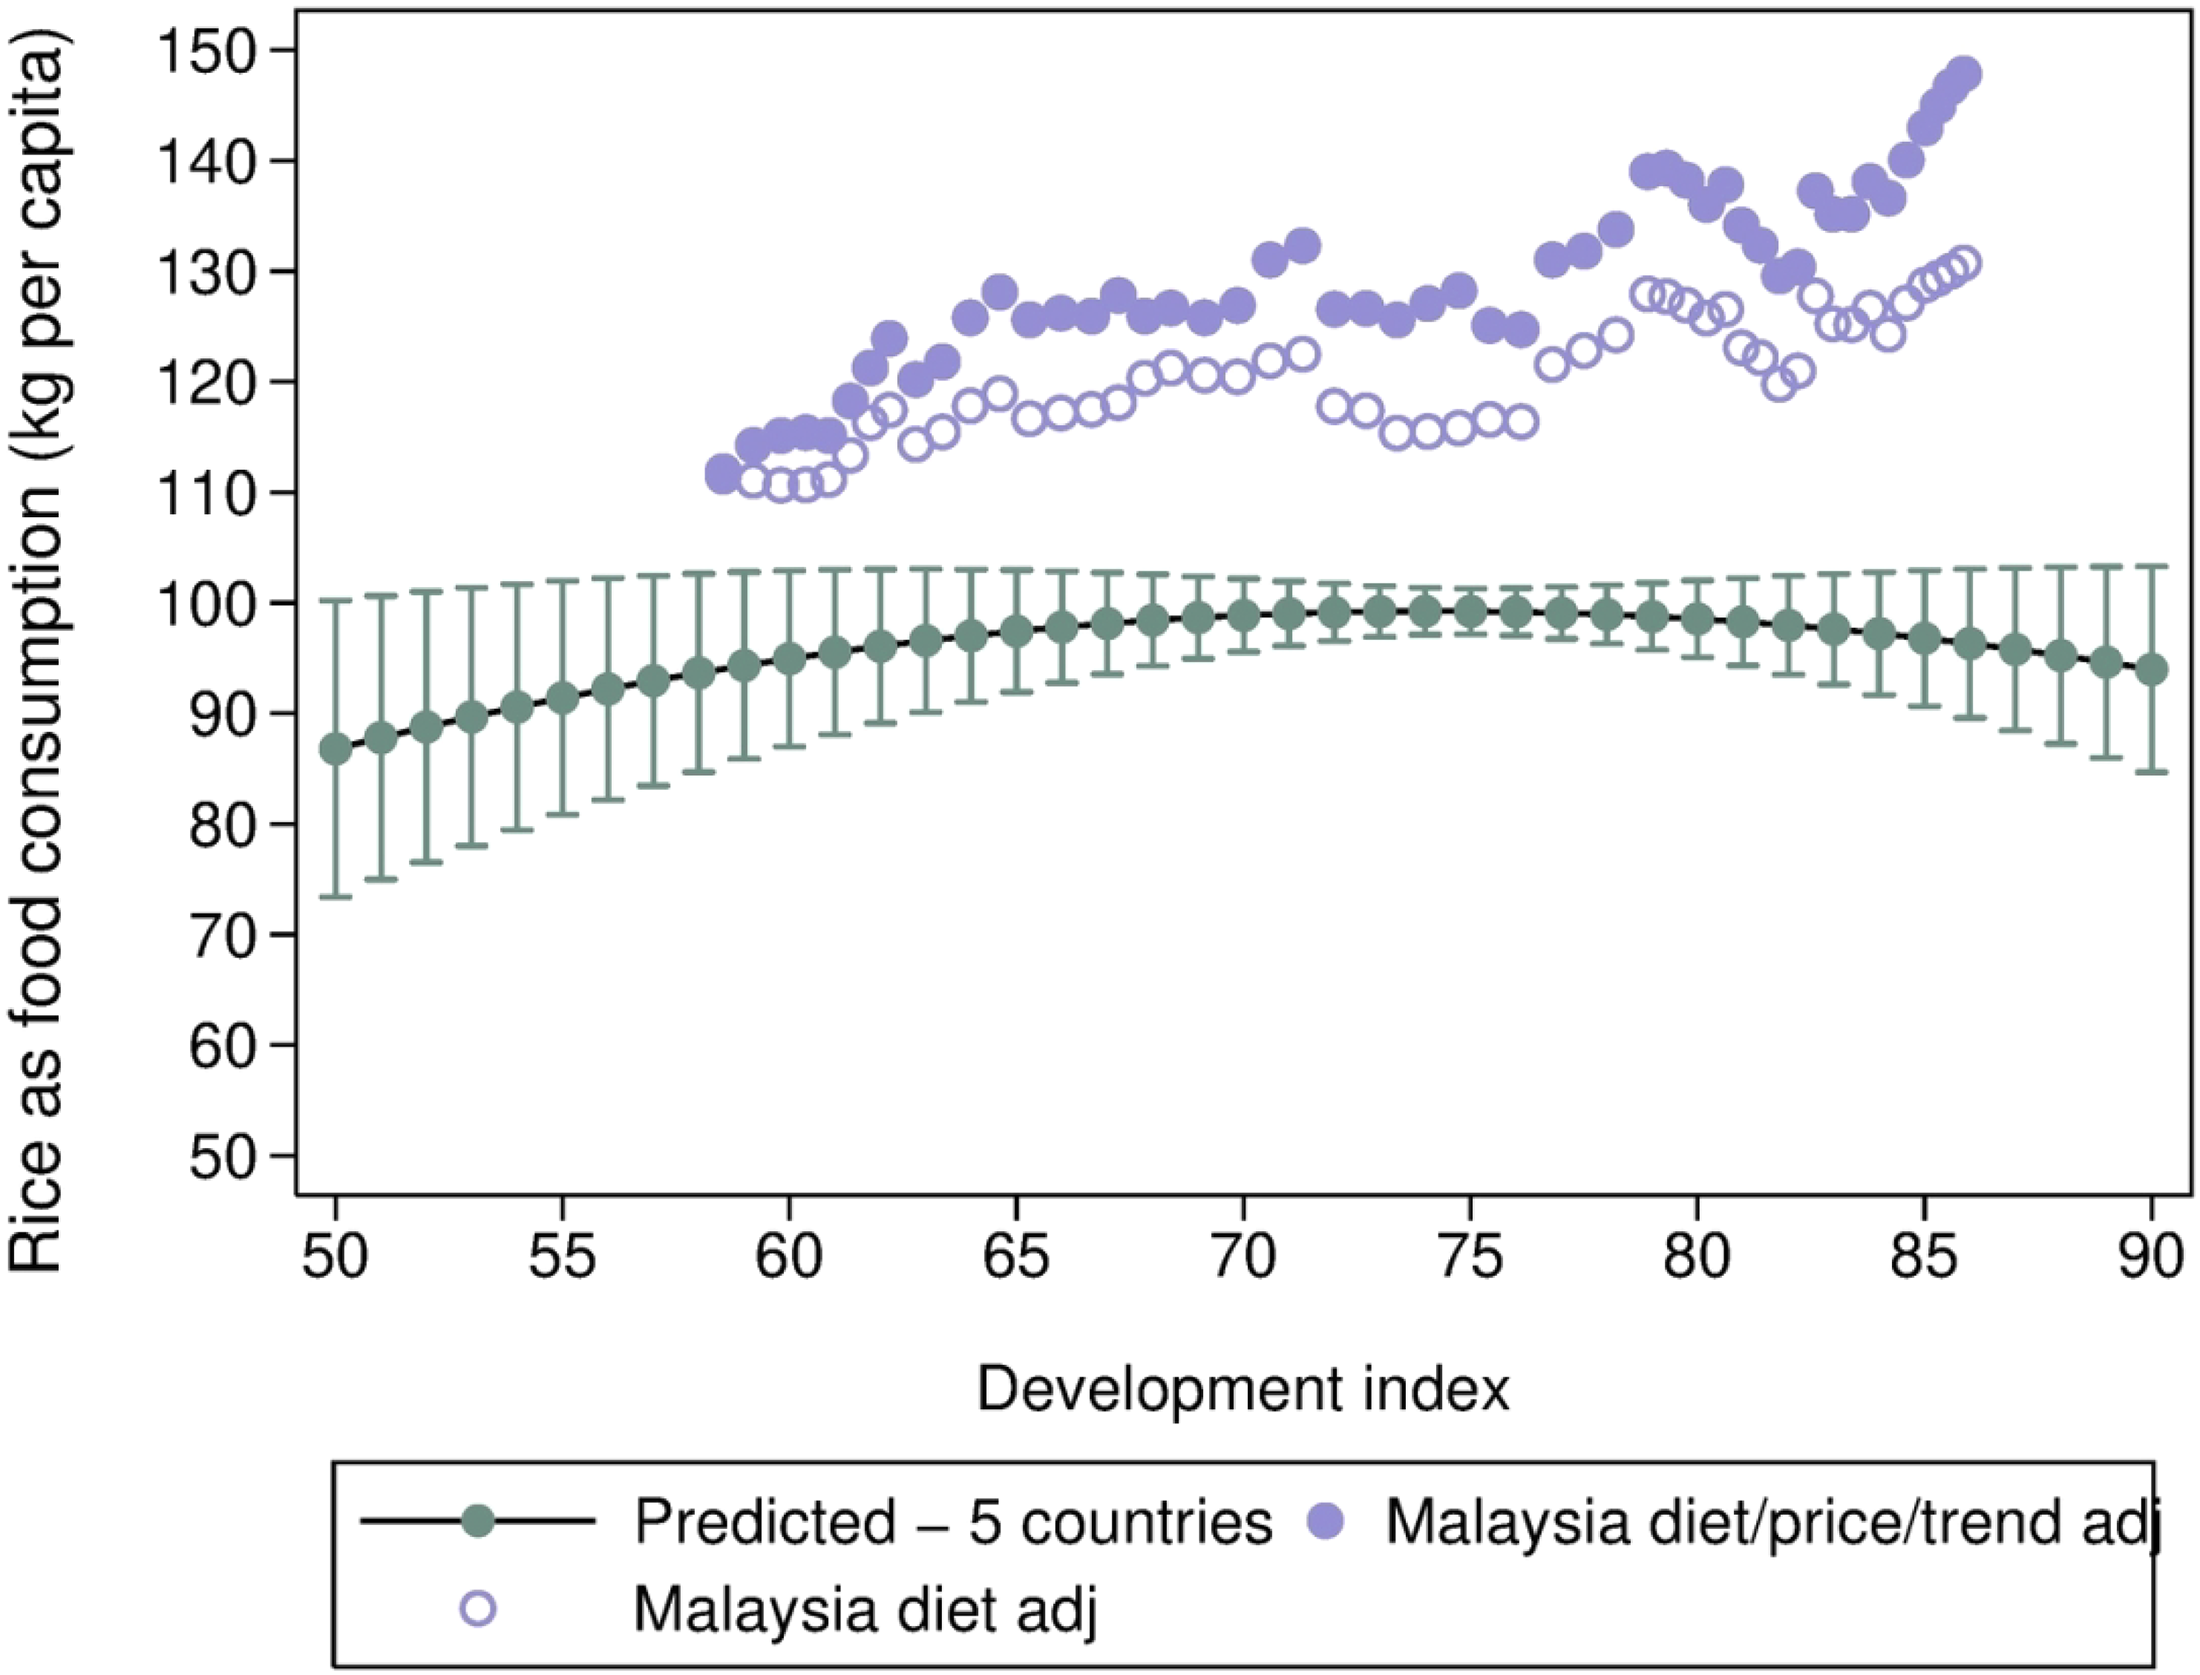
Malaysia predicted and adjusted RCPC with 95% confidence interval.
Main Estimation Regression Results.
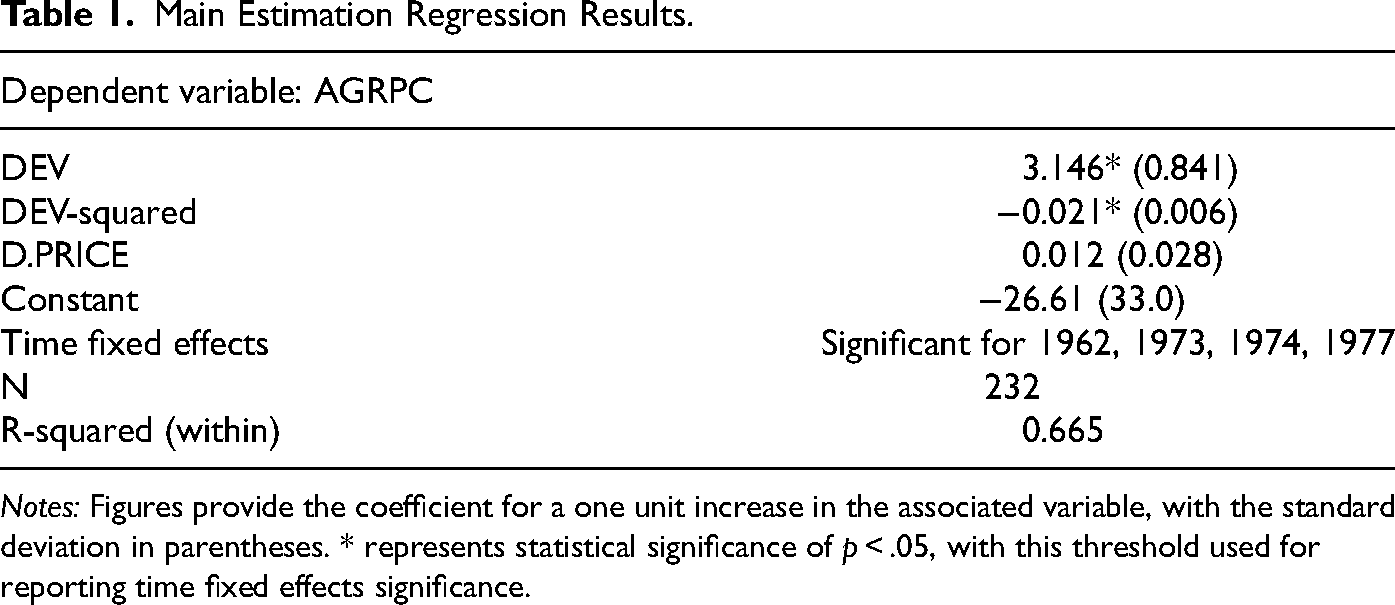
Notes: Figures provide the coefficient for a one unit increase in the associated variable, with the standard deviation in parentheses. * represents statistical significance of p < .05, with this threshold used for reporting time fixed effects significance.
Immediately apparent from Figure 3 is that after adjusting for age and diet differences, Malaysia's measured RCPC was higher than that predicted by the model at every development level. Adjusting for price and time trends widens the gap further, with the gap following an increasing trend across Malaysia's development. The relationship also ebbs and flows as one might expect of fluctuating migration influences. Translating RCPC into overall rice consumption attributable to the official population and undocumented persons shows that overall consumption increased by around 91 and 215 percent, respectively, between 1963 and 2017. Broader trends in rice consumption do not appear to be driving the pattern, however, as the correlation between the two groups was quite weak, at 0.194. Overall rice consumption by undocumented persons increased appreciably from 2002 to 2013, with the undocumented share of total rice consumption rising from around 25 to 39 percent between 1963 and 2013.
Simple proportionate comparisons likely overstate the implied undocumented population, as Malaysia's immigrants are more likely to be lower income and working age than the official population (Khazanah Research Institute 2018). A leading Malaysian think tank argued that migrants come from origins with higher RCPC (Khazanah Research Institute 2019), although attempting to calculate an origin-weighted RCPC would be both impossible with available data and vulnerable to the same biases this estimation is seeking to overcome. 8 Migrants in Malaysia are, nonetheless, almost exclusively from less-developed countries, which necessitates some adjustment.
Estimates based on the six assumptions and their demographically adjusted values are presented in Figure 4. Full acclimatization (“MYS est. RCPC”) provides estimates more than twice those of other assumptions. Incorporating income and demographic adjustments (“MYS RCPC inc. adj.”) provides the next largest estimate, suggesting an undocumented population rising from 2.05 to 10.05 million between 1963 and 2013. These estimates are not implausible but represent steep increases in the past two decades.
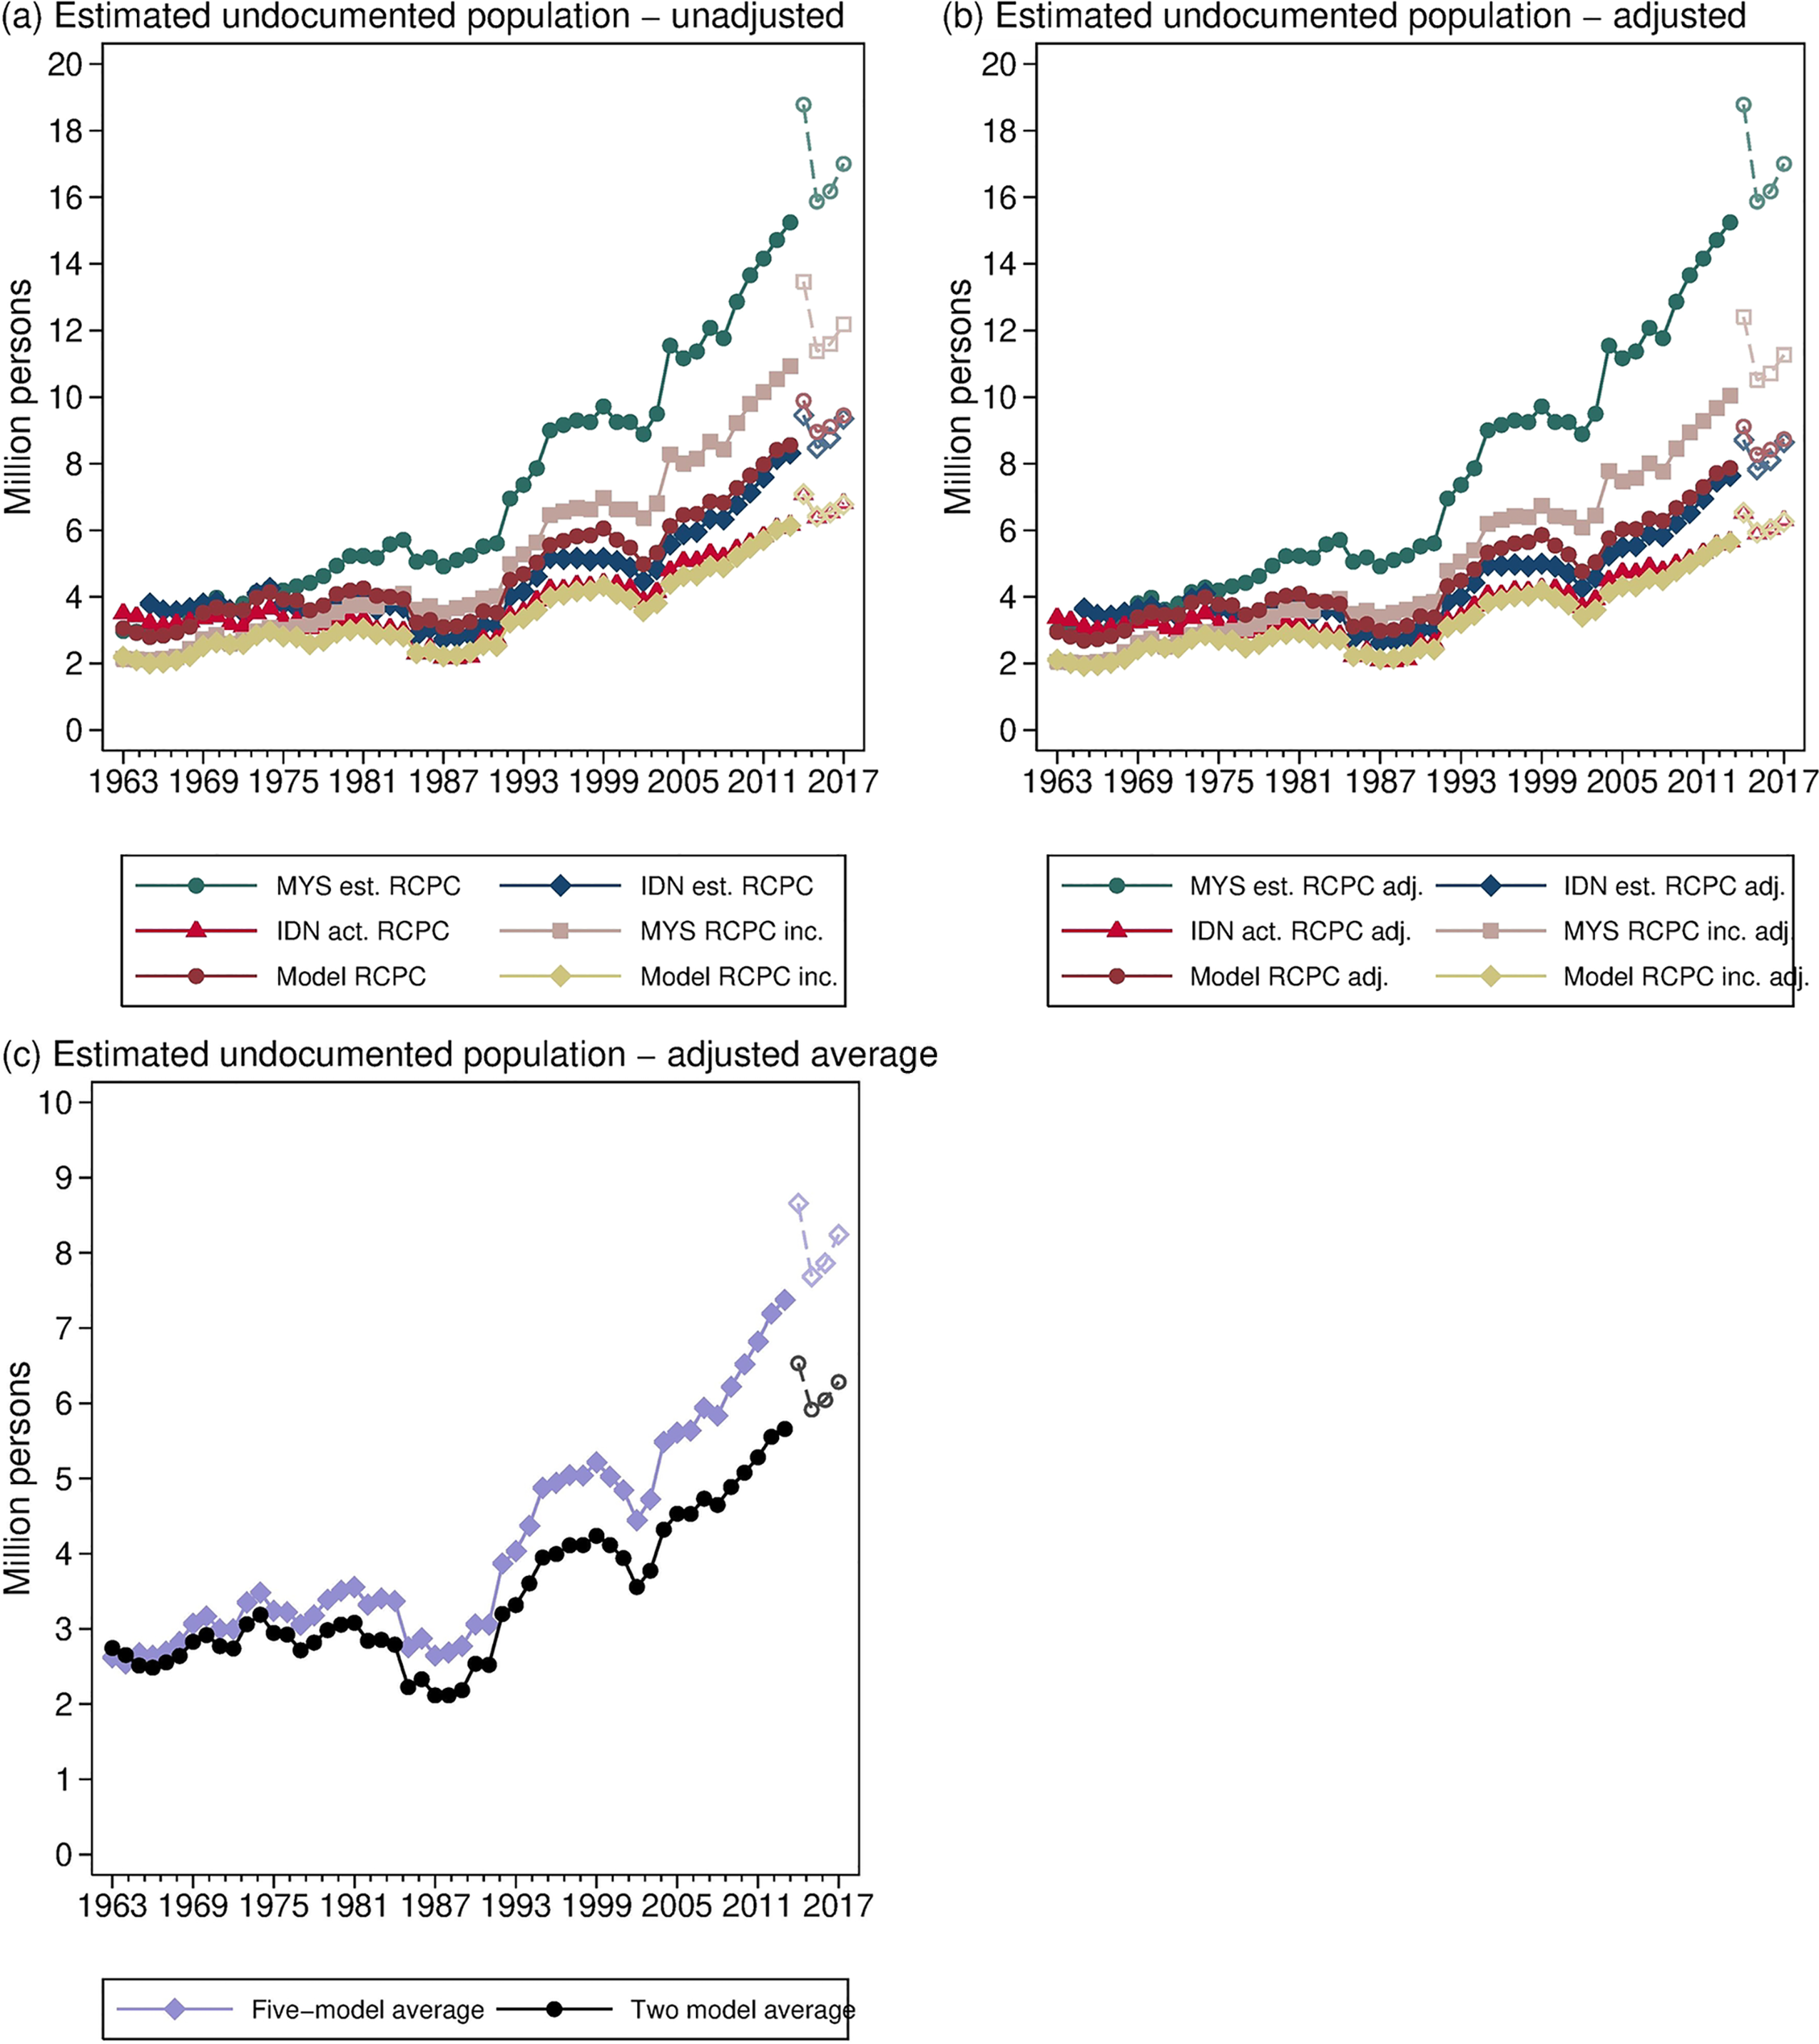
(a b c): Estimated undocumented population totals — various measures.
The estimates using the modeled RCPC for Indonesia (“IDN est. RCPC adj.”) and all countries (“Model RCPC adj.”) follow a relatively similar pattern throughout, with some deviations. These assumptions put the 2013 figure at 7.64 and 7.89 million, respectively, with the former starting from a population about one million higher than the latter. The final two estimates represent the most likely in terms of assumptions best approximating undocumented migrant consumption patterns. The Indonesia actual RCPC model (“IDN act. RCPC adj.”) and income-adjusted modeled RCPC (“Model RCPC inc. adj.”) represent different approaches with fairly similar results after about 1979. They start in very different places (IND act. 3.38 million versus Model inc. 2.11 million for 1963) but soon converge, following broadly similar but distinct patterns to near-identical end points: 5.68 million and 5.64 million, respectively, in 2013 (6.3 million in 2017, using the fitted data). Two (the final two models discussed) and five-model (excluding full acclimatization) averages are presented as low and high benchmarks. Supplemental Appendix Figure A.3 allocates the estimated total to states and territories, using labor force survey estimates of the non-citizen distribution by region, with Sabah and Selangor as the dominant host states in Malaysia.
In population share terms, official population growth has kept the undocumented share of total population relatively flat, compared to the nominal population increase (see Supplemental Appendix Figure A.4). The most plausible assumptions produce undocumented population estimates around 17–21 percent of total population in recent years. From a policy analysis perspective, annual changes in the stock of undocumented migrants are as important as totals. The largest annual variations (apparent shocks) are in the 750,000 range, while most years saw a net increase or decrease of less than 250,000 persons (see Supplemental Appendix Figure A.5).
Thailand Comparison
Robustness checks are challenging with small sample (country) estimations, effectively ruling out within-sample testing. This section adds a comparison with neighboring Thailand to test the Malaysian results’ range and consistency. Comparing the two countries in total population share terms, the early-period Thailand estimates occupy a similar range but are considerably more volatile than Malaysia's, likely reflecting a combination of greater historical turbulence and the lower specificity of modeled estimates at the lower development range (see Supplemental Appendix Figure A.6). The middle period displays a pronounced difference, with Thailand rapidly becoming a net exporter of undocumented persons during much of the 1980s (many undocumented migrants crossed the border into Malaysia) before rebounding sharply amid relative stability and strong economic growth. Thailand almost converged on Malaysia in the early 2000s but, then, fell and levelled off around 60–70 percent of Malaysia's share (depending on the measure). 9
More importantly and perhaps clearer from the annual variation comparison (Figure 5), save for the exceptional early-period volatility, the estimate variance occupies a similar range. The annual stock changes experience ups and downs and are not trivial, usually less than 2 percent of population, but can reach 4–5 percent in exceptional circumstances. Also important is that the two countries do not follow a shared pattern that would indicate an overall methodological bias.
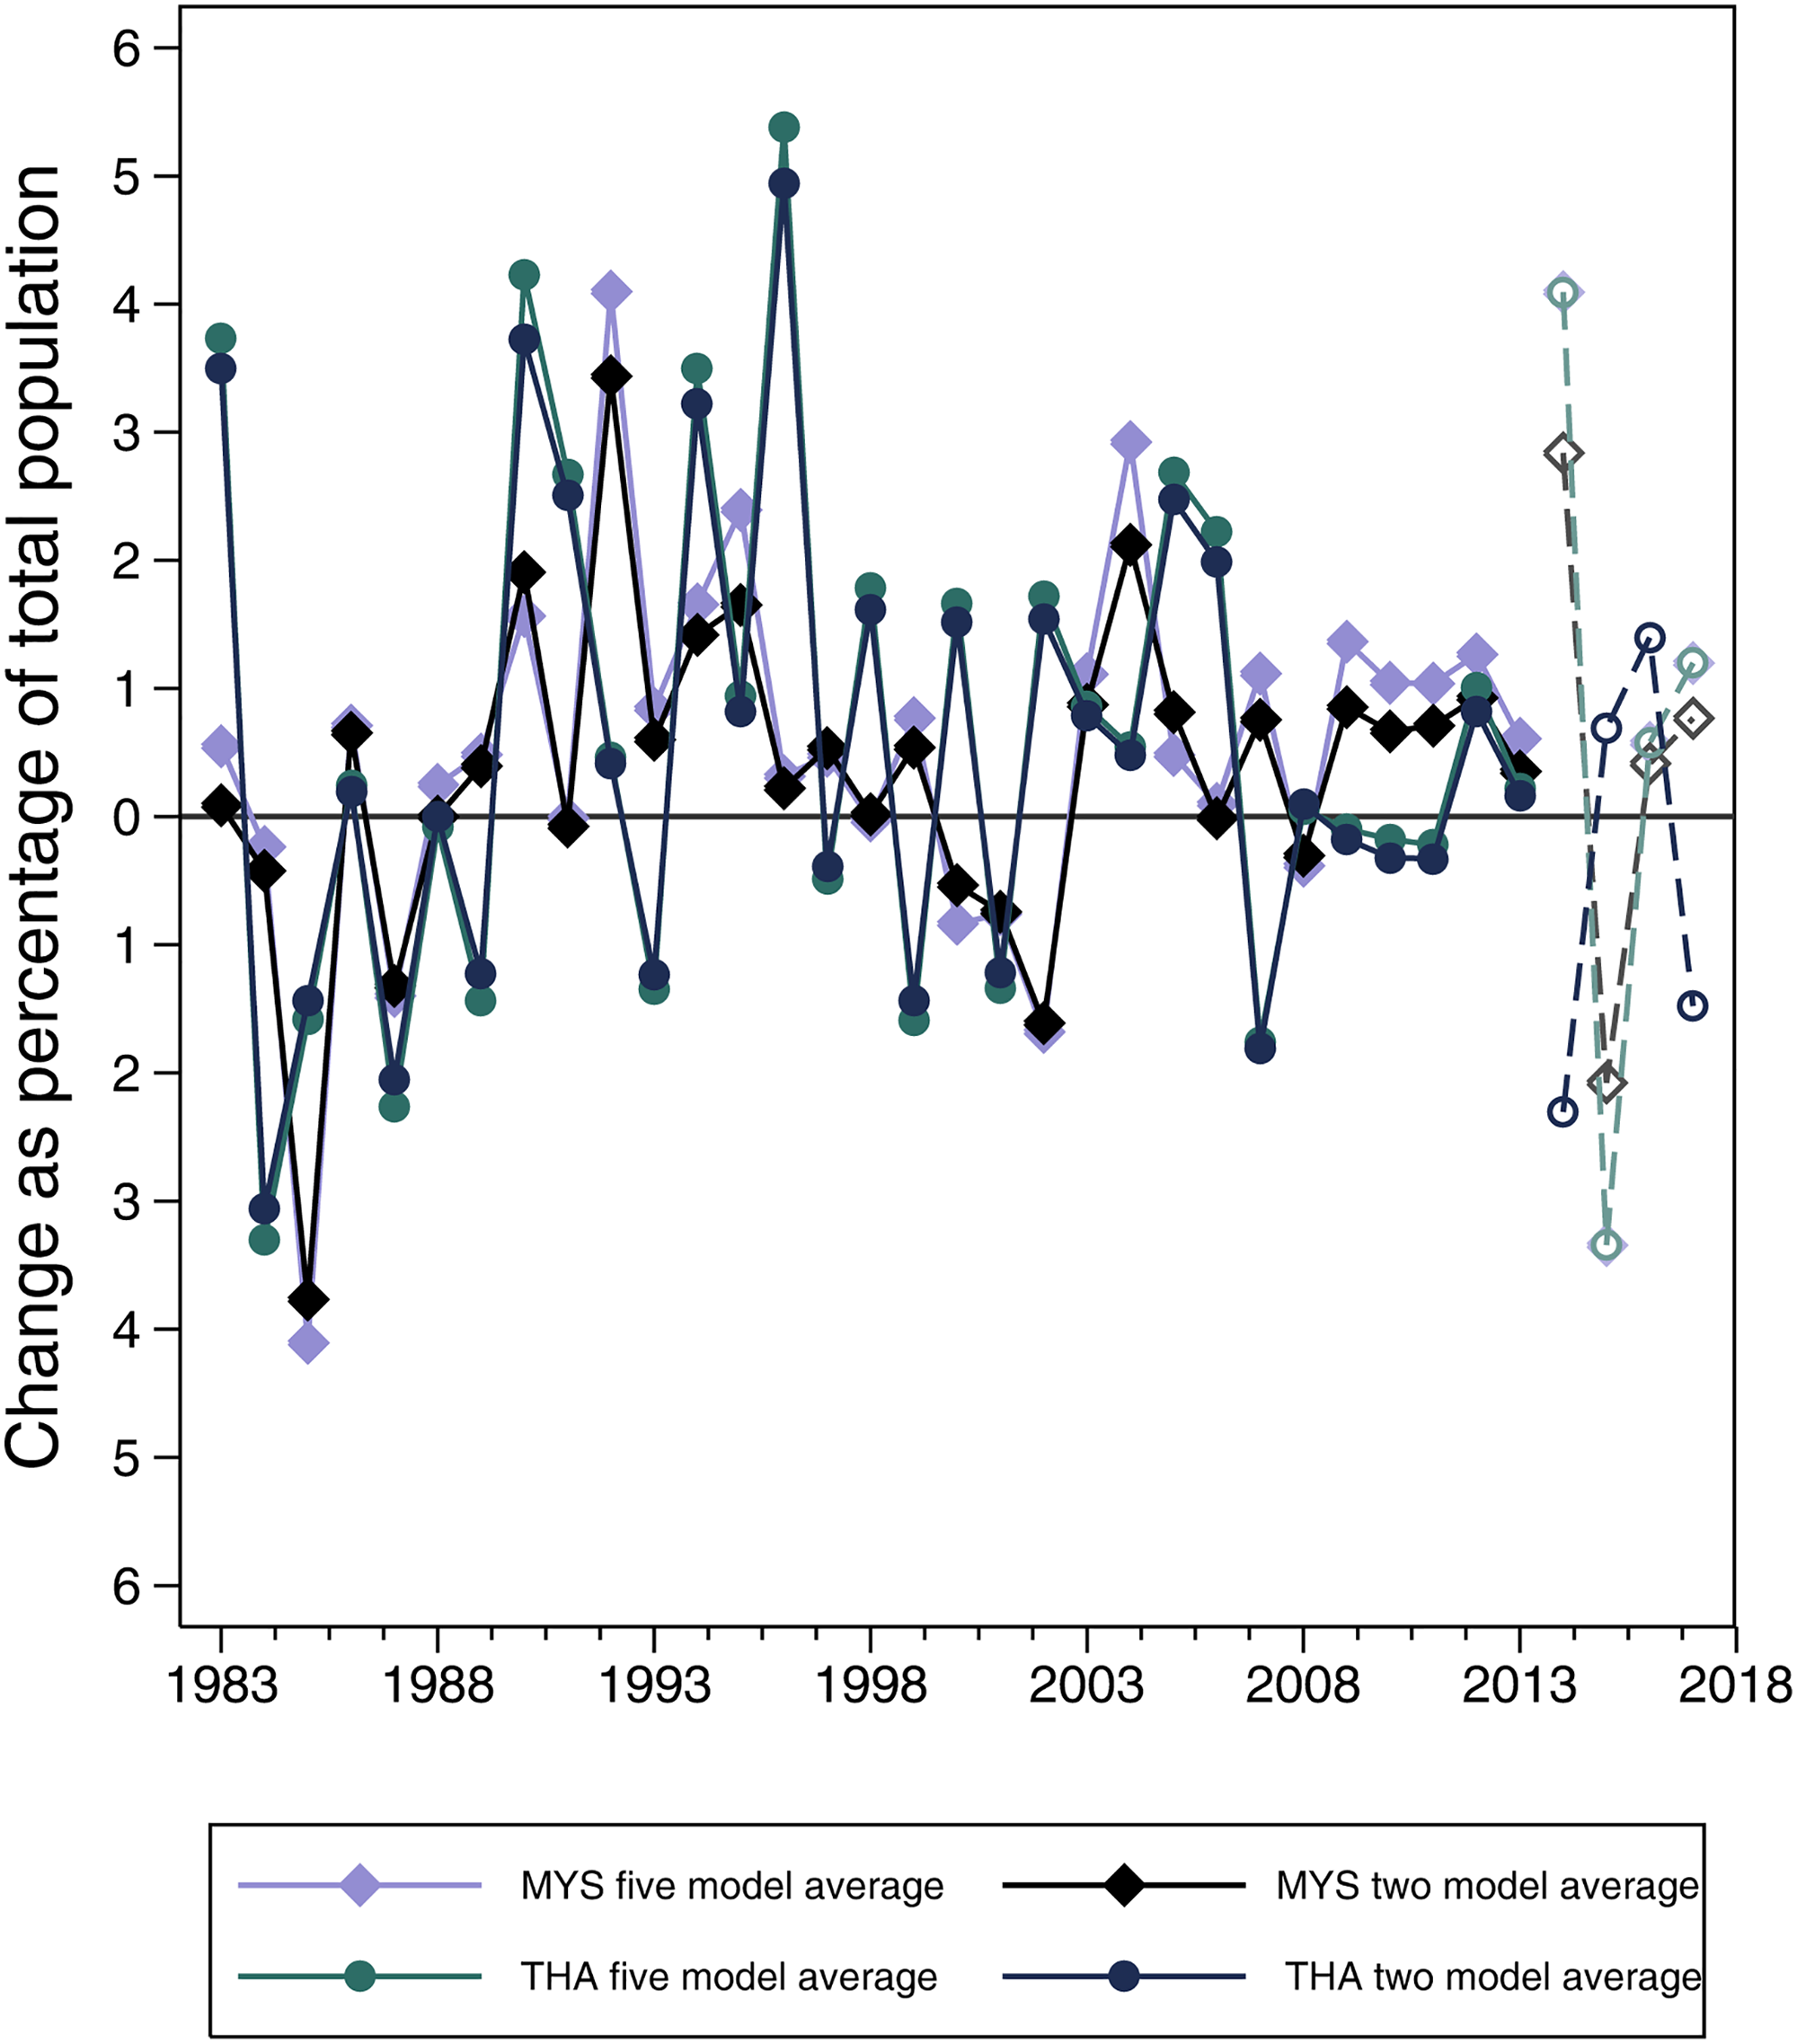
Change in undocumented persons as a share of population — Malaysia versus Thailand.
Discussion and Conclusions
The above estimation results suggest that Malaysia's undocumented population was around 2.6–2.75 million in 1963 and experienced a significant increase over the subsequent 50 years to reach 5.66–7.37 million, despite periodic decreases. Annual changes in the undocumented population could be quite significant, amounting to up to 5 percent of the Malaysian population (undocumented plus official) in some years. Both the high and low estimates are greater than previous government statements and empirical calculations (Lee and Leng 2018; World Bank 2019b). The largest government-stated estimate had the total population of foreign workers at 6.7 million in 2014, of whom 4.6 million were undocumented, while unofficial estimates range from around 3 to 7 million total (Lee and Leng 2018; World Bank 2019b). This article's higher undocumented estimates partly reflect estimating “persons” rather than “workers,” with the inclusion of children and non-working adults modestly additive. Without reliable estimates of family accompaniment and reproduction among undocumented migrants (both are prohibited for authorized foreign workers), it is impossible to separately identify the difference attributable to non-working persons; however, the rice consumption-based estimates likely identified an extra million or more undocumented workers in Malaysia. At a minimum, this article's estimates raise considerable doubt regarding low-range estimates grounded in official data.
There are several further arguments explaining the consistently higher estimates in this article. Estimates derived from official migration and population statistics suffer from underestimation biases that are not shared by RCPC-based estimates. Official population censuses and labor force surveys systematically undercount undocumented persons, as by nature, these people are difficult to find (Lehman Held 2020). Even if the residences and workplaces of all undocumented persons were effectively targeted by collections, the likelihood of a response rate equivalent to the documented population is very low, particularly in Malaysia's unpredictable immigration enforcement environment and among populations whose language and literacy skills are well below average. As others have noted (Lee and Leng 2018; Franck 2019), the credibility of Malaysian migration data is low, due to the influence of politicians and officials who benefit from suppressing the true numbers. To the extent that these claims of widespread profiteering by corrupt border officials and law enforcement are true, it adds a cost to cross-border mobility that boosts the reliability of consumption-based estimates and overall numbers being much higher (migrants incur costs crossing borders and lack the resources to transport large food supplies).
Other estimation methods suffer from similar concerns. Estimates based on workplace raids, deportations, regularizations, and other crackdowns extrapolate from the ratio of documented to undocumented workers, by necessity introducing reliability, corruptibility, and redirection biases together with the additional bias of targeting (law enforcement does not randomly select enforcement efforts) (Massey, Malone, and Durand 2002; National Research Council 2013). While novel in approach, recent remittance-based estimates similarly depend on official interactions that exclude potentially large populations outside the formal remittance system (World Bank 2019b).
Another difference in interpreting the estimates is definitional, as noted in the introduction. As the official population data used here ultimately derive from census records and inter-census estimates (the most reliable, if imperfect, source of population data), the residual undocumented population depends on the accuracy of the census in two important respects. Just as the census has a collection bias against undocumented persons, it also suffers from a similar, but smaller, bias against documented foreign persons and remote communities (Kukutai and Thompson 2015). That is, some of the “undocumented” persons, according to rice data, may be documented from a visa/citizenship perspective but undocumented from a census perspective. Conversely, the census may capture some undocumented migrants in the official total, although not to an extent remotely comparable to that believed to occur in the United States (Passel 2019).
Additionally, the accuracy of census collections is not equal across a more than 50-year period, which may help explain the high undocumented numbers in the early sample period. Early census records appear to have undercounted official populations more seriously, particularly in remote areas (Brown 1971). Undocumented migration was less salient in Malaysia prior to the 1980s, with reporting of the period acknowledging data deficiencies, a general lack of concern, and ease of movement between communities near borders (Kassim 1987; Kaur 2008). It would also be understandable if the undocumented population was much higher than anticipated at a time of transition and unrest in Malaysia, as it brought East Malaysia into the federation and faced the Konfrontasi 10 with Indonesia (Kaur 2004; Eilenberg 2011). Notwithstanding political conflict between neighbors, the early post-independence Malaysia-Indonesia distinction was less divisive at a community level, with a high number of undocumented Indonesians causing little alarm at that time. Early period estimates should be understood in this context.
With respect to the annual fluctuations, there is inevitably a risk that some years are exaggerated by the effects of carry-over consumption or imprecise consumption estimates more generally. Food balance data are internationally and independently compiled, but not infallible. Some annual variations appear quite large, though none are out of the range of possibility. The largest net deviation is around 750,000, compared to several months-long regularization and enforcement exercises that included almost twice as many undocumented migrants. Regularizations may have less influence than economic and political forces that could instigate greater spikes in people movements. Finally, some readers may question the effect of net short-term visitors on the estimates. The Supplemental Appendix discusses this issue, concluding that any influence is marginal and, if anything, biasing the estimate upwards.
In sum, then, this article's estimates appear large but plausible. The estimates were generated using a novel approach and more reliable and less institutionally biased international data for rice consumption and development, deriving undocumented persons from surplus consumption over that expected given economic development levels. The results evidence the limits of Malaysia's historical immigration control but, more importantly, offer considerable potential for undocumented migrant estimations based on consumption approaches, subject to adjustments suiting the demographic, development, and data context. This article also offers an approach to generating historical time series estimates with policy analysis applications in a field dominated by less empirically useful point-in-time estimates (Black 2021).
The methodology presented here, however, has its limitations. The strict condition that sample countries have statistically infallible per capita data meant an estimation sample for the RCPC and development relationship that may not be perfectly representative. The aging and diet adjustments have hopefully mitigated representativeness concerns, but representativeness cannot be claimed with certainty. The assumptions concerning RCPC for undocumented persons may also be contentious, despite being based on best-available evidence. Offering multiple scenarios, including conservatively high RCPC assumptions, sought to appease such concerns, while trying not to unwittingly bias the estimations downwards.
This article provides a springboard for future research on migration policymaking in key host economies within Asia, the fastest-growing destination region this century (IOM 2020). Its applications extend beyond Malaysia and Thailand, offering estimates for policy research with global implications. This article may also inspire innovative undocumented person estimations for a larger range of (developing) countries, filling a global void that continues to hamper understandings of migration patterns, vulnerability, and policies. Finally, the results are of interest to economics and development researchers for whom accurate population figures are central to per capita estimations, including leading development metrics 11 and productivity.
Supplemental Material
sj-xlsx-1-mrx-10.1177_01979183221126466 - Supplemental material for Of Rice and Men: Rice Consumption-Based Estimates of Undocumented Persons in Malaysia
Supplemental material, sj-xlsx-1-mrx-10.1177_01979183221126466 for Of Rice and Men: Rice Consumption-Based Estimates of Undocumented Persons in Malaysia by Stewart Nixon in International Migration Review
Supplemental Material
sj-docx-2-mrx-10.1177_01979183221126466 - Supplemental material for Of Rice and Men: Rice Consumption-Based Estimates of Undocumented Persons in Malaysia
Supplemental material, sj-docx-2-mrx-10.1177_01979183221126466 for Of Rice and Men: Rice Consumption-Based Estimates of Undocumented Persons in Malaysia by Stewart Nixon in International Migration Review
Footnotes
Acknowledgment
I would like to acknowledge that I received living cost stipends for my thesis research through Australian Government Research Training Program and Crawford School of Public Policy scholarships.
Declaration of Conflicting Interests
The author declared no potential conflicts of interest with respect to the research, authorship, and/or publication of this article.
Funding
The author received no financial support for the research, authorship, and/or publication of this article
Supplemental Material
Supplemental material for this article is available online.
Notes
References
Supplementary Material
Please find the following supplemental material available below.
For Open Access articles published under a Creative Commons License, all supplemental material carries the same license as the article it is associated with.
For non-Open Access articles published, all supplemental material carries a non-exclusive license, and permission requests for re-use of supplemental material or any part of supplemental material shall be sent directly to the copyright owner as specified in the copyright notice associated with the article.