
Abstract
This article examines discrimination against black and Muslim minority groups in 20 Western labor markets. We analyze the outcomes of 94 field experiments, conducted between 1973 and 2016 and representing ∼240,000 fictitious job applications. Using meta-analysis, we find that black minority groups are more strongly discriminated against than non-black minority groups. The degree of discrimination of black minority groups varies cross-nationally, whereas Muslim minority groups are equally discriminated across national contexts. Unexpectedly, discrimination against black minority groups in the United States is mostly lower than in European countries. These findings suggest that racial–ethnic discrimination in hiring can be better understood by taking a multigroup and cross-country perspective.
Introduction
In many countries, stark socioeconomic disparities exist between racial–ethnic majorities and minorities (Heath, Rothon, and Kilpi 2008; Dancygier and Laitin 2014). These disparities can partly be attributed to differences in human capital (Van Tubergen et al. 2004), social resources (Lancee 2010), and cultural values (Koopmans 2016), as well as to discriminatory practices in the labor market (Pager and Shepherd 2008). Racial–ethnic discrimination in hiring is a major social problem for societies that favor equality. Discrimination wastes individual talents, hinders the integration of racial–ethnic minority groups, and exacerbates racial–ethnic stratification (Reskin 2012; Dancygier and Laitin 2014). 1
Scholars from various social sciences (e.g., sociology, economics, and criminology) have used different methodologies to investigate racial–ethnic discrimination in the labor market. The most compelling evidence for discrimination comes from field experiments (Pager and Shepherd 2008; Neumark 2018), in which equally qualified fictitious job applicants of different racial–ethnic groups contact employers by means of sending a resume/curriculum vitae (CV) (by letter or online)—commonly known as correspondence tests—or personal presentation (face-to-face or by phone)—also known as in-person audits. Then, differences in employer responses to racial–ethnic majority and minority candidates indicate the level of discrimination in hiring.
In the past few decades, an impressive number of field experiments on racial–ethnic discrimination have been conducted, across different occupations, sectors, regions, countries, and racial–ethnic groups (Baert 2018; Neumark 2018). The common approach taken in these studies is to focus on a single country and then examine the degree of discrimination of one or more racial–ethnic minority groups—relative to the benchmark of the (racial–ethnic) majority group in that country. More recently, scholars have started to pool these field experiments and use these pooled results as data for meta-analysis. Quillian et al. (2017), for example, used meta-analysis to study changing levels of racial–ethnic discrimination in the United States, while Heath and Di Stasio (2019) provide an in-depth meta-analysis of discrimination experiments conducted in Great Britain. Bonoli and Fossati (2020) recently analyzed a selective set of field experiments to investigate the rare instances in which employers preferred minority candidates over majority candidates. Bartkoski et al. (2018) investigated in more detail discrimination of racial–ethnic minority groups that are predominantly Muslim. Finally, Zschirnt and Ruedin (2016) and Quillian et al. (2019) compare the overall level of discrimination experienced by racial–ethnic groups across countries.
In this article, we contribute to the literature on racial–ethnic discrimination in the labor market by using meta-analysis to answer a scientifically and societally pressing question: is the same type of racial–ethnic minority group equally discriminated against across countries? Whereas previous meta-analyses have shown that Muslims (Bartkoski et al. 2018) and non-white minorities (Quillian et al. 2019) are discriminated in the labor market, these works have not examined whether these two types of groups face the same levels of discrimination across societal contexts. This article aims to assess whether black and Muslim minority groups face equal levels of discrimination across countries or whether in some countries, black (or Muslim) minority groups are more discriminated against than in others.
In doing so, we provide new empirical evidence for a longstanding debate about how group boundaries are defined by skin color and Muslim identity in various Western societies (Portes and Rumbaut 2001; Alba 2005; Alba and Foner 2014). Scholars have argued that skin color may be a particularly salient category in the United States, whereas, in other Western countries, Muslim identity is the key dimension of contemporary discrimination (Alba 2005; Alba and Foner 2014). Despite strong theoretical emphasis within the migration and integration literature on skin color and religion as important social cleavages, there are remarkably few empirical studies on the role of skin color and religion in labor market discrimination.
We enrich previous literature on racial–ethnic bias, which has used attitudinal data (Strabac and Listhaug 2008; Pager and Karafin 2009; Strabac, Aalberg, and Valenta 2014) or examined racial–ethnic segregation in intimate relationships (Kalmijn and Van Tubergen 2006; Alba and Foner 2014; Potârcə and Mills 2015), with a meta-analysis of field experimental data on hiring discrimination. Although field experiments are capable of studying racial–ethnic discrimination in real-life hiring situations, this type of research has mostly included only one or very few different racial–ethnic minority groups (e.g., Pager 2003; Bertrand and Mullainathan 2004; Pager, Bonikowski, and Western 2009; Andriessen et al. 2012). Hence, one should be cautious in comparing overall discrimination rates between countries, based on results from single-country studies, as national studies differ not only in design but also in the specific racial–ethnic minority groups included (see also Lancee 2021). Elaborating upon previous studies, we analyze discrimination rates of the same type of racial–ethnic minority groups across different societies, while controlling for differences in research designs. We analyze the outcomes of 94 field experiments, conducted between 1973 and 2016, representing ∼240,000 fictitious job applications. Our dataset includes outcomes of correspondence studies and in-person audits conducted in 20 Western societies.
The article is structured as follows. We begin by discussing the theoretical arguments underlying the hypotheses tested in the paper. Subsequently, we describe the search process of the studies included in the meta-analysis as well as the coding of the variables. In the results section, we first assess the impact of publication bias and outliers. We then present descriptive findings to obtain a better understanding of the patterns of discrimination found in the literature on racial–ethnic discrimination in hiring. In the multivariable analysis, we analyze whether discrimination rates vary between racial–ethnic minority groups and countries while accounting for the precision of discrimination estimates and the influence of other characteristics of studies and subgroups. Results show that black minority groups are more strongly discriminated against than non-black minority groups; however, we do not find that Muslim minority groups face significantly higher discrimination rates than non-Muslim minority groups. Furthermore, we find that the degree of discrimination of black minority groups varies cross-nationally, whereas Muslim minority groups are equally discriminated across national contexts. Surprisingly, discrimination against black minority groups in the United States is mostly lower than in European countries. The final section summarizes the key results, discusses the broader implications of the findings, and addresses potential directions for future research.
Theoretical Background
Scholars across the social sciences have studied various mechanisms that could underlie discrimination in hiring (Phelps 1972; Arrow 1973; Sidanius and Pratto 1999; Quillian 2006; Pager and Shepherd 2008; Bertrand and Duflo 2017; Neumark 2018). A key notion in the literature on intergroup relations is in-group favoritism, which can be found in models of taste-based discrimination (Becker 1957), ethnocentrism (Sumner 1906), social identity (Tajfel and Turner 1986), and social homophily (McPherson, Smith-Lovin and Cook 2001). Empirically, there is strong evidence for this notion in various social contexts, including the labor market (e.g., Koopmans, Veit, and Yemane 2019; Lancee 2021; Veit and Thijssen 2021). Beyond baseline in-group favoritism, however, scholars have also speculated that discrimination varies across racial–ethnic minority groups, depending on the sociocultural distance between the minority and dominant majority group—that is, the degree to which a minority group differs from the majority group in terms of cultural customs, values, norms, and appearance (Bogardus 1928). A related notion on intergroup relations is a racial–ethnic hierarchy—that is, a ranking of racial–ethnic group preferences based on perceived socioeconomic status and sociocultural distance (Hagendoorn 1995; Auer et al. 2019). In this article, we focus on two aspects that define sociocultural differences between groups: skin color and (Islamic) religion. We examine how these two group characteristics may affect discrimination and how they vary in salience across countries. 2
The first dimension, skin color, is often connected with the concept of race, a theoretical construct mainly used within the United States (e.g., Alba 2005; Alba and Foner 2014; Roth 2016; Simon 2017). Race is, however, a broader concept than skin color and is socially constructed with the intertwining of certain physical, behavioral, and cultural properties (Blank, Dabady, and Citro 2004; Jablonski 2012; Roth 2016). In Europe, the concept of race is viewed as more problematic than in the United States, and the debate on migration and integration focuses more on the minority group's ethnic origin (e.g., Simon 2017). Nevertheless, also in Europe, skin color is related to social stigma (Essed 1991; Simon 2017). Research on racial–ethnic biases shows that already at a very young age, children notice differences in skin color and that when children grow older, they start to associate skin color with group distinctions (Blank, Dabady, and Citro 2004; Jablonski 2012). In many contemporary societies, there are inequalities between black and non-black groups in terms of education, work, health, and political power (Reskin 2012). Research on racial–ethnic segregation also finds high levels of residential and social segregation between black and white people in many Western countries (Kalmijn 1998; McPherson, Smith-Lovin, and Cook 2001; Musterd 2005; Alba and Foner 2014; Potârcə and Mills 2015; Musterd et al. 2017). Negative stereotypes—for example, that black minorities are backward, foolish, lazy, violent, or criminal—which may have arisen from historically rooted socioeconomic inequalities and prejudice are everywhere present and strengthened in daily social interactions, politics, or media portrayals (Essed 1991; Quillian 2006; Reskin 2012).
Against this background, skin color can become an important social boundary in the labor market. In accordance with this view, research on perceived discrimination shows that members of black minority groups strongly feel that they are being discriminated against in various domains of society, including in job searches and/or the workplace (Monk 2015; Kislev 2019). Furthermore, numerous studies find that both the general population and employers, in particular, have strong prejudices against black minority groups (Moss and Tilly 2001; Quillian 2006; Pager and Karafin 2009). Given skin color's importance as a social boundary, one would expect that
Another line of reasoning, however, argues that the level of discrimination against black minority groups varies across countries (Alba 2005; Alba and Foner 2014). Scholars have argued, for example, that skin color is a more salient boundary in the United States than in Europe (Alba 2005; Alba and Foner 2014). The US black–white boundary results from a centuries-long history of slavery, institutionalized segregation (e.g., Jim Crow, antimiscegenation legislation), and blatant hostility against black minority groups (Massey and Denton 1993; Kalmijn 1998; Reskin 2012). Research on mixed marriages, indeed, finds very low black–white intermarriages in the United States (Kalmijn and Van Tubergen 2006; Lucassen and Laarman 2009; Alba and Foner 2014). In Europe, by contrast, intermarriage between blacks and whites is more common. For example, Kalmijn and Van Tubergen (2006), in their study of intermarriage in the Netherlands, found that within the group of Surinamese origin, the Creoles (a darker-skinned subgroup) are more likely to marry outside their group than lighter-skinned groups of Surinamese origin (Hindustani or Javanese). Likewise, research on spatial stratification suggests high levels of residential segregation and corresponding neighborhood poverty between black and white groups in the United States (Massey and Denton 1993). For example, Sharkey (2013) finds that among those born between 1985 and 2000 in the United States, 61 percent of the white population grew up in neighborhoods with <10 percent poverty, compared to 9 percent of the black population. Spatial inequalities between white majorities and black minorities, however, are less pronounced in Europe (Musterd 2005; Musterd et al. 2017).
The history of race relations and persistent socioeconomic inequalities between white and black groups form an important breeding ground for strong political activism (e.g., the Black Lives Matter movement) and disputes in the United States (Massey and Denton 1993; Acharya, Blackwell, and Sen 2016). These arguments and findings suggest that in the United States, skin color is likely to play a more important role in hiring discrimination than in other Western societies. We therefore expect that.
The second social boundary we study is religion—more specifically, being a member of a Muslim minority group versus other religious or nonreligious groups. The share of Muslim minority groups increased significantly in European and other Western societies in the second half of the 20th century (Voas and Fleischmann 2012). In many Western societies, these minority groups stand out because of salient cultural expressions (e.g., hijab, niqab, and burqa), behaviors (e.g., Muslim prayer and Ramadan), and more conservative cultural opinions (Sniderman and Hagendoorn 2007; Voas and Fleischmann 2012; Inglehart 2018). Muslim minority groups in Western countries often live spatially segregated from the majority population and are less likely to marry outside their own racial–ethnic group (Lucassen and Laarman 2009; Alba and Foner 2014; Adida, Laitin, and Valfort 2016). A significant part of majority populations in Western societies have negative views of Muslim minority groups, and Muslims are more likely to be portrayed negatively in the media and politics than other groups (Strabac and Listhaug 2008; Sides and Gross 2013; Strabac, Aalberg, and Valenta 2014; Bansak, Hainmueller, and Hangartner 2016; Storm, Sobolewska, and Ford 2017; Czymara 2020).
Stark labor market disparities have also been found between Muslim minority groups and the majority population in Western societies (Heath, Rothon, and Kilpi 2008; Adida, Laitin, and Valfort 2016; Lancee 2016). A significant proportion of people belonging to Muslim minority groups further report having bad experiences with discrimination in the labor market (Kislev 2019). Also, reflecting the general population's attitudes in Western countries, scholars find evidence of anti-Islam sentiments—sometimes called “Islamophobia” (Strabac and Listhaug 2008; Strabac, Aalberg, and Valenta 2014)—among employers (Rooth 2010; Midtbøen 2014; Adida, Laitin, and Valfort 2016). These anti-Muslim sentiments are sometimes expressions of blatant xenophobia and prejudice but may also operate unconsciously (Rooth 2010) or reflect concerns over how cultural differences between Muslims and non-Muslims on the work floor can adversely affect organizational performance (Midtbøen 2014; Adida, Laitin, and Valfort 2016). There are, therefore, many reasons to suspect that members of Muslim minority groups are more strongly discriminated than other minority groups. Given religion's prevalence as a social boundary and strong concerns about Muslim minorities’ integration in Western societies, we expect that.
Islam's salience as a social boundary may also differ across countries. Prior scholarship hints at the existence of a strong and salient Muslim group boundary in Western Europe (Alba 2005; Alba and Foner 2014). Muslim minorities stand out in Western European societies not only because of their larger group size but also because of their higher levels of religiosity, thereby provoking strong resistance among the predominantly secular native-majority population (Alba and Foner 2014). Previous research on racial–ethnic prejudice has, indeed, found higher levels of anti-Muslim attitudes in Western Europe than in the United States (Strabac, Aalberg, and Valenta 2014), possibly because of the relatively high level of religiosity in the United States. Further support for this view comes from studies showing particularly low rates of mixed unions among Muslim immigrants in Western European countries (Kalmijn and Van Tubergen 2006; Lucassen and Laarman 2009; Alba and Foner 2014).
Until 2018, only one experimental study had examined racial–ethnic discrimination against Muslim minority groups in the United States (Widner and Chicoine 2011). Therefore, convincing tests of a difference in discrimination of Muslim minority groups in the United States compared to European countries cannot be conducted. Moreover, also within European countries, the strength of religious boundaries in general, and particularly the salience of Muslim religiosity as a social marker, may vary. Across European countries, religiosity is generally lower in Western and Northern Europe than in Southern Europe, with high levels of religious affiliation and commitment in Central and Eastern Europe (PEW 2019). We, therefore, explore whether the discrimination levels Muslim minorities face vary across countries.
Data and Methods
Target Studies
We selected only those field experiments that fulfilled the following criteria: (1) a field experiment, (2) a treatment variable of race–ethnicity, and (3) a dependent variable of an employer response. We discuss these criteria consecutively.
Field experiment. We focused on experiments conducted in real-life settings and, therefore, excluded laboratory experiments. Furthermore, we included only experiments in which applicants actively contacted the employer. Field experimental studies in which resumes were posted on online job search websites or in which employers could approach potential candidates were excluded.
Race–ethnicity. The “target groups” are racial–ethnic minorities. The candidate's race–ethnicity could be reflected in terms of first or last names, nationality, or ethnic origin.
Employer response. The selected studies had to measure discrimination regarding employer responses: that is, whether racial–ethnic minority and majority applicants had the same opportunities when it came to receiving a response from employers. An employer response is indicated by, among other things, a positive callback, a positive reaction, an invitation for a job interview, or a job offer. 3 Outcome measures of unequal treatment/discrimination may differ across studies: whereas some studies analyze a measure of net discrimination (i.e., by deducting the percentage of positive responses of racial–ethnic minorities from the percentage of positive responses of racial–ethnic majorities), most studies provide either callback rates per group (i.e., the number of positive callbacks a certain group received divided by the total number of applications sent by that group) or the callback ratio (i.e., the ratio of the majority candidate's callback rate to the minority candidate's callback rate). Our dependent variable is based on the latter because information about the callback rates per group is typically provided or can be derived easily.
Search Process and Coding of Field Experiments
The search process started in June 2011 and ended in April 2018. We used three methods to find studies.
Traditional. In the first method, we searched with relevant keywords in online databases and search engines (e.g., Omega, Google Scholar, Google, Web of Science, and other online databases). Examples of relevant keywords are “experiment racial–ethnic discrimination labor market,” “audit studies discrimination,” “situation testing discrimination,” “correspondence testing discrimination,” “in-person test discrimination,” “field experiment discrimination,” and “employment discrimination experiments.” Searches were extended by using keywords in languages other than English (German, French, Dutch, and Spanish). Keywords were also broadened in this wave of data collection.
Snowballing. Studies found with the first method were subsequently used as a starting point for further data collection. The so-called “snowballing” method consists of browsing references in studies selected using the first method and establishing whether those references fit the selection criteria. We also searched “forward” by investigating the studies that cited the previously located studies. Additionally, literature reviews on racial–ethnic discrimination in the labor market were used to search for further eligible articles (Riach and Rich 2002; Rich 2014; Quillian et al. 2017; Gaddis 2018; Neumark 2018).
Personal contacts. In the hope of finding unpublished work, more recent studies, or ongoing studies, the authors contacted other researchers, seeking information on their current and ongoing research work and that of others in their country.
By using these three search strategies, we were able to identify 103 field experiments. However, because of our theoretical focus on black and Muslim minority groups in Western labor markets, we included only field experiments conducted in Europe, North America, and Australia (N = 96); that is, socioeconomically comparable countries with a meaningful share of black or Muslim minority groups.
Coding of field experiments. Studies were coded by research assistants under the authors’ close supervision, and entries were double-checked to ensure reliability. Also, the number of majority and minority applicants sent in each study was registered, since, in the meta-analysis, effect sizes are weighted by the precision of estimates. Authors often reported separate results for various subgroups. For example, Andriessen et al. (2012) presented the results for groups with different racial–ethnic origins, for men and women, and for different job characteristics. We coded breakdowns by racial–ethnic groups, gender, contact method, jobs, location, and experimentally manipulated variables other than race–ethnicity (e.g., an applicant's criminal record). As a result, our dataset has a nested structure with subgroups (subgroup level) nested within studies (study level). In the end, the dataset consisted of 674 subgroups reported in 96 studies, containing data of ∼240,000 fictitious job applicants. For a complete overview of all field experiments, see also Table A1 in the Online Appendix.
Coding of Racial–Ethnic Minority Groups
For most subgroups and studies, we could clearly identify which racial–ethnic minority groups the authors examined. In some cases, however, researchers examined a combination of different racial–ethnic minority groups as one group (e.g., in their study in Belgium, Baert et al. 2017 investigated Turkish, Moroccan, Slovakian, and Ghanaian minority groups as one broad group of immigrants). In total, there are seven samples with a combination of different racial–ethnic minority groups examined as one group—hereafter referred to as “heterogeneous samples” (called, heterogeneous samples A–G). We classified these heterogeneous samples as either black or non-black minority (respectively, Muslim or non-Muslim minority) groups, if possible. However, as explained below, in some cases, this classification was not possible (see Tables 1 and 2).
Overview of Black and Non-Black Minority Groups per Country.
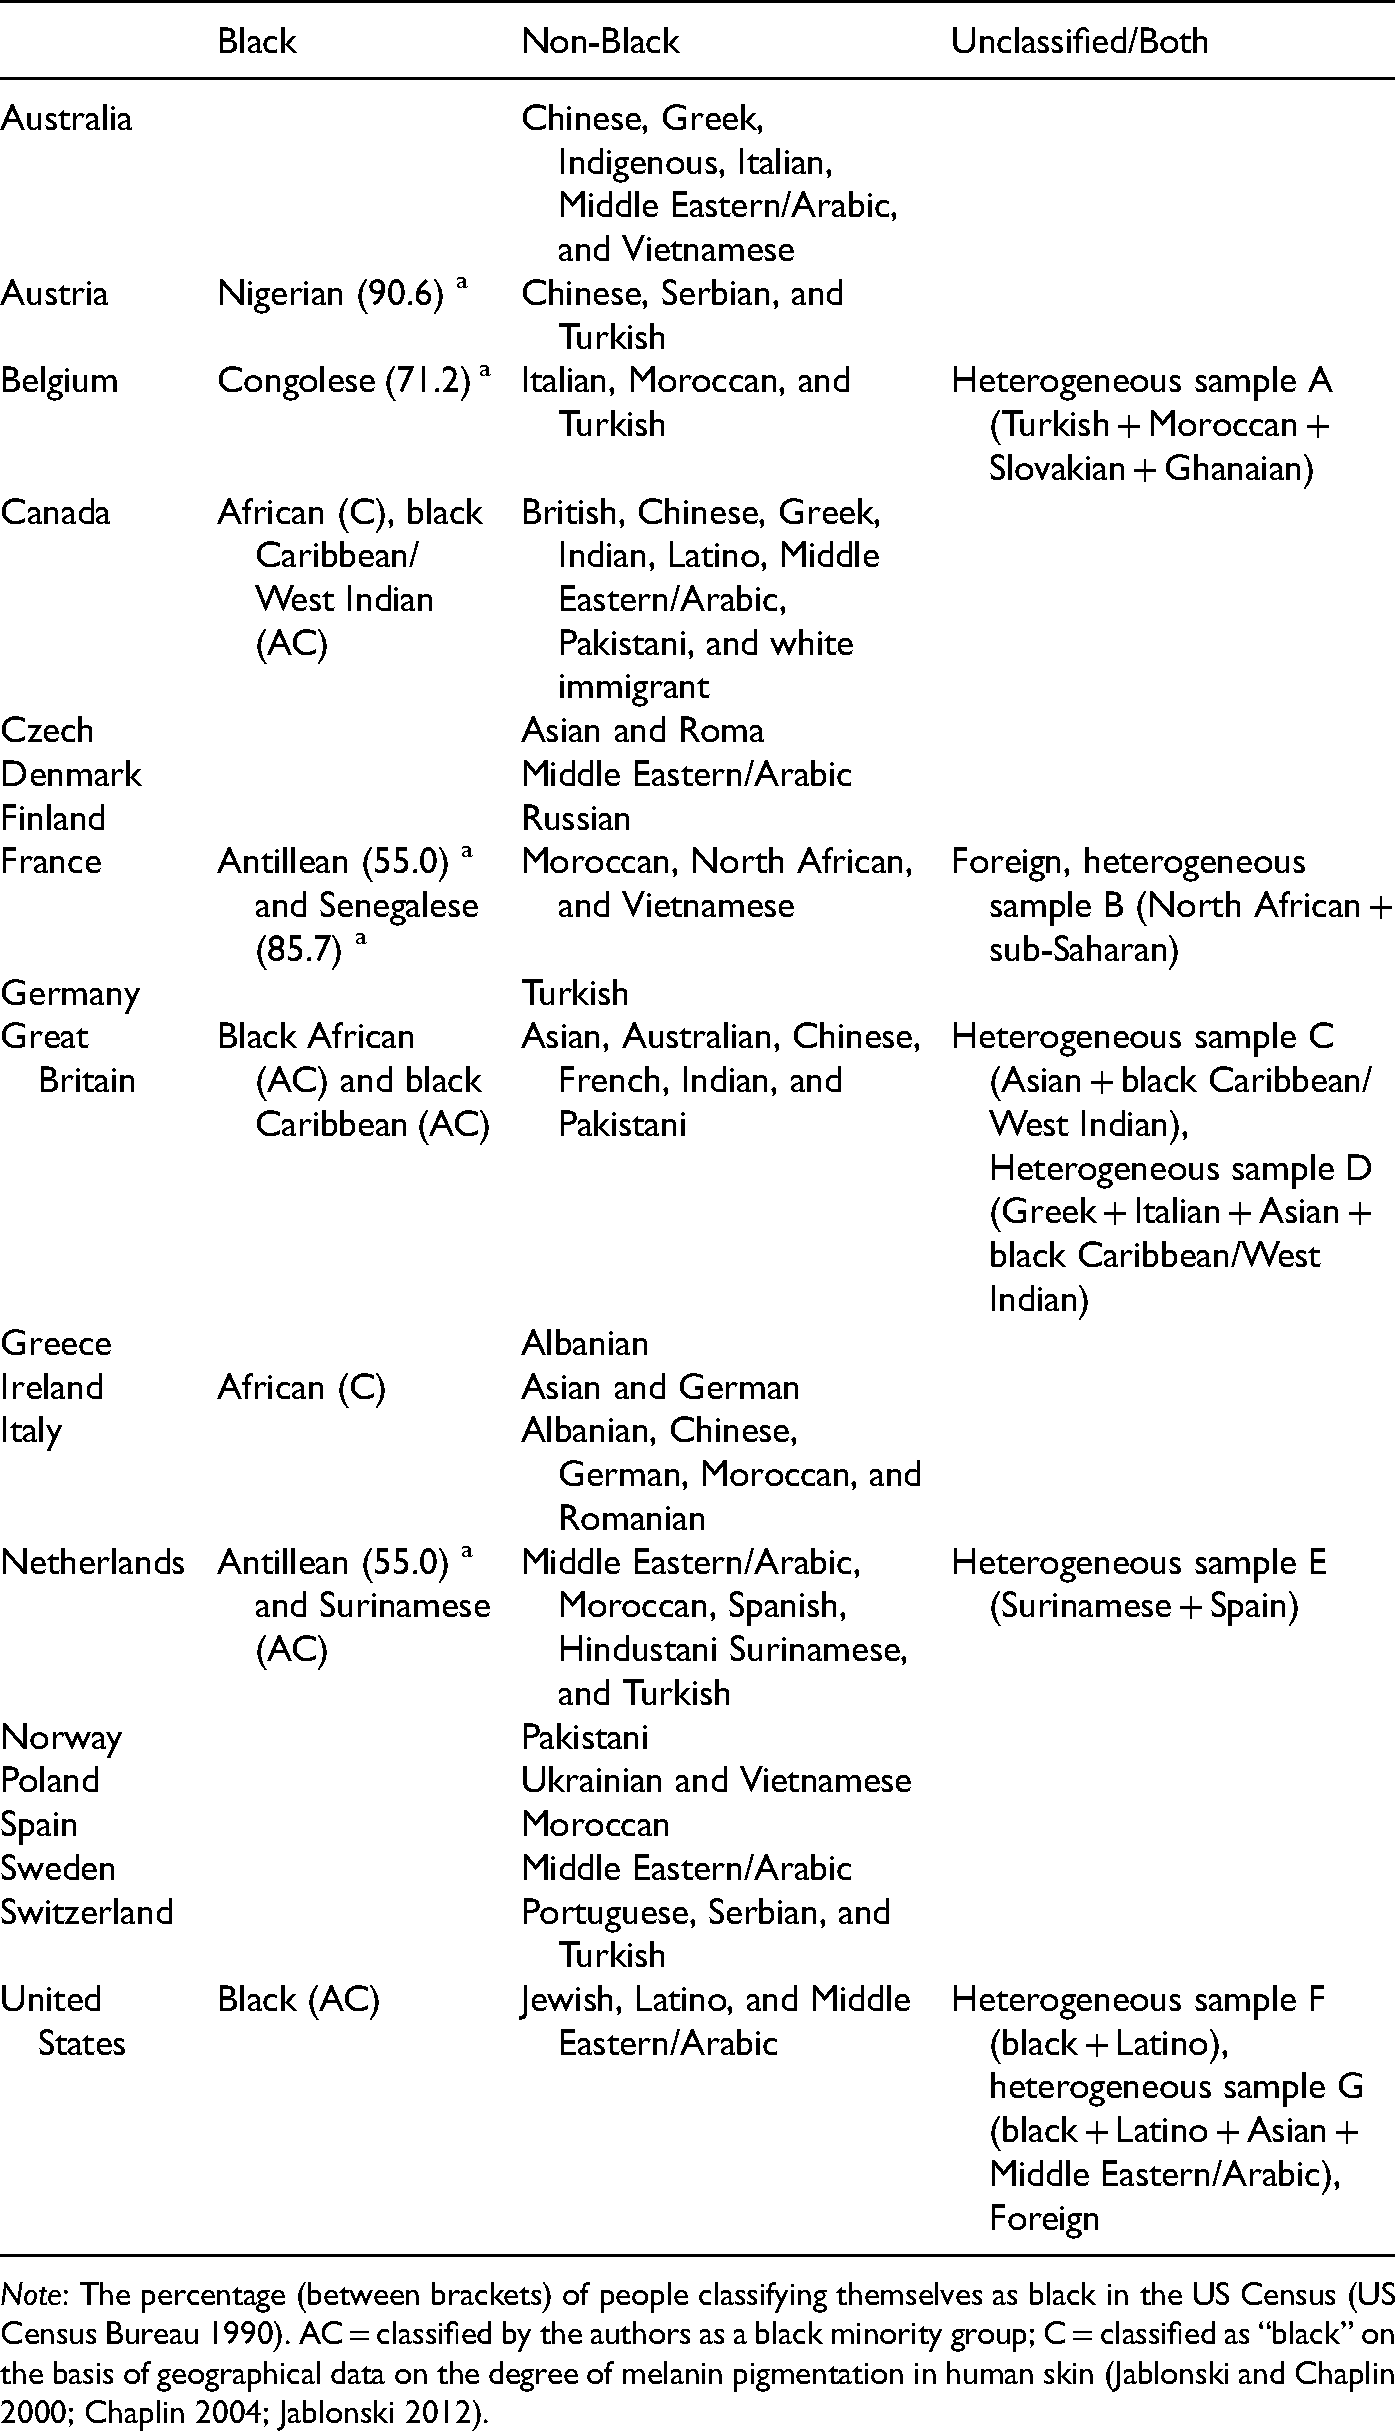
Note: The percentage (between brackets) of people classifying themselves as black in the US Census (US Census Bureau 1990). AC = classified by the authors as a black minority group; C = classified as “black” on the basis of geographical data on the degree of melanin pigmentation in human skin (Jablonski and Chaplin 2000; Chaplin 2004; Jablonski 2012).
Overview of Muslim and non-Muslim Minority Groups per Country.
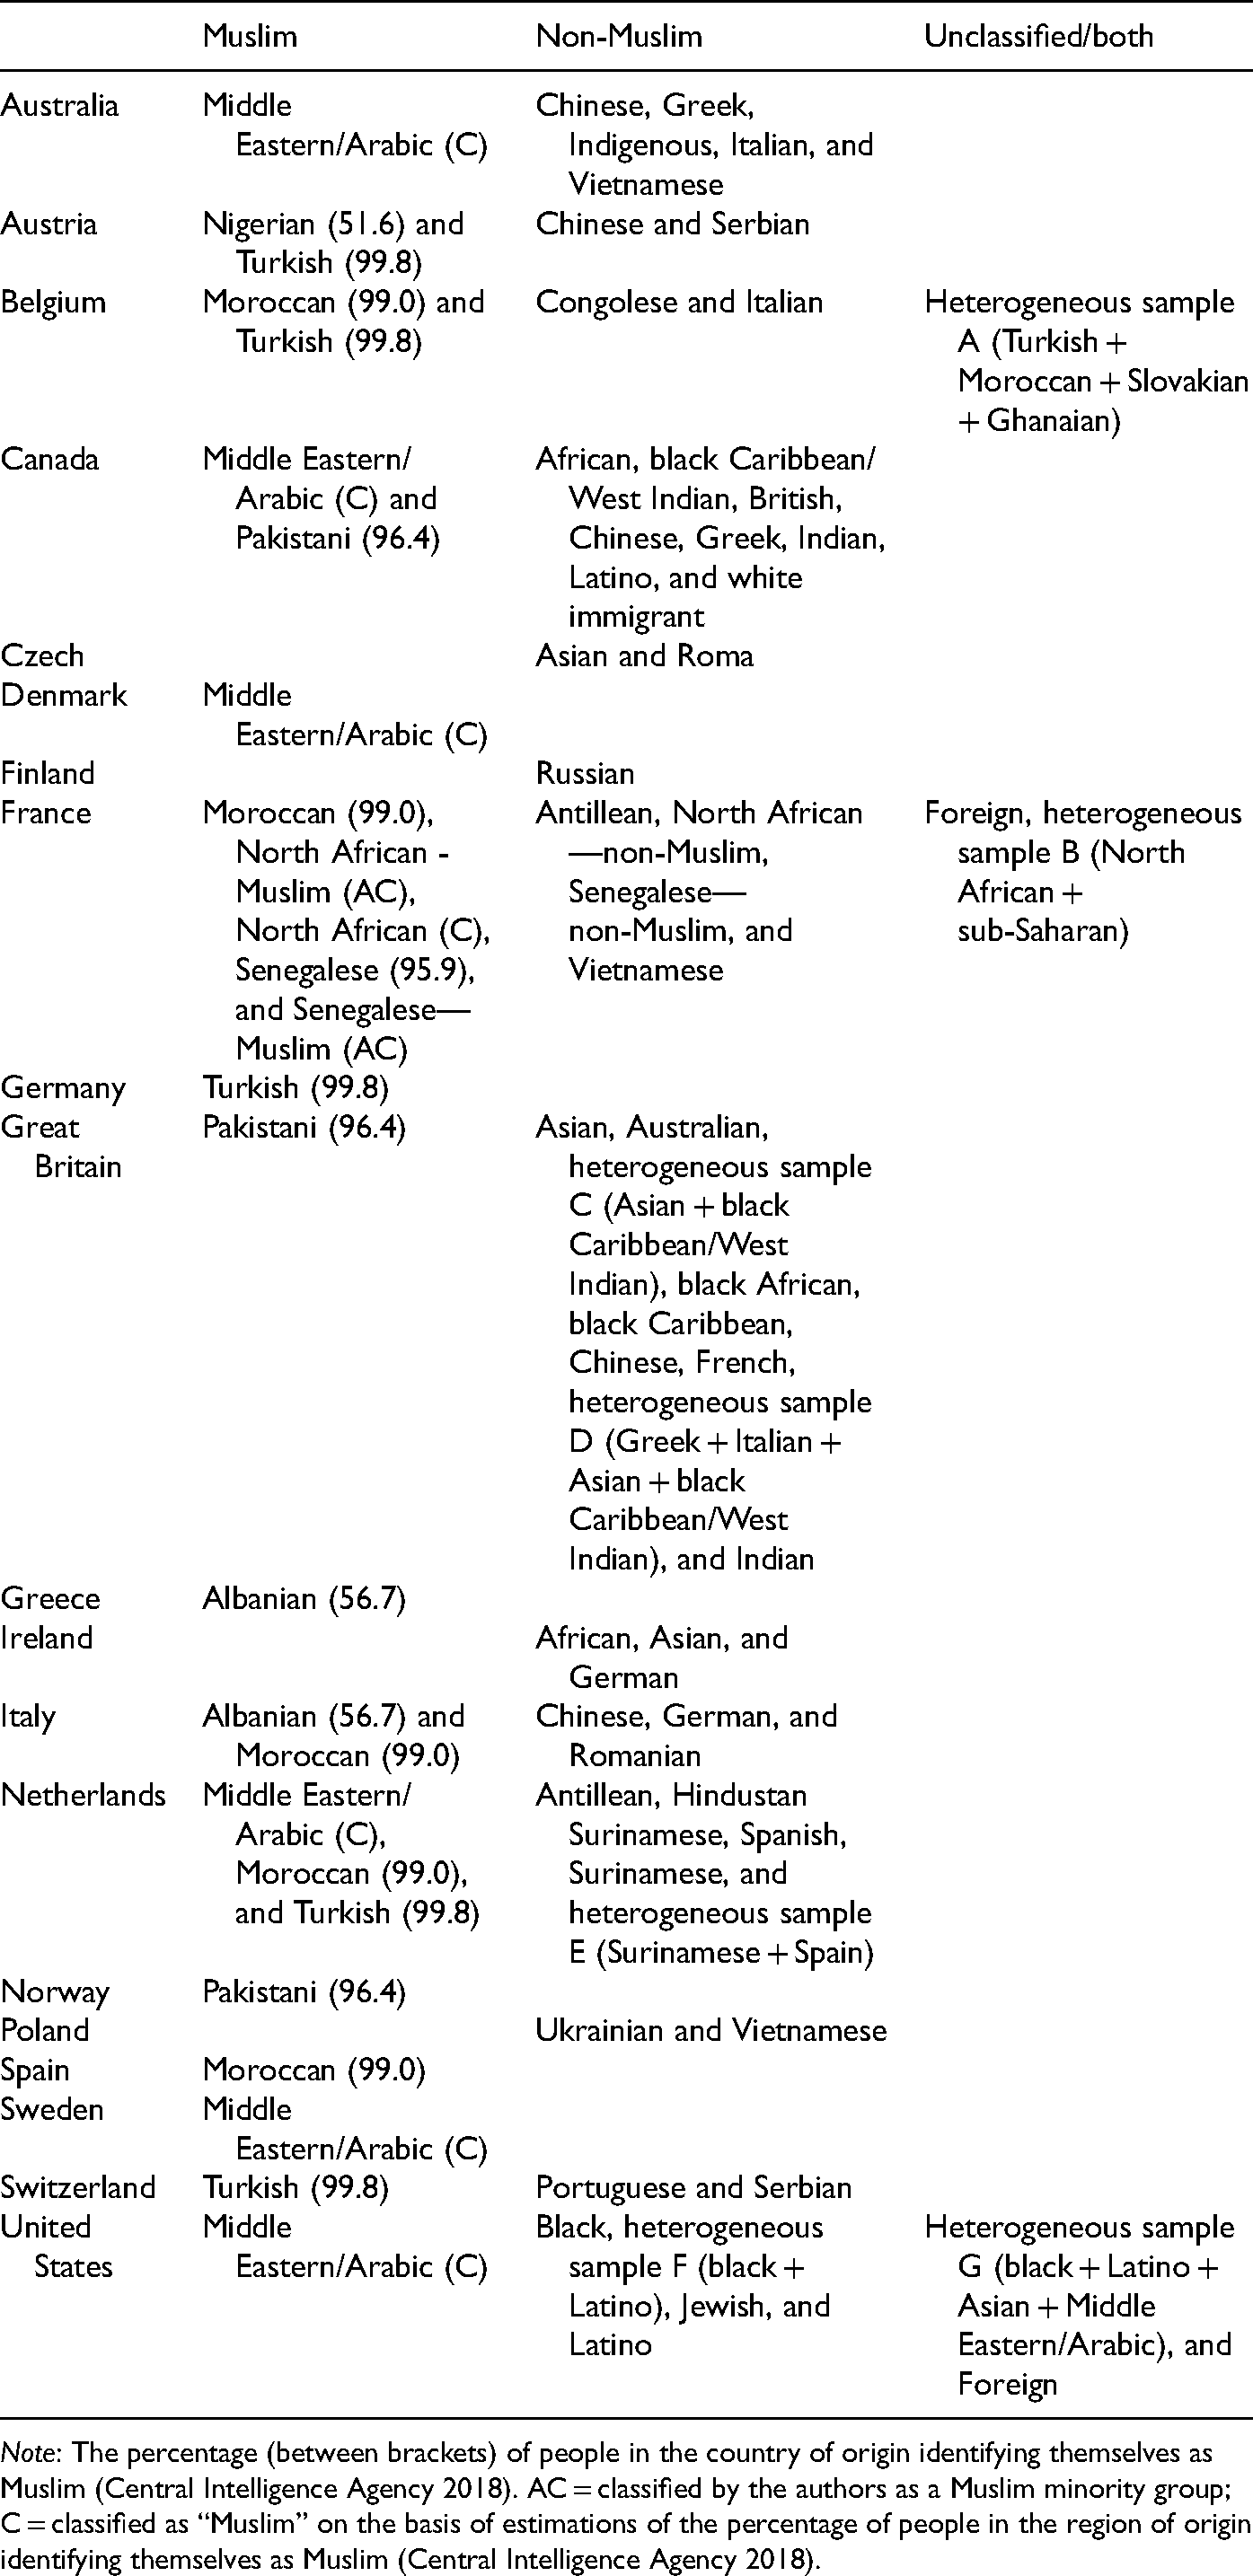
Note: The percentage (between brackets) of people in the country of origin identifying themselves as Muslim (Central Intelligence Agency 2018). AC = classified by the authors as a Muslim minority group; C = classified as “Muslim” on the basis of estimations of the percentage of people in the region of origin identifying themselves as Muslim (Central Intelligence Agency 2018).
Black minority background (subgroup level). First, we examined whether researchers explicitly stated that they investigated a black minority group. If the researcher explicitly classified a racial–ethnic minority group as “black Caribbean” or “black African” (e.g., Wood et al. 2009), a “black immigrant group” (e.g., Bovenkerk, Gras, and Ramsoedh 1995: Surinamese minorities), or “Afro-American” (e.g., Pager 2003), we coded this group as “black.” This information was not always provided, however. In such cases, we used census data on the racial self-classification of immigrant groups in the United States (US Census Bureau 1990) to indicate whether a racial–ethnic minority group can be considered black. 4 In particular, we coded a minority group as black if the percentage of people classifying themselves as black was >50 percent. Table 1 presents information about the percentage of people classifying themselves as black for each remaining minority group. Finally, we coded a group specified only as “African” also as “black” because research on the degree of melanin pigmentation in human skin indicates that people of African descent are highly likely to have a dark skin color (Jablonski 2012). One minority group was difficult to classify: Surinamese Hindustani. Although researchers in the Netherlands mostly study Surinamese minorities as a “black immigrant group” (e.g., Bovenkerk, Gras, and Ramsoedh 1995), we decided to code Surinamese Hindustani as non-black because this specific minority group originated from northern India (Kalmijn and Van Tubergen 2006) and because the study that investigated Surinamese Hindustani only signaled ethnicity through the fictitious job applicants’ names (Andriessen et al. 2015). As a robustness check, we examined whether we obtain similar results when we excluded this specific minority group. Ultimately, black minority background consists of the following categories: black, non-black, and unclassified/both (i.e., subgroups that could not be classified—for example, those labeled as “foreign”—and heterogeneous samples including black and non-black minority groups).
Muslim minority background (subgroup level). We distinguish between racial–ethnic minority groups with a dominant Islamic background and minority groups with no dominant Islamic background. To create this measure, we first examined whether researchers mentioned explicitly that they investigated a Muslim minority group. For example, Adida, Laitin, and Valfort (2016) and Pierné (2013) made a clear distinction between job applicants (with a similar origin country/region) who were either openly Muslim or Christian. The former was classified as “Muslim,” the latter as “non-Muslim.” When explicit information was lacking, we categorized a minority group as a Muslim minority group if more than 50 percent of the population in the origin country considered themselves Muslim, according to data from the Central Intelligence Agency World Factbook (Central Intelligence Agency 2018); other groups are classified as non-Muslim minority groups. Indeed, various studies on religious integration indicate that immigrants or the children of immigrants originating from predominantly Muslim countries are highly likely to regard themselves as Muslim (Fleischmann and Phalet 2012; Lagrange 2014; O’Brien and Potter-Collins 2015; Huijnk 2018). Table 2 presents information about the percentage of people classifying themselves as Muslim in each origin country of the remaining minority groups. We also classified groups broadly labeled as “North African” and “Middle Eastern/Arabic” as “Muslim” because Muslims make up the majority of the population within these regions (Central Intelligence Agency 2018). We identified four groups that are difficult to classify: Albanians and Nigerians, because the percentage of the population in the origin country that identify as Muslim is close to 50 percent (52% and 57%, respectively), and Indo-Pakistani and African/Senegalese, because the description of the included minority groups was unclear. In the main analysis, we, nevertheless, coded these four groups as “Muslim.” As a robustness check, we investigated whether we obtained similar results when excluding these difficult-to-classify groups. In the end, the variable Muslim minority background differentiates between Muslim, non-Muslim, and unclassified/both (i.e., subgroups that could not be classified—for example, those labeled as “foreign”—and heterogeneous samples including Muslim and non-Muslim minority groups).
Coding of Control Variables
To examine the role of having a black and Muslim minority background on discrimination ratios, we take into account the potentially biasing influence of other characteristics of studies and subgroups.
Publication status (study level). This variable consists of three categories: studies published in peer-reviewed journals, unpublished studies or working papers, and government reports.
Interactions with race–ethnicity (study level). Although many studies primarily focused on establishing racial–ethnic discrimination, this form of discrimination was not the main focus in every study. Possibly, this could have influenced the observed level of racial–ethnic discrimination (cf. Quillian et al. 2017), leading to increased or decreased levels of discrimination. Therefore, we included a dichotomous variable that indicates whether race–ethnicity was manipulated in combination with another characteristic (e.g., criminal record, extracurricular activities, unemployment spells, and work experience) (e.g., Pager 2003; Baert and Vujić 2016; Baert et al. 2017; Birkelund, Heggebø, and Rogstad 2017).
Scientific discipline (study level). Based on the journal in which a study was published or the authors’ affiliations for unpublished studies, we distinguished between sociology, economics, criminology, and others (e.g., political science, multidisciplinary teams, and government reports).
Experimental design (subgroup level). Studies are coded as an in-person audit (telephone or face-to-face), a correspondence test (application letters or CVs), or if both methods are used and no clear distinction could be made, as combined.
Number of fictitious applicants (subgroup level). The number of applications per employer differed drastically between studies. We distinguish between studies in which only one fictitious candidate applied for a job, studies in which two to four fictitious candidates applied for a job, and studies in which six or more fictitious candidates applied for a job. Note that there were no studies with five fictitious job candidates.
Research period (subgroup level). We coded the year in which each study was conducted, or if this information was missing, we took the year before the year of publication. Concretely, we distinguish between studies that were carried out before 2000, between 2000 and 2004, between 2005 and 2009, and between 2010 and 2018.
Demand for labor (subgroup level). Various scholars (Becker 1957; Baert et al. 2015; Midtbøen 2015) have suggested that racial–ethnic minorities face less discrimination when there is a high demand for labor, possibly affecting cross-national variation in discrimination rates of different racial–ethnic groups. Therefore, we include the majority candidate's callback rate as an indicator of the demand for labor. We mean-centered this variable across all subgroups. Higher values indicate a greater demand for labor. 5
Gender of applicants (subgroup level). Several researchers have claimed that race–ethnicity and gender interact with each other (Andriessen et al. 2012; Di Stasio and Larsen 2020). To take this interaction into account, we differentiate between subgroups in which only male applicants were included, subgroups in which only female applicants were included, and subgroups where it was not possible to clearly distinguish gender because no separate results for males and females were provided.
Educational level (subgroup level). Based on the description in the study text, we coded the educational level, using the International Standard Classification of Education classification scheme. For studies without detailed information, we classified the educational level based on the available information in the text and general job descriptions. In the analysis, we differentiate between jobs that require a primary or secondary educational level, jobs that require a tertiary educational level, and studies that did not share any specific information about the educational level.
Interpersonal skills (subgroup level). Based on the descriptions in the text, a variable for interpersonal skills is created. Jobs that require relatively more interpersonal skills are characterized by more customer/client contacts, teamwork, and/or maintaining or expanding social networks (Lee and Lee 2015). Other jobs, by contrast, require more instrumental skills—that is, workers are required to handle simple or complex tools and machines (Lee and Lee 2015). We distinguish between jobs with more interpersonal skills (e.g., lawyer, consultant, doctor, teacher, receptionist, and nurse), jobs with fewer interpersonal skills (e.g., accountant, electrician, factory worker, cleaner, software developer, and carpenter), and subgroups for which we were unable to make this distinction (other).
Results
Before we turn to our main results, we first consider the impact of publication bias and outliers. 6
Publication Bias
We used various methods to assess the potential impact of publication bias (Viechtbauer 2010): funnel plots, Begg's test, Egger's test, and testing for differences between published and unpublished field experiments. Because of the data's multilevel structure (subgroups nested within studies), we use these methods at both the subgroup and study level (the last test can only be done at the study level, however). A detailed description of all analyses is presented in the Online Appendix.
Overall, we find inconclusive evidence about whether the discrimination ratios found are affected by publication bias. Begg's rank order test produced insignificant results. Similarly, unpublished studies documented no significantly different discrimination ratios than published studies, suggesting a limited effect of publication bias. However, based on the results of funnel plots and Egger's test, we cannot rule out that subgroups and studies with small or unexpected negative effects are underrepresented in our meta-analysis, potentially leading to an upwardly biased overall discrimination ratio.
Descriptive Analysis and the Impact of Outliers
This section aims to provide a descriptive overview of the variation in the discrimination ratio across field experiments. Also, we investigate the role of outliers, as they might have a strong impact on the overall discrimination ratio. The discrimination ratio is defined as the ratio of the majority candidate's callback rate to the minority candidate's callback rate. We use the natural log of the discrimination ratio because the logged effect size is approximately normally distributed. The log transformation makes the calculation of the sampling variances (which is required to conduct the meta-analysis) much easier (Lipsey and Wilson 2001; Cooper, Hedges, and Valentine 2019) and places the effect sizes on a symmetrical scale with zero representing no discrimination. The descriptive analysis includes 642 subgroups and 96 studies (see Table A2 in the Online Appendix). All outlier analyses were conducted in R, using the metafor-package (Viechtbauer 2010).
Figure 1 shows an overview of the natural log of the discrimination ratio per study (sorted from the lowest to highest values). The average discrimination ratio is 1.44 (natural log of the discrimination ratio = 0.368; e0.368 = 1.44) (95 percent CI [0.311, 0.425]), indicating that majority candidates received a callback rate that was 44 percent greater than that for minority candidates. Nevertheless, as is shown in Figure 1, the natural log of the discrimination ratio varied substantially between studies. Most studies found that racial–ethnic minorities were discriminated against; however, a small number of studies found no evidence of discrimination (e.g., Newman 1978; Bendick et al. 1991; Büyükbozkoyum, Stamatiou, and Stolk 1991; Deming et al. 2016), and one study provided evidence of positive discrimination of minority candidates (McIntyre, Moberg, and Posner 1980).
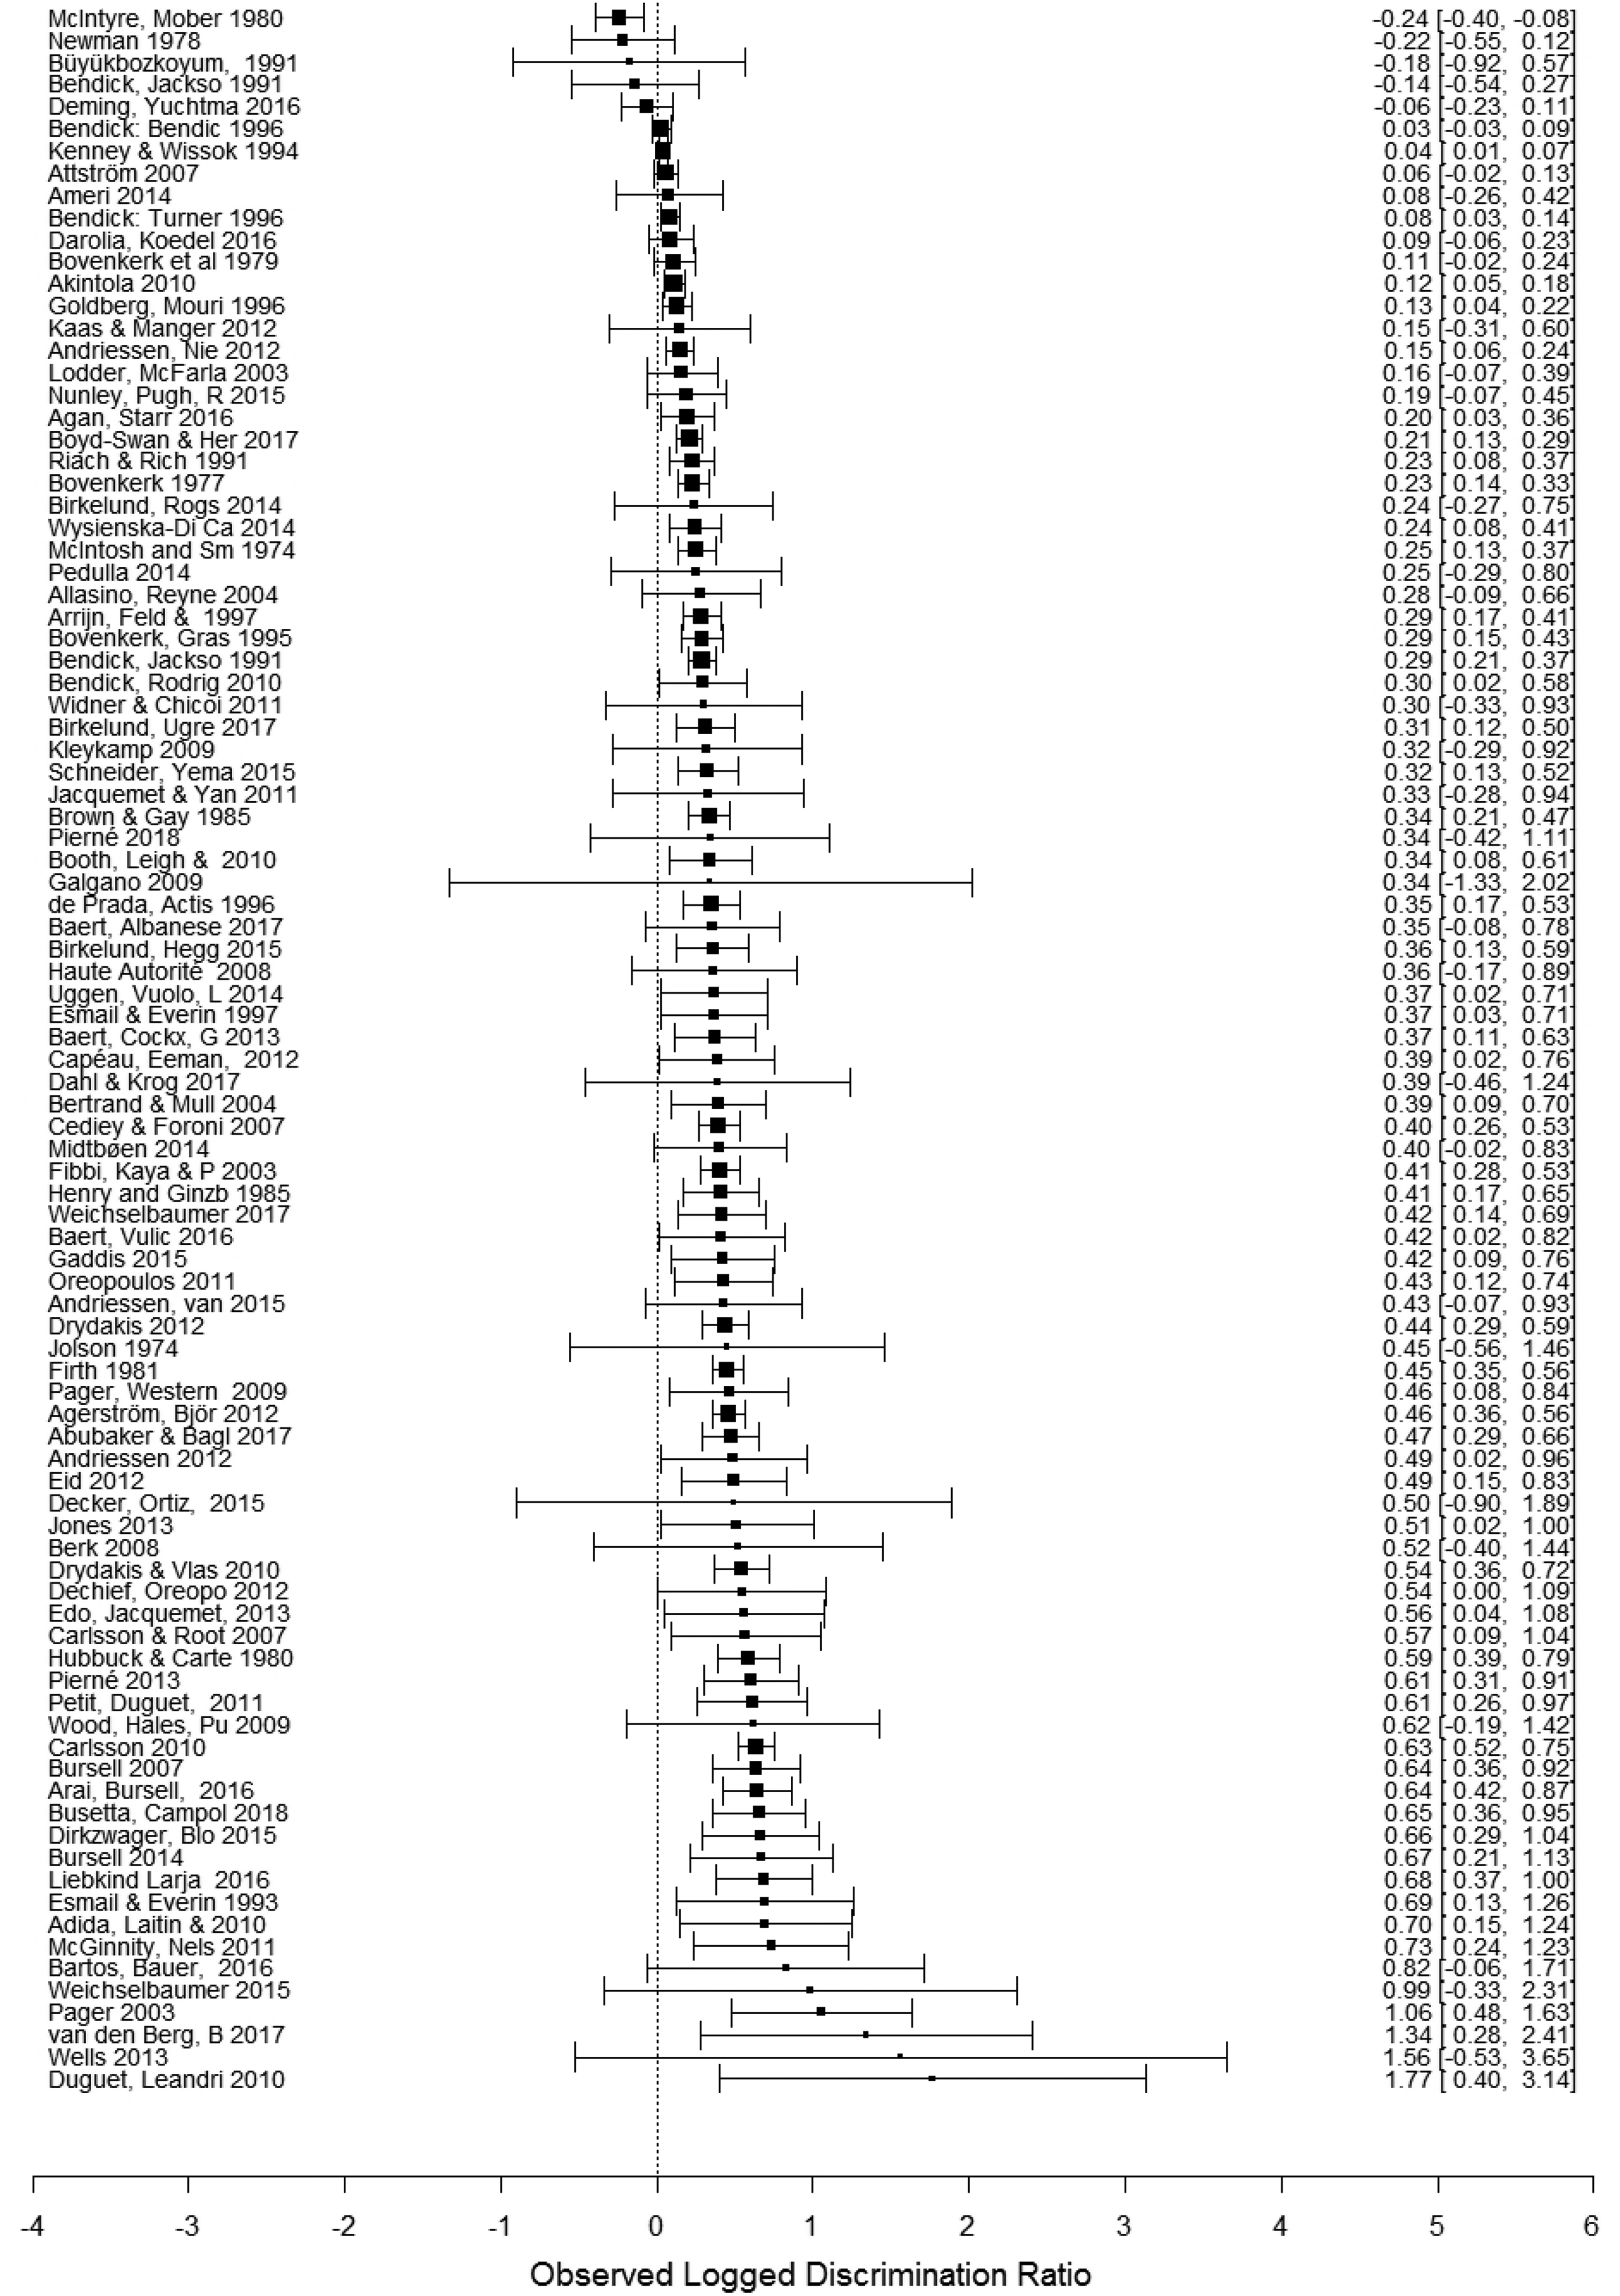
Natural log of discrimination ratio for studies (N = 96). Note: The discrimination ratio is defined as the ratio of the callback rate of the majority candidate to the ratio of the callback rate of the minority candidate. The natural log of the discrimination ratio is used because the logged effect size is approximately normally distributed. Studies are sorted from low to high values.
Next, we identified several outlying studies (N = 2, consisting of four subgroups in total) or subgroups (N = 9) on the basis of Cook's distance (e.g., highly influential discrimination estimates) and sampling variance (e.g., high degree of heterogeneity due to the considerable differences in sample size) (see also Viechtbauer 2010). Excluding these studies and subgroups slightly reduced the average discrimination ratio from 1.44 to 1.40 (log of the discrimination ratio = 0.335 [95 percent CI (0.287, 0.384)]). Given the risk of publication bias, which would result in an inflated estimate of the discrimination ratio, we decided to use the dataset that leads to the most “conservative” discrimination ratio. After removing outliers and two subgroups with missing values on one independent variable (i.e., demand for labor), the final dataset consisted of 629 subgroups and 94 studies. 7 Descriptive statistics of all predictor variables are displayed in Table A2 in the Online Appendix.
Descriptive Findings on Differences in Discrimination Ratios Across Groups and Countries
Before turning to the multivariable analysis, we first look at descriptive findings. For this analysis, we calculated the discrimination ratio by dividing the majority candidates’ callback rate by the minority candidates’ callback rates for each minority group included. A value of 1 indicates equal treatment of minority and majority candidates, a value above 1 indicates (higher) discrimination against racial–ethnic minority groups, and a value under 1 indicates positive discrimination against minority groups. For black and non-black (respectively, Muslim and non-Muslim) minority groups separately, we averaged these discrimination ratios, first, per study and, then, per country. As a result, we obtain for each country an (unconditional and unweighted) average discrimination ratio for black, non-black, Muslim, and non-Muslim minority groups (the number of subgroups and studies by country and minority group are displayed in Table A3 in the Online Appendix).
Surprisingly, in our sample of 20 countries, black minority groups were studied in only eight of them (Austria, Belgium, Canada, France, Great Britain, Ireland, the Netherlands, and the United States). Table 3 shows that discrimination ratios for black minority groups were higher than for non-black minority groups: the overall discrimination ratio was 1.9 for black minority groups and 1.7 for non-black minority groups. We do not find that in each country, black minority groups were more discriminated against than non-black minority groups. Differences in discrimination ratios between black and non-black minority groups only appeared substantial in four countries: Austria, France, Great Britain, and Ireland. We find relatively low levels of discrimination against black minorities—relative to other groups—in the United States. This result is mainly due to a study finding strong discrimination against Muslim minorities. Excluding this study decreased the discrimination ratio of non-black minority groups (i.e., Jewish and Latinx) to 1.2.
Unadjusted Discrimination Rates for Black and Non-Black Minority Groups per Country.
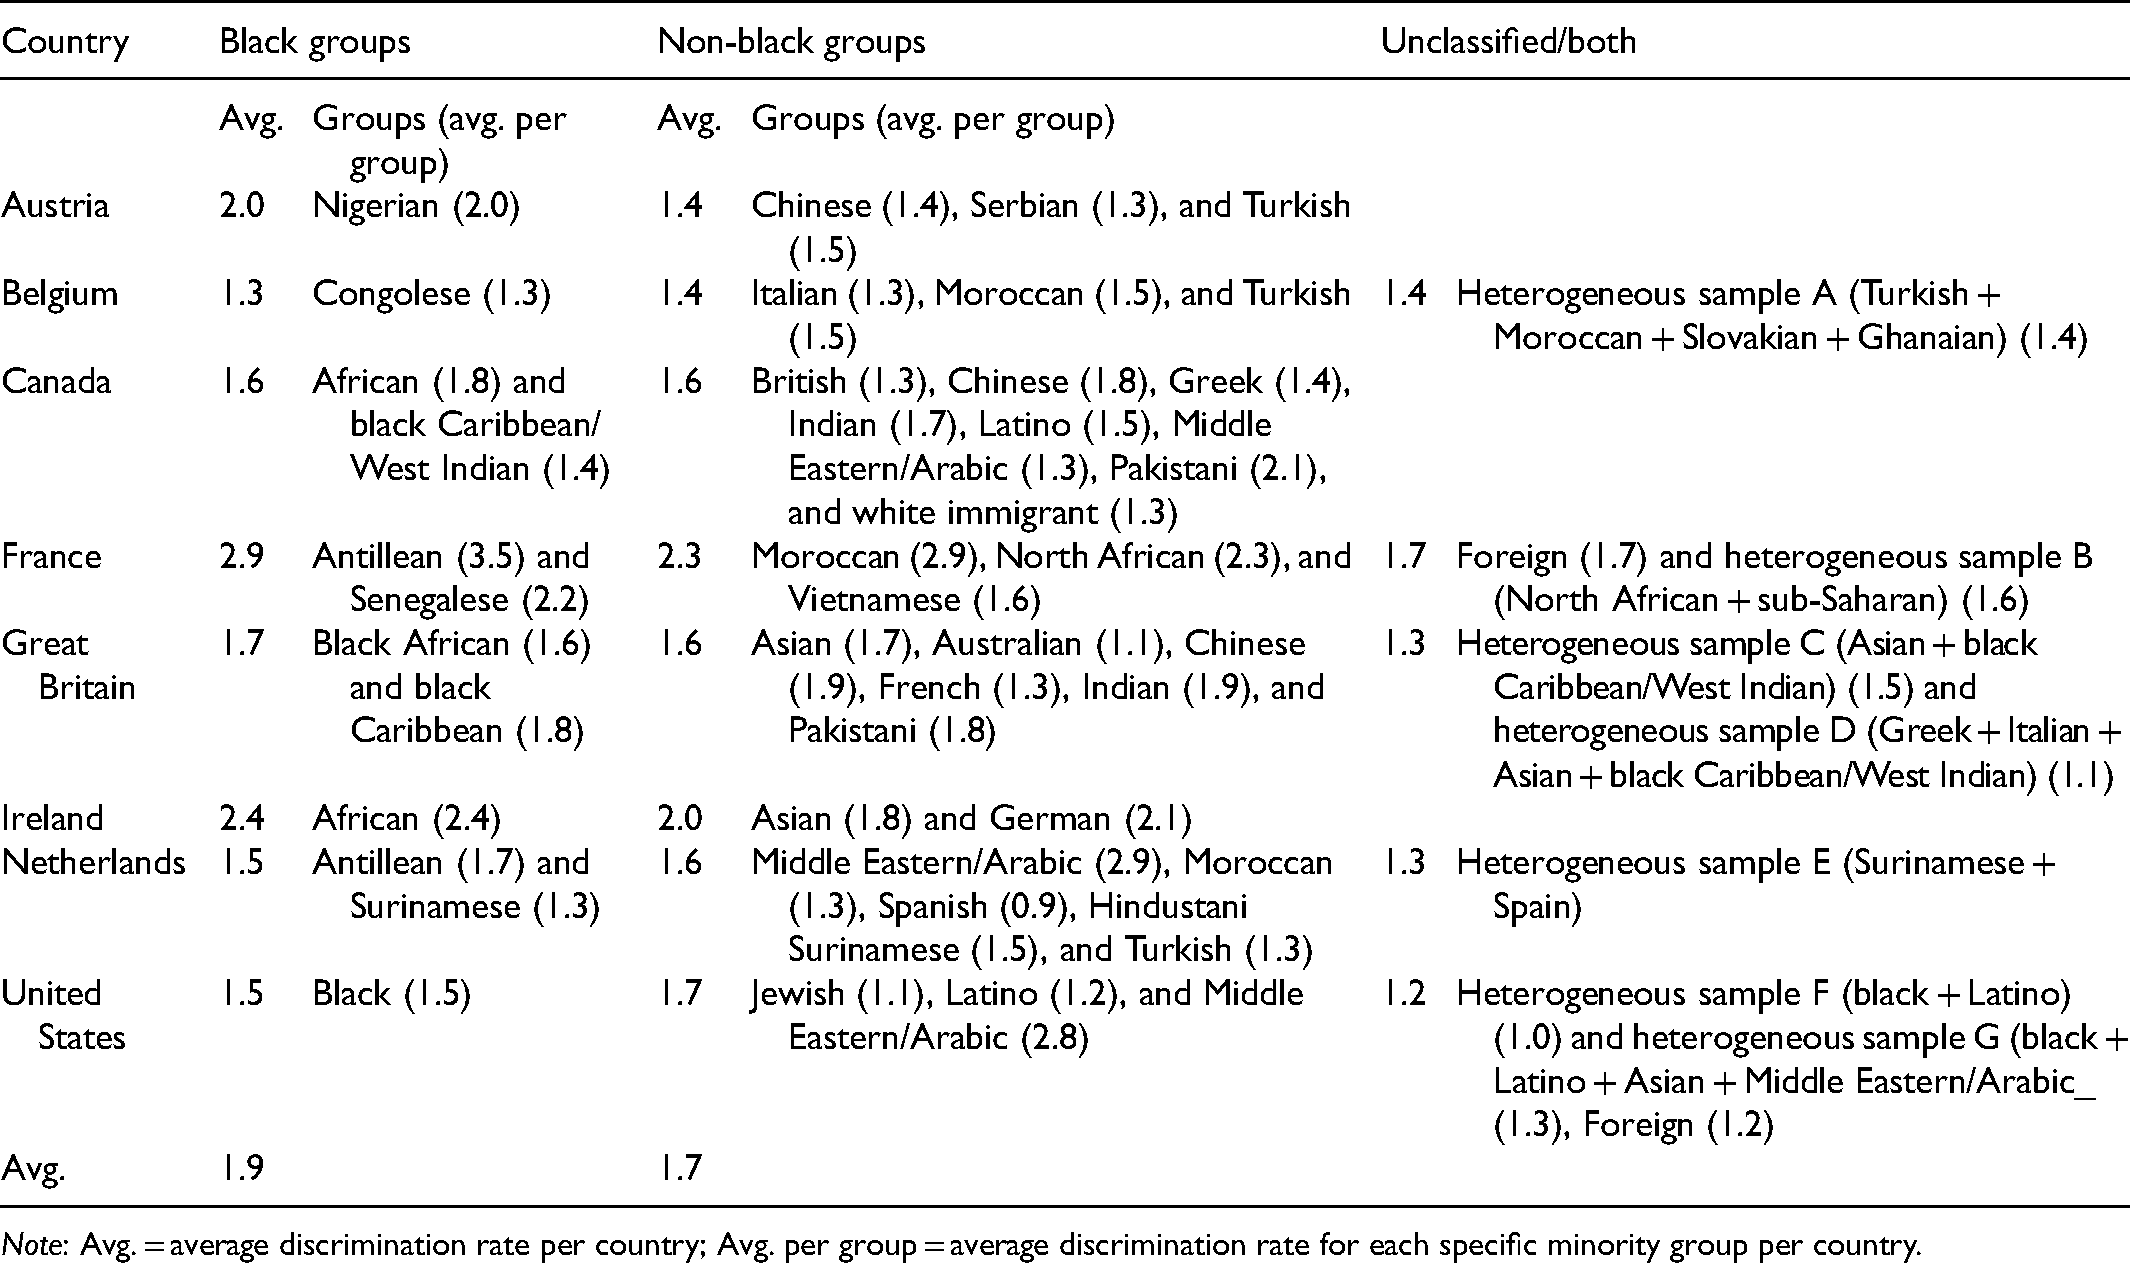
Note: Avg. = average discrimination rate per country; Avg. per group = average discrimination rate for each specific minority group per country.
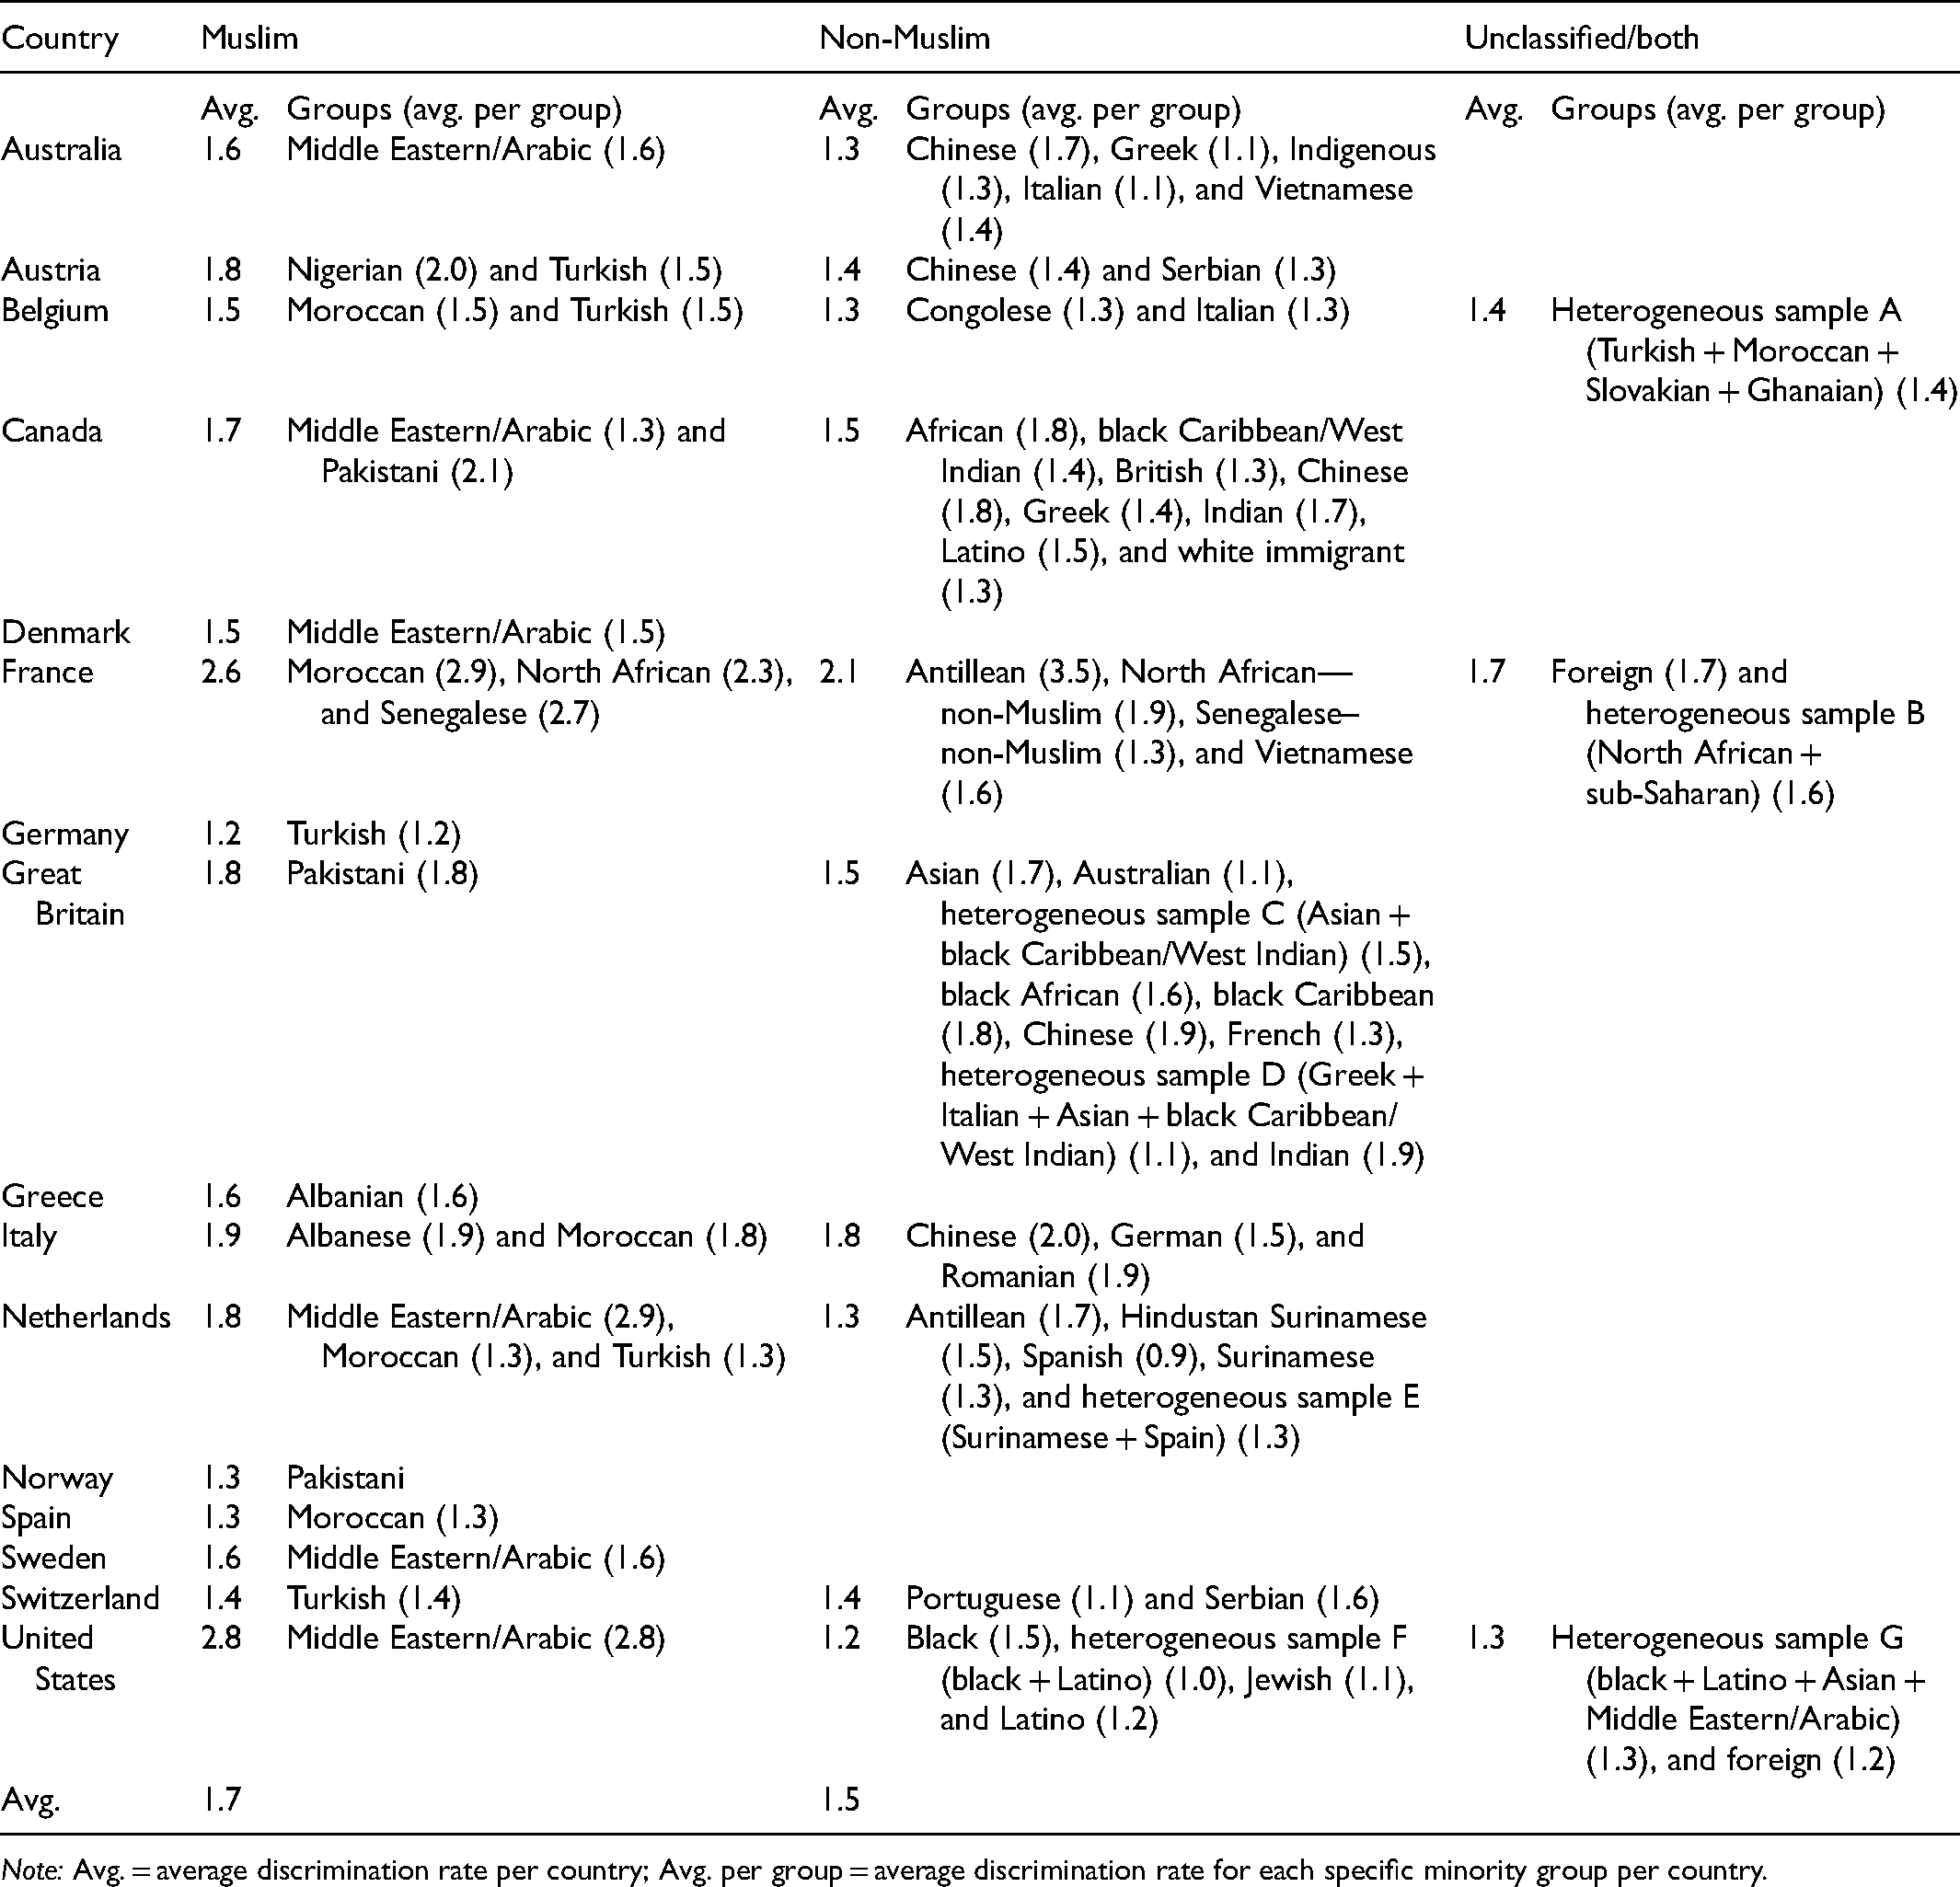
Table 4 presents the observed discrimination ratios for Muslim and non-Muslim minority groups per country. Muslim minority groups were studied in 16 of the 20 countries in the data. In six countries (Denmark, Germany, Greece, Norway, Spain, and Sweden), researchers only investigated Muslim minority groups, making it impossible to disentangle anti-Muslim bias from antiminority bias. Thus, while Muslim minorities were investigated in various national contexts, in most countries, there was no comparison minority group.
Unadjusted Discrimination Rates for Muslim and Non-Muslim Minority Groups per Country.
Note: Avg. = average discrimination rate per country; Avg. per group = average discrimination rate for each specific minority group per country.
Across all countries, the discrimination ratio of Muslim minority groups was slightly higher than that of other minority groups: 1.7 for Muslim minority groups and 1.5 for non-Muslim minority groups. However, the difference between these two groups was larger when looking exclusively at countries in which researchers studied both Muslim and non-Muslim minority groups. Within this group of 10 countries, the overall discrimination ratio was 1.9 for Muslim minority groups and 1.5 for non-Muslim minority groups. Moreover, in nine of the 10 countries, Muslim minorities tended to face higher levels of discrimination than other groups.
Next, there was some cross-national variation in the level of discrimination against Muslim minority groups. For instance, the discrimination ratios of Moroccan minorities appeared to be higher in France and Italy than in Belgium, the Netherlands, and Spain. As for Turkish minorities, we noticed less pronounced differences across countries, however (i.e., Austria, Belgium, Germany, Netherlands, and Switzerland). Generally, Muslim minority groups were most likely to be discriminated against in France and the United States, with discrimination ratios of 2.6 and 2.8, respectively. The latter finding is surprising, though it is important to emphasize that only one study investigated discrimination against Muslim minority groups in the United States. 8
Multivariable Results
In Table 5, we show the extent to which discrimination ratios varied between racial–ethnic minority groups and countries while accounting for the precision of discrimination estimates and the potentially biasing influence of other characteristics of studies and subgroups. 9 We conducted a meta-regression with robust variance estimation (Hedges, Tipton, and Johnson 2010), using the R-package “robumeta” (Fisher, Tipton, and Zhipeng 2017). In models 1 and 2, we examine whether members of black and/or Muslim minority groups were more strongly affected by hiring discrimination than members of other minority groups. Whereas model 1 included all subgroups, model 2 excluded subgroups and studies with “unclassified” cases—that is, subgroups that could not be classified and mixed groups including black, non-black, Muslim, and non-Muslim minority groups combined. Excluding these cases leads to a sharper contrast between subgroups with and without members of black and/or Muslim minority groups. Models 1 and 2 do not permit answering the question as to whether discrimination ratios varied cross-nationally because the observed country differences could be biased by the different selections of racial–ethnic minority groups within countries. Therefore, in models 3 and 4, we include only black minority groups and Muslim minority groups, respectively. 10
Meta-Regression Results of log Discrimination Ratio Predicted by Black Minority Background, Muslim Minority Background, Country, and Controls (US = Reference Category).
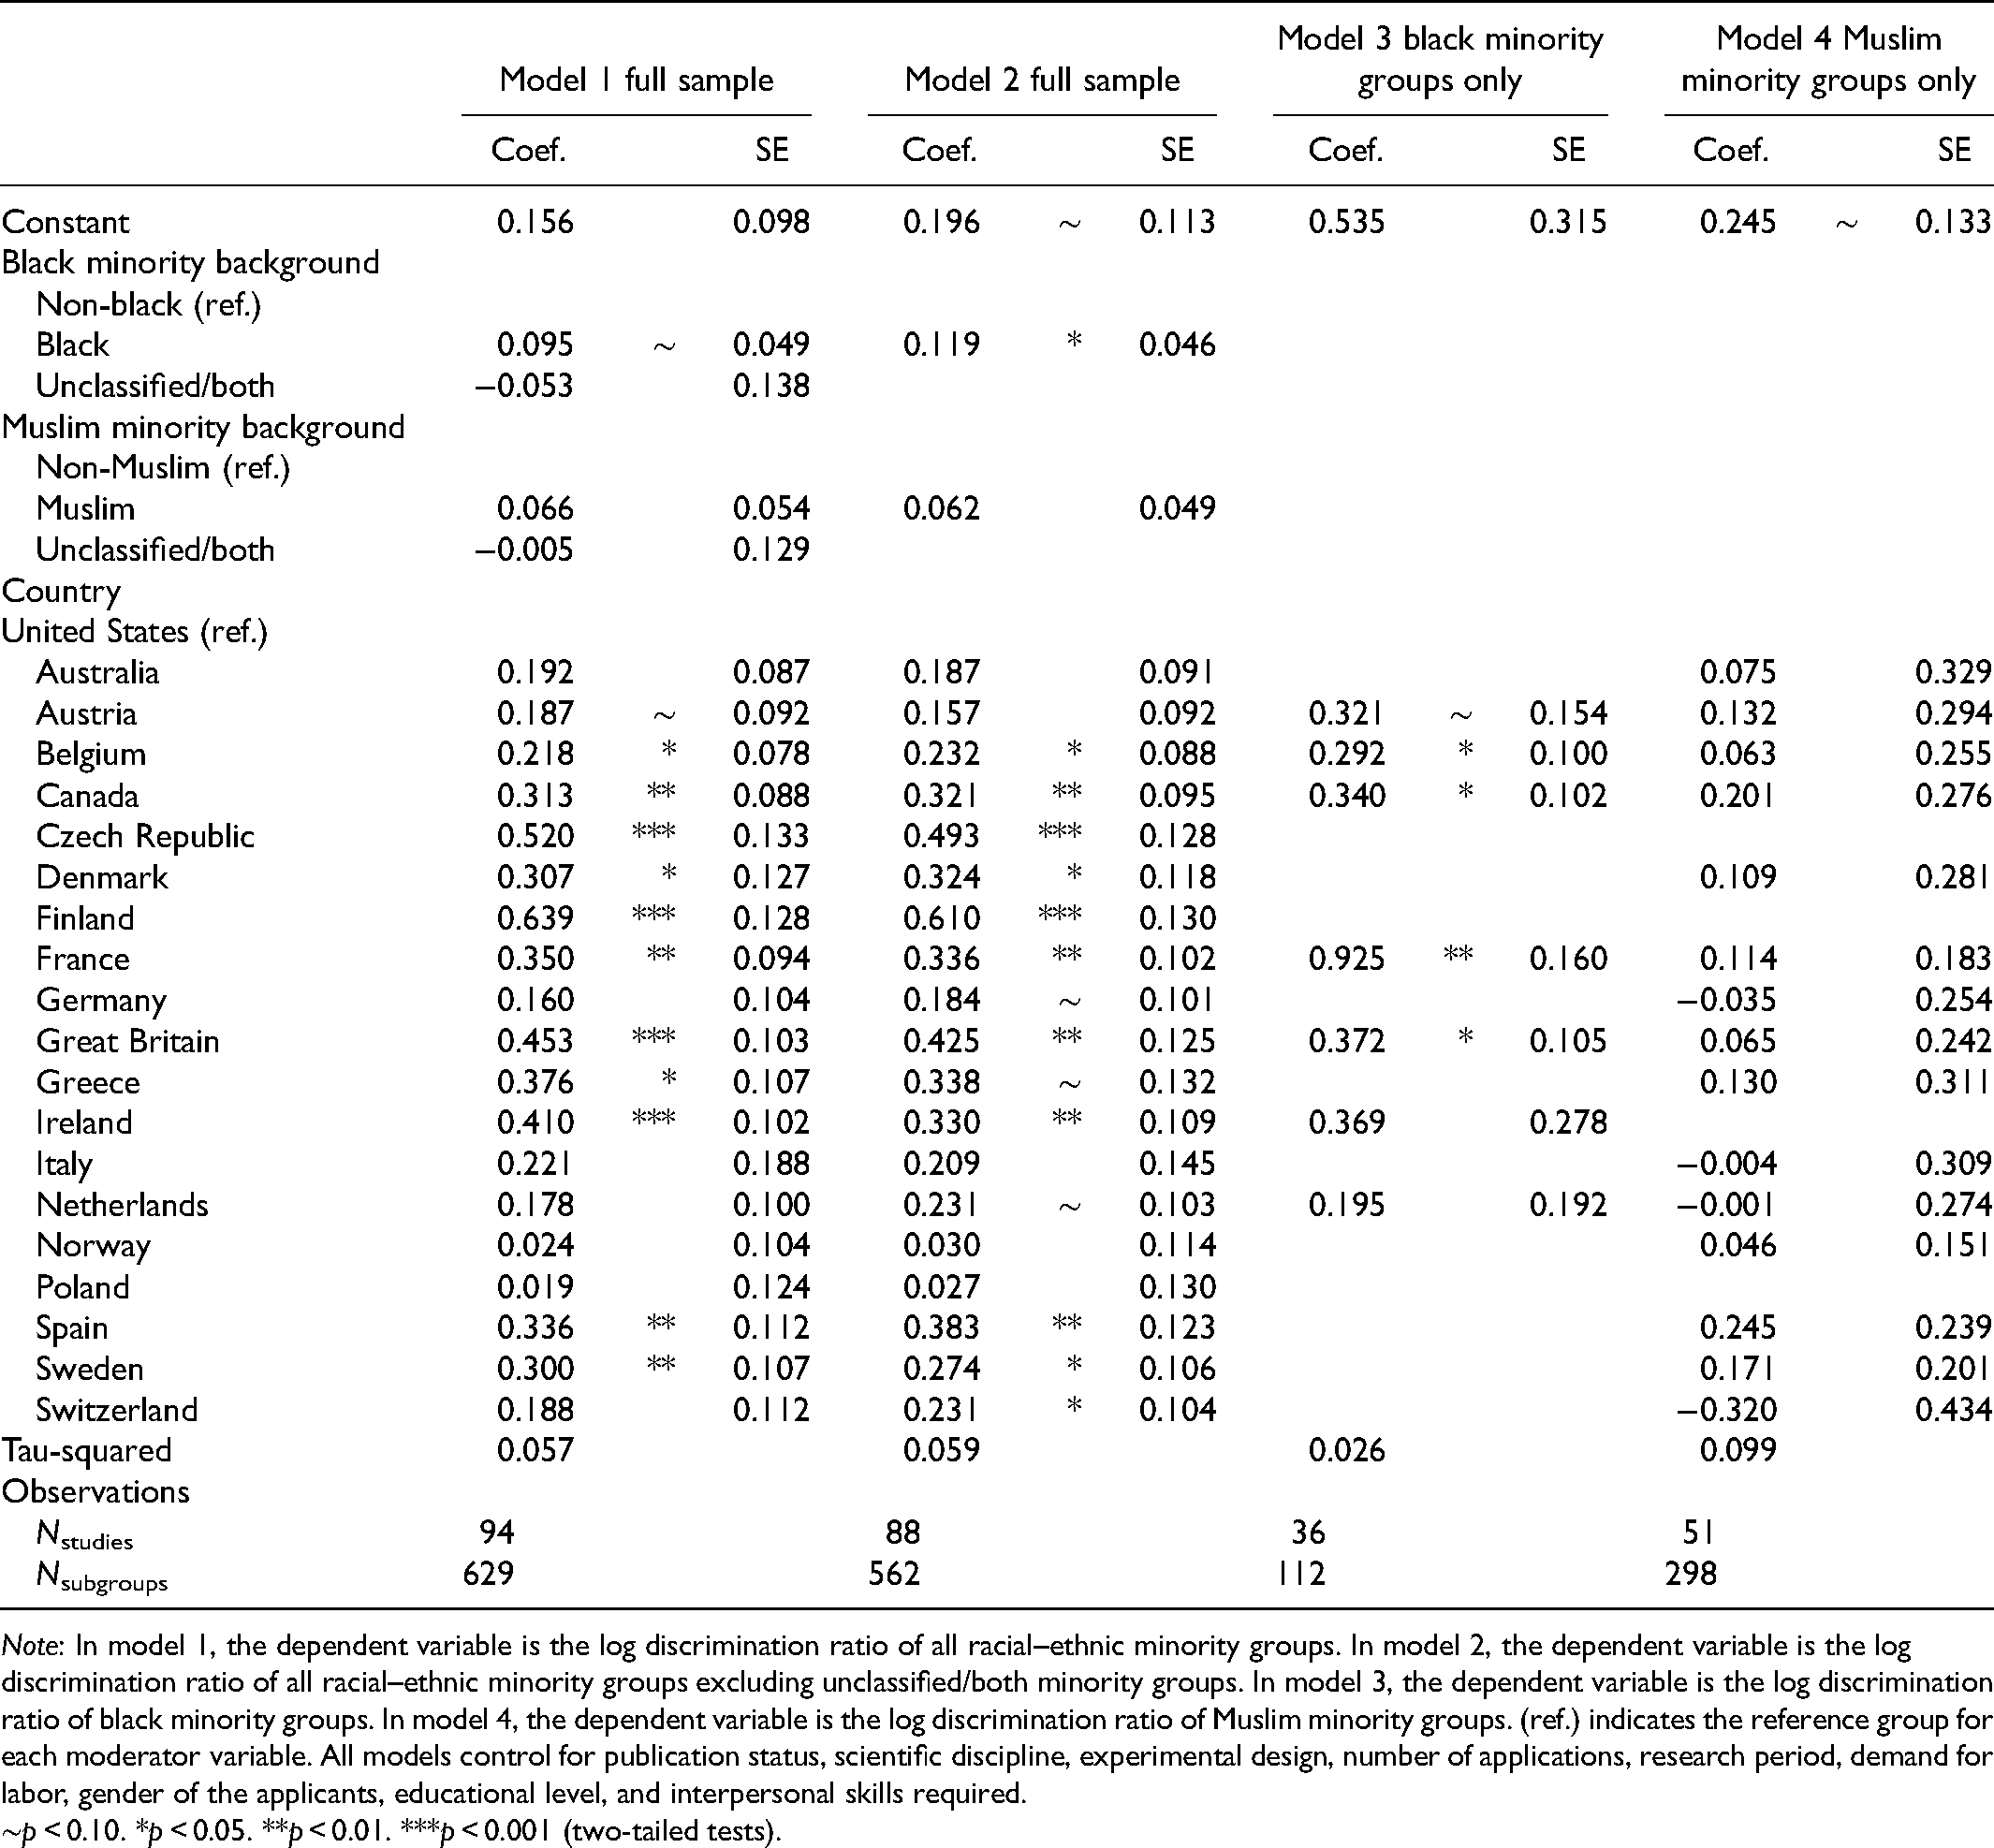
Note: In model 1, the dependent variable is the log discrimination ratio of all racial–ethnic minority groups. In model 2, the dependent variable is the log discrimination ratio of all racial–ethnic minority groups excluding unclassified/both minority groups. In model 3, the dependent variable is the log discrimination ratio of black minority groups. In model 4, the dependent variable is the log discrimination ratio of Muslim minority groups. (ref.) indicates the reference group for each moderator variable. All models control for publication status, scientific discipline, experimental design, number of applications, research period, demand for labor, gender of the applicants, educational level, and interpersonal skills required. ∼p < 0.10. *p < 0.05. **p < 0.01. ***p < 0.001 (two-tailed tests).
Hypothesis 1 was that black minority groups faced more employment discrimination than non-black minority groups. The results in model 1 indicate that the estimated discrimination ratio of black minority groups was higher than that of non-black minority groups (coef. = 0.095, p = 0.032 [one-tailed test]). To put these findings in perspective, the intercept indicates that the discrimination ratio for non-black minority groups was 1.117 (e0.156), holding other variables at zero; the discrimination ratio for black minority groups would be 1.285 (e[0.156+0.095]). Also, in model 2, which excludes “unclassified cases,” we find that black minority groups faced more discrimination than non-black minority groups (coef. = 0.119, p = 0.008 [one-tailed test]). Hence, we find clear support for Hypothesis 1.
Next, model 3 included only field experiments investigating discrimination against black minority groups to analyze variation in discrimination ratios across countries. As is shown in Figure 2, compared to the United States, we find significantly higher discrimination levels in Belgium (coef. = 0.292, p = 0.016 [one-tailed test]), Austria (coef. = 0.321, p = 0.045 [one-tailed test]), Canada (coef. = 0.340, p = 0.018 [one-tailed test]), and Great Britain (coef. = 0.372, p = 0.013 [one-tailed test]). Yet, the highest levels of discrimination were found in France (coef. = 0.925, p < 0.001 [one-tailed test]). Furthermore, discrimination ratios in the Netherlands (coef. = 0.195, p = 0.112 [one-tailed test]) and Ireland (coef. = 0.369, p = 0.186 [one-tailed test]) were not significantly lower than in the United States, though especially the latter might be due to low statistical power. Hypothesis 2 stated that discrimination against black minority groups would be higher in the United States than elsewhere. Unexpectedly, we find even significantly lower discrimination ratios in the United States compared to most other countries. Consequently, we find no empirical support for Hypothesis 2.
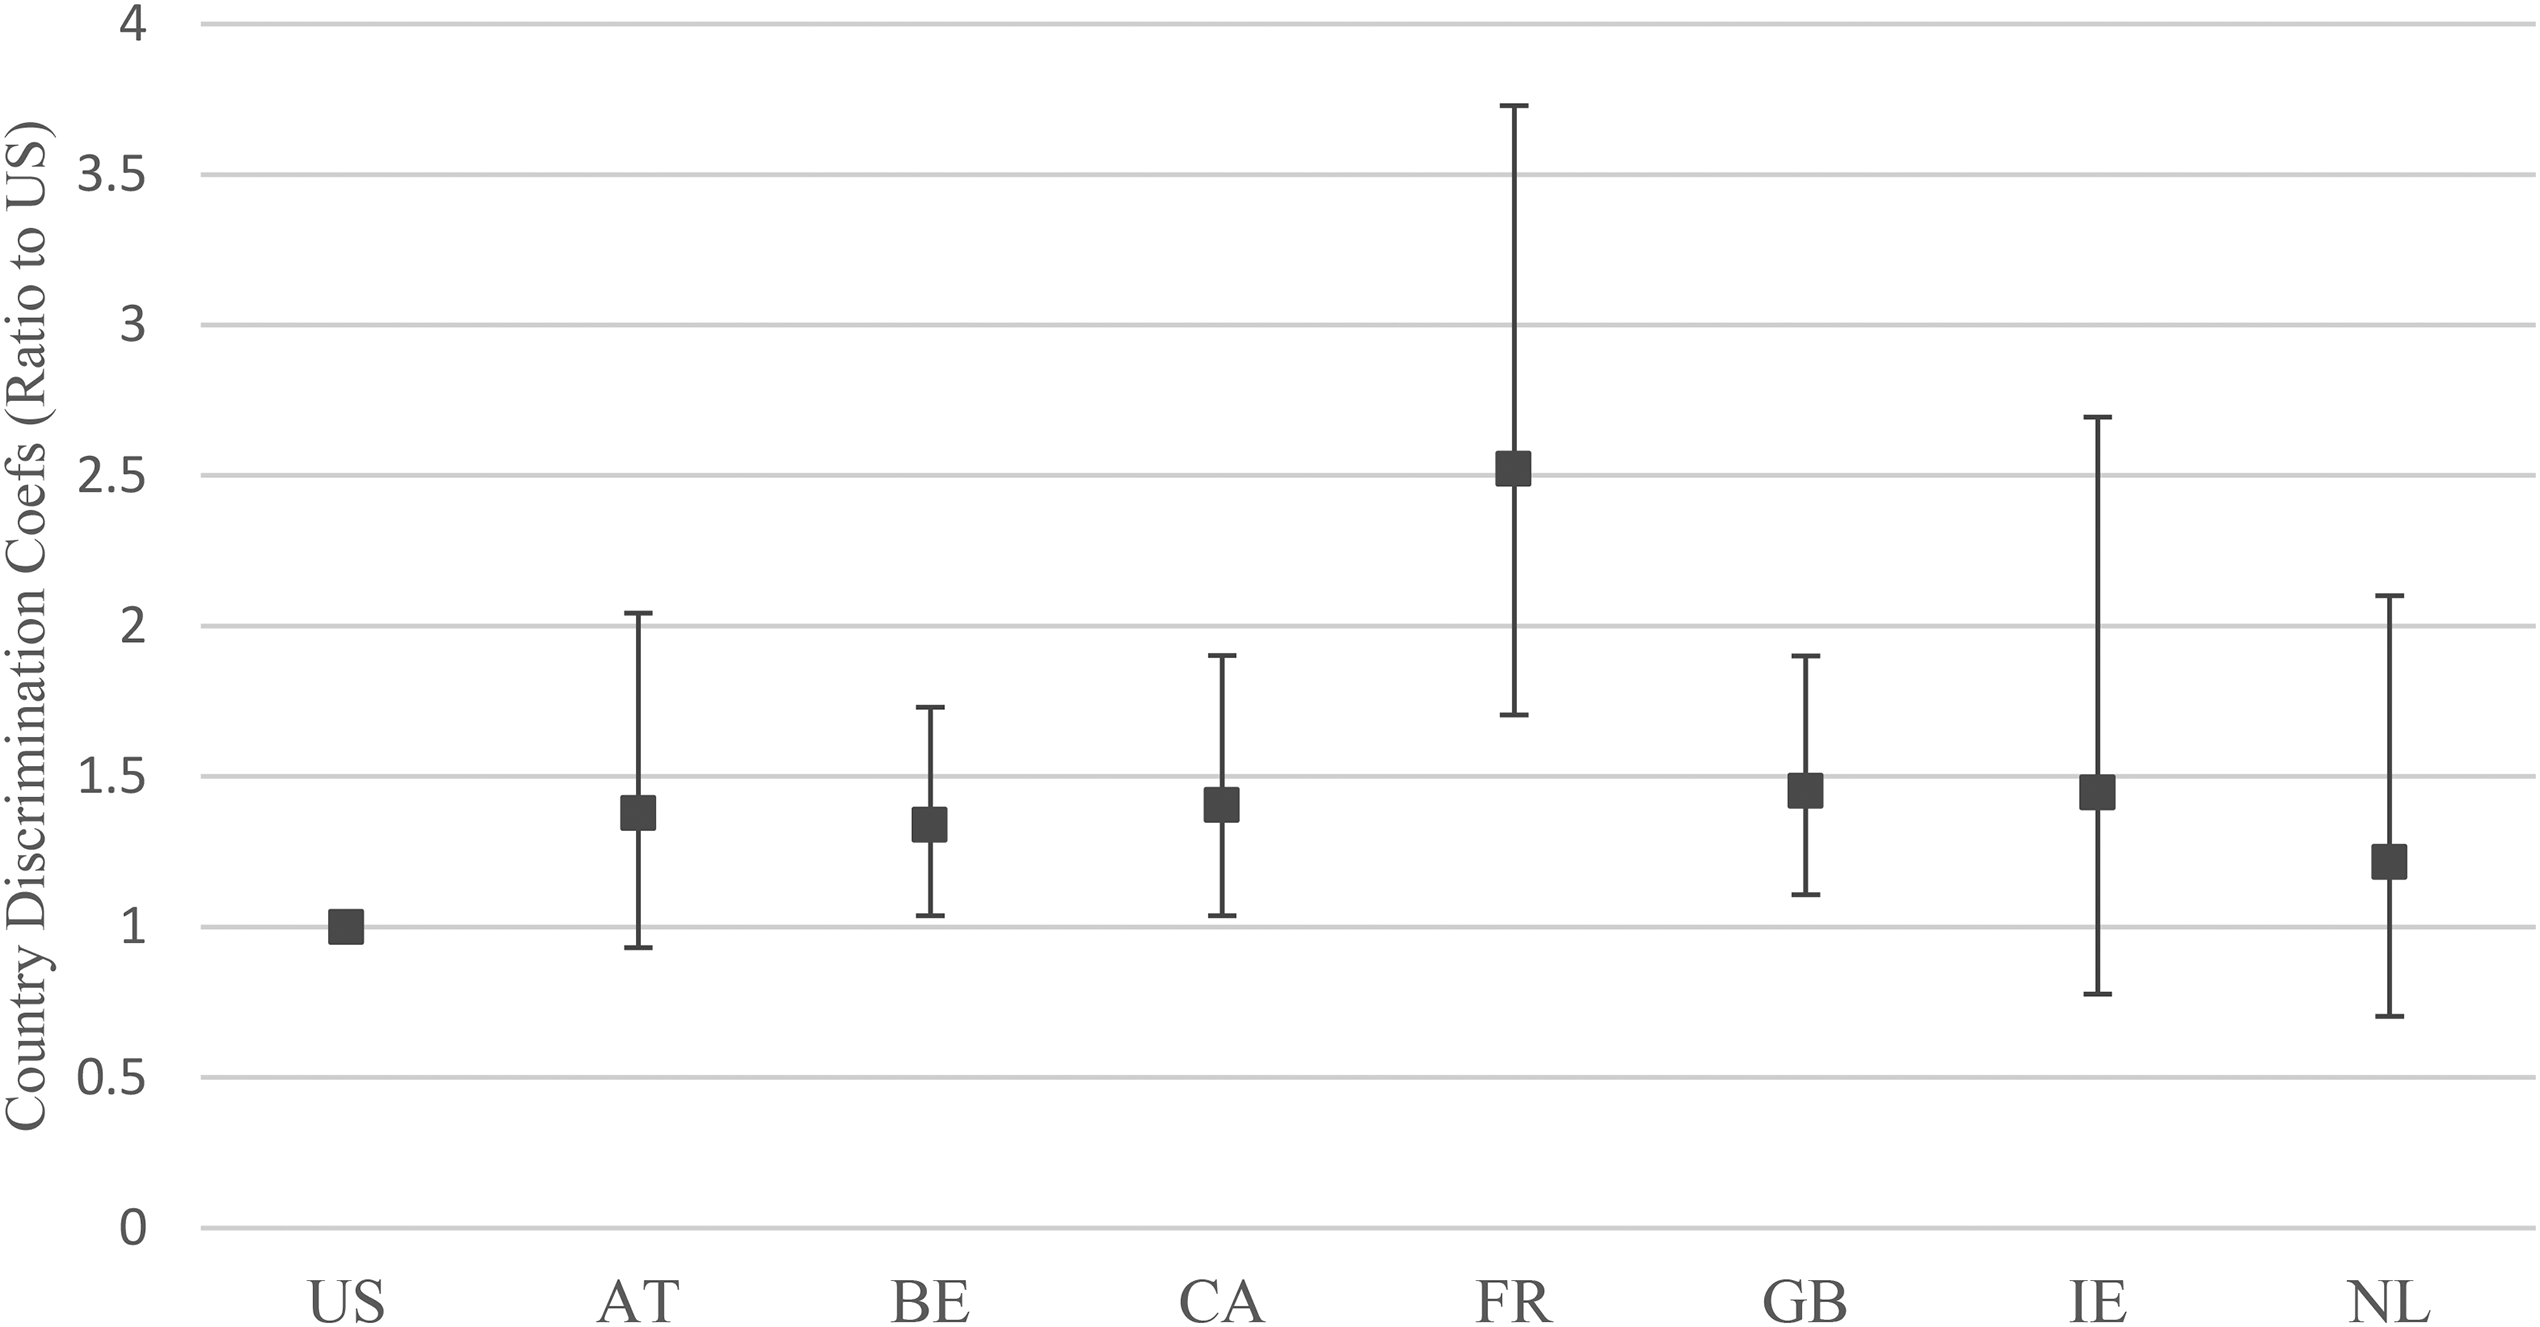
Country discrimination levels relative to the United States of black minority groups. Note: This figure depicts the country differences in the discrimination ratio for black minority groups based on exponentiated coefficients from Table 5, model 3. The 95% confidence intervals are calculated (two-tailed tests). US = United States (reference category = 1); AT = Austria; BE = Belgium; CA = Canada; FR = France; GB = Great Britain; IE = Ireland; NL = Netherlands.
Hypothesis 3 predicted higher levels of discrimination against Muslim minority groups than other minority groups. In the descriptive analysis, we found some tentative evidence that Muslim minority groups face higher levels of discrimination. Here, we investigate whether these differences in discrimination ratios were significant, while taking into account the precision of the discrimination ratio, as well as other relevant characteristics of studies and subgroups. 11 Although the coefficient of having a Muslim minority background was positive in model 1 (coef. = 0.066, p = 0.114 [one-tailed test]) and model 2 (coef. = 0.062, p = 0.110 [one-tailed test]), thus indicating higher levels of discrimination against Muslim minority groups, it was not statistically significant in either model. Therefore, we find no clear evidence that discrimination ratios were higher for Muslim minority groups than for non-Muslim minority groups.
To explore country differences in discrimination of Muslim minority groups, model 4 only included Muslim minority groups. As Figure 3 suggests, Muslim minority groups were rather similarly penalized in different national contexts. There were no statistically significant differences in the level of discrimination against Muslim minorities between the United States and the other countries. Hence, in contrast to black minority groups, these findings suggest that Muslim minority groups do not face different levels of discrimination in different national contexts.
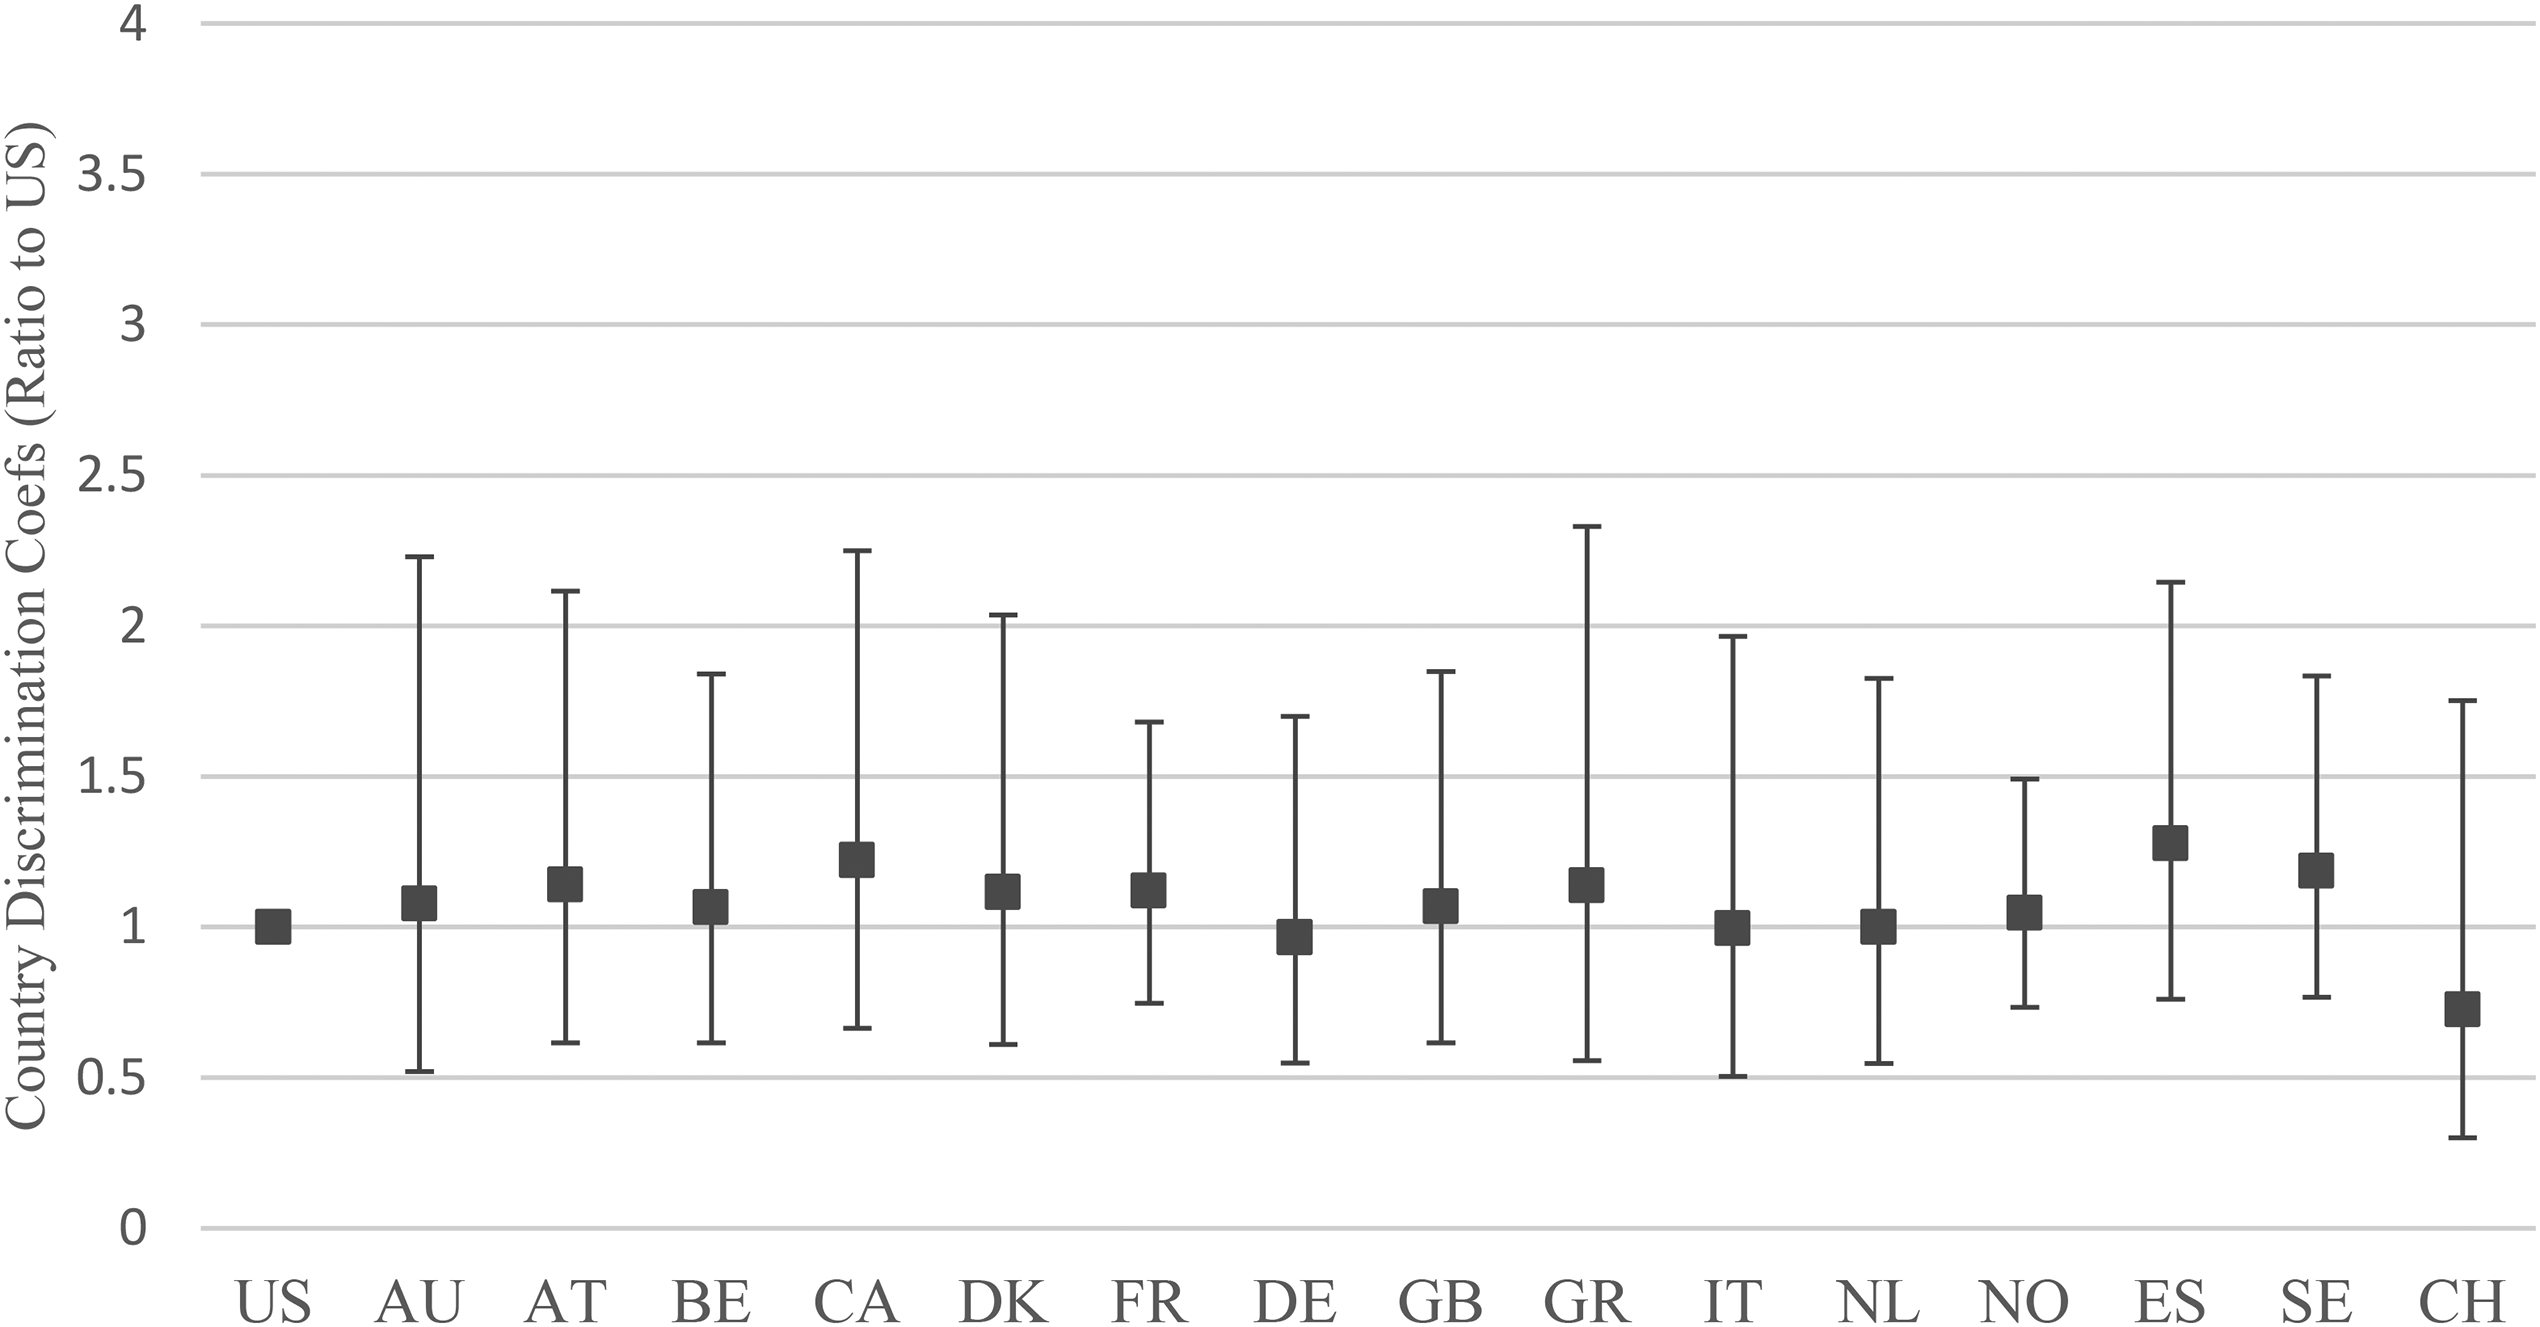
Country discrimination levels relative to the United States of Muslim minority groups. Note: This figure depicts the country differences in the discrimination ratio for Muslim minority groups based on exponentiated coefficients from Table 5, model 4. The 95% confidence intervals are calculated (two-tailed tests). US = United States (reference category = 1); AT = Austria; AU = Australia; BE = Belgium; CA = Canada; DK = Denmark; FR = France; DE = Germany; GB = Great Britain; GR = Greece; IT = Italy; NL = Netherlands; NO = Norway; ES = Spain; SE = Sweden; CH = Switzerland.
Conclusion and Discussion
Using meta-analysis, this article aimed to provide a systematic overview of the results obtained in field experiments on hiring discrimination of racial–ethnic minorities in Western labor markets, with an explicit focus on the role of skin color and (Islamic) religion. It contributes to the current literature on labor market discrimination (Zschirnt and Ruedin 2016; Quillian et al. 2017; 2019) by examining whether black and Muslim minority groups were equally discriminated against in 20 Western countries.
We find strong evidence for the existence of racial–ethnic discrimination in hiring. The majority of candidates received a callback rate that was 40 percent greater than that for identically qualified minority candidates. Although we cannot rule out that our findings may be slightly affected by publication bias, the difference in callback clearly illustrates that hiring discrimination is an important factor in shaping racial–ethnic disparities in the labor market. In line with our expectations, we find that black minority groups were discriminated against more strongly than other (non-black) minority groups. Whether due to the structural (e.g., lingering histories of colonialism or institutionalized segregation), sociocultural, or psychological factors (e.g., higher visibility of a dark skin color), these results indicate that in the initial stages of the recruitment process, black minority groups are systematically disadvantaged compared to identically qualified majority and other non-black minority group candidates. There are also some indications that Muslim minority groups faced more discrimination than other minority groups, when we rely on the bivariate, unadjusted group comparisons. However, in the multivariable analysis, the Muslim penalty became statistically insignificant. It is important to note the issue of group selectivity in field experiments: scholars typically investigate minority groups with a disadvantaged labor market position (Dancygier and Laitin 2014). Hence, we cannot exclude the possibility that Muslim minority groups were more discriminated than other minority groups that were not studied in field experiments. Overall, we find only partial support for notions stressing the importance of sociocultural distance related to skin color and Islamic religion (cf. Hagendoorn 1995; Portes and Rumbaut 2001; Alba 2005).
A key innovation of this article is to investigate whether black and Muslim minority groups were equally discriminated across different national contexts. Such cross-national comparisons of the same group are difficult to make, not only because of cross-national differences in the design of the field experiments but also because of differences in the groups studied in different countries. We, therefore, proposed that to make a more insightful cross-national comparison of discrimination rates than previous studies that included a mixture of minority groups (Zschirnt and Ruedin 2016; Quillian et al. 2019), it is essential to examine comparable minority groups across different countries. By conducting analyses including only black and only Muslim minority groups, respectively (and comparing them to the majority), we were able to test whether these minority groups faced different levels of hiring discrimination in various national contexts, while controlling for relevant study and subgroup characteristics. This test allowed us to answer the question: is the same type of racial–ethnic minority group equally discriminated against across countries?
As for black minority groups, our results indicate significant cross-national variation in discrimination rates. In particular, we find that black minority groups were least discriminated against in the United States (and, to a lesser extent, in the Netherlands and Ireland) and most severely discriminated against in France. In the meta-analysis of Muslim minority groups, however, we find little evidence for varying discrimination rates across countries, indicating that Muslim minority groups were similarly penalized in different national contexts. Against our expectations, our comparative analysis did not provide support for the idea of a highly salient skin color boundary in the United States and a more prominent religious boundary in (Western) European countries (cf. Alba and Foner 2014). An open question is whether this lack of evidence is due to the differences in practices in labor market and marriage market contexts or the need for more theoretical attention to other characteristics of racial–ethnic minority groups.
A possible explanation for the unexpected result that black minority groups were less discriminated against in the United States than in other Western societies is offered by Zou and Cheryan’s Racial Position Model (2017). They categorize racial–ethnic minority groups along two distinct dimensions—(i) perceived “inferiority” and (ii) perceived “cultural foreignness”—and find that African Americans and Latinx, as opposed to “white” Americans, are perceived as inferior groups vis-a-vis perceived intellectual, economic, and occupational prestige in the United States. They also find, however, that African Americans, like the white population, are seen as “American,” unlike Latinx, who are perceived as (culturally) foreign. Based on this model, one may, thus, argue that the black population's status is higher in the United States (relative to other minority groups) than in other Western societies, where black minority groups are perceived as nonnational and culturally foreign out-groups.
We acknowledge that this article's findings are limited in several ways, which offer new avenues for future research. First, the generalizability of our findings is limited because the selection of racial–ethnic minority groups in field experiments is not random and typically consists of sizeable groups that suffer from socioeconomic disadvantages and that are frequently at the center of political debates and decision-making (Dancygier and Laitin 2014). This selection of minority groups could be a reason why we did not find significant differences between members of Muslim minority groups and those of other groups and why more recent field experimental research did find some statistically significant differences (Di Stasio et al. 2021). To address this issue, future research should examine more racial–ethnic minority groups with varying socioeconomic and cultural backgrounds (for a similar point, see Di Stasio and Lancee 2020; Lancee 2021), which would also allow us to map cross-national discrimination patterns more accurately (see also Di Stasio et al. 2021; Veit and Thijssen 2021).
Second, and relatedly, the scope of our cross-national analysis is restricted because black and Muslim minority groups were rarely investigated in multiple national contexts. More specifically, we notice that there is a dearth of research on hiring discrimination against black minority groups in Europe. This omission is important, not only because of the recent emergence of worldwide Black Lives Matter protests but also because our findings seem to indicate notably higher discrimination rates against black minority groups in several European countries than in the United States. Likewise, because there has been too little attention to Muslim minorities in the United States and in many other countries, there is no possibility to directly compare the discrimination rates between Muslim and non-Muslim minority groups. An improvement would be to use a two-by-two (Muslim/non-Muslim by white/black) factorial design in future work. Altogether, we urge future studies to investigate a broader and more balanced selection of racial–ethnic minority groups in multiple national contexts (see also Di Stasio and Lancee 2020; Lancee 2021). Indeed, as has been pointed out by other scholars (Simon 2017), a lack of data on racial–ethnic discrimination does not automatically imply the absence of discrimination.
Finally, although we were able to detect some variation in discrimination rates across countries, we were not able to explain why discrimination rates vary cross-nationally. An interesting next step for future research could be to look at changes in discrimination rates over time within countries and to relate the between (cross-national) and within (over time) country variations to various indicators of intergroup competition (Dancygier and Laitin 2014), labor market institutions (Lancee 2016; 2021), integration regimes (Adida, Laitin, and Valfort 2016), long-term existential security (Inglehart 2018), or a society's legacy of colonialism or slavery (Pager and Shepherd 2008). Although such an analysis requires a high number of observations across countries and over time, it would greatly enrich our understanding of how structural factors might influence discrimination patterns and perhaps explain why we find relatively low levels of racial discrimination in the United States and high levels in France (cf. Quillian et al. 2019).
In conclusion, this meta-analysis has shown that hiring discrimination is an important barrier to the integration of racial–ethnic minorities in Western labor markets. Not all minority groups face similar levels of discrimination, however. Black minority groups in particular are strongly affected by hiring discrimination. In addition, while discrimination rates of Muslim minority groups hardly vary cross-nationally, our findings show cross-national variation in discrimination against black minority groups. Future research is strongly advised to pay more attention to differences between a wide range of racial–ethnic minority groups and countries in explaining racial–ethnic discrimination in hiring.
Footnotes
Declaration of Conflicting Interests
The authors declared no potential conflicts of interest with respect to the research, authorship, and/or publication of this article.
Funding
The author(s) disclosed receipt of the following financial support forthe research, authorship, and/or publication of this article: Suzanne Jak was supported by the Dutch Research Council Research under Grant NWO-VENI-451-16-001.
Supplemental Material
Supplemental material for this article is available online.
Notes
References
Supplementary Material
Please find the following supplemental material available below.
For Open Access articles published under a Creative Commons License, all supplemental material carries the same license as the article it is associated with.
For non-Open Access articles published, all supplemental material carries a non-exclusive license, and permission requests for re-use of supplemental material or any part of supplemental material shall be sent directly to the copyright owner as specified in the copyright notice associated with the article.