
Abstract
This paper sheds new light on oil market dynamics by investigating the role of media-based sentiments in expectation building from several perspectives. We adopt both survey- and market-based expectation measures and analyze the effects of different sentiment indicators on (i) expectations, (ii) forecast errors, and (iii) disagreement among forecasters using data from 1998 to 2020, while also taking into account different media sources and nonlinear effects. We find that media sentiments affect expectations and survey-based uncertainty measures that extend beyond information embedded in past prices, with positive (negative) sentiment resulting in lower (higher) expected oil prices. Media coverage can also affect disagreement and tends to increase forecast errors. The adjustment of expectations to sentiment news tends to be stronger for negative news and conventional news sources compared to social media.
1. Introduction
While the conventional literature on the oil market has assessed the role of supply and demand factors as oil price determinants (Baumeister and Hamilton 2019; Kilian 2009), an alternative strand has focused on the financialization of the oil market, for example by assessing the role of exchange rates and stock markets for oil price and oil price volatility (Beckmann et al. 2020; Degiannakis et al. 2018; Zhang et al. 2017). This has also resulted in the question of whether the behavior and expectations of investors can influence the oil market. These questions are of great importance since they can contribute to a better understanding of shock transmission to the oil market, for example, by analyzing propagation mechanisms of news via expectations. Some studies have shown that investor sentiment can affect the oil price and its volatility (Deeney et al. 2015; Du et al. 2016; Qadan and Nama 2018; Zhang and Li 2019; etc.) while recent work has also illustrated that oil price expectations are subject to information rigidities (Czudaj 2022).
However, the existing literature has not disentangled the link between sentiment and expectations, partly because both concepts can be closely related. Sentiment can be proxied by either surveys among consumers or investors or based on news coverage (Kearney and Liu 2014), while expectations are typically assessed via surveys or derived from market prices. In this paper, we close this gap and contribute to the literature by analyzing how media information affects expectations about the oil price and whether these expectations act as a propagation mechanism for such information into oil price dynamics and the resulting uncertainty. To date, only the idea that news sentiment can affect the price of oil via survey-based measures of consumer confidence (Shapiro et al. 2022) has been explicitly tested. Understanding the role of sentiments in expectations is important, as news embedded in sentiments can be seen as irrational noise or a reflection of relevant information (van Binsbergen et al. 2024). In addition, analyzing the link between sentiments and expectations can also be useful for evaluating the predictive power of sentiments or expectations for future oil price dynamics.
We address the following questions: (i) How do news and social media sentiments influence oil price expectations, disagreement among forecasters, and forecast errors in the oil market? (ii) Does the perception of the media about the oil market differ for positive and negative news? (iii) Do the results differ between conventional news and content from social media? To answer these questions, we combine survey- and market-based expectation measures with text-based sentiment, which reflects the degree of positivity or negativity in texts and provides relevant information for investment and trading policy decision-making (Blinder and Krueger 2004). Both measures can be linked to media coverage as survey expectations can be affected by perceived future cash flows and investment risks, while market-based measures can be driven by market prices, which are linked to media coverage (Baker and Wurgler 2007).
We adopt crude oil-specific news and a social media set of content from Thomson Reuters MarketPsych Indices (TRMI) and analyze the West Texas Intermediate (WTI) and Brent crude oil prices. We investigate the impact of media news on expectations in several dimensions. Our analysis is based on survey- and market-based expectations using data from Consensus Economics and Baumeister (2023), adopting monthly data from 1998 to 2020. We start by analyzing sentiments’ effects on expected and realized oil price changes. In the second step, we also assess the effect of sentiment on disagreement among market participants as well as forecast errors based on survey data and surprise shocks based on market-based measures. In the final step, we distinguish between different news sources and assess several potential nonlinearities of sentiment effects on the oil market.
Our results also hold relevance with respect to oil price uncertainty and the predictive power of expectations for oil prices. Both forecast errors and disagreement constitute dimensions of survey-based uncertainty (Lahiri and Sheng 2010). Alquist et al. (2011) have illustrated that survey forecasts have potential predictive power, but often display substantial forecast errors for the oil market. Juodis and Kučinskas (2023) develop a framework for quantifying the level of noise associated with survey expectations, finding a larger noise that is comparable to bias. Our work also relates to the recent work of Baumeister (2023) by estimating how sentiment explains market-based surprises and shocks. In line with this perspective, we extend the analysis to explore the impact of sentiment on expectation measures within the oil market, an imperative factor in decision-making. Understanding the extent to which new and social media-based sentiment affects expectations about oil price development is significant for investment plans.
The idea that sentiments are relevant to the adequacy of oil price expectations relates to studies showing that investors sometimes over- or under-react to news and social media sentiments during transactions, with market analysts responding to these reactions (Jegadeesh and Wu 2013; Liebmann et al. 2012). In this context, trading activities in the market and economic performance are, to some extent, orchestrated by the sentiments of market participants. The commodity market has been sensitive to macroeconomic news as it has become increasingly financialized (Roache and Rossi 2010). Newspapers and social media play an important role in circulating information in the market and ensuring the efficient dissemination of information among investors.
Finally, our work extends the research that analyzes the effects of sentiments on oil price dynamics and volatility (Afkhami et al. 2017; Elshendy et al. 2018). While earlier research in finance and commodity markets mainly indicates that sentiment corresponds to deviations and changes in expectations about future prices, this hypothesis has not yet been tested. Hribar and McInnis (2012) investigate investor sentiment and analysts’ earnings forecast errors in the stock market, finding that sentiment largely affects expectations, especially in difficult-to-value firms. Wex et al. (2013) also concludes that stock market predictions based on text mining or news and social media sentiment are prevalent in the literature. Although crude oil is one of the largest commodity markets in the world, the relationship between news and social media sentiment and errors, shocks, and changes in expectations about future prices has been minimally addressed or demonstrated empirically. Accordingly, this study seeks to fill this gap in the literature on the oil market.
Our econometric approach includes several estimates that account for different dynamics and is based on the idea of constructing sentiment indicators that are unaffected by the information embedded in surveys. For survey-based measures, we use only the information available prior to the survey publication date to ensure that news information remains unaffected by that publication. For market-based measures, we only use data before the month when these measures are calculated. For both specifications, we also control for lagged oil price dynamics. Our robustness tests take into account various nonlinearities.
The following section presents an elaborate overview of literature directly analyzing the link between media sentiment and the oil market, before section 3 provides a detailed description of the data. Section 4 elaborates on the estimation technique adopted in the study. Section 5 outlines the empirical findings, with an in-depth discussion and an evaluation of the hypotheses. Several extensions and robustness tests are conducted in section 6, and finally, section 8 concludes the paper.
2. Literature Review
News and social media sentiments have recently attracted strong attention among researchers, professionals, policymakers, and investors. Such indicators have also emerged as a potential tool for predictions (Rousidis et al. 2020). In this section, we review different strands of the literature that have analyzed the link between news sentiment and the oil market.
One strand of the literature has analyzed abnormal returns in commodity markets and crude oil prices as a result of news sentiment, with negative sentiment having a stronger impact (Alfano et al. 2015; Feuerriegel and Neumann 2013; Feuerriegel et al. 2015). Wang et al. (2021) find evidence of negative extreme shocks strongly affecting crude oil futures more than positive extreme shocks. Li et al. (2016) find that news sentiment has a predictive power of oil price trends. This asymmetric impact is relevant for our investigation since we also analyze whether oil price expectations respond differently to positive and negative news.
Several authors have analyzed the potential predictive power of news sentiment in relation to oil prices. This emanates from the explosive growth of search volumes and interactions among persons on worldwide news and social media platforms. For instance, Rao and Srivastava (2013) find the Google search volume index and Twitter sentiment to be good predictors of the oil price. Elshendy et al. (2018) observe a broader impact, extracting sentiments from Twitter, Google Trends, Wikipedia, and the Global Data on Events, Location and Tone (GDELT) database and demonstrating the predictive power of daily crude oil prices. This result is supported by Wu et al. (2021), who retrieve oil sentiment from Google Trends and online media text mining by combining deep learning with decomposition techniques to forecast the crude oil price. Li et al. (2019) also contribute to the literature concerning the predictive power of sentiment in the oil market based on a deep learning approach. Lucey and Ren’s (2021) out-of-sample forecast finds the news tone extracted from the oil dictionary to be a better oil price forecast over a short horizon than news from the financial dictionary. While we do not focus on out-of-sample forecasts, we investigate the effect of media coverage on the forecast of market participants as a potential transmission mechanism.
Another strand of the literature has focused on the effects of different information on oil price volatility. While empirical studies have shown that oil volatility or shocks affect business and consumer sentiment (Güntner and Linsbauer 2018), other studies have focused on the reverse effect. In examining the impact of sentiment on oil price volatility, Li et al. (2021) employ an event-based method and GARCH model and find that shocks from news headlines instigate fluctuations in oil future prices and cause an asymmetric impact on the volatility of oil future prices. 1 Campos et al. (2017) find that Google (ASVI) has a significant and positive correlation with oil volatility. This confirms the empirical results by Afkhami et al. (2017) and Qadan and Nama (2018), who find that Google search volume (GSV) is a significant predictor of crude oil volatility. The investor sentiment constructed by the financial and economic attitude revealed by the search index has also been found to accurately forecast long-run future volatility in the crude oil future market (Yang et al. 2019). Incorporating social media has been tested to improve the forecasting accuracy of volatility indices and uncertainty modeling (Lehrer et al. 2021). Using the Kalman filtering framework, Sadik et al. (2020) forecast crude oil futures prices and volatility with macroeconomic news sentiment.
The effects of news and social media coverage have also been analyzed in the context of uncertainty. Economic theories suggest that the oil market is strongly driven by uncertainty, which leads to increased volatility and inefficiencies in the crude oil market. Using the wavelet coherence analysis demonstrates that oil prices and news-based uncertainty sentiment co-move in opposite directions in the oil market (Su et al. 2018). Several studies have explored the link between media sentiment and the oil market during the COVID-19 era. 2 We shed some new light on the effects on uncertainty by analyzing the effects of media sentiment on market surprises, disagreement among market participants, and forecast errors.
Despite the rich literature, there is little evidence on the determinants of oil price expectations. Loughran et al. (2019) find that oil traders over-react to sentiment from the text of Dow Jones oil-related news articles on the following trading day. Czudaj (2022) analyzes different beliefs and information rigidities in the crude oil market based on data from the European Central Bank (ECB) survey of professional forecasters, showing that the degree of forecasters’ reaction to new information varies over time and decreases with the forecast horizon. Other studies have focused on herding behavior in the oil market based on survey data (Brunetti et al. 2013). Given these shortcomings, our study fills a gap in the literature since the impact of news and social media sentiment on expectations, forecast errors, and disagreement matters holds importance for understanding the transmission of news shocks for oil price dynamics, which is also relevant for policymakers.
3. Data and Empirical Framework
We use two alternative proxies for expectations and uncertainty related to the oil market. One dimension is survey-based and corresponds to the oil price expectations, disagreement, and forecast errors. As a second specification, we use the market-based Baumeister measure, which includes expectations, expectation shocks, and market surprises. Baumeister (2023) use two approaches to obtain the expectations, including a return regression approach and Hamilton and Wu’s (2014) risk premium model.
It is important to note that sentiments are, by definition, unaffected by the expected change in prices since all indicators correspond to media coverage before expectations are polled and published. The same holds for market-based measures, since we only use media sentiments prior to the month when those measures were calculated. In all specifications, we also include information embedded in lagged price and expectation dynamics.
The data on monthly, three- and twelve-month oil price expectations is taken from Consensus Economics (see https://www.consensuseconomics.com/). The survey provided by Consensus Economics is based on a wide range of participants from banks, research institutes, and government agencies. The names of participants are published, which tends to increase the incentive to provide accurate forecasts. Forecasts are provided in the first half of each month. Comparatively, we employ Baumeister’s (2023) market-based oil price expectations data for the three- and twelve-month horizons. 3 The expectation data ranges from 1998M1 to 2020M3 for the three-month horizon, while the twelve-month horizon is available to 2019M6. Baumeister (2023) further extracts the ’pure’ expectation shock by regressing the market-based surprises on fundamental oil supply and demand shocks. The market-based oil price surprises and shocks are only available on a month-to-month basis from 1998M1 to 2020M4.
We use the corresponding survey dates from Consensus Economics to match survey forecasts with the textual data on media coverage. The corresponding data is taken from MarketPsych (see https://www.marketpsych.com/) and provided for different content sets, namely news, social media, and the combined content. Press releases are excluded from news. Exclusively English-language text is used until February 2020, after which Arabic, Chinese, Japanese, Dutch, French, German, Indonesian, Italian, Korean, Russian, Spanish, and Portuguese language news sources were included. The news content used to analyze the data types initiated in 1998 encompasses mainstream news sources collected by LexisNexis in 2005 and other top professional news content. The social media feeds a broader message board content with the inclusion of LexisNexis social media content in 2008, while tweets were incorporated in 2009.
The selection criteria are based on popularity ranks determined by incoming links, encompassing approximately the top 20 percent of blogs, microblogs, and other financial social media content. MarketPsych’s dataset also encompasses content from numerous asset-specific blogs and forums with lower popularity. The data collection methodology employs a sophisticated algorithm incorporating an extensive grammatical framework tailored to different text sources, including social media, earnings conference call transcripts, financial news, and regulatory filings. A high-speed AI-based machine learning algorithm for natural language processing (NLP) is used to generate reliable datasets with excellence and minimal information bias. The sentiment indicators fall within either a bipolar or unipolar range, with corresponding indices of −1 to 1 or 0 to 1. Sentiment is scored with a bipolar index and described as overall positive references net of negative references. This shows that both positive and negative are represented with a unipolar index. Buzz is the total number of oil-specific words or phrases that TRMI employs to process the sentiment indicators.
4. Estimation Approach
In the following, we match daily sentiments and monthly survey expectations in two ways. We adopt monthly averages between survey dates and exactly match the survey date for the professional forecasters survey conducted by Consensus Economics, that is, the date on which forecasters had to submit their (oil price) forecasts mentioned above, which is provided by Consensus Economics. For the market-based measures, we only use sentiments prior to the month when those measures were calculated. While the following basis equations refer to linear estimates, we also consider different nonlinear estimates as an extension.
The expectation theory suggests that measuring the actual oil price change (ACT) can be decomposed into the expected and unexpected change in the oil price:

where (
From the actual oil price change decomposition, we generate three main endogenous variables for our empirical analysis. The expected oil price change is computed as the change between the expected oil price and the actual spot price of oil relative to the actual spot price of oil at time t. This is represented in the equation below:
where
We also measure the forecast error as the deviation of the survey forecast in h horizon from the actual oil price at time t. In this case, the expression of the forecast error becomes:

where
We further compute the disagreement among forecasters, which explains the level at which the individual forecasts disperse from the mean (consensus) forecast and can be interpreted as a measure of ex-ante uncertainty. Disagreement is measured by computing the standard deviation of the point forecasts as follows:
where
Estimating the sentiment impact on these measures of expectation and uncertainties, we employ an econometric method including a dynamic regression model that integrates the optimal lag of the dependent variable as an explanatory variable. The lag of the dependent variable helps to capture the persistence of the expectation and uncertainties over time while accounting for autocorrelation in the residuals (Carroll 2003; Keele and Kelly 2006). Furthermore, the study extends the dynamic estimation by using the local projection proposed by Jordà (2005). Moreover, the model ensures robust estimates of the impact of the sentiment indicators in the oil market by exploring several nonlinearities, including structural breaks and threshold regressions.
5. Empirical Results
5.1. Descriptive Analysis
We start with a graphical representation of the different dimensions reflected in our sentiments and expectation measures.
Figure 1 displays the WTI spot price of oil and the corresponding survey forecasts and market-based expectations over three and twelve months. The results show that market-based expectations strongly deviate from the current spot price compared to survey forecasts, albeit which can also significantly deviate, in particular over the twelve-month horizon.
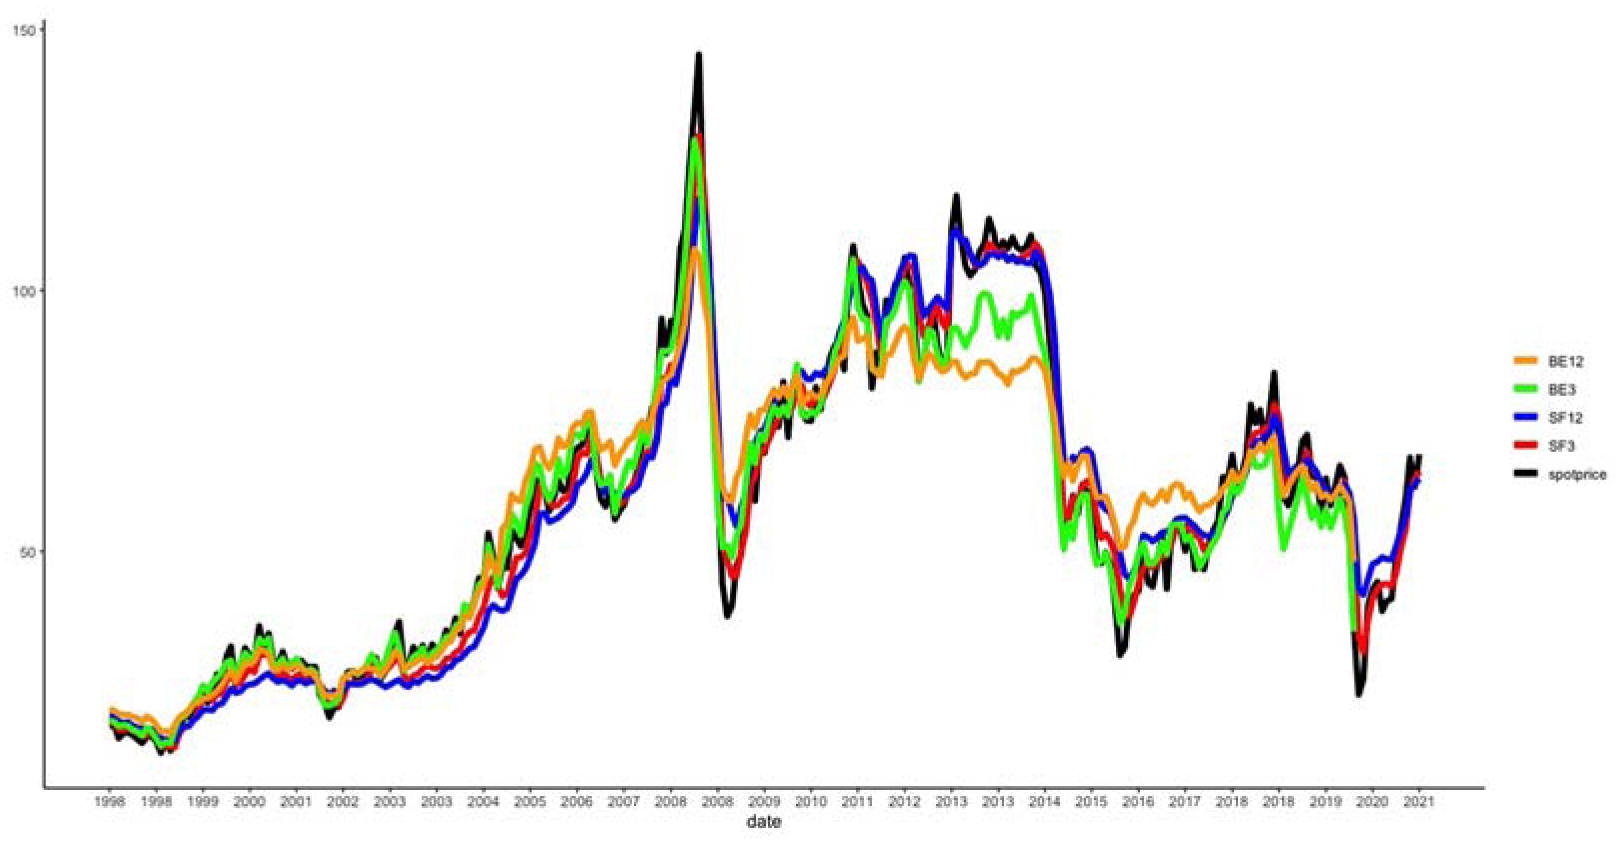
WTI spot oil price, survey forecasts and Baumeister’s oil price expectation for three- and twelve-month horizons.
Figure 2 displays the two sentiment indicators (survey date and monthly average) along with the survey- and market-based expected change over three and twelve months. Both expectation measures over three and twelve months display a positive (.1650 and .6313) correlation, which is particularly high in times of uncertainty. It is also obvious that the two measures strongly correlate over the two horizons. The two sentiment indicators also display a very strong positive (.6312) correlation. Moreover, it becomes obvious that oil price expectations and sentiments tend to have a negative correlation. For instance, the survey date sentiment has a −.3980 correlation with the expected change in oil price for the three-month horizon, while the monthly average sentiment exhibits a −.2330 correlation with market-based expected change in oil over twelve months. This again becomes obvious in uncertain times when the sentiments are strongly negative while the oil price is expected to increase.
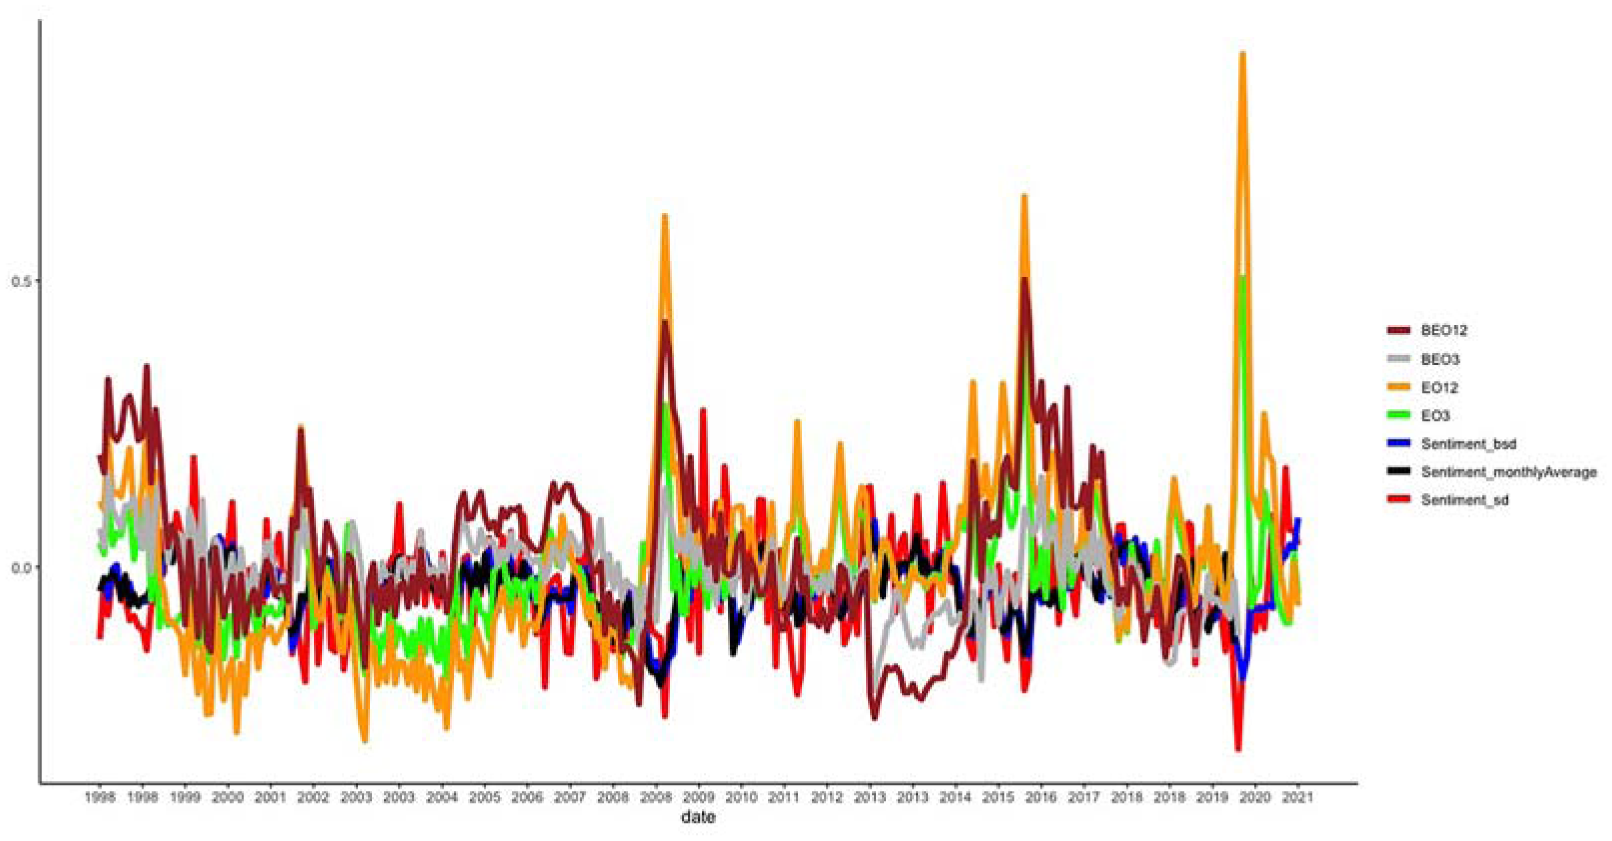
Sentiments and survey expected change (EO) and Baumeister’s expected change (BEO) for three- and twelve-month horizons.
Figure 3 displays the absolute sentiment indicators along with the disagreement among survey participants and oil expectation shock. The result suggests that higher sentiment is often correlated with stronger disagreement, while the link with expectation shock is less clear. Figure 4 illustrates that survey-based forecast errors and market-based surprises tend to be positively correlated (.4780 with the survey forecast error over the three-month horizon) but that surveys tend to display higher overall forecast errors.
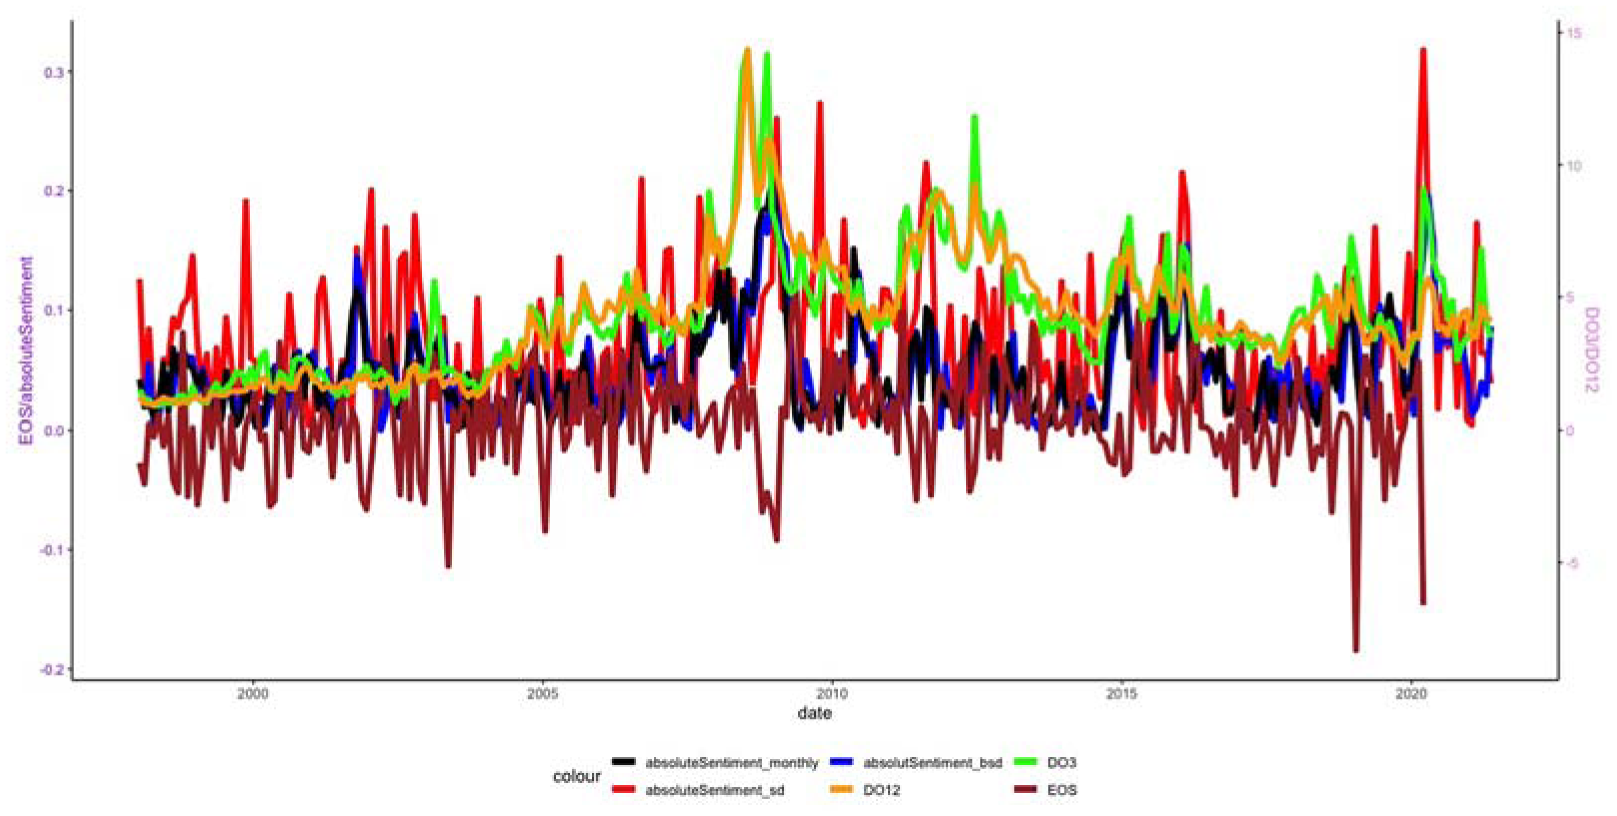
Absolute sentiments, disagreement among forecasters (DO) for three- and twelve-month horizons and Baumeister’s oil price expectation shock (EOS).
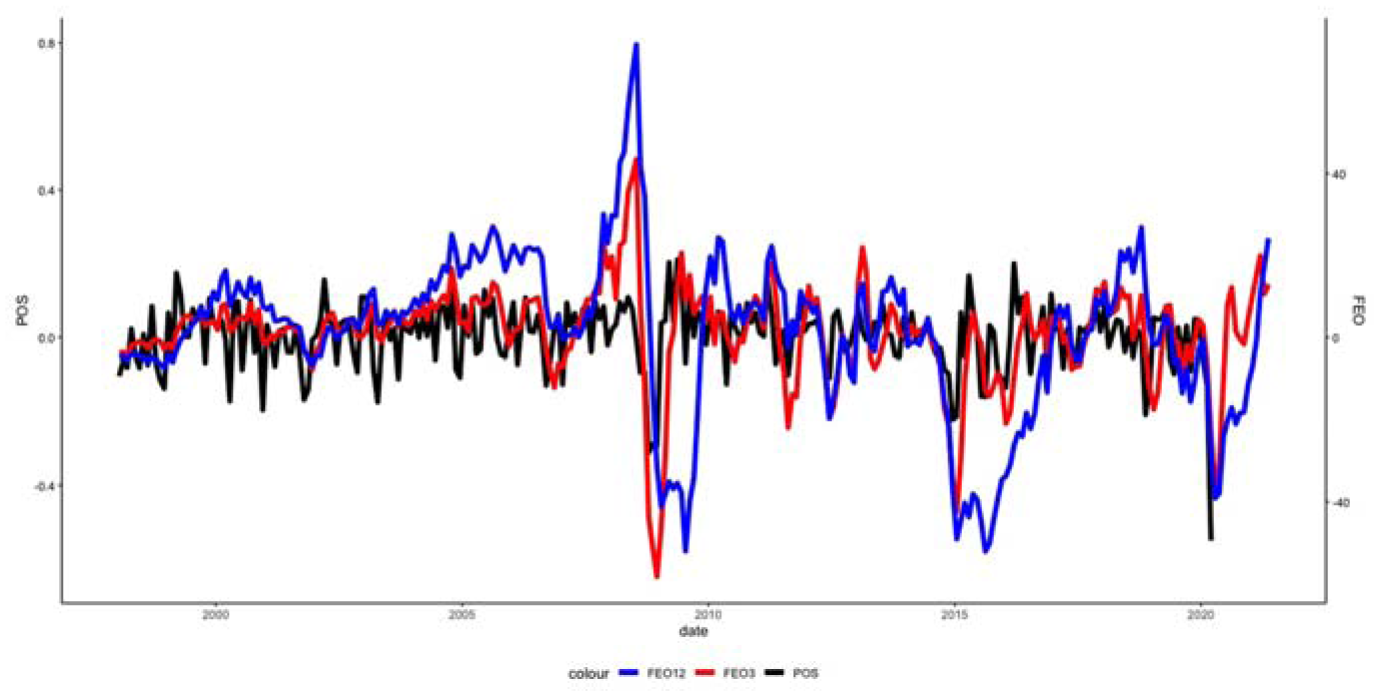
Survey forecast errors (FEO) and Baumeister’s oil price surprises (POS).
Finally, Figure 5 displays the so-called buzz, reflecting the intensity of the news coverage on the price of oil on each survey date and illustrating that the news intensity can differ remarkably and is stronger in uncertain times, such as in 2008 and 2020.
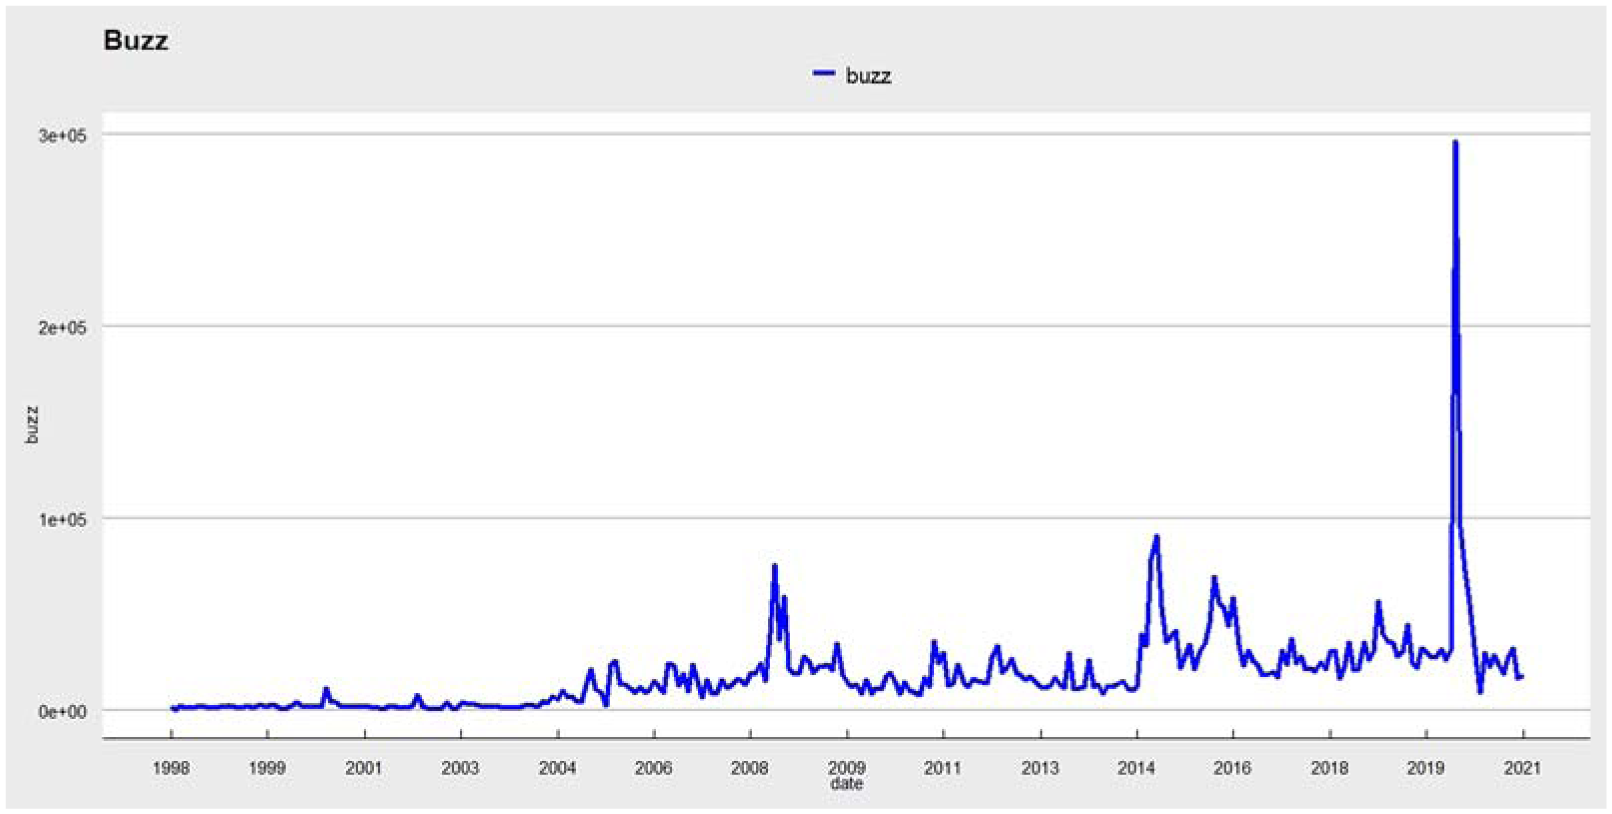
Buzz on the date of survey.
As a first step, we start by examining the out-of-sample forecasting power of the news and social media sentiment indicators on the spot price of the two main crude oil benchmark, namely WTI and Brent Crude. 4 As a next step, we analyze linear predictability between the news and social media and the set of variables such as the expected change in the oil price, forecast disagreement, and realized forecast error using the Granger (1969) causality test. 5
5.2. Sentiments and Actual Oil Price Change
This section estimates the sentiment impact on the actual oil price for the three- and twelve-month horizons using the regression below:

where
The results show a negative sentiment impact and the estimates are broadly equivalent for both constructions of sentiment. While there is little effect of changes over the three months, the negative effect over twelve months is only significant in the specification with lags as control variables, suggesting that these estimates might be driven by a correlation between lagged prices and sentiments (see Table 1). The overall conclusion is that we are unable to identify a clear effect of overall sentiment on oil price changes. This aligns with an out-of-sample analysis, which we perform in the Appendix.
Actual Change and Sentiment.
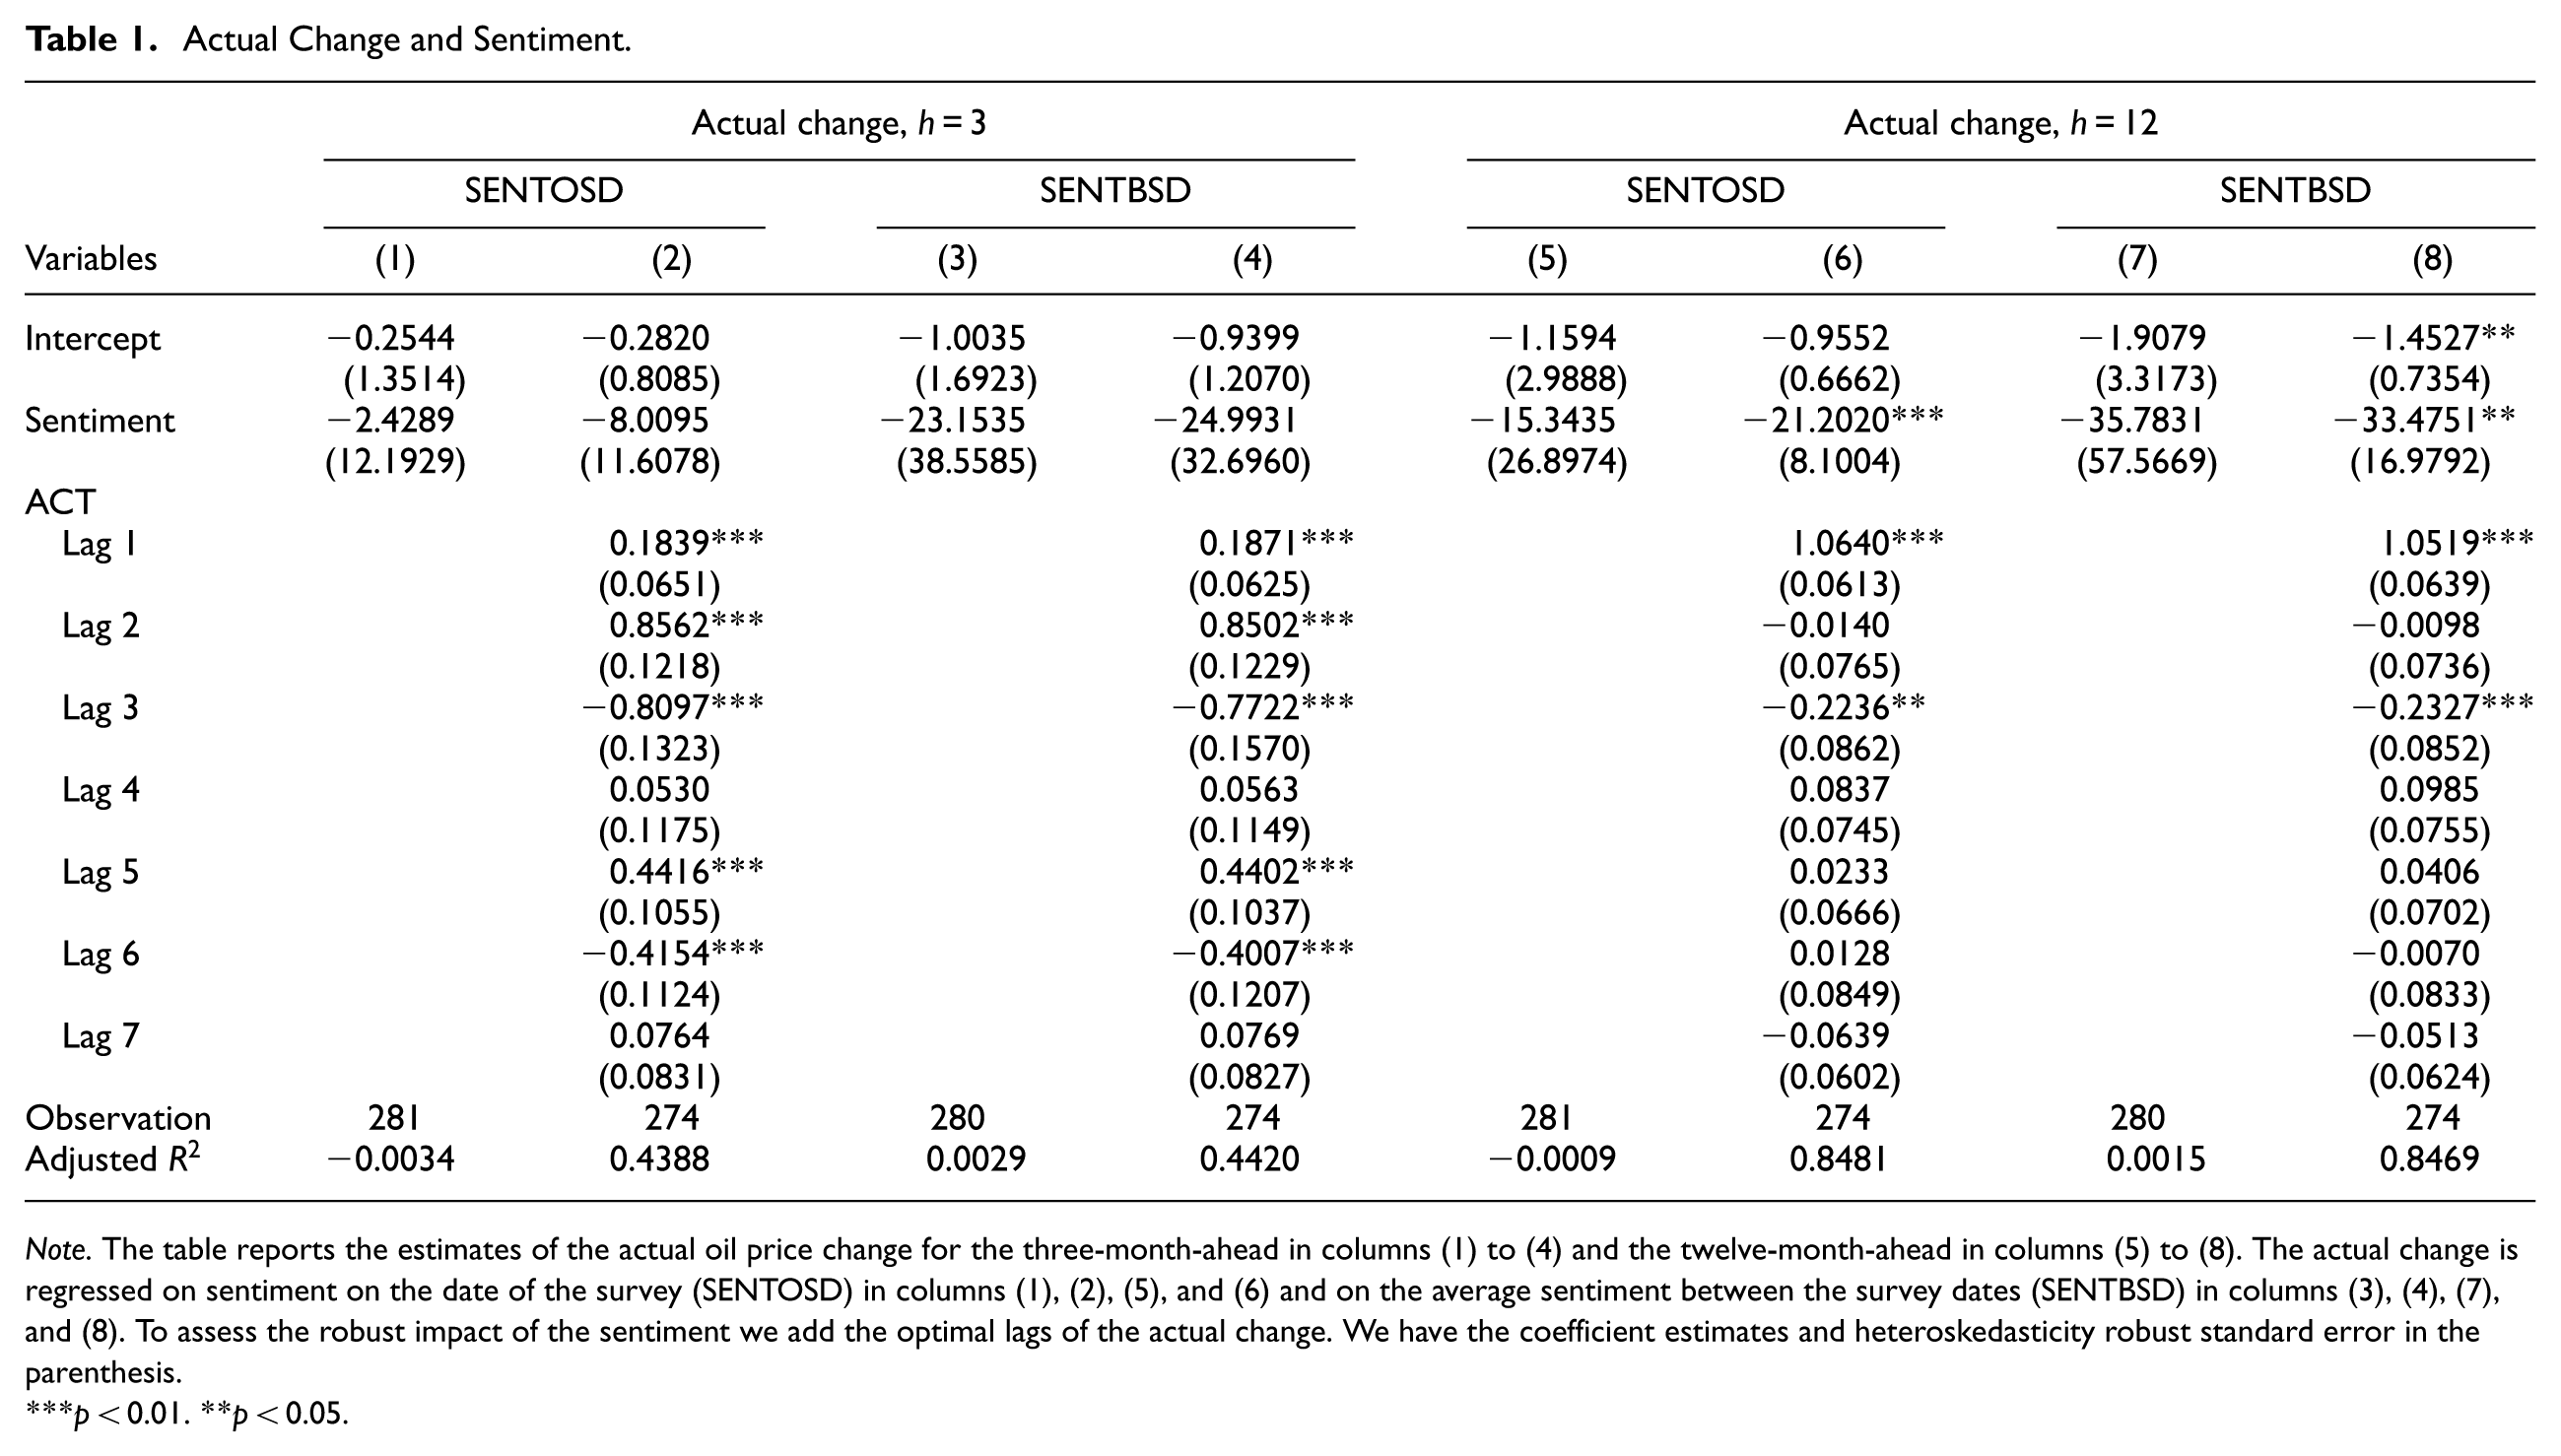
Note. The table reports the estimates of the actual oil price change for the three-month-ahead in columns (1) to (4) and the twelve-month-ahead in columns (5) to (8). The actual change is regressed on sentiment on the date of the survey (SENTOSD) in columns (1), (2), (5), and (6) and on the average sentiment between the survey dates (SENTBSD) in columns (3), (4), (7), and (8). To assess the robust impact of the sentiment we add the optimal lags of the actual change. We have the coefficient estimates and heteroskedasticity robust standard error in the parenthesis.
p < 0.01. **p < 0.05.
5.3. Sentiments and Expectations
As a next step, we estimate the impact of sentiments on oil price expectations based on the following regression-based model, which is our baseline specification:

where
Table 2 presents our results for both expectation measures. The estimation results tables have distinct columns with columns (1) to (4) for the survey’s expected change in the oil price (EO) for the three- and twelve-month horizons and columns (5) to (8) for the Baumeister’s expected change in the oil price (BEO) for the three- and twelve-month horizons. These columns are dependent on the model specifications used in the regression. EO3(EO12) and BEO3(BEO12) are regressed on only sentiment in columns (1)((3)) and columns (5)((7)), respectively, which provides the baseline results. To assess the robust impact of the sentiment on the expected change in the oil price, we add a vector of control variables – optimal lag(s) of the dependent variable and RCO – in columns (2), (4), (6), and (8). To deal with the autocorrelation that exists in our models, we perform our estimates based on the heteroskedasticity consistent covariance and Newey-West heteroskedasticity and autocorrelation-consistent standard error as appropriate.
Expected Change in the Oil Price and Sentiment.
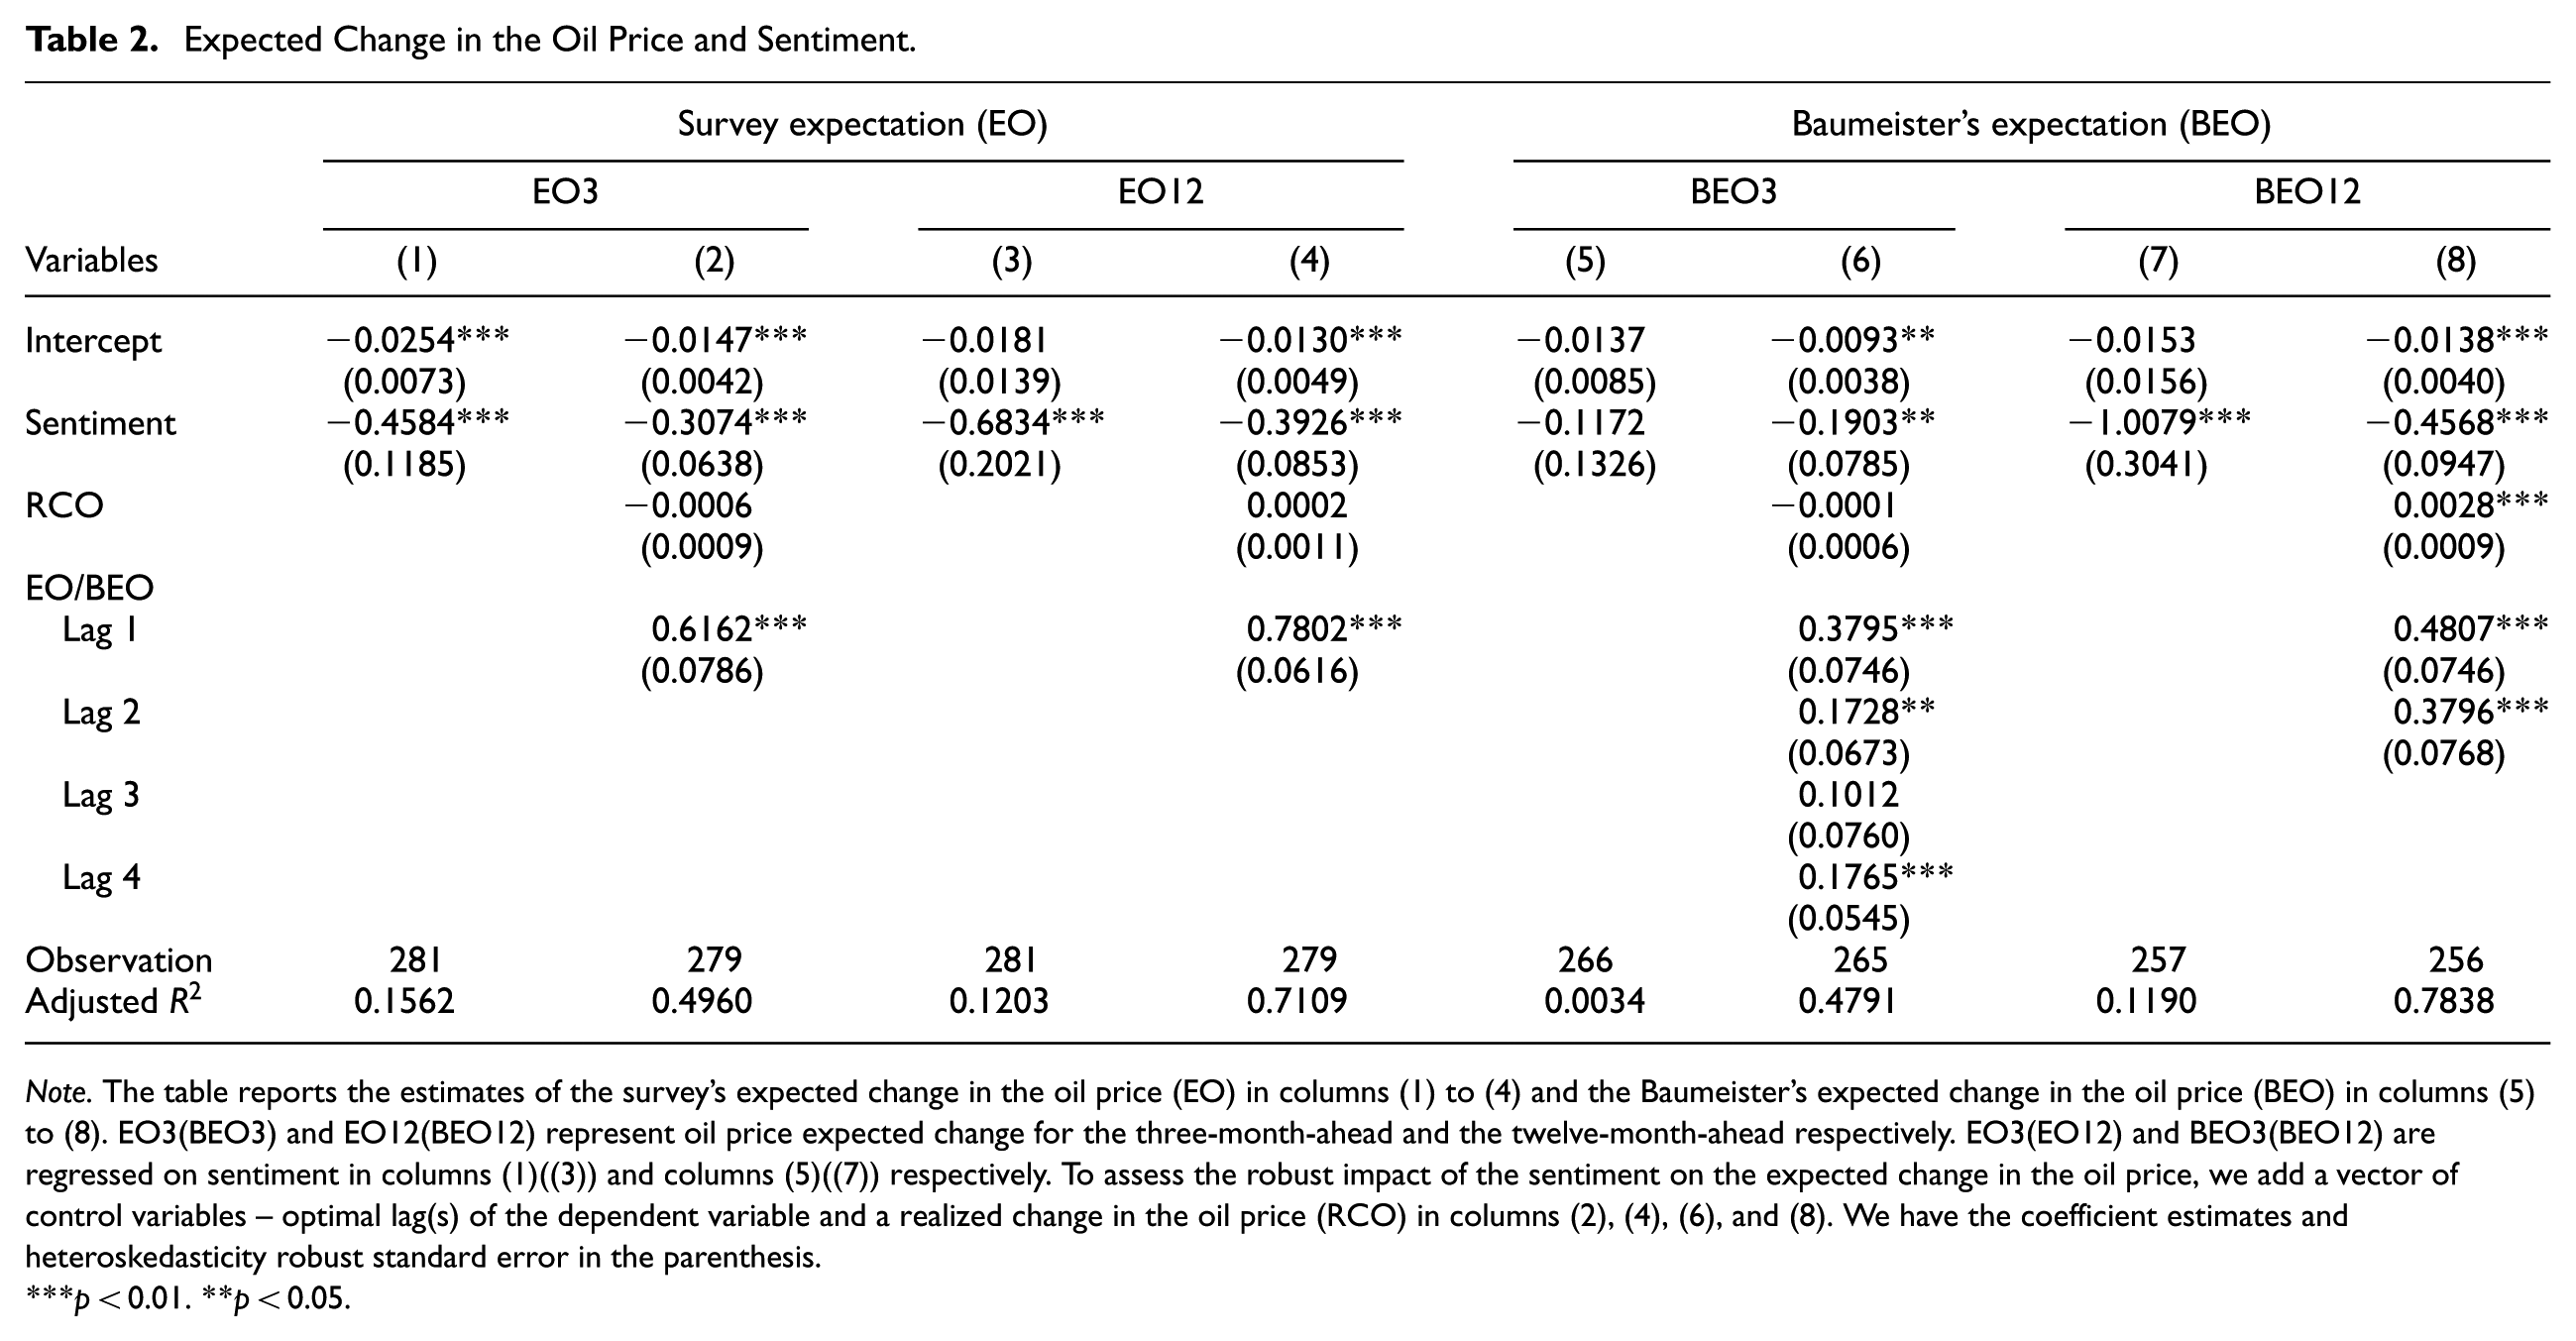
Note. The table reports the estimates of the survey’s expected change in the oil price (EO) in columns (1) to (4) and the Baumeister’s expected change in the oil price (BEO) in columns (5) to (8). EO3(BEO3) and EO12(BEO12) represent oil price expected change for the three-month-ahead and the twelve-month-ahead respectively. EO3(EO12) and BEO3(BEO12) are regressed on sentiment in columns (1)((3)) and columns (5)((7)) respectively. To assess the robust impact of the sentiment on the expected change in the oil price, we add a vector of control variables – optimal lag(s) of the dependent variable and a realized change in the oil price (RCO) in columns (2), (4), (6), and (8). We have the coefficient estimates and heteroskedasticity robust standard error in the parenthesis.
p < 0.01. **p < 0.05.
The impact of sentiment indicators on the expected change presented in Table 2 shows a negative effect on the oil price for both the three- and twelve-month horizons for survey expectations and the twelve-month horizon for market-based expectations. According to columns (1) to (4) and (7) to (8), sentiment exerts a significant negative impact on the expected change in the oil price at the 1% level. This implies that positive media tonality leads to an expected decrease in the price of oil and vice versa. The estimated impact of sentiment is proven to be robust at the significance level of 1% even after adding the optimal lag of the dependent variable and the realized change in oil price as control variables.
As a next step, we disentangle different kinds of news by comparing estimates for positive and negative sentiments. The estimates provided in columns (1) to (8) in Tables 3 and 4 confirm that both positive and negative news sentiments have a respective negative and positive influence on the expected change in the oil price. Again, only the effects over three months for market-based expectations are not significant. However, we identify an asymmetric effect since the coefficient estimates and the adjusted R-squared of negative sentiment are higher compared to the positive sentiment. This asymmetric effect relates to studies that find that oil prices respond differently to positive and negative news (Alfano et al. 2015; Feuerriegel and Neumann 2013; Feuerriegel et al. 2015). These statistical indicators show that negative sentiment strongly explains the expected change in the oil price more than positive sentiment. Generally, the lag of the expected change in the oil price and the realized change in the oil price are shown to positively affect the expected change in the oil price at the 1% significance level. However, we find evidence in columns (2), (4), (6), and (8) that the lag of the expected change in the oil price is a better control compared to the realized change in the oil price. Intuitively, we find that the effect of sentiment becomes smaller once lagged dynamics are added as a control.
Expected Change in the Oil Price, Positive and Negative Sentiments.
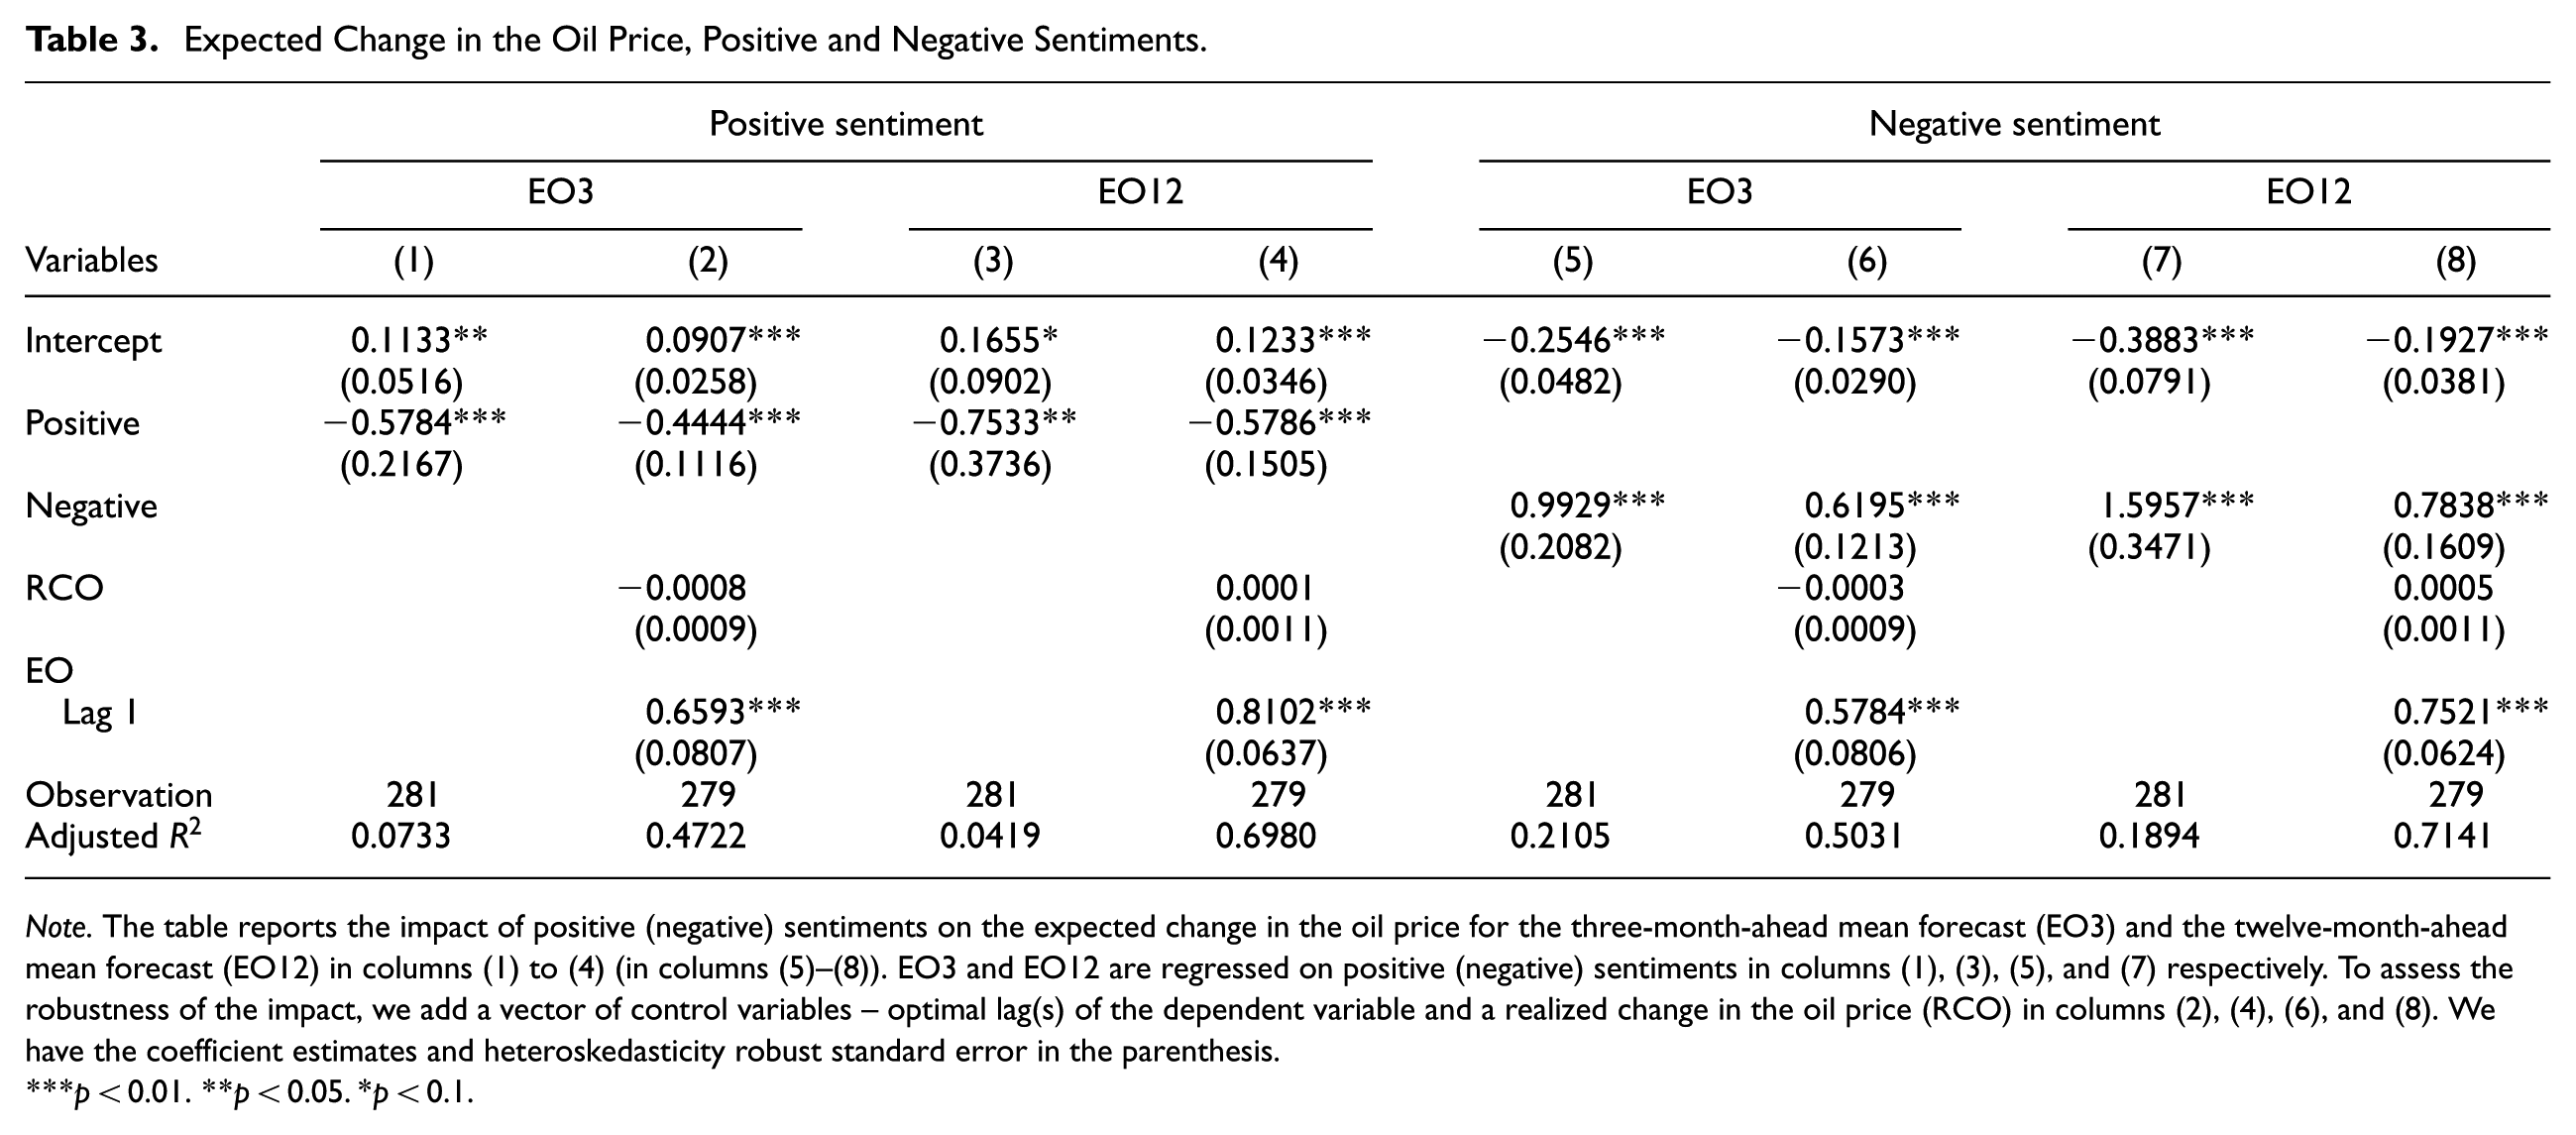
Note. The table reports the impact of positive (negative) sentiments on the expected change in the oil price for the three-month-ahead mean forecast (EO3) and the twelve-month-ahead mean forecast (EO12) in columns (1) to (4) (in columns (5)–(8)). EO3 and EO12 are regressed on positive (negative) sentiments in columns (1), (3), (5), and (7) respectively. To assess the robustness of the impact, we add a vector of control variables – optimal lag(s) of the dependent variable and a realized change in the oil price (RCO) in columns (2), (4), (6), and (8). We have the coefficient estimates and heteroskedasticity robust standard error in the parenthesis.
p < 0.01. **p < 0.05. *p < 0.1.
Baumeister’s Expected Change in the Oil Price, Positive and Negative Sentiments.
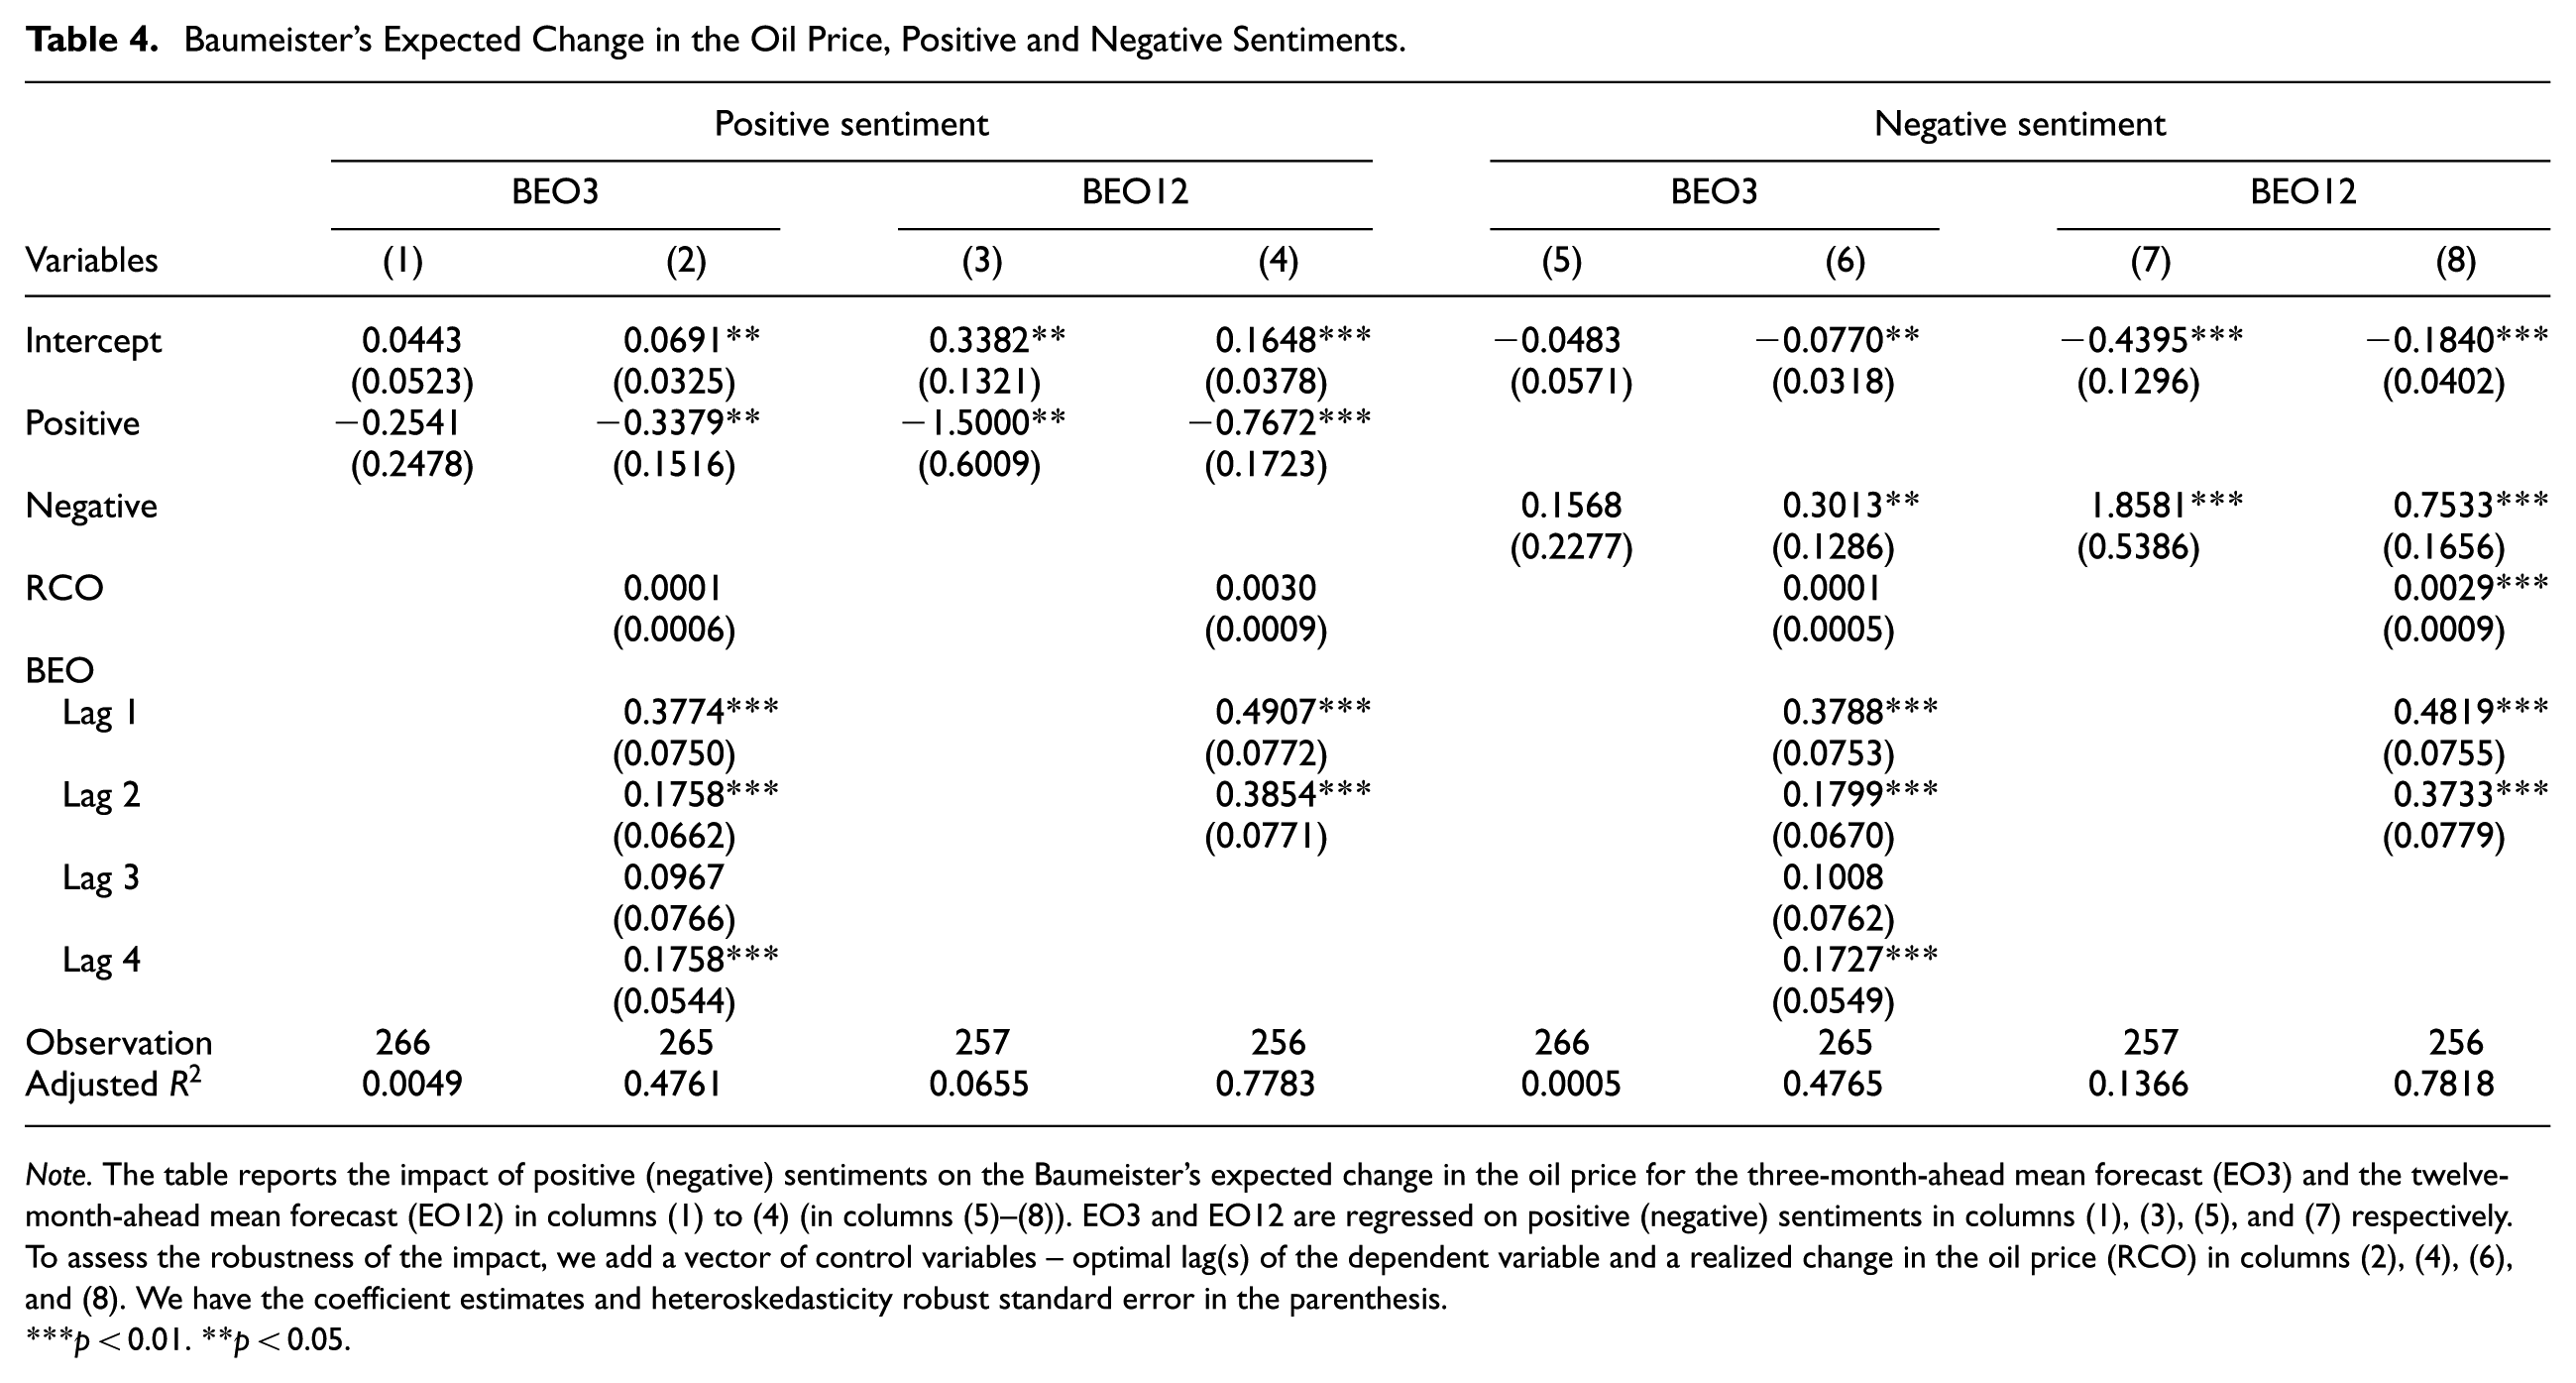
Note. The table reports the impact of positive (negative) sentiments on the Baumeister’s expected change in the oil price for the three-month-ahead mean forecast (EO3) and the twelve-month-ahead mean forecast (EO12) in columns (1) to (4) (in columns (5)–(8)). EO3 and EO12 are regressed on positive (negative) sentiments in columns (1), (3), (5), and (7) respectively. To assess the robustness of the impact, we add a vector of control variables – optimal lag(s) of the dependent variable and a realized change in the oil price (RCO) in columns (2), (4), (6), and (8). We have the coefficient estimates and heteroskedasticity robust standard error in the parenthesis.
p < 0.01. **p < 0.05.
Overall, these results show that media sentiment indicators affect the expected change in the oil price, while they have weaker or no effects on the actual change in the oil price. The only exception is market-based expectations, which only prove significant after including control variables for the three-month horizon. The economic implication is that positive sentiment entices investors to increase their investments and demand for oil, leading to an increase in the spot prices. Forecasters and analysts anticipate a correction in the oil market and expect lower future oil prices. By contrast, negative content of news and social media reports causes fear in the oil market, which eventually leads to the spot oil price declining. This instigates forecasters to anticipate a bounce-back in the oil price, leading to an expected higher oil price. This demonstrates mean reversion expectations, which we further investigate in the next section, where we also analyze forecast errors as the difference between expected and realized prices.
5.4. Sentiments, Forecast Errors, and Uncertainty
As the next step, we assess the effect of sentiments on different dimensions of uncertainty shocks. On the one hand, we analyze whether disagreement among forecasters is affected by sentiments based on the following specifications:

where
As a second step, we explore the realized survey forecast error and Baumeister’s (2023) one-month market-based oil price surprises (POS) and EOS. We assess whether forecast errors, oil price surprises, and expectation shocks are affected by sentiments based on the following specification:

where
We start our assessment based on the results of the realized forecast error displayed in Table 5. The results resemble the previous effects on expected oil price changes. Both positive and negative effects significantly affect forecast errors, although the effects are stronger for negative sentiments. This is in line with Wang et al. (2021) and Narayan (2020), who find that negative sentiment strongly affects the oil market more than positive sentiment. Positive sentiment does not have a significant effect on twelve-month forecast errors in the specification without controls. Table 6 shows a somewhat reversed picture for market-based expectations, whereby positive sentiment has a significant impact on market-based expectation shocks and surprises once the control variables are added, while a significant effect of negative sentiment is only observed without the control variables.
Realized Forecast Error, Positive and Negative Sentiment.
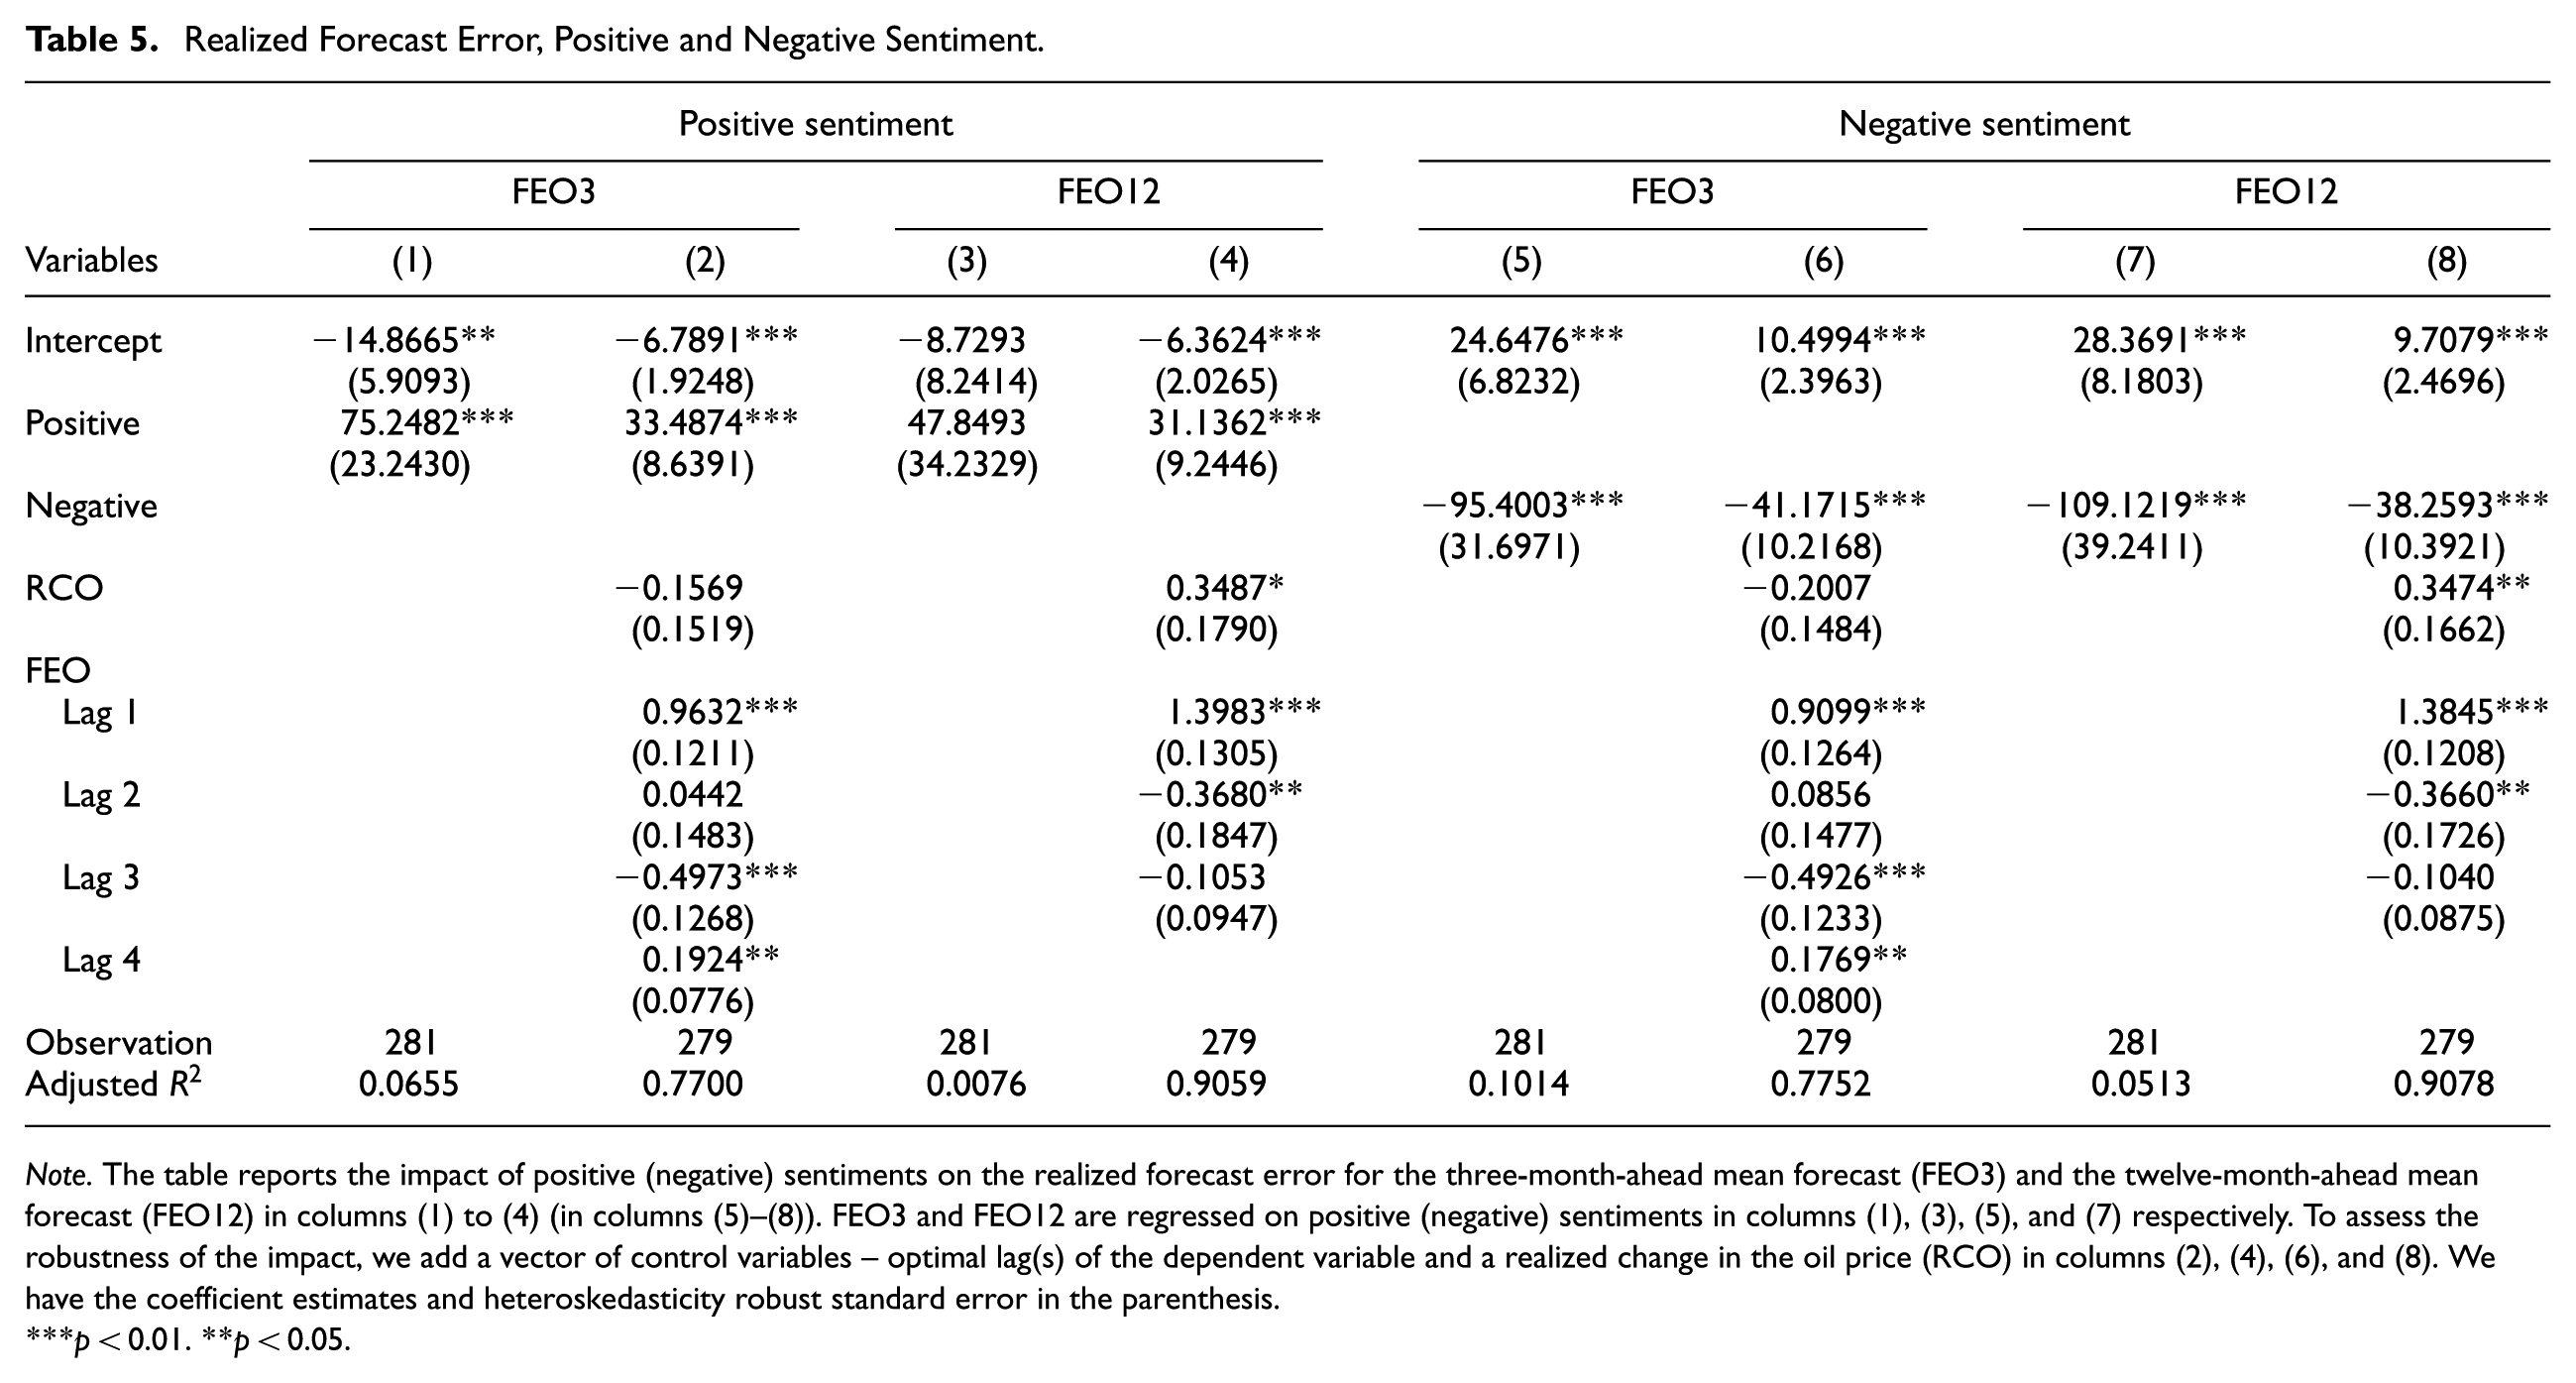
Note. The table reports the impact of positive (negative) sentiments on the realized forecast error for the three-month-ahead mean forecast (FEO3) and the twelve-month-ahead mean forecast (FEO12) in columns (1) to (4) (in columns (5)–(8)). FEO3 and FEO12 are regressed on positive (negative) sentiments in columns (1), (3), (5), and (7) respectively. To assess the robustness of the impact, we add a vector of control variables – optimal lag(s) of the dependent variable and a realized change in the oil price (RCO) in columns (2), (4), (6), and (8). We have the coefficient estimates and heteroskedasticity robust standard error in the parenthesis.
p < 0.01. **p < 0.05.
Expectation Shock, Oil Price Surprises, Positive and Negative.
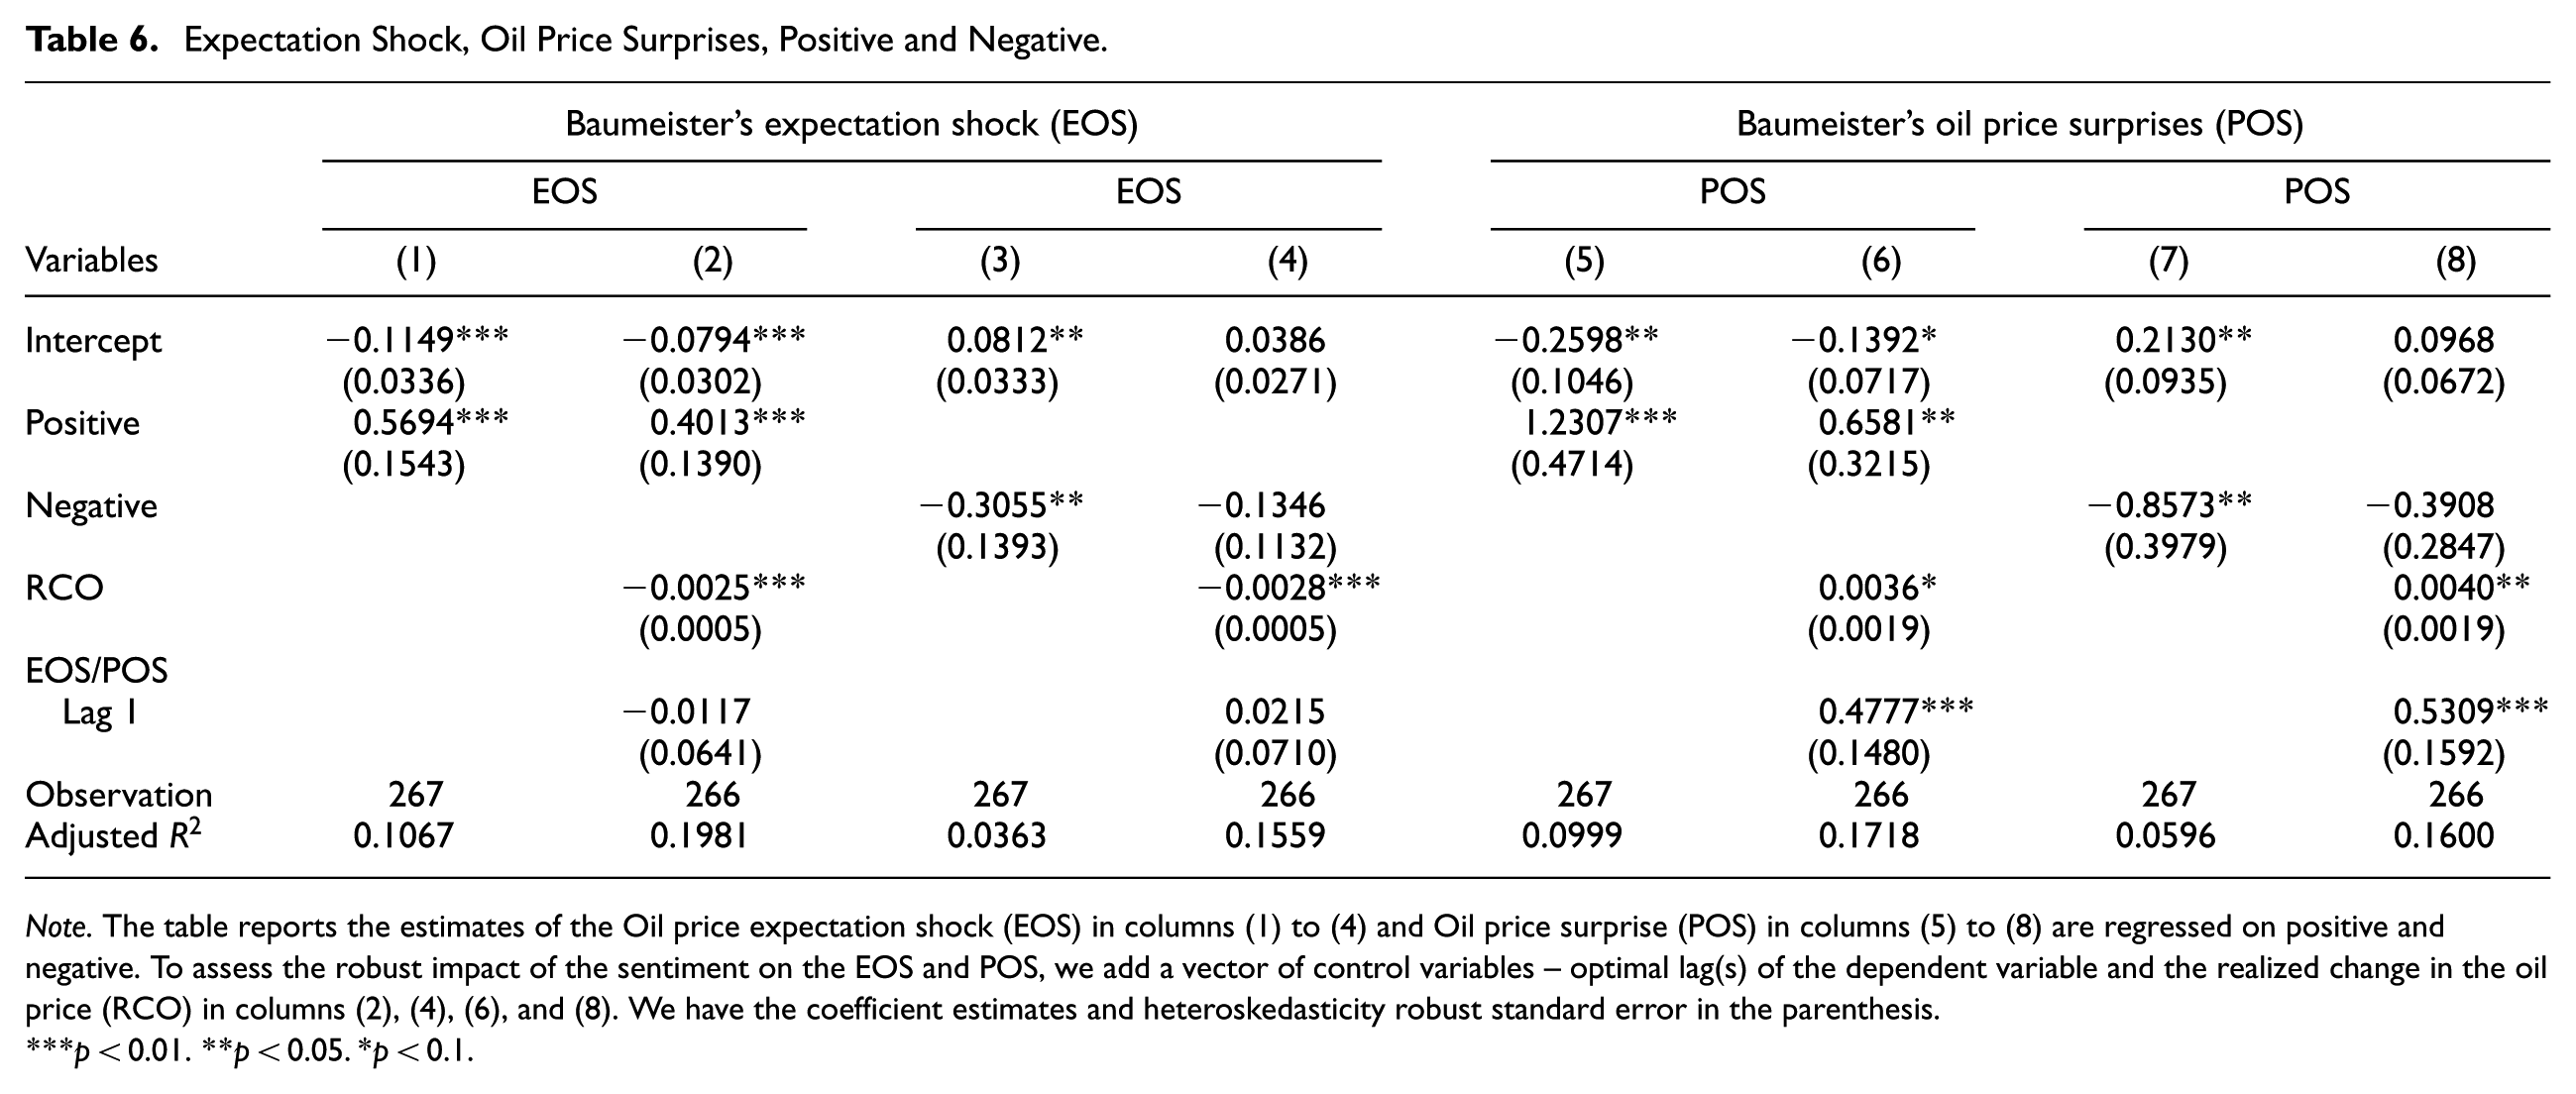
Note. The table reports the estimates of the Oil price expectation shock (EOS) in columns (1) to (4) and Oil price surprise (POS) in columns (5) to (8) are regressed on positive and negative. To assess the robust impact of the sentiment on the EOS and POS, we add a vector of control variables – optimal lag(s) of the dependent variable and the realized change in the oil price (RCO) in columns (2), (4), (6), and (8). We have the coefficient estimates and heteroskedasticity robust standard error in the parenthesis.
p < 0.01. **p < 0.05. *p < 0.1.
Overall, the adjustment of survey-based expectations over both horizons coincides with higher forecast errors. On the other hand, it is interesting to discuss the finding for negative sentiments, given the previous result that negative sentiments only affect market-based expectations over twelve months but not three months. Adjustment (non-adjustment) of expectations over 12 (3) months in case of negative sentiments leads to insignificant (significant) surprises/expectation shocks. This could imply that survey forecasts tend to over-react to negative sentiments while market-based measures do not. For surveys, these results explain the missing effect on oil price changes in the previous section based on the idea of over- and under-reaction. The effect of sentiments on oil price expectations transmits into forecast errors rather than actual changes.
Table 7 shows that our results continue to hold if we consider the effect of overall sentiment on the absolute forecast error, but also illustrates the need to distinguish between positive and negative sentiment. The overall effect on survey-based errors is not significant over twelve months, while market-based surprises are affected over both horizons.
Realized Absolute Forecast Error, Oil Price Surprises, and Absolute Sentiment.
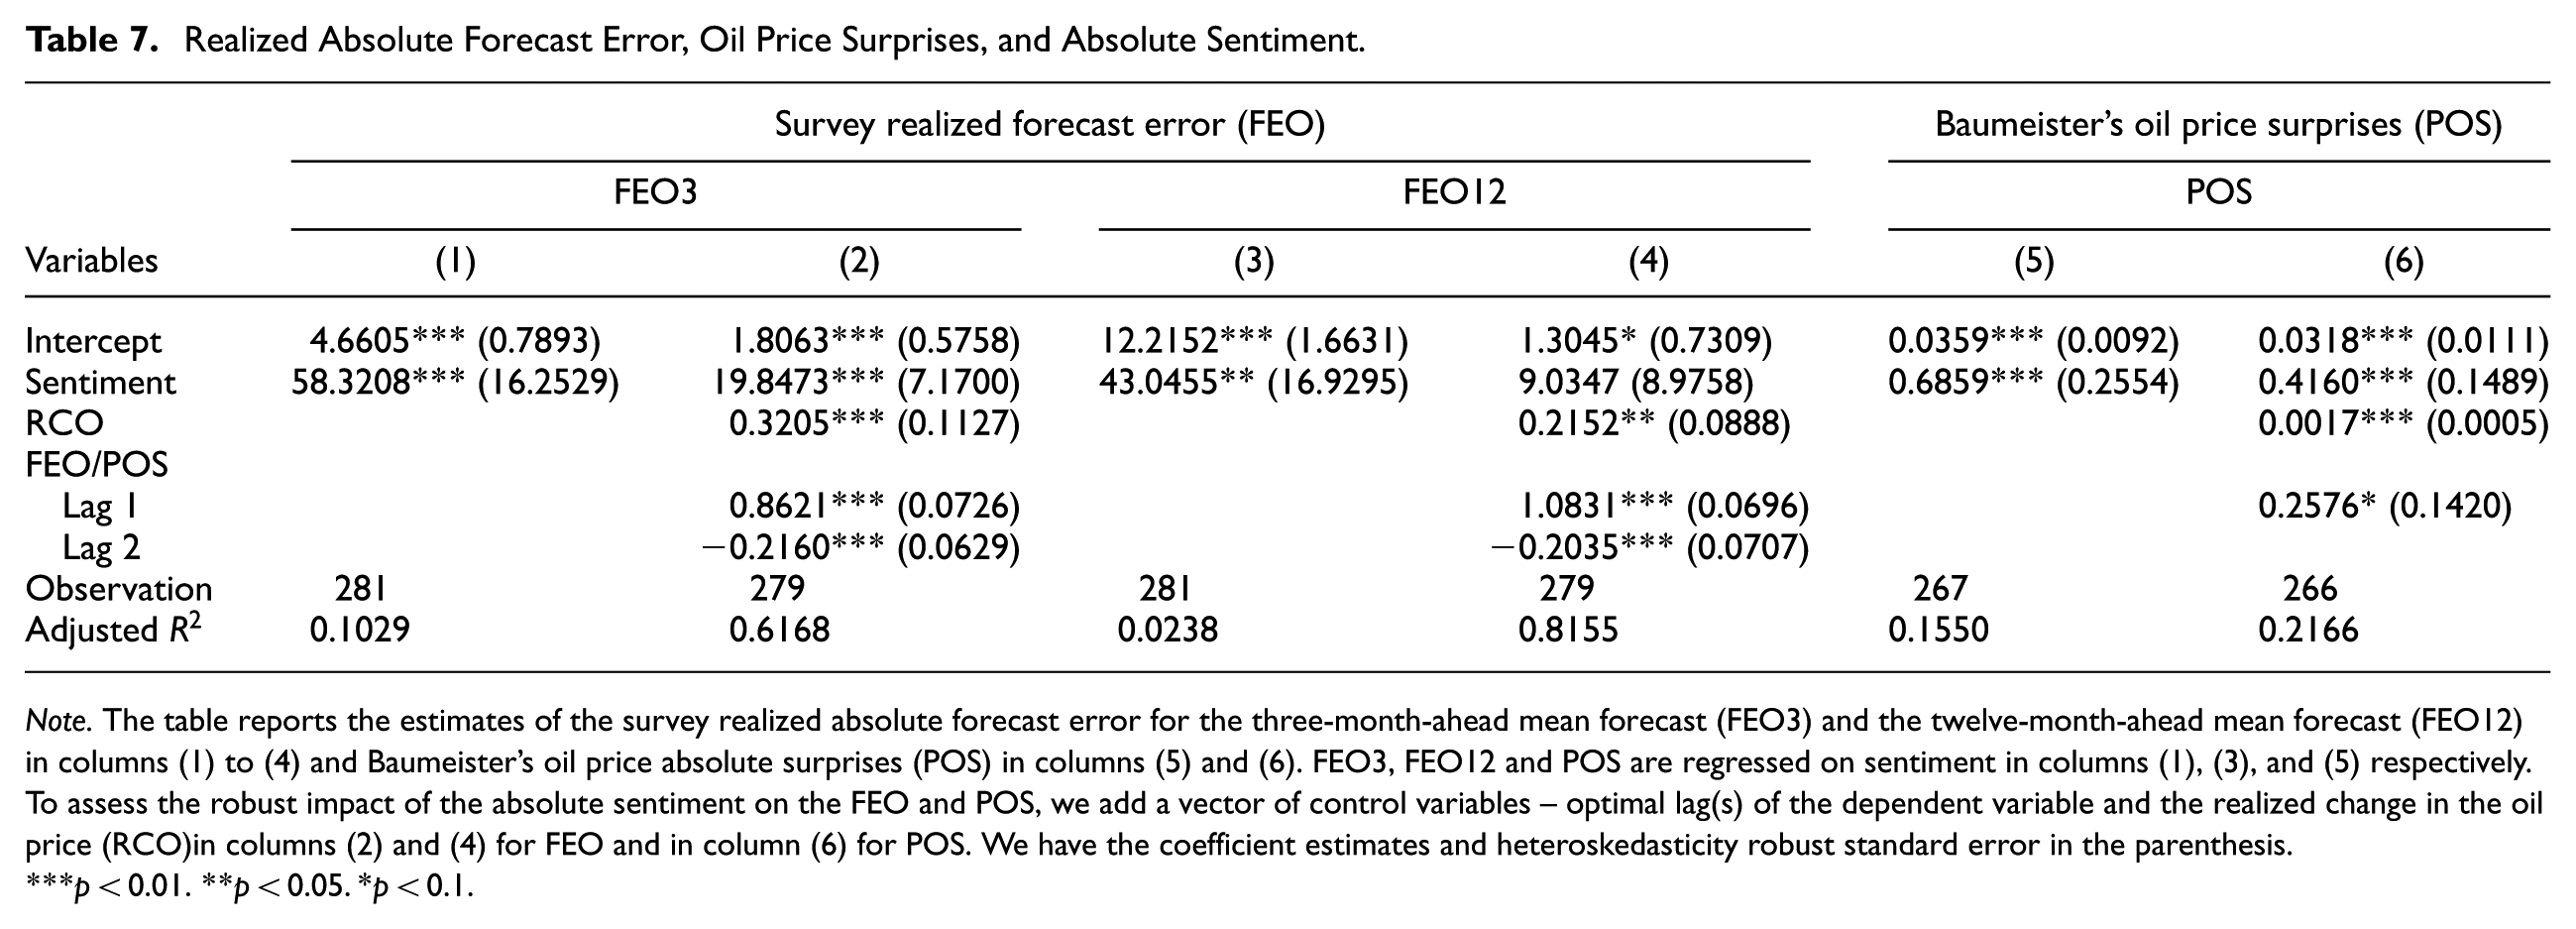
Note. The table reports the estimates of the survey realized absolute forecast error for the three-month-ahead mean forecast (FEO3) and the twelve-month-ahead mean forecast (FEO12) in columns (1) to (4) and Baumeister’s oil price absolute surprises (POS) in columns (5) and (6). FEO3, FEO12 and POS are regressed on sentiment in columns (1), (3), and (5) respectively. To assess the robust impact of the absolute sentiment on the FEO and POS, we add a vector of control variables – optimal lag(s) of the dependent variable and the realized change in the oil price (RCO)in columns (2) and (4) for FEO and in column (6) for POS. We have the coefficient estimates and heteroskedasticity robust standard error in the parenthesis.
p < 0.01. **p < 0.05. *p < 0.1.
As a next step, we analyze the effect of sentiments on disagreement among forecasters and market-based expectation shocks. We again compare the effect of the overall sentiment as well as the effect of positive and negative sentiment. We find that the negative effect of the overall sentiment on three-month disagreement displayed in Table 8 solely reflects higher disagreement in the case of negative news as reported in Table 9. Disagreement among professionals and expectations shocks are higher in the case of negative shocks, while positive shocks do not affect disagreement. Table 8 also shows the results for the effects of sentiment on absolute market-based expectations shocks. Similar to the effect of absolute sentiment on oil price surprises, we find that sentiments have a weak positive effect on such shocks. The same finding holds if we consider both positive and negative sentiments.
Forecast Disagreement, Absolute Expectation Shock and Sentiment.
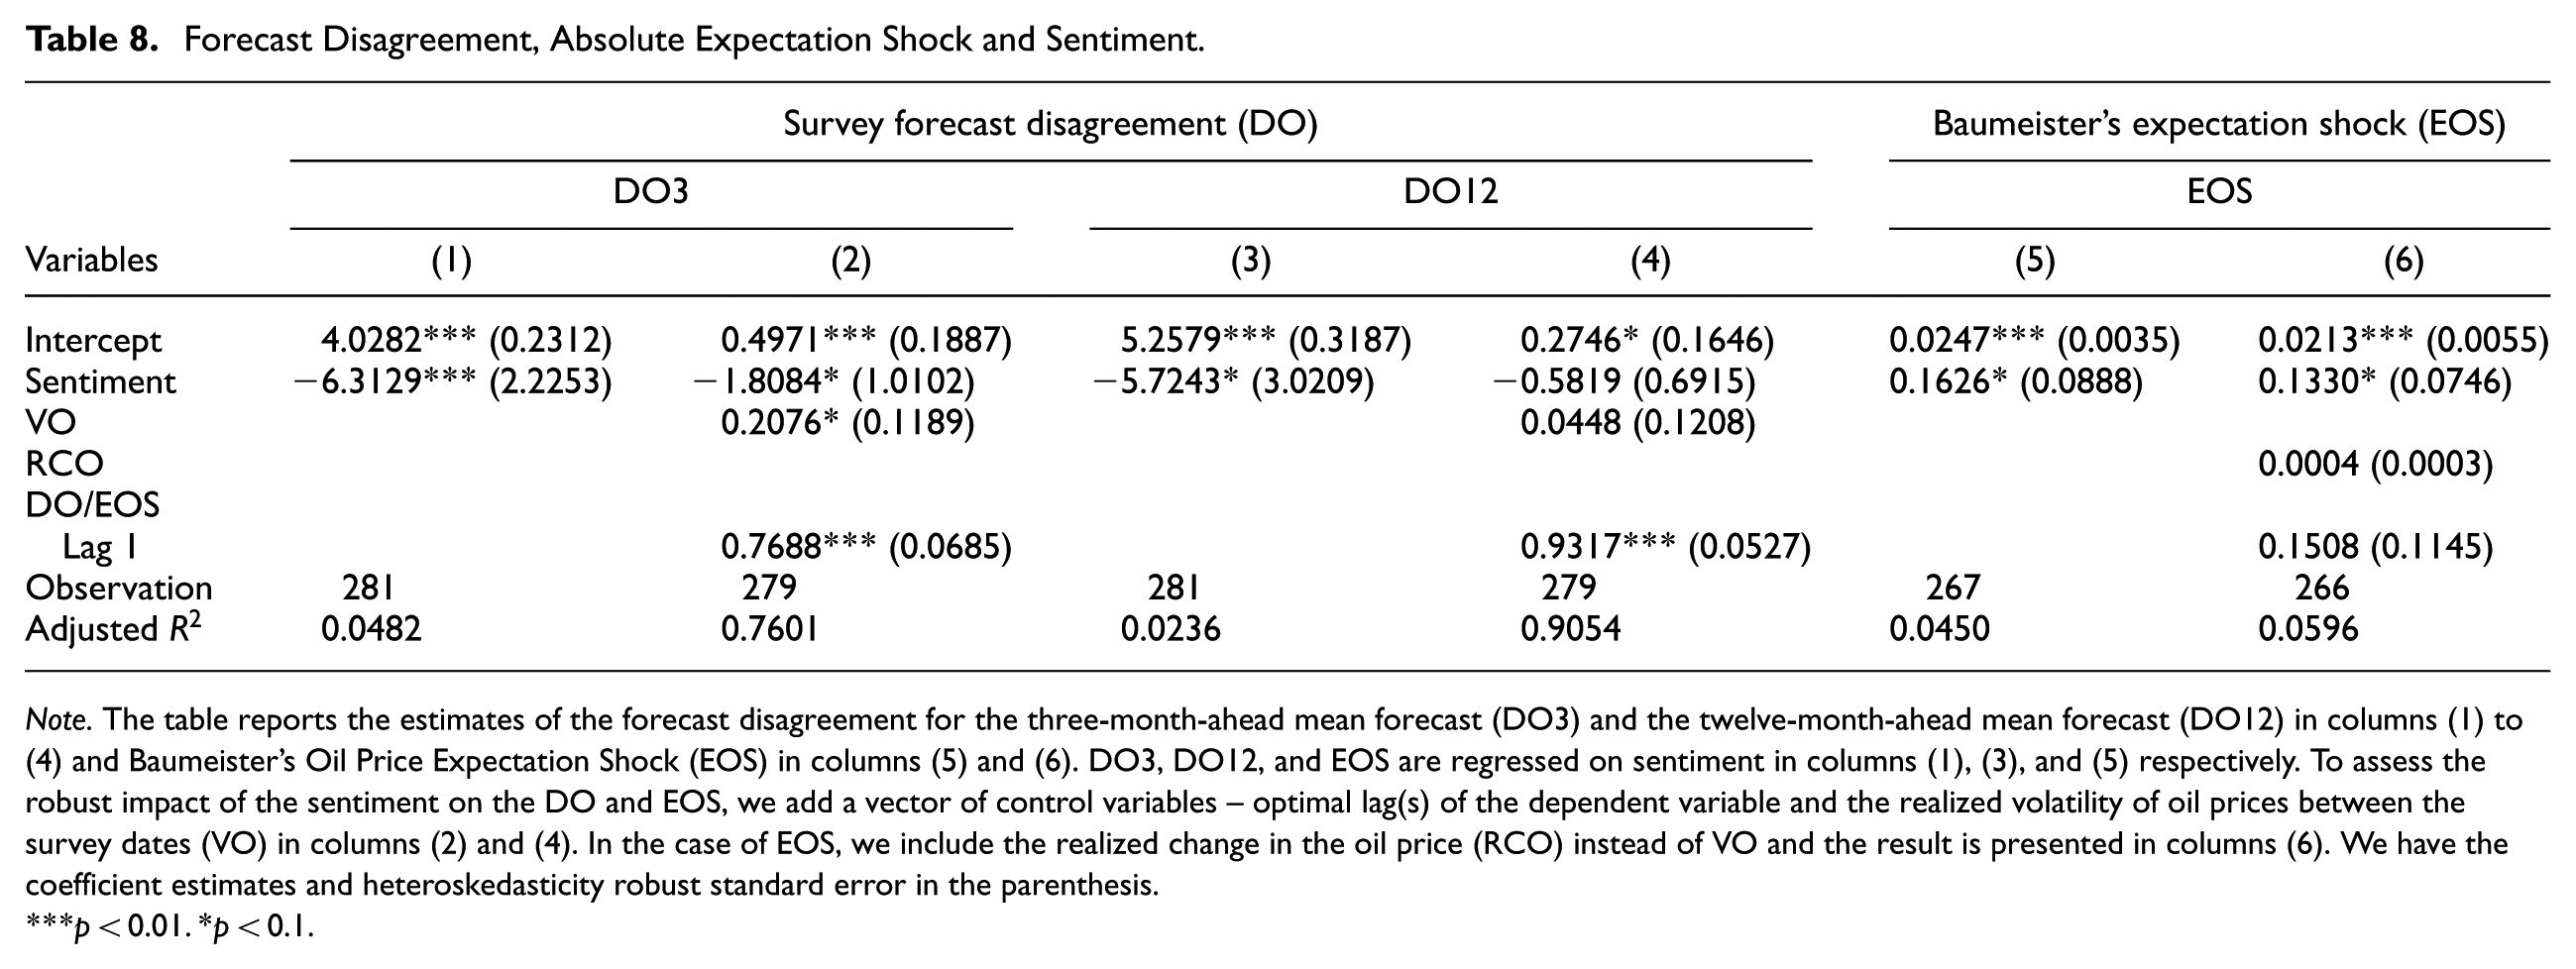
Note. The table reports the estimates of the forecast disagreement for the three-month-ahead mean forecast (DO3) and the twelve-month-ahead mean forecast (DO12) in columns (1) to (4) and Baumeister’s Oil Price Expectation Shock (EOS) in columns (5) and (6). DO3, DO12, and EOS are regressed on sentiment in columns (1), (3), and (5) respectively. To assess the robust impact of the sentiment on the DO and EOS, we add a vector of control variables – optimal lag(s) of the dependent variable and the realized volatility of oil prices between the survey dates (VO) in columns (2) and (4). In the case of EOS, we include the realized change in the oil price (RCO) instead of VO and the result is presented in columns (6). We have the coefficient estimates and heteroskedasticity robust standard error in the parenthesis.
p < 0.01. *p < 0.1.
Forecast Disagreement, Positive and Negative Sentiments.
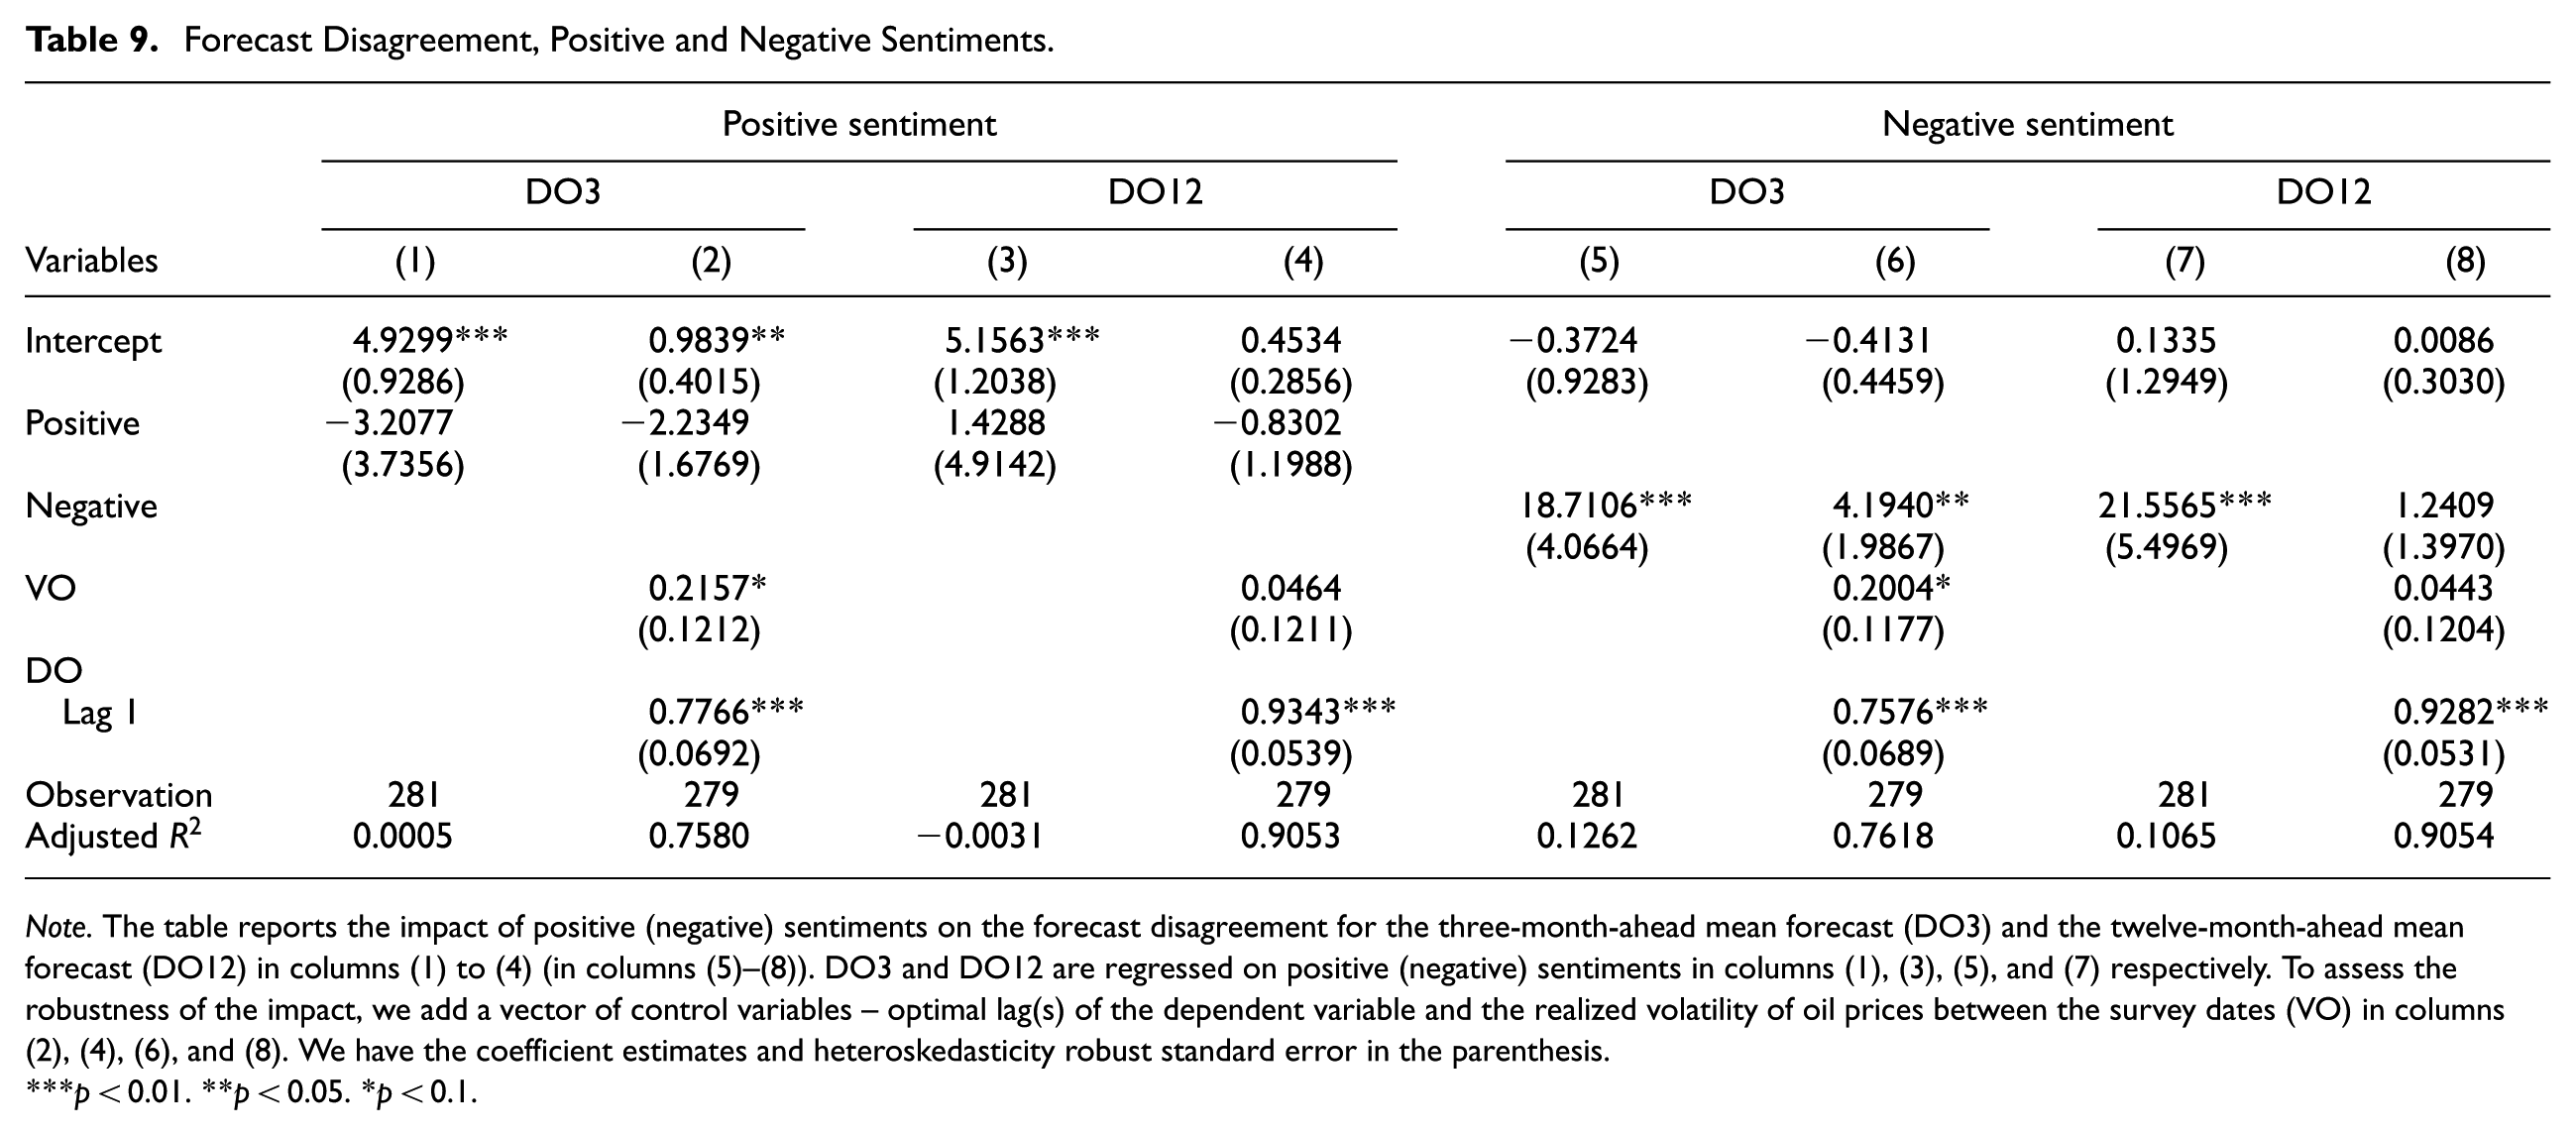
Note. The table reports the impact of positive (negative) sentiments on the forecast disagreement for the three-month-ahead mean forecast (DO3) and the twelve-month-ahead mean forecast (DO12) in columns (1) to (4) (in columns (5)–(8)). DO3 and DO12 are regressed on positive (negative) sentiments in columns (1), (3), (5), and (7) respectively. To assess the robustness of the impact, we add a vector of control variables – optimal lag(s) of the dependent variable and the realized volatility of oil prices between the survey dates (VO) in columns (2), (4), (6), and (8). We have the coefficient estimates and heteroskedasticity robust standard error in the parenthesis.
p < 0.01. **p < 0.05. *p < 0.1.
These results demonstrate the impact of sentiments on uncertainty in terms of disagreement, surprises, and forecast errors, which relate to studies that find evidence of media sentiments that affect uncertainty or volatility of oil prices (Campos et al. 2017; Lehrer et al. 2021; Qadan and Nama 2018).
5.5. Local Projections
As an extension to our previous analysis, we also estimate the dynamic effect of sentiments via local projections based on the previous specification as proposed by Jordà (2005). This has been employed in the existing literature studying the media-based sentiment regarding the times of the survey (Shapiro et al. 2022). The local projection is expressed in the following equation:
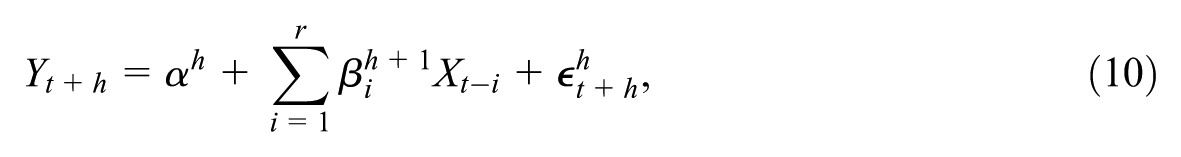
where
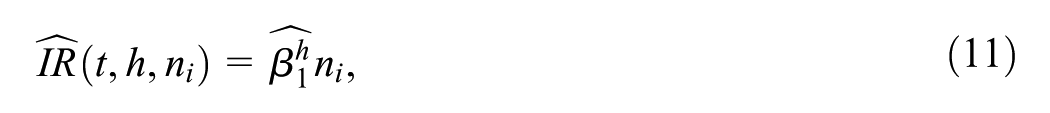
where
In line with our previous setting, we estimate six specifications: the first two include effects on the expectation measures (EO and BEO), while the remaining four specifications assess the effect on the four uncertainty proxies (FEO, DO, POS, and EOS). The results of the local projection for the sentiment indicators are displayed in Figures 6 to 11.
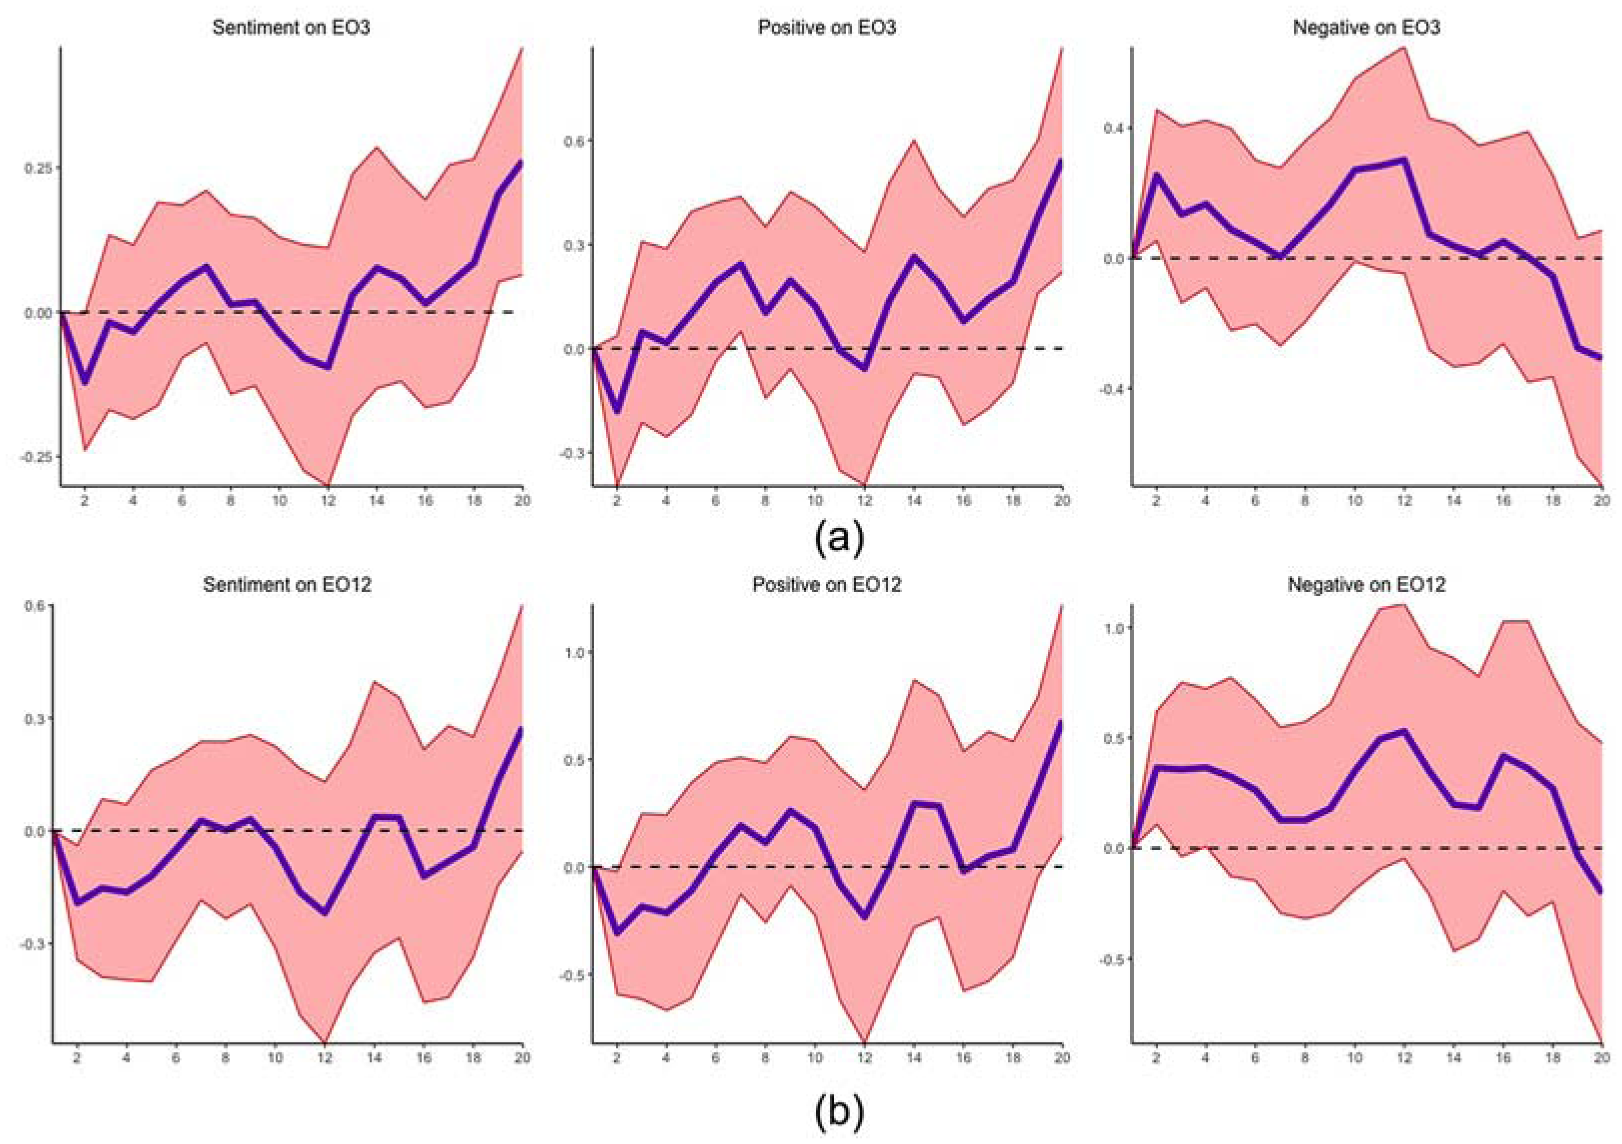
The responses of survey based expectations for three- and twelve-months horizons to shocks from sentiment, positive and negative on the survey date: (a) survey expected change – three months horizon and (b) survey expected change – twelve months horizon.
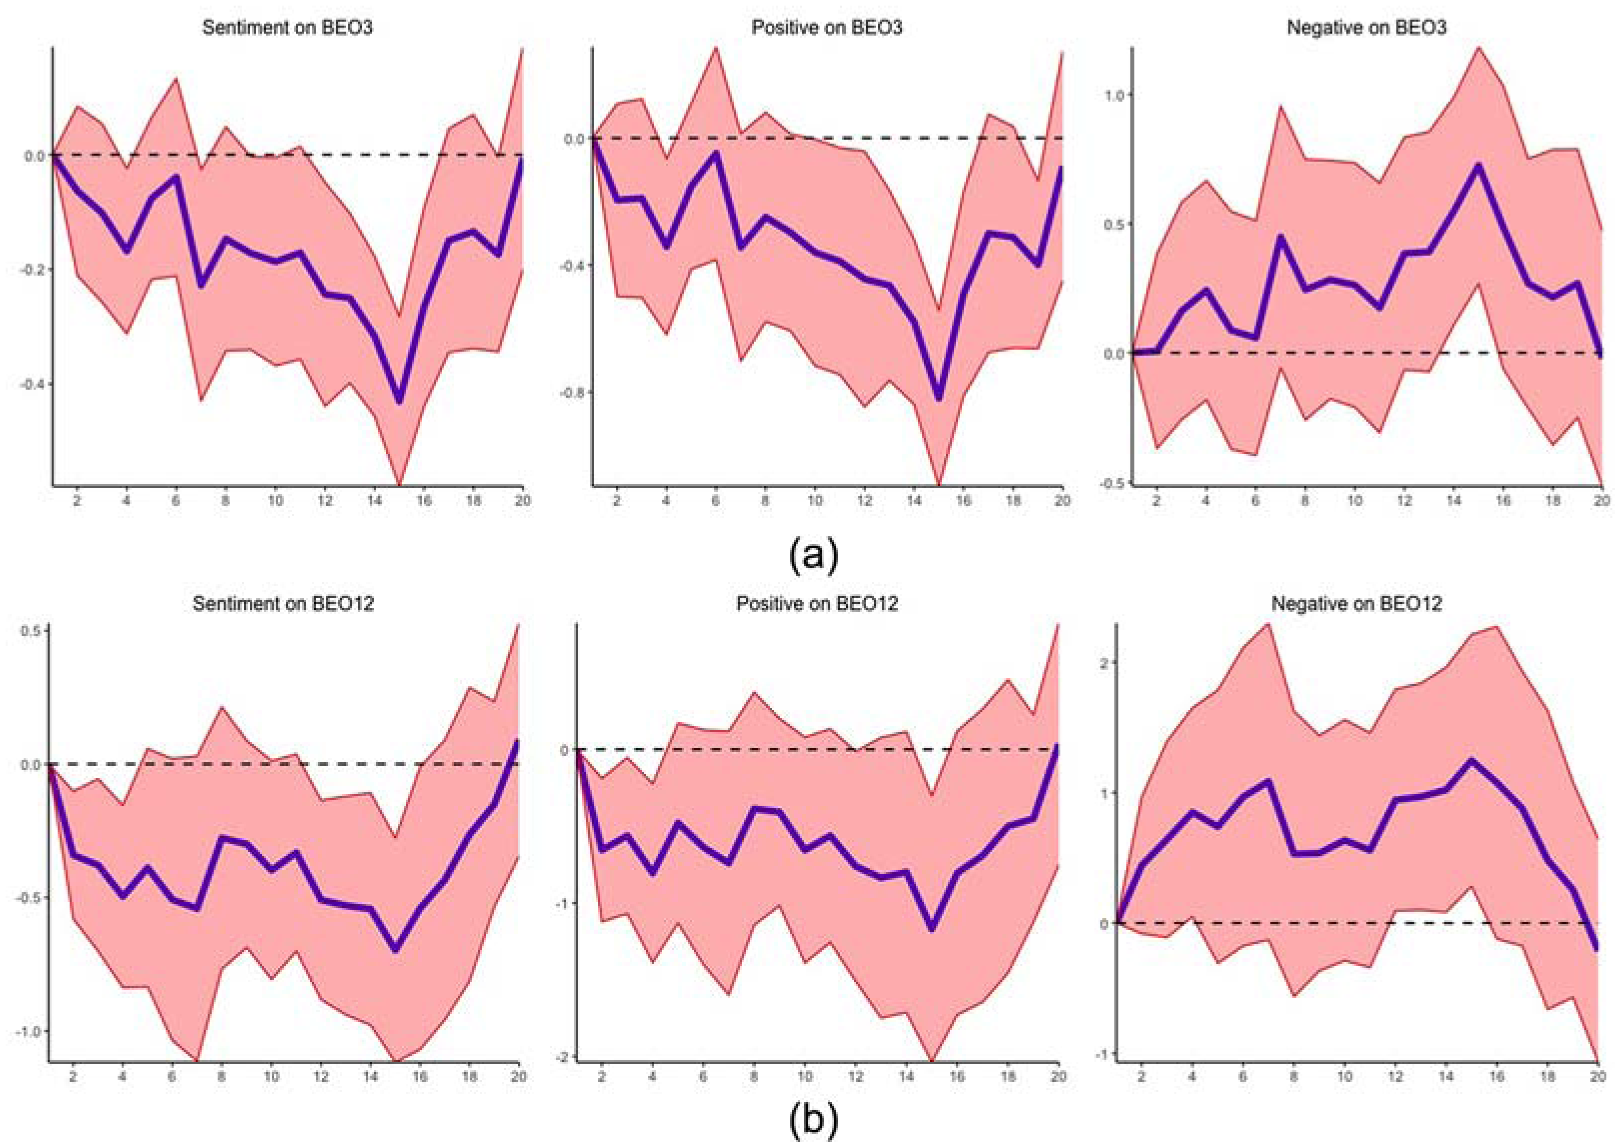
The responses of Baumeister’s oil price expectation for three- and twelve-months horizons to shocks from average sentiment, positive and negative over the previous month: (a) Baumeister’s expected change – three months horizon and (b) Baumeister’s expected change – twelve months horizon.
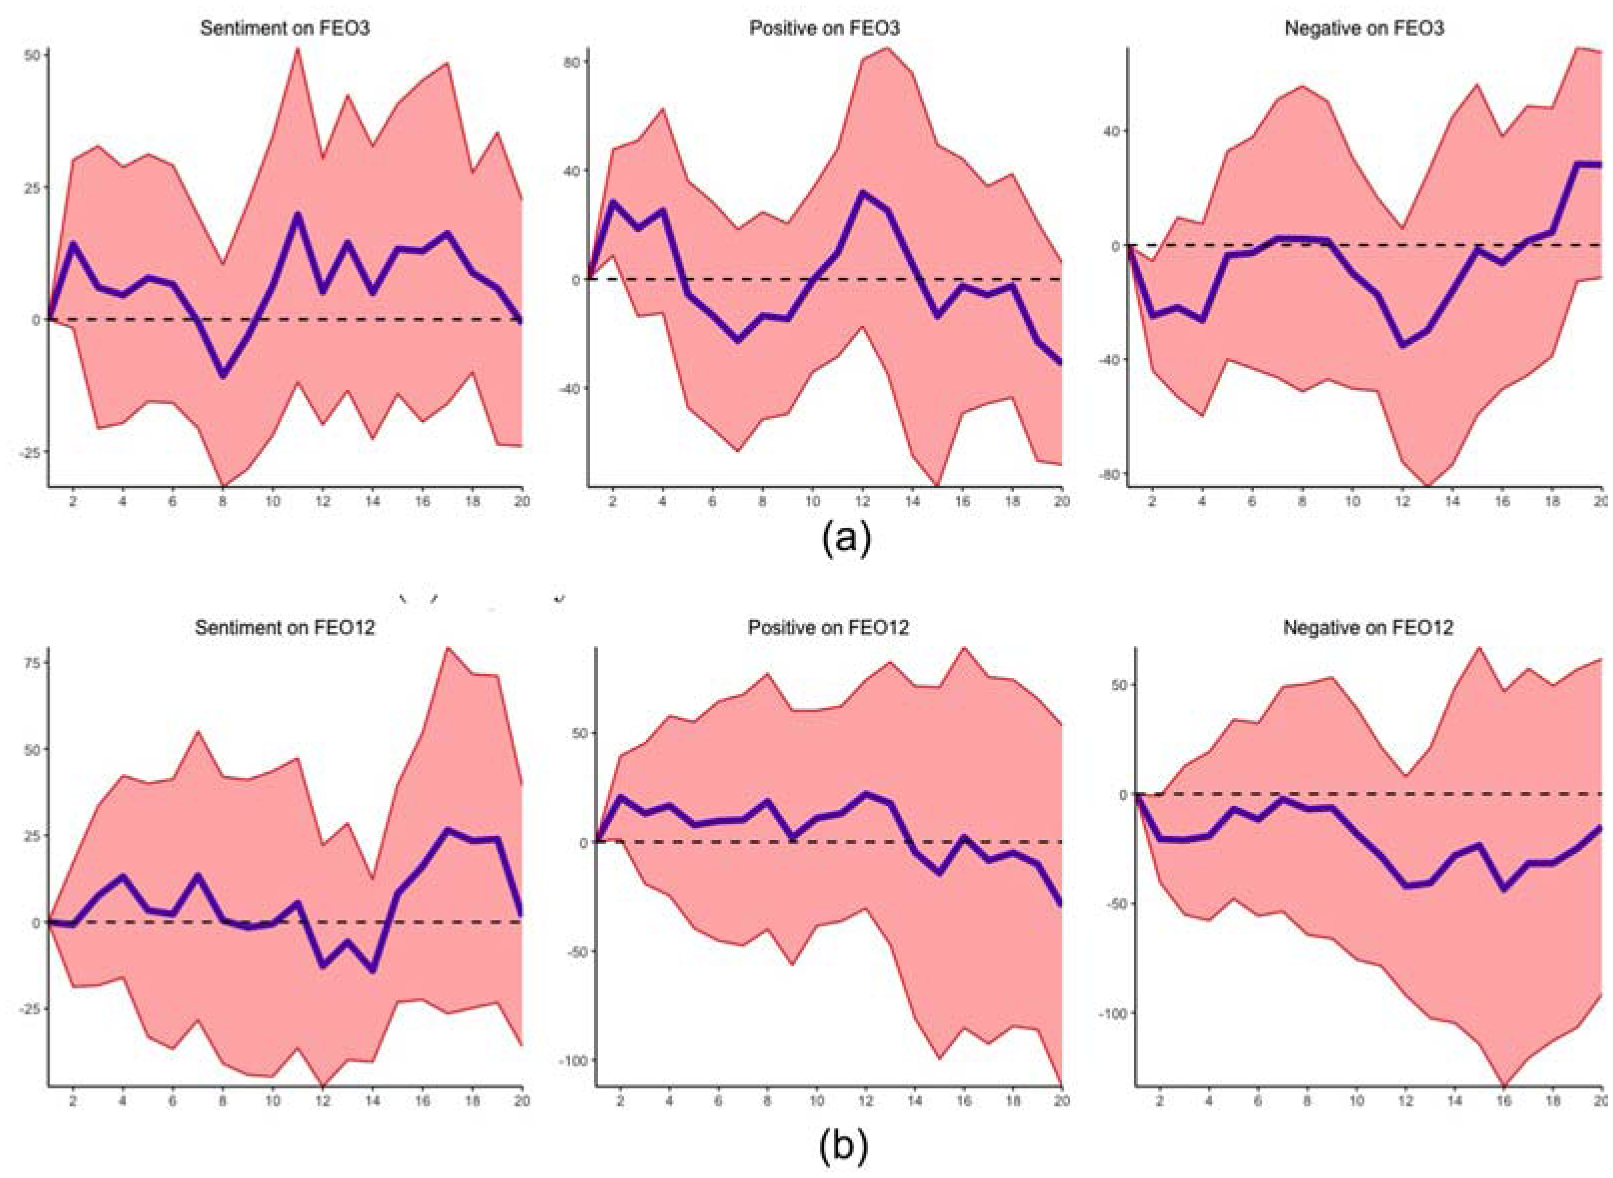
The responses of survey forecast error for three- and twelve-months horizons to shocks from sentiment, positive and negative on the survey date: (a) survey forecast error – three months horizon and (b) survey forecast error – twelve months horizon.
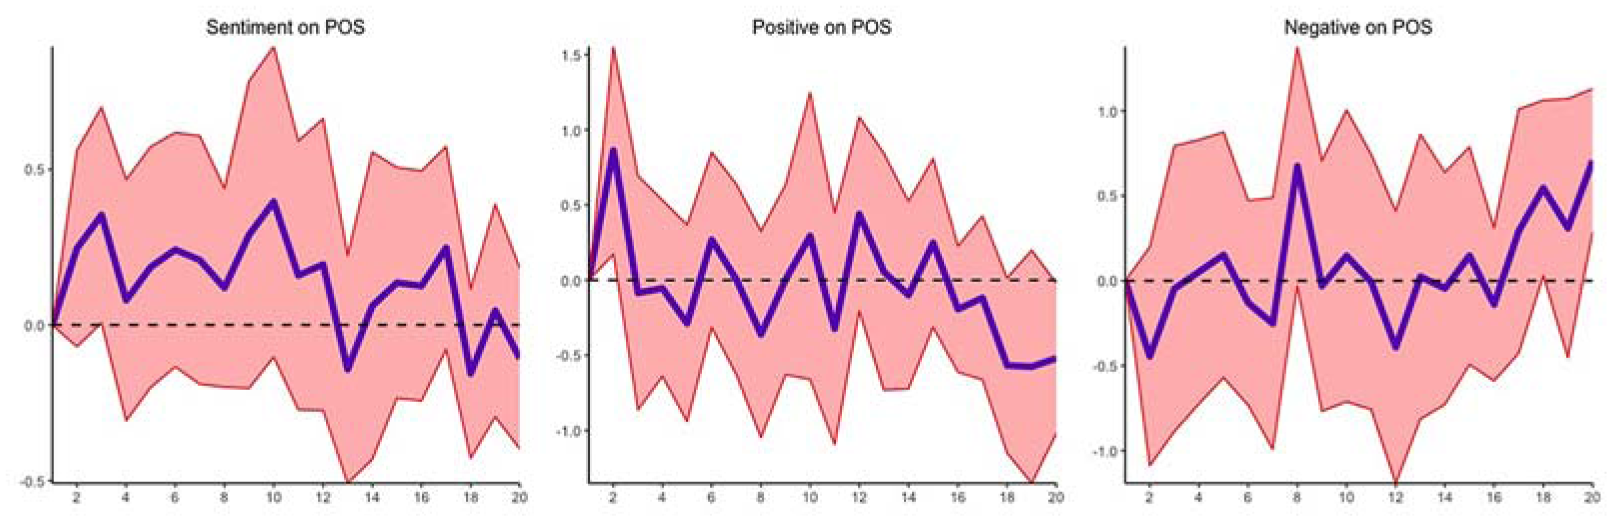
The responses of Baumeister’s surprise to shocks from average sentiment, positive and negative over the previous month.
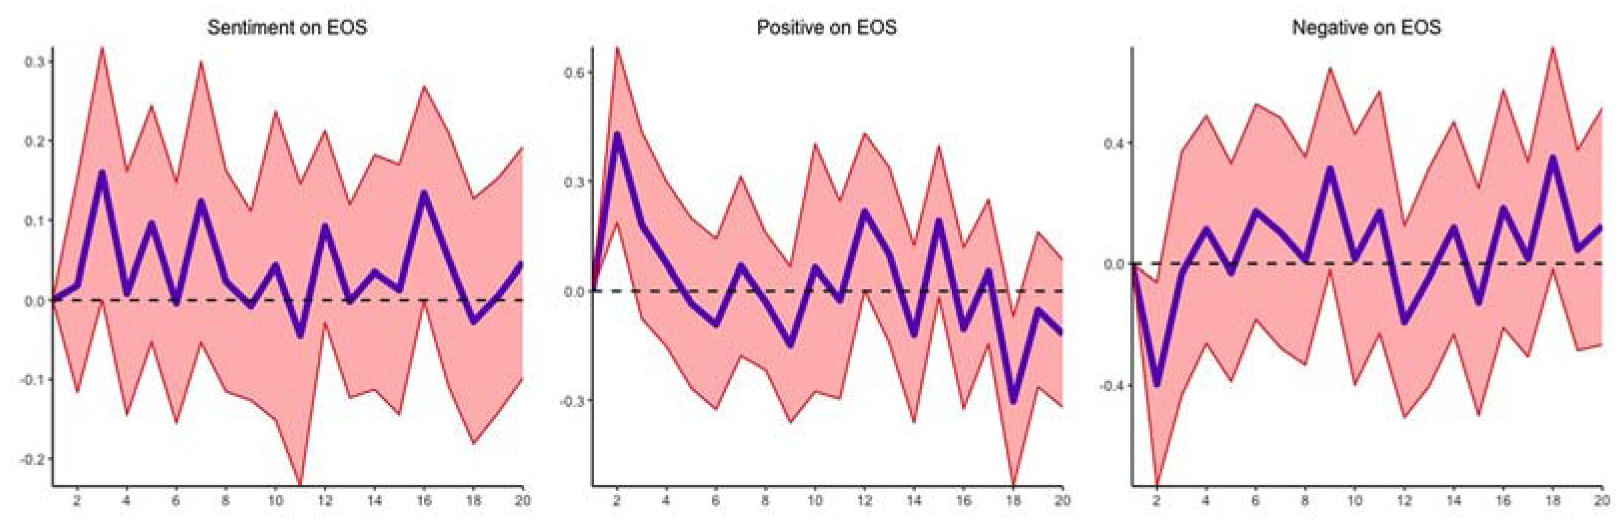
The responses of Baumeister’s oil price expectation shock to shock from average sentiment, positive and negative over the previous month.
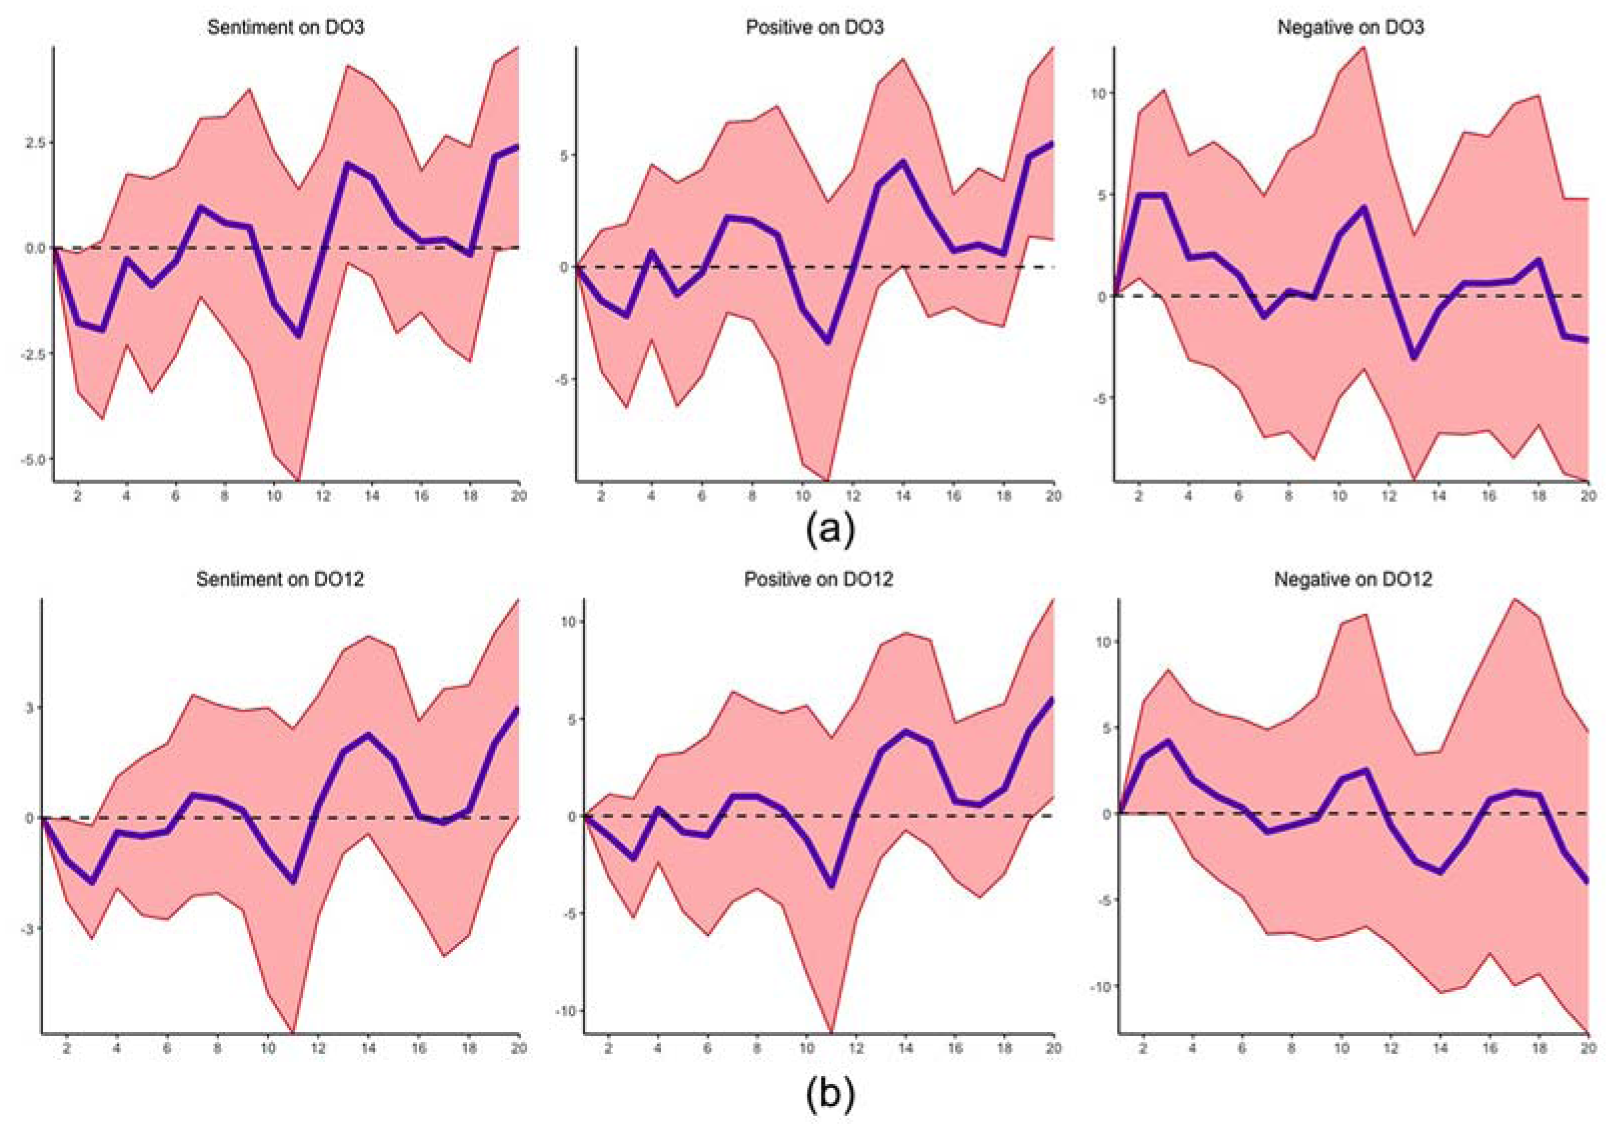
The responses of forecast disagreement for three- and twelve-months horizons to shocks from sentiment, positive and negative on survey date: (a) forecast disagreement – three months horizon and (b) forecast disagreement – twelve months horizon.
The results resemble our previous findings, whereby we observe that a shock from negative sentiment leads to a short-lived expected increase in survey-based oil price changes over three and twelve months, while the effect is only borderline significant over twelve months for market-based expectations. We also find that three-month disagreement among forecasters significantly increases, while forecast error, oil price surprise, and expectation shocks fall for both three- and twelve-month-ahead forecasts. 6 These dynamic results are consistent with our previous analysis, even though uncertainties surround some of the estimated coefficients due to some of the confidence bands straddling the zero line. They show that investors or analysts over-react to negative sentiment shocks while under-reacting to sentiment and positive shocks.
5.6. Timing Surprise and Sentiments
Media sentiments have been demonstrated to significantly drive the fluctuation of oil futures prices and other commodities futures contracts such as gas and gold (Borovkova and Mahakena 2015; Li et al. 2021; Smales 2015; Wang et al. 2021). Thus far, we have examined sentiment impact on expectations and uncertainties in the oil market with uniformity in their responses. However, under certain circumstances, the oil price forecast errors or surprises differ in their response to an event compared to the expected oil futures contracts, which correspond to the disproportionate level of the measured error or surprises. Accordingly, there might be unevenness of sentiment impact on the oil forecast error or surprises. One explanation for the absence of uniformity is that the oil price errors or surprises in the series are only errors or surprises to a greater degree concerning the timing in the oil market. Following Bernanke and Kuttner (2005), we define the timing surprise (TS) as the difference between a change in expected oil futures contracts (

where the first bracket represents the change in expected oil futures contracts and the second bracket denotes the forecast error/surprise. The timing surprise essentially captures the discrepancy between the market’s expected change in futures prices and the realized forecast errors, suggesting the extent to which the market’s expectations are aligned with actual prices. Suppose that an action or event occurs in the oil market: the timing surprise of the event with an equal impact on expected oil futures contracts and the oil forecast error/surprise will be zero, whereas if the event largely affects the expected oil futures contracts more than the forecast error, the timing surprise will be positive, and vice versa.
One question that emerges concerns how significantly sentiments contribute to the timing surprises. To examine this, we run the following regression:

where
The results reported in AppendixTables 4.1 and 4.2 show that sentiment and positive media sentiment cause a decline in the timing surprise, while negative sentiment increases the timing surprise. This is consistent with the shock dynamic effect in Figure 12. The negative sentiment exerts a stronger impact. This indicates that the oil surprise or forecast error reacts more positively to positive sentiment than the level of how the future contract price reacts to positive sentiment, which eventually causes the timing surprise in the oil market to fall. By contrast, negative sentiment produces fear in the oil market, which causes the oil spot price to fall below the expected oil price, thus prompting a decrease in oil surprises or forecast error, and hence leading to an increment in the timing surprise. This corresponds with our earlier implication that investors and forecasters under-react to positive sentiment while over-reacting to negative sentiment to ensure corrections in the oil market, which generates a significant impact on the timing surprise.
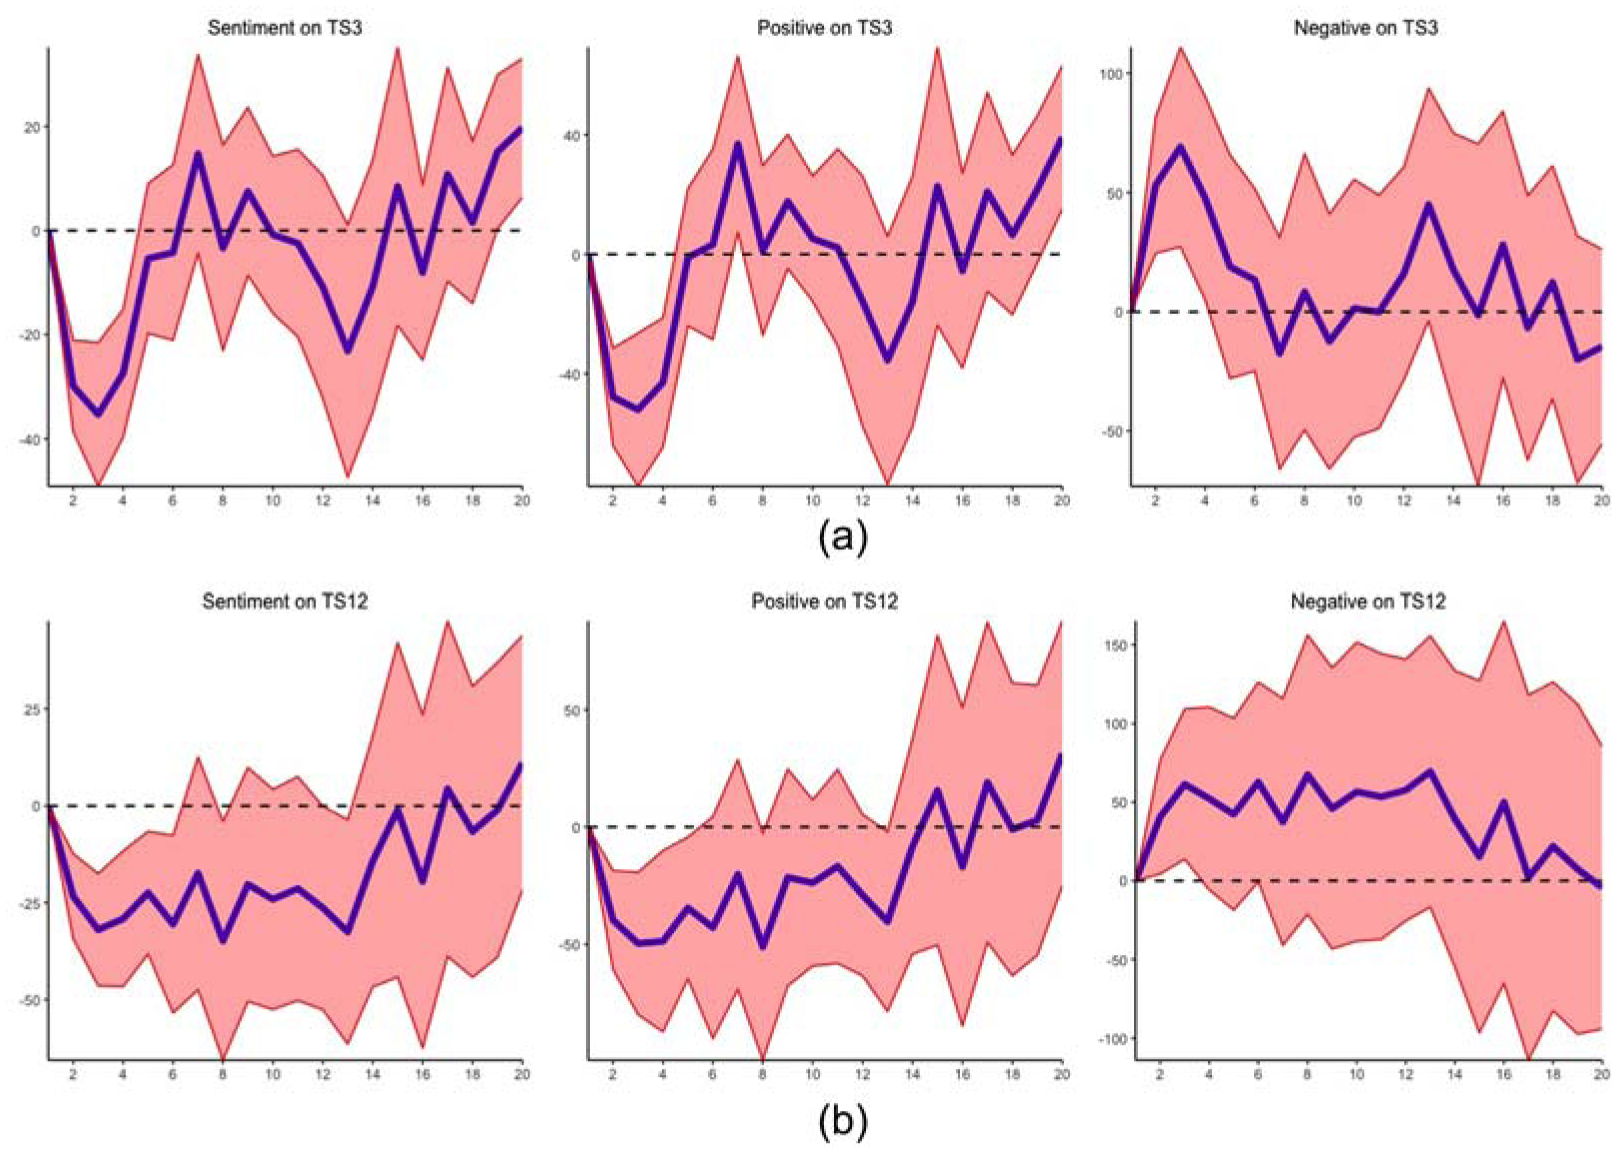
The responses of timing surprise for three- and twelve-months horizons to shocks from sentiment, positive and negative on the survey date: (a) timing surprise – three months horizon and (b) timing surprise – twelve months horizon.
6. Extensions and Robustness Tests
We also estimate several other specifications to test for additional effects and ensure the robustness of our results. As previously outlined, we also use a second specification where we adopt the sentiment between the two survey dates rather than the sentiment on the date of the survey. The results in Table 1 have already illustrated that the results are not affected by this choice. Estimates based on monthly averages of sentiments for the other results presented thus far can be found in the Online Appendix G. We have also conducted estimates where we explore whether higher media attention leads to stronger effects of sentiments by placing a higher weight on sentiment in periods of higher media coverage. The results suggest slightly stronger effects for market-based measures over short horizons, while the main findings remain unchanged. The corresponding results can be found in Tables 3.1 to 3.5 of Appendix 3. However, we pick up on the idea of stronger effects in the case of higher news coverage when discussing nonlinear effects further below.
6.1. Alternative Market-based Expectation Measures and News Sentiment versus Social Media Sentiment
We have also conducted estimates based on Baumeister and Kilian’s (2014) expectation measure. The results can be found in AppendixTables 1.1 and 1.2 and confirm our previous findings. Having investigated sentiment indicators that combine news and social media sources thus far, we have also analyzed both kinds of news sources separately. Specifically, we extract sentiment from only the conventional newspaper or social media and examine which of these sentiment sources render the strongest impact on the survey- and market-based expectations. The results of the sentiment from conventional newspapers are reported in AppendixTables 2.1 to 2.3 and the social media sentiment is displayed in AppendixTables 2.4 to 2.6. The results show that sentiment from conventional newspapers has stronger effects on both survey- and market-based expectations compared to sentiment from social media. However, these results are based on full-sample estimates and future research could focus on estimating sub-samples where the relevance of social media has increased.
6.2. Structural Breaks and Threshold Regressions
We also investigate whether the effect of sentiments is characterized by nonlinearities. On the one hand, we investigate whether the oil market is influenced by a strong sentiment, specifically examining the intensity or degree of positive and negative receptiveness in the oil market. A threshold of 0.25 or higher – which is above the mean of the sentiment indicator – is employed to generate a binary (dummy) of 1 or 0 as the representation below 7 :
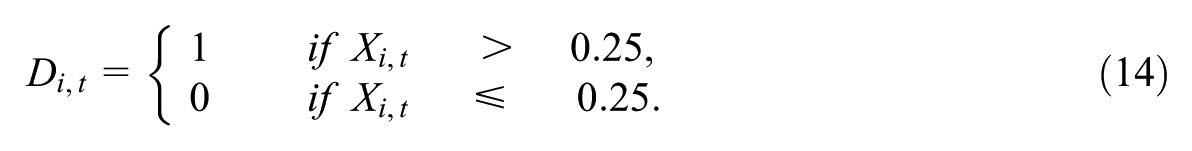
where
We then estimate the impact of sentiment intensity as below:

where
Furthermore, we estimate a threshold regression with ‘mentions’ and ‘buzz’ as transition variables within
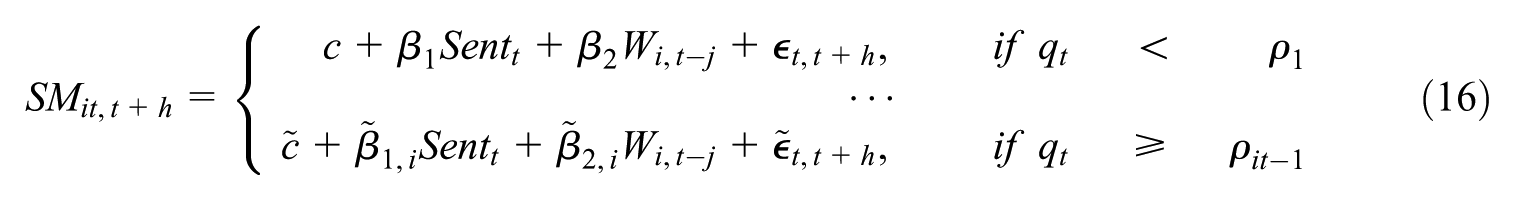
where
The results show that two thresholds are observed for EO3 and one threshold is detected for EO12. These thresholds occur with buzz as a transition variable. There is a threshold observed for the market-based expected change. Two thresholds are identified for buzz, serving as a transition variable for DO3, and three thresholds are discerned for mentions, acting as a transition variable for DO12. Additionally, two thresholds are noted for FEO3 with mentions as a transition variable, while no threshold is detected for FEO12 and EOS. The results reveal that nonlinearity is found with the survey- rather than the market-based measure. 8 In each scenario, the lower regime is associated with minimal media coverage, while the second or third regime is characterized by substantial media attention. Sentiment continues to exert a significantly negative (positive) impact on the expected change in oil, and disagreement among forecasters (forecast error and oil price surprises). We also observe that the impact of sentiment on expectation and uncertainty intensifies with higher media attention, and thus sentiment effects become more significant in the third regime. These results highlight the importance of new intensity when analyzing sentiment. Our previous estimates based on buzz-weighted sentiments have already illustrated the importance of accounting for the new intensity when analyzing sentiment.
We also test for the possibility of structural breaks over time by applying the procedure established by Bai and Perron (1998, 2003) using equation (17).

The results display a small number of structural breaks but confirm the overall effects of sentiments (details are provided in the Online Appendix). Two structural breaks are detected for EO3, EO12, and BEO3 in 2002 and 2008. There is no break observed for BEO12. With the uncertainty measures, only one break is identified for DO3 and FEO3 in 2008 and in 2017 for POS. We do not find any break for DO12, FEO12, and EOS. These breaks occurred after the terrorist attacks in the US and the global financial crisis, which affected oil demand.
7. Discussions
The results thus far have illustrated the relevance of media coverage for expectations from various perspectives. First, we find that both survey- and market-based oil price expectations respond to media coverage. Positive sentiment leads to expected decreases in the price of oil, while negative news is associated with expected increases. This asymmetric impact is consistent with studies that find that oil prices respond differently to positive and negative news (Alfano et al. 2015; Feuerriegel and Neumann 2013; Feuerriegel et al. 2015). We have also illustrated that negative media coverage has stronger effects on expectations. This corresponds to Wang et al. (2021), who find that negative sentiment strongly affects crude oil futures more than positive sentiment. In line with the observation that sentiment does not improve forecasts out of sample, we have also shown that sentiment tends to increase forecast errors.
It is important to recall that the media coverage of higher oil prices can reflect different scenarios and result in positive and negative media coverage. Oil prices increase due to a booming world economy is likely to result in a positive reference about the price of oil, whereas an increase in oil price emanating from geopolitical risk might result in a negative reference. In the latter case, it is intuitive that negative news results in higher oil price expectations. In the former case, the negative impact of positive media sentiment on the expected change in oil price could also demonstrate a mean reversion or reversal expectation. The implication is that positive media sentiment about the oil generates a good ‘animal spirit’ and leads to a spontaneous increase in oil demand. The market participants or forecasters might construe this as a signal that oil prices have already over-increased and will return to a more sustainable level, thus causing lower expected oil prices. Conversely, negative sentiment (bad ‘animal spirit’) induces fear in the oil market, reducing oil demand and signaling a decline in oil prices. Forecasters then expect a recovery resulting in higher future oil prices.
Furthermore, our results show that positive sentiment increases forecast error, surprise, and expectation shocks, while negative sentiment increases disagreement among forecasters. These findings are consistent with studies indicating that increasing media coverage and tonalities provide a medium that increases oil market uncertainty (Campos et al. 2017; Lehrer et al. 2021; Qadan and Nama 2018).
From a more general point of view, our finding that sentiment can also affect forecast errors points to the difficulty in processing information in the oil market. This is also demonstrated in the effect on market surprises. This relates to the literature on information rigidities as well as over-reaction and under-reaction of market participants (Czudaj 2022). On the other hand, the higher disagreement among forecasters suggests the dispersion in beliefs about the expectation of oil prices. The increase in uncertainty, from an economic perspective, causes fluctuations in investment decisions. This suggests the relevance that policymakers and investors should give to media coverage and tonalities as a signal of oil market uncertainty and integrate these media sentiments into forecasting models.
8. Summary and Concluding Remarks
We have analyzed the impact of media-based sentiments on two dimensions of oil price expectation measures and uncertainty using monthly data from 1998 to 2020. More explicitly, we have assessed the effects of different sentiments on survey-based oil price expected change, disagreement and forecast errors, as well as market-based oil price expected change, expectation shocks, and market surprises.
Our results show that the adequacy of oil price expectations can be explained by the response of expectations to information embedded in sentiment. We find that media sentiments have an effect on expectations and survey-based uncertainty measures that extend beyond information embedded in past prices. The results display that sentiment causes a decrease in the expected change in the oil price. The adjustment of expectations to sentiment news tends to be stronger for negative news and conventional news compared to social media. We also find that sentiments can increase uncertainty in terms of disagreement, surprises, and forecast errors. This suggests the existence of information rigidity in the oil market (Czudaj 2022). Also, the results show a slight number of structural breaks, but confirm the overall effects of sentiment.
In general, the study provides several economic implications. First, the sentiments from media coverage as a source of public information capture a significant part of the oil market, providing an important channel through which information is processed and having the ability to influence expectation formations. In addition, the study shows that media news constitutes a potential source of uncertainty surrounding the price of oil and provides relevant information for managing oil risks. This suggests the relevance that policymakers and investors should give to media coverage and tonalities as a signal of oil market uncertainty and integrate these media sentiments into expectation formation and forecasting models.
Our results also point to several important avenues for future research. Combining media- and survey based indicators might be useful to shed more light on oil price uncertainty, for example, in the aftermath of specific shocks. Moreover, conducting surveys among investors could be useful for analyzing over- and under-reaction to a specific kind of news and providing more information on information rigidities in the oil market.
Supplemental Material
sj-pdf-1-enj-10.1177_01956574251368284 – Supplemental material for Media Sentiment and Oil Price Expectations
Supplemental material, sj-pdf-1-enj-10.1177_01956574251368284 for Media Sentiment and Oil Price Expectations by Joscha Beckmann and Joseph Agyapong in The Energy Journal
Footnotes
Appendices
Acknowledgements
The authors gratefully acknowledge the editor and the anonymous referees for their valuable comments and suggestions. We also thank the participants of the workshop on expectations and sentiments for energy price dynamics at FernUniversität Hagen, Berlin Campus, 2023; the modeling and forecasting financial and commodity markets workshop in Warsaw, 2024, jointly organized by SGH Warsaw School of Economics and FernUniversität Hagen; and the 8th International Workshop on Financial Markets and Nonlinear Dynamics (FMND) in Paris (France), 2024, for their helpful feedback and constructive discussions.
Funding
The authors received no financial support for the research, authorship, and/or publication of this article.
Declaration of Conflicting Interests
The authors declared no potential conflicts of interest with respect to the research, authorship, and/or publication of this article.
Supplemental Material
Supplemental material for this article is available online.
1
In terms of volatility in the natural gas futures market, Borovkova and Mahakena (2015) find that news sentiments are more strongly sensitive to negative rather than positive jumps. This corresponds with the asymmetric response to a news release by ![]() , where negative news sentiment has a stronger effect on the gold futures volatility than positive news sentiment.
, where negative news sentiment has a stronger effect on the gold futures volatility than positive news sentiment.
2
COVID-19 news on the energy markets is noted to cause a tremendous over-reaction and volatility in the WTI crude oil market (Shaikh 2022). Narayan (2020) finds that positive and negative oil price news, together with COVID-19 cases, affect oil prices, with negative news having a stronger impact. Huang and Zheng (2020) reveal that the elasticity of the sentiment impact on crude oil futures price increased in the post-outbreak period of COVID-19. Weng et al. (2021) propose a genetic algorithm regularization online extreme learning machine modeling framework in assessing the impact of news sentiment during the COVID-19 pandemic on crude oil futures volatility. Their results prove that news sentiment contains more predictive information for the short-term volatility of crude oil futures, which renders the oil market inefficient (Mensi et al. 2020). A recent study by ![]() demonstrates the dynamic impacts of online investor sentiment on WTI prices before and after the COVID-19 pandemic.
demonstrates the dynamic impacts of online investor sentiment on WTI prices before and after the COVID-19 pandemic.
4
It is worth noting that in practice, the sentiment or opinion of the stakeholders about the oil market would not be homogeneous over time. Hence, we investigate the relative forecasting accuracy based on periodic heterogeneity, which envisages the strength of the forecasting power of the sentiment. Our motivation is geared toward assessing the forecasting accuracy of the sentiment, which generates relevant information for oil forecasters and policymakers in real time. The results show that sentiments only accurately forecast the oil prices between 2003 and 2008, while the forecast performance of the sentiment proves to be very weak afterwards (see ![]() ).
).
5
6
Shock from both sentiment and positive shows an inverse of the negative shock.
7
The results remain unchanged even if we increase the threshold.
References
Supplementary Material
Please find the following supplemental material available below.
For Open Access articles published under a Creative Commons License, all supplemental material carries the same license as the article it is associated with.
For non-Open Access articles published, all supplemental material carries a non-exclusive license, and permission requests for re-use of supplemental material or any part of supplemental material shall be sent directly to the copyright owner as specified in the copyright notice associated with the article.