
Abstract
This paper provides the first causal evidence of how energy efficiency policies shape housing markets in developing economies, exploiting the staggered rollout of South Africa’s National Energy Efficiency Strategy (NEES). Using a quasi-experimental design and nationally representative household stated preferences, we show that low-income households adopting NEES-compliant appliances experienced a 3.3 percentage points increase in house prices and an 8 percentage point rise in rents. Dynamic event studies reveal persistent effects, with prices rising by 12 percentage points and rents by 21 percentage points seven years post-intervention. Mechanism analyses indicate these gains are driven by direct capitalisation of energy-efficient upgrades, remittance-financed appliance purchases, reduced air pollution, and linked income channels. Effects are concentrated in urban areas and among Black and Coloured homeowners, underscoring heterogeneous socioeconomic impacts. The results highlight energy efficiency’s role as a “first fuel” for sustainable development, demonstrating its potential to simultaneously mitigate climate externalities and stimulate housing market dynamism. Policy implications emphasise targeting rebate programmes to low-income households, integrating efficiency incentives with broader social policies, and monitoring rebound effects to maximise net emissions reductions. By bridging the gap between environmental economics and housing market research, this study offers actionable insights for designing equitable climate policies in resource-constrained settings.
Keywords
1. Introduction
Transitioning from polluting energy systems to cleaner, energy-efficient alternatives through conservation policies presents significant opportunities for sustainable development (Allcott and Greenstone 2012; Bouckaert et al. 2021; Fowlie et al. 2018). Among the key benefits are mitigating climate change, reducing negative health externalities from energy inefficiency, and improving living conditions. Albeit it is theoretically expected that climate-related energy-efficient alternatives would bolster efforts to address severe climate conditions, empirical evidence supporting this claim remains limited (Acemoglu et al. 2012; Alestra et al. 2024; Su and Moaniba 2017).
In 2004, the residential sector accounted for 17.9% of South Africa’s final energy demand, with much of the consumption reliant on biomass. This highlighted opportunities for energy savings and pollution mitigation with global relevance. In response, the national government introduced the National Energy Efficiency Strategy (NEES), setting a goal of a 10 percent improvement in energy efficiency for the residential sector by 2015 (Buyelwa 2008). The authority to undertake the strategy comes from the South African Constitution, the National Energy Act 2008 and the South Africa’s White Paper on Energy Policy 1998. As a result, energy efficiency improvements between 2000 and 2012 led to a 28 percent reduction in household energy consumption, far exceeding the NEES target (Department of Energy 2015). 1
Building on this success, the South African government launched the post-2015 NEES initiative (Buyelwa 2015). This effort seeks to consolidate previous gains and drive further energy efficiency improvements through fiscal incentives, a strengthened legal and regulatory framework, and supportive measures. 2 The strategy sets two targets to be achieved by 2030 relative to 2015 baseline: (i) a 33 percent reduction in the energy consumption of new household appliances; (ii) a 20 percent improvement in the energy performance of new buildings. A glance at panel A of Figure 1 shows that there is a steady increase in the proportion of NEES-compliant low-income households since 2011, suggesting that South Africa may be on track to achieving their 2030 energy efficiency target for the residential sector.
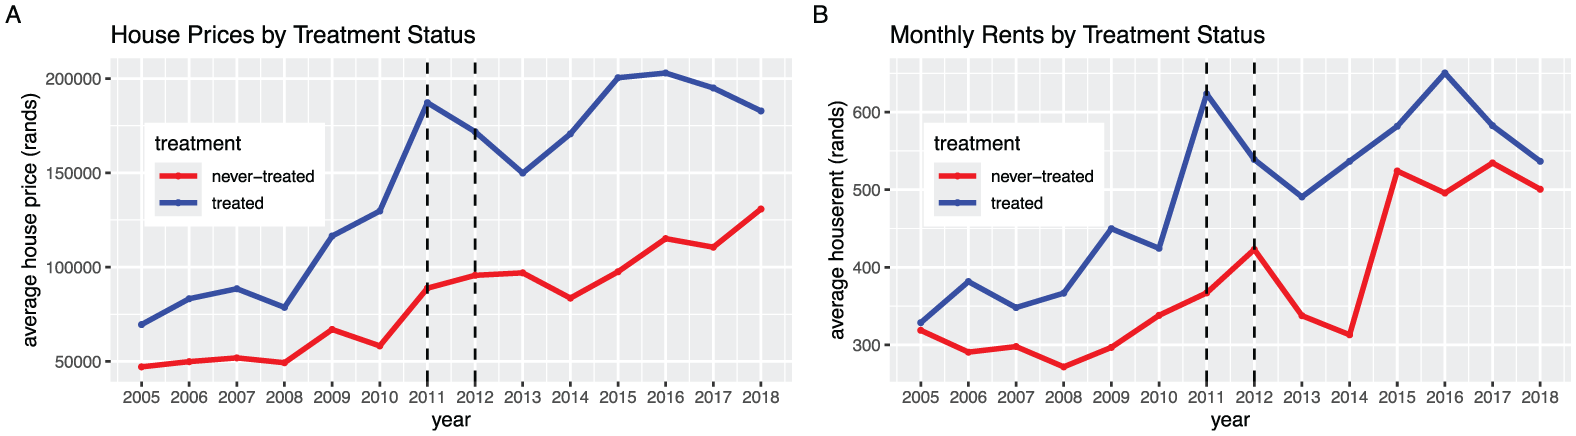
Prices and monthly rents trends of houses/flats by treatment status.
NEES established a mandatory standard on the energy performance of new residential housings in South Africa (Department of Energy 2011). This raises the question, whether the energy efficiency programme is capitalised into South Africa’s housing market? Thus, this paper asks the following question: does the adoption of the NEES programme lead to higher prices and rents? We address this question using a quasi-experimental design, and further investigate the transmission mechanisms. The closest literatures on house prices and rents are in developed countries of Europe and North America (Aydin et al. 2020; Dastrup et al. 2012; Dröes and Koster 2016; Ferentinos et al. 2023; Gaur and Lang 2023; Qiu et al. 2017). Albeit these papers used quasi-experimental designs, their results are inconclusive due to different identification strategies. There are also existing non-causal literatures on house prices focusing on Australia, European, and North American countries, whose results are also inconclusive (Dröes and Koster 2021; Evangelista et al. 2022; Taruttis and Weber 2022; Williams et al. 2023; Zhang et al. 2023). Moreover, whereas previous causal evidence inconclusively focused on the capitalisation of energy efficiency on house prices and rents in developed countries, this study provides the first causal evidence for a developing country.
Consistent with the literatures using energy efficiency adoption identification strategy (Aydin et al. 2020; Eichholtz et al. 2010; Lan et al. 2020; Qiu et al. 2017), we find significant increases in house prices and rents in South Africa, caused by the NEES programme. These higher house prices and rents are dominated in urban areas of low-densely populated provinces. Furthermore, we argue that the adoption of the NEES programme serve as the primary mechanism for the capitalisation of energy efficiency into house prices and rents. Additionally, other channels include remittances, wages income source, and improved air pollution as treated low-income households finance the purchase of energy efficient appliances through either remittances and wages income sources for reduced air pollution.
Confidence in the estimated causal impacts is reinforced by several robustness checks, including potential threats to treatment selection, falsification exercises, and the use of different model specifications. A comparison of house price and rent trends between treated and never-treated households prior to the intervention confirmed the absence of linear pre-trends in the outcomes, indicating that housing market trends for both groups evolved in parallel before treatment.
This study exploits the exogenous variation provided by the NEES programme in South Africa to argue the above contributions. This identification strategy involves the use of only the share of NEES-eligible low-income households. Similar identification strategy has been used by Davis et al. (2014) in Mexico. The two-way fixed effect (TWFE) estimates and event study designs are employed to determine the effect of the energy efficiency on the house prices and rents before and after the roll-out of NEES interventions to low-income households between 2011 and 2012.
This rest of this article is organised as follows. Section 2 discusses related literature. Section 3 discusses the important details about the NEES programme and the identification strategy. Section 4 describes the data used, the data cleaning process and samples, housing market trends, balance test, and important descriptive statistics. Section 5 presents and discusses the empirical methods and results. Section 6 conducts series of robustness checks on the established results. Section 7 discusses heterogeneous characterisations of the effects, while section 8 discusses additional potential transmission mechanisms. And Section 9 concludes.
2. Related Literature Review
This section reviews two related strands of literature on energy savings and usage, and house prices and rents.
2.1. Energy Savings and Usage
Fowlie et al. (2018) evaluated the Michigan State Weatherization Programme by encouraging a random sample of participants, using this as an instrumental variable to compare those who received encouragement with those who did not. Their study found that the investment cost in residential energy efficiency was more than double the actual energy savings, and that model-projected savings were over three times the realised savings, attributed to the rebound effect—where energy demand increases due to efficiency improvements. Additionally, they reported no significant rise in room temperatures in weatherised homes, even after considering the societal benefits of reduced emissions, concluding that the costs of energy efficiency outweigh the benefits, with average annual returns of −7.8%. Similarly, Davis et al. (2014) examined Mexico’s appliance replacement programme, where the government assisted households in replacing old refrigerators and air conditioners with energy-efficient models between 2009 and 2012. Whereas efficient refrigerators reduced electricity consumption by 8 percent, energy-efficient air conditioners increased it. They concluded that the programme was an expensive way to reduce
Jacobsen and Kotchen (2013) assessed the impact of changes in Florida’s building energy code by analysing residential electricity and natural gas consumption. Using the variation in households built just before and after the code change, they found that the new code led to a 4 percent reduction in electricity consumption and a 6 percent reduction in natural gas use. Extending this analysis, Kotchen (2017) found sustained savings for natural gas but diminishing savings for electricity over time. Finally, Metcalf and Hassett (1999) explored the “energy paradox”—why consumers are reluctant to invest in energy-saving technologies?—by analysing the returns on such investments using residential energy survey data. He found that the realised returns from these investments were often lower than promised by engineers, although attic insulation provided significant returns, with median estimates equal to the discount rate. He concluded that the case for energy-saving investments is weaker than previously thought.
2.2. House Prices and Rents
Some pioneering studies that generally looked at the determinants of house prices include Richardson et al. (1974), Peng and Wheaton (1994), and Capozza et al. (2002). These studies used OLS and spatial models with hedonic controls to conclude on the capitalisation of a number of factors into house prices, especially in Asia, United Kingdom, and the United States. They found that land scarcity raises house prices which are capitalised into rents. Furthermore, they recorded no evidence of any location-based theory on house prices, rather, housing characteristics, spatial variables, accessibility, and environmental quality conditions. Similarly, household income and cost of construction, have significant positive impact on house prices. In Singapore, Fan et al. (2006) examined the relationship between house prices and housing characteristics. The results showed that number of rooms, size of the floor area, age of house, recreational facilities, and the living environment increases house prices. Using AirBnB and New York Open Data, Bernardi and Guidolin (2023) studied the price determinants of AirBnB rentals in New York. They found that property and service characteristics have significant influence on rental prices. Eriksen and Ross (2015) estimate the supply of increasing housing vouchers on rents in the US. They found no significant effect of voucher increases on overall rents, but a significant effect were found for individual housing unit before the voucher expansion. Further, voucher recipients tend to rent higher expensive houses. Using census data, Gilderbloom and Appelbaum (1987) examined the determinants of rents in the US urban areas. Their results showed that social forces such as the professionalisation of the rental housing industry (organisation by landlords) is a more important determinant of rents than supply and demand factors.
Indeed, studies that used causal inference methods to determine house prices documented heterogeneous effects. Some notable methods used include the two-way fixed effect (TWFE), difference-in-differences (DID), and instrumental variable regressions. Adelino et al. (2012) used DID and exogenous changes in conforming loan limit to instrument lower cost financing, and then examined whether credit access raises house prices in the US. They found that easier credit access has a significant positive impact on house prices by an average of $220 per square foot. Dastrup et al. (2012) used repeat sales identification and TWFE to document a significant solar premium on house prices in California, US. Similarly, Figlio and Lucas (2004) used repeat sales identification to determine whether the school grading system in Florida, US, affected rental residential location and house prices. They found that the school grading system established by President Bush is capitalised into house prices, with associated premium declining over the years. Grade A-rated schools have more house price capitalisation than B- and C-rated schools, respectively.
In Netherlands, Aydin et al. (2020) examined the impact of energy performance certificate on house values using energy prices and repeat sales identification strategies. They used energy prices as an identifying instrument exploiting the discontinuity in the evolution of energy prices over time. Their results showed that energy efficiency levels of households are capitalised into house prices. In Australia, Lan et al. (2020) used matching methods to document significant premiums due to solar photovoltaic (PV) installation on residential properties. Qiu et al. (2017) also used matching methods to show a positive house price premium for houses with solar PV installations in Arizona, US, but no statistically significant effect on houses with solar heaters alone. Moreover, Kaplan et al. (2020) built a US-based model with multiple aggregate shocks namely, income, housing finance conditions, and beliefs about future housing demand, and performed series of counterfactual experiments investigating housing boom around the global financial crisis period. Findings showed that the main drivers of changes in house prices are shifts in beliefs of future housing expectations.
However, Gaur and Lang (2023) using repeat sales variation sought to identify the externality of large-scale utility solar PV installations (≥1 MW) on nearby house prices in Massachusetts and Rhode Island, USA, using DID method. They found that houses within 0.6 miles depreciate by 1.5% to 3.6% following the construction of the solar array. Similarly, Dröes and Koster (2016) used year of wind turbine’s construction and repeat sales exogenous variations, to investigate the impact of wind turbines on house prices in Netherlands. Their results showed that the construction of wind turbines reduces house prices within 2 km of the site. The plethora of robustness checks reveals that this effect ranges between −0.7% to −3.1%. Additionally, ten years after treatment, this negative effect is persistent and statistically significant at −2.2%. Moreover, one of the recent literatures on this subject Ferentinos et al. (2023) used random-forest and DID methods to study the effect of climate policies. The study used the minimum energy efficiency policy established in 2018 as an identification strategy to find that green house gas emissions causes a decline in house prices in England and Wales. They found that policies such as the minimum energy efficiency strategy established in 2018 reduced property values for energy inefficient houses affected by the policy.
Furthermore, some non-causal arguments on the capitalisation of energy efficiency into residential house prices are heterogeneous and mostly focused on Australia, Wales, Portugal, Netherlands, Italy, and Belgium (Brounen and Kok 2011; Chegut et al. 2016; Copiello and Donati 2021; Fuerst and Warren-Myers 2018; Fuerst et al. 2018; Reusens et al. 2023). They used sales and tenancy data within a hedonic framework to examine the impact of energy efficiency ratings and performance certificates on house prices. They found that both energy efficiency rating and other sustainability related characteristics increase house prices and rents. The characteristics include heating, cooling and solar power generators. The premiums from energy ratings are more pronounced for houses in bands A and B, than houses in band C. Whereas houses with energy performance certificates in D and later recorded significant discounts. Zhang et al. (2023) studied the impact of energy efficiency of buildings on house prices in China using data envelopment analysis and mediation analysis. The results showed that China’s energy efficient buildings are rising resulting in a 0.58% increase in house prices.
Similarly, Breitenfellner et al. (2015) studied how energy price inflation is a panacea for downward corrections in house prices using data on eighteen OECD countries. They identified such periods of downward house price adjustments. Their results showed that energy price inflation raises the likelihood in the occurrence of such periods in OECD countries. More studies have further argued on the capitalisation of energy efficiency labels into house prices in US cities (Research triangle region of North Carolina, Austin Texas, and Portland-Oregon) and Sweden (Cerin et al. 2014; Walls et al. 2017). These results are especially true for newer houses rather than old ones in the US, and those built before 1960 in Sweden. Furthermore, Eichholtz et al. (2010) studied the importance of certification of green building (investment in energy efficiency) on rents, effective rents and sales price of commercial buildings. Their results showed that green buildings raises rent by about 3 percent, effective rent about 7 percent and commercial property values by 16 percent in the US. Taruttis and Weber (2022) studied energy efficiency effect on property values in Germany, and checked for regional disparities. They found that energy efficiency is capitalised into house prices in Germany and evidence of regional disparities, with the effect more pronounced in rural Germany compared to larger cities and other urban areas.
In contrast, Williams et al. (2023) using a grid-response and life-cycle approaches examined the impact of electrification of building on housing affordability and environmental sustainability. They found that compared to traditional building energy model, calibrated electrified building model raises energy efficiency which raises housing affordability in the US. Using quantile regressions, Evangelista et al. (2022) found heterogeneity in the elasticity of house prices to energy efficiency over the spectrum of the distribution, and between house types, that is, houses and flats. Whereas the effect on houses is positive and significant, the effect on flats is negative and significant. The effect is significant and negative for residential buildings whose prices are at the lower end of the spectrum. Dröes and Koster (2021) investigated the effect of wind turbines and solar farms on house prices in Netherlands. The study found a heterogeneous effect on house prices in terms of the height of the wind turbines. Whereas house prices within 2 km declines due to tall wind turbines
3. NEES and Identification Strategy
The implementation of the NEES programme commenced in 2005 (Buyelwa 2005) to champion efficiency improvements in energy demand, especially amongst the middle- and high-income households, who are regarded as the heavy consumers from the outset; and later, low-income households as they get connected to the grid. The NEES programme is the largest energy efficiency programme in South Africa and has the mandate to increase energy efficiency in all economic sectors (Buyelwa 2005, 2008). The authority to undertake the strategy comes from the South African Constitution, the National Energy Act 2008 and the South Africa’s White Paper on Energy Policy 1998.
3
It has an estimated budget of over
To achieve these objectives, NEES uses enabling instruments and interventions. Generally, they include inter-alia, economic and legislative means, efficiency labels and energy performance standards, energy management activities and energy audits, as well as the promotion of efficient practices. Given the successes of NEES implementations, the
NEES implements both low-cost and no-cost interventions, as well as higher-cost measures with short payback periods for grid-electrified households only. The implementation of NEES interventions first prioritised high-income households between 2005 and 2008 as they were considered heavy energy users. After the first official review of the strategy in 2008, priority extended to middle-income households from 2009 onwards. 4 By the end of the second official review in 2011, priority further extended to the low-income households, including those low-income households newly connected to the grid. Post-2015 NEES consolidates on the achievements and implementation strategies. It is still currently running and geared towards achieving its 2030 target. The NEES interventions were implemented in two phases for each income group in different years between 2005 and 2021.
Phase one involved an energy audit programme using qualified energy auditors to identify areas of potential energy savings in households, mandatory labelling of households and market appliances using established standards, raising awareness to communicate the cost-benefits of energy efficiency in the home and mandatory standards for newly constructed state-subsidised housing commencing in 2006. Phase one prioritised grid-connected high-income households with ownership of any of the NEES recommended appliances.
In phase two, the South African DoE through Municipalities and Service Authorities financed the rolling out of energy efficiency retrofit programmes (commencing in 2008) to grid-electrified households that own any of the NEES recommended appliances in all the nine Provinces in South Africa, prioritising the middle-income households. In 2011, priority shifted to low-income households. These programmes include Appliance Rebate Programme and Energy Efficiency Demand Response Programme. In the appliance rebate programme, subsidy was offered by the DoE to encourage households to purchase any energy-efficient NEES recommended appliances. The interventions were rolled out on a monthly and annual basis from 2008 and ran until 2015 for middle-income households, and from 2011 onwards for the low-income households. It offered rebates of up to
To be eligible for a rebate between 2011 and 2012, the following conditions must be satisfied: (i) grid-connected low-income household, (ii) must use grid electricity for their domestic energy consumption, (iii) must purchase any of the NEES recommended appliances, from a participating retailer, that meet the minimum energy performance standards set by the DoE. Additionally, the Energy Efficiency Demand Response Programme was a demand-side management programme implemented by the DoE aimed at reducing peak demand of electricity by encouraging grid-connected households to reduce their energy consumption during peak times. The programme offered financial incentives to grid connected low-income households that reduced their energy consumption during peak times. The incentives were based on the amount of energy saved and the time of day when the energy was saved.
Given the foregoing, we identify the eligible households (hereafter, treated group) to be the low-income households who either own any of the NEES recommended appliances, or deliberately reduced their energy consumption during peak demand, because they are connected to the grid and use it for domestic purposes, such as lighting, cooking, and heating (water and space).
The ineligible households (hereafter, never-treated group) comprise of the following households: (i) Those households without grid connection and grid usage but either own energy inefficient appliances, reduced their energy consumption, or exhibit energy efficiency behaviours. These households use alternative energy sources such as mechanical electricity generator, and/or crude energy sources such as animal dung, paraffin, and gas. (ii) Those households who neither have grid connection nor use grid-electricity, and neither own any of the NEES recommended appliances, nor reduced their energy consumption during peak demand. In sum, the never-treated group are households without grid connection and grid usage, whether or not they own any of the NEES recommended appliances, or reduced their energy consumption during peak demand. This group is further grouped into low-, middle-, and high-income households.
The roll-out of the NEES programme for low-income households starting in 2011 provides grounds to make a reasonable assumption about when at least one eligible low-income household was treated. Because of its staggered implementation, there exists at least a recently grid-connected low-income household that would comply with NEES conditions and become treated between 2011 and 2012. Hence, the treatment dates are set to be from 2011 to 2012 to capture all newly NEES treated low-income households. 5
4. The Data
The data used is the annual generalised household survey (GHS) provided by the “Statistics South Africa,” the most comprehensive household survey in South Africa (Statistics South Africa 2021). The GHS data was designed to measure the living standards of South Africans. The cross-sectional coverage of the survey are all de jure households and residents in workers’ hostels in all the nine provinces. 6
The survey used probability proportional to size to draw a multi-stage stratified sample of households guided by their census master plans. The first stage is stratification by province, then by type of area within each province. Primary sampling units are then selected proportionally within each stratum (urban or non-urban) in all provinces. The information in this dataset are self-reported responses to the survey questions. The annual cross-sections of this GHS datasets were stacked into a repeated cross-sections. Following the various South African censuses in 1996, 2001, and 2011, household and individual weighting were applied over these periods for comparability across samples, accounting for compositional changes. The stacked sample has a total sample of 2,518,460 observations over 2005 to 2018. 7
4.1. Data Cleaning Process and the Samples
The
This sample thus contains only the treated and never-treated households as defined in Section 3 with 114,197 unique households, 12,049 unique villages and all nine provinces in South Africa. This forms a representative sample of households-by-villages-by-provinces-by-year pair observations. Using the definitions of households income groups in the 2011 South African census, we group the sample into low-, middle-, and high-income households (Statistics South Africa 2015). 8 This grouping allows for the comparison of the treated low-income households to the never-treated households without domestic grid usage whether or not they either own any NEES appliances, deliberately reduced their energy consumption or exhibit energy efficiency behaviours.
To study the NEES effect on the outcomes, we subset the data to the following groups, comparing the treated low-income households to the following never-treated groups: low-income; middle-income; low- and middle-income; low- and high-income; middle- and high-income; and finally low-, middle-, and high-income households. Thus, the sample sizes for all the comparison groups include:
Finally, within this comparison groups, we further narrow in and compare the treated low-income households to the two subgroups of the never-treated households. That is, the never-treated households who either own NEES recommended appliances, reduced their energy consumption or exhibit energy efficiency behaviours, and the never-treated households who do not.
4.2. Housing Market Trends in South Africa
Figure 1 plots the trends of house prices and rents for low-income households in panels
However, both the global and national economic recessions in 2008/2009 crippled the effectiveness of FLISP as households were unable to amortise due to the prevailing high interest rate. Panels
4.3. Descriptive Statistics
The descriptive statistics and the covariate balance test between the treated and the never-treated households are reported in Tables B1 and B2 of Appendix B. Table B2 shows that the pre-treatment covariates are largely balanced in both the treated and the never-treated groups before and after the treatment.
Table B1 reports that there are more Blacks than Whites in the sample, with an average age of 30 years. There are also more females and married low-income individuals living in more urbanised non-metro areas. In terms of the hedonic characteristics, most of the residential locations are farther away from schools, toilet facilities and local water sources. This is due to higher number of respondents living in more modern houses and have water piped into their dwellings. The average number of rooms in these houses is five rooms, many do not have land access, and few report that water pollution is an environmental problem.
Interestingly, domestic grid usage by these low-income households is only 77 percent, with only 21 percent of grid connected households owning NEES recommended appliances. The average monthly rents is
In what follows, we present the empirical strategies and discuss the results on the causal impacts of the NEES programme on house prices and monthly rents.
5. Empirical Methods and Result Discussions
5.1. Empirical Methods
We apply the TWFE method to a staggered quasi-experimental design due to the roll-out nature of the NEES programme. We use both the TWFE estimates and event studies to determine the effect of NEES on housing market outcomes. Previous studies have followed this process (Cengiz et al. 2019; Dröes and Koster 2016; Jacobsen and Kotchen 2013). This study adopts Cengiz et al. (2019) and Borusyak et al. (2021) procedures to specify the following model.
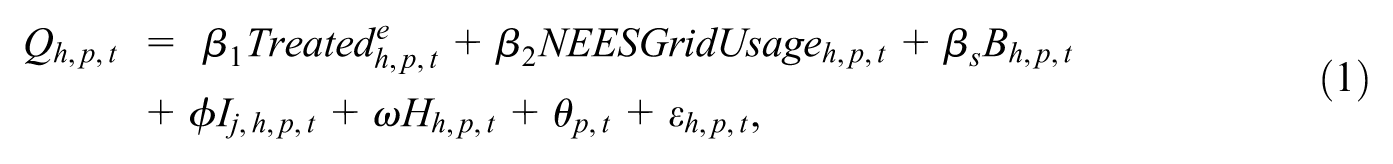
where
We further control for year-by-provinces fixed effects,
We cluster standard errors at provinces to account for the possibility that the changes in the outcomes given the rollout nature of the NEES implementation may be correlated within a province. 9 To increase confidence in the precision of the standard errors as well as the estimates, we apply a one-way cluster robust and bias-correction bootstrapping to equation (1), reporting results after 1000 replications (Cameron et al. 2008, 2011). We report consistent bootstrapped-t standard errors, 95% confidence intervals and associated t-statistic, for all our main specifications.
As the treatment variable,
The difference-in-differences identification of the causal impact of NEES on the housing market is predicated on a weaker parallel trends assumption. That is, without the interventions, the outcomes between the treated and never-treated households, before and after the treatment, would have evolved in parallel conditional on the foregoing set of pre-treatment covariates. Hence, we report sensitivity tests for potential violation of parallel trends by Rambachan and Roth (2023).
5.2. Programme Adoption and Domestic Grid Usage
In this subsection, we show the effect of NEES programme on energy efficiency adoption for treated low-income households as well as their usage of grid electricity for domestic purposes. The results in columns 1 to 2 of Table 1 show a significant increase in energy efficiency adoption for low-income households by 44 percentage points (ppts), declining to 16 ppts after controlling for common time-varying provincial fixed-effects. The precision of this effect further increased after 1,000 bootstrap replicates. Overall, the NEES programme increased adoption of energy efficient appliances in South Africa from 22% to 38%. The energy efficient appliances are in terms of refrigerators/fridges, freezers, electric stove, and air conditioners. The results in Table A1 of Appendix A, show that programme adoption is highest for fridges, and electric stoves, followed by air conditioners, and then, freezers. The plots of ownership of these appliances across all nine provinces in South Africa, before and after NEES commencement date for low-income households, in Figures A1 and A2 of the same Appendix A, further corroborates the above argument. They show that energy efficient appliance ownerships jumped from
Effect of NEES on Programme Adoption and Grid Usage.
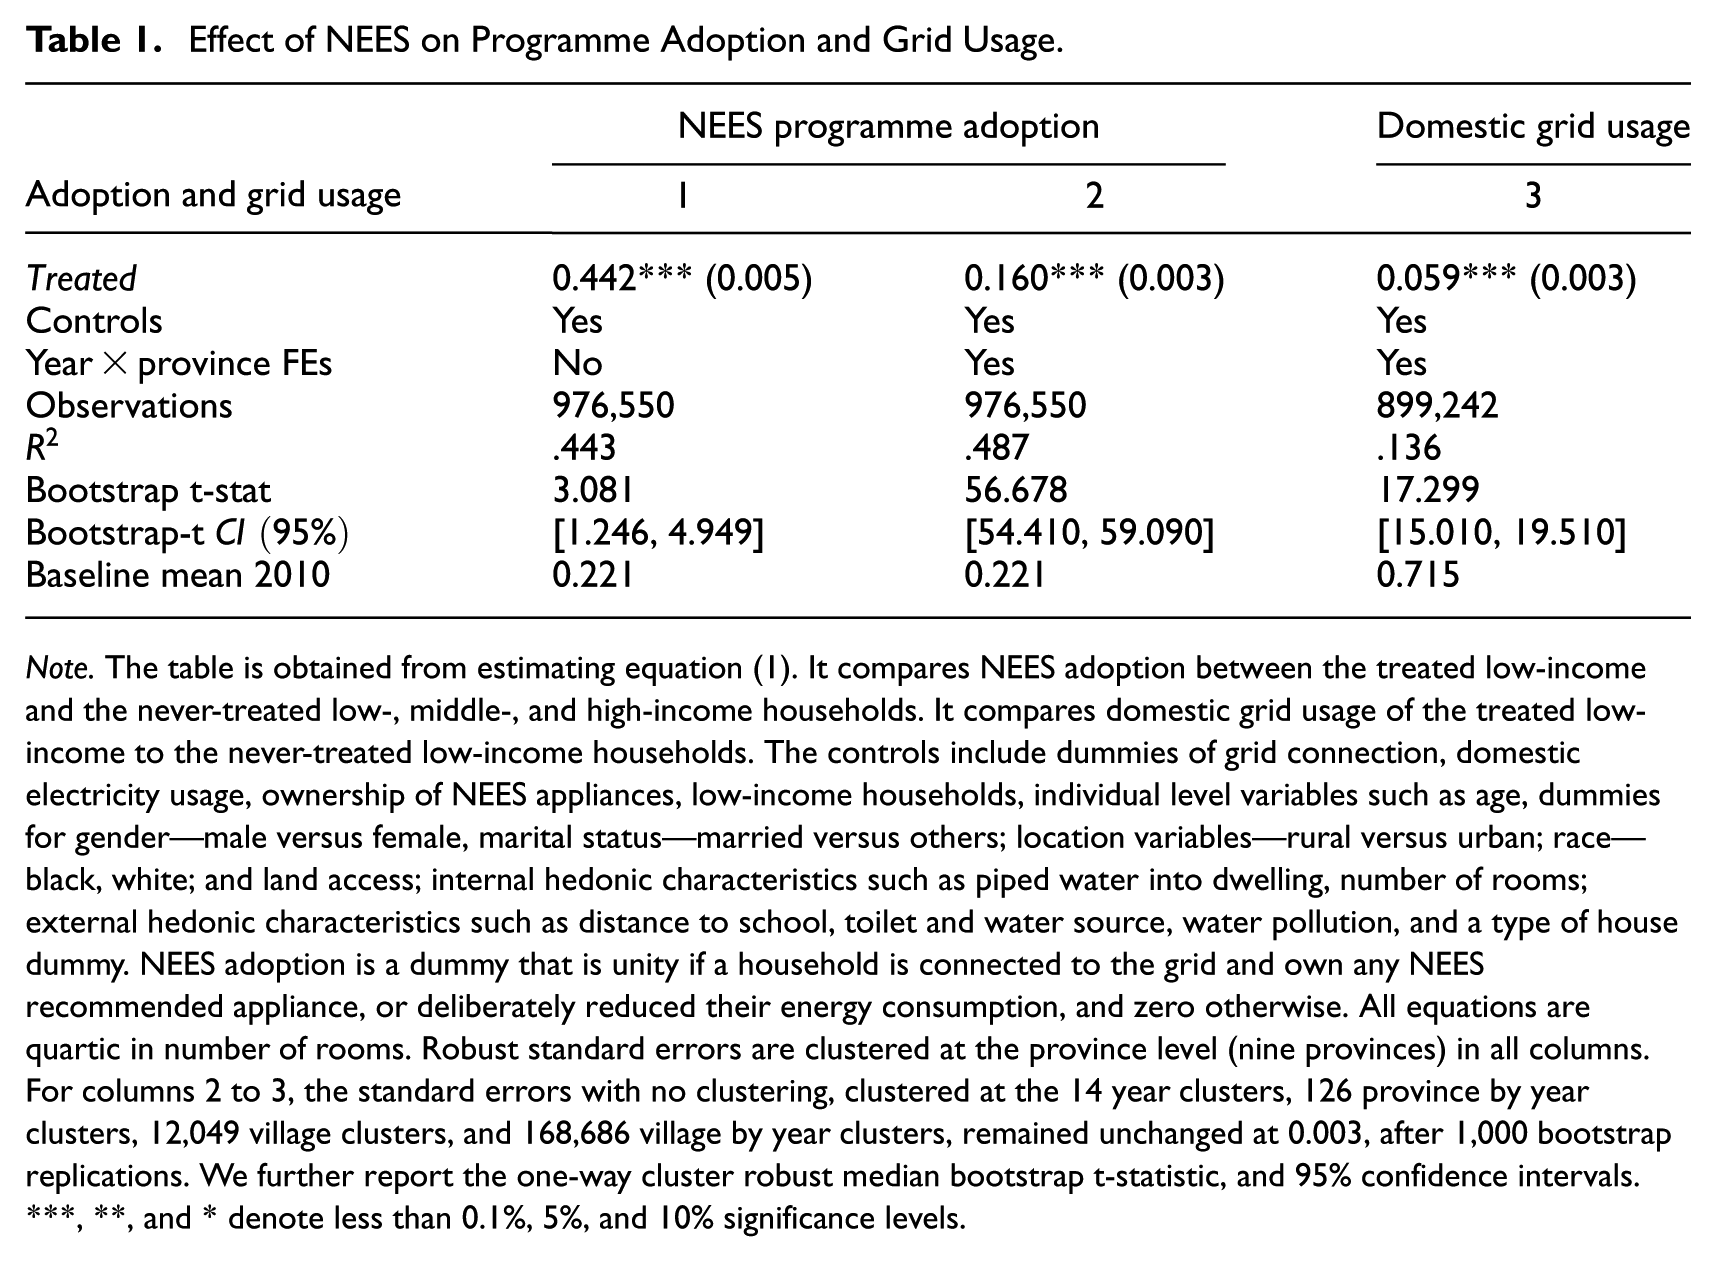
Note. The table is obtained from estimating equation (1). It compares NEES adoption between the treated low-income and the never-treated low-, middle-, and high-income households. It compares domestic grid usage of the treated low-income to the never-treated low-income households. The controls include dummies of grid connection, domestic electricity usage, ownership of NEES appliances, low-income households, individual level variables such as age, dummies for gender—male versus female, marital status—married versus others; location variables—rural versus urban; race—black, white; and land access; internal hedonic characteristics such as piped water into dwelling, number of rooms; external hedonic characteristics such as distance to school, toilet and water source, water pollution, and a type of house dummy. NEES adoption is a dummy that is unity if a household is connected to the grid and own any NEES recommended appliance, or deliberately reduced their energy consumption, and zero otherwise. All equations are quartic in number of rooms. Robust standard errors are clustered at the province level (nine provinces) in all columns. For columns 2 to 3, the standard errors with no clustering, clustered at the 14 year clusters, 126 province by year clusters, 12,049 village clusters, and 168,686 village by year clusters, remained unchanged at 0.003, after 1,000 bootstrap replications. We further report the one-way cluster robust median bootstrap t-statistic, and 95% confidence intervals.
, **, and * denote less than 0.1%, 5%, and 10% significance levels.
Similarly, in column 4 of Table 1, there is a significant increase in domestic grid usage for low-income households by 6 ppts, recovered after controlling for common time-varying provincial factors affecting NEES programme implementations. The precision of this effect also rose after
Furthermore, the dynamic treatment effects in Figure 2 shows that the NEES programme adoption is immediate, jumping to 10 ppts and plateaued around 11 ppts until 2014. In 2015, there was another significant jump to 20 ppts, plateauing again around 22 ppts until 2018, seven years after initial NEES implementation. This later periods marked the effects of continued programme implementation for newly eligible low-income households. Similarly, the dynamic effect on domestic grid usage is instantaneous at 10% significance level, rising to 7 ppts in 2014. In 2015, it jumped to 12 ppts, and gradually settled at 9 ppts in 2018, seven years later. There are no evidences of significant pre-trends. Figure A4 of Appendix A shows that the significant post-treatment results are robust to allowing for the violation of the parallel trends assumption, up to half as large, as the pre-treatment violation.
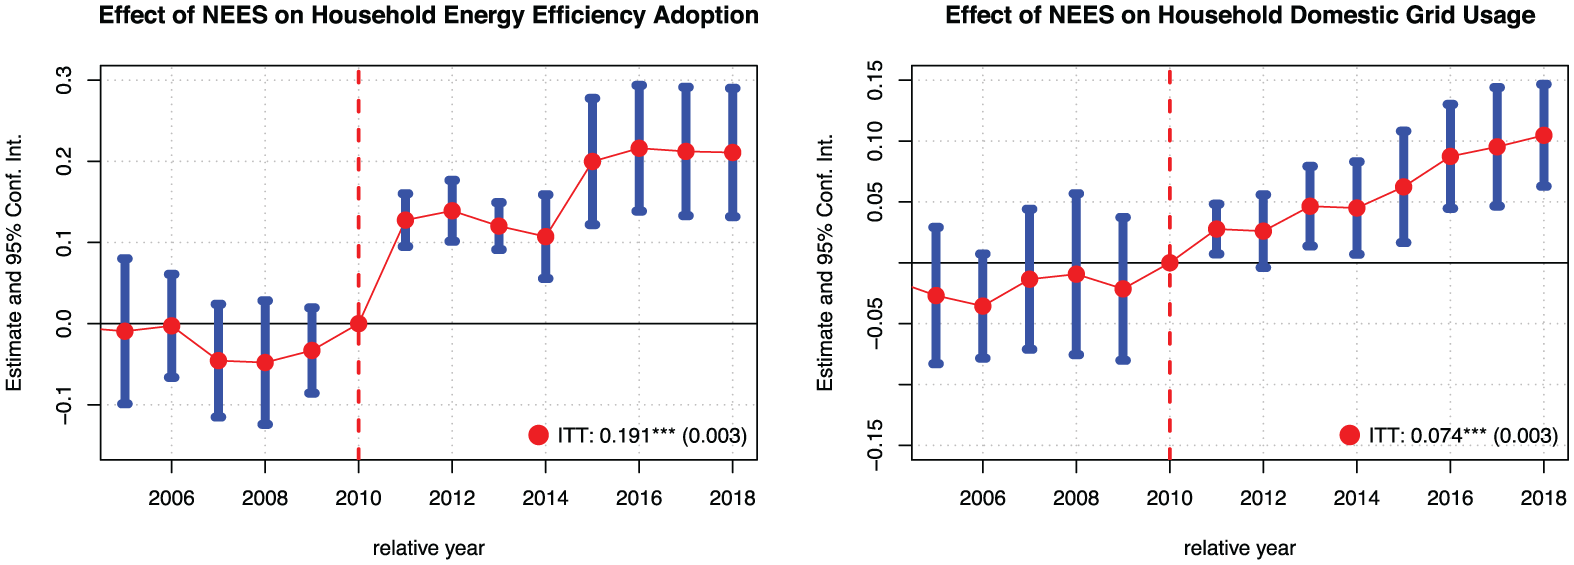
Dynamic effects of NEES on energy efficiency adoption and domestic grid usage.
5.3. Effects on House Prices and Rents
Here, we document the causal effect of NEES on property values or house prices and monthly rents of modern houses and flats. The results on the effect on house prices and rents are reported in Table 2. It shows that NEES has a significant and positive effect on house prices for the treated low-income households relative to the never treated households. Numerically, the NEES programme raises property values by a size of 3.3 ppts, and remained significant with increased precision after 1,000 bootstrap replicates. Thus, house prices of modern houses and flats increased from
Effect of NEES on House/Flat Prices and Monthly Rents.
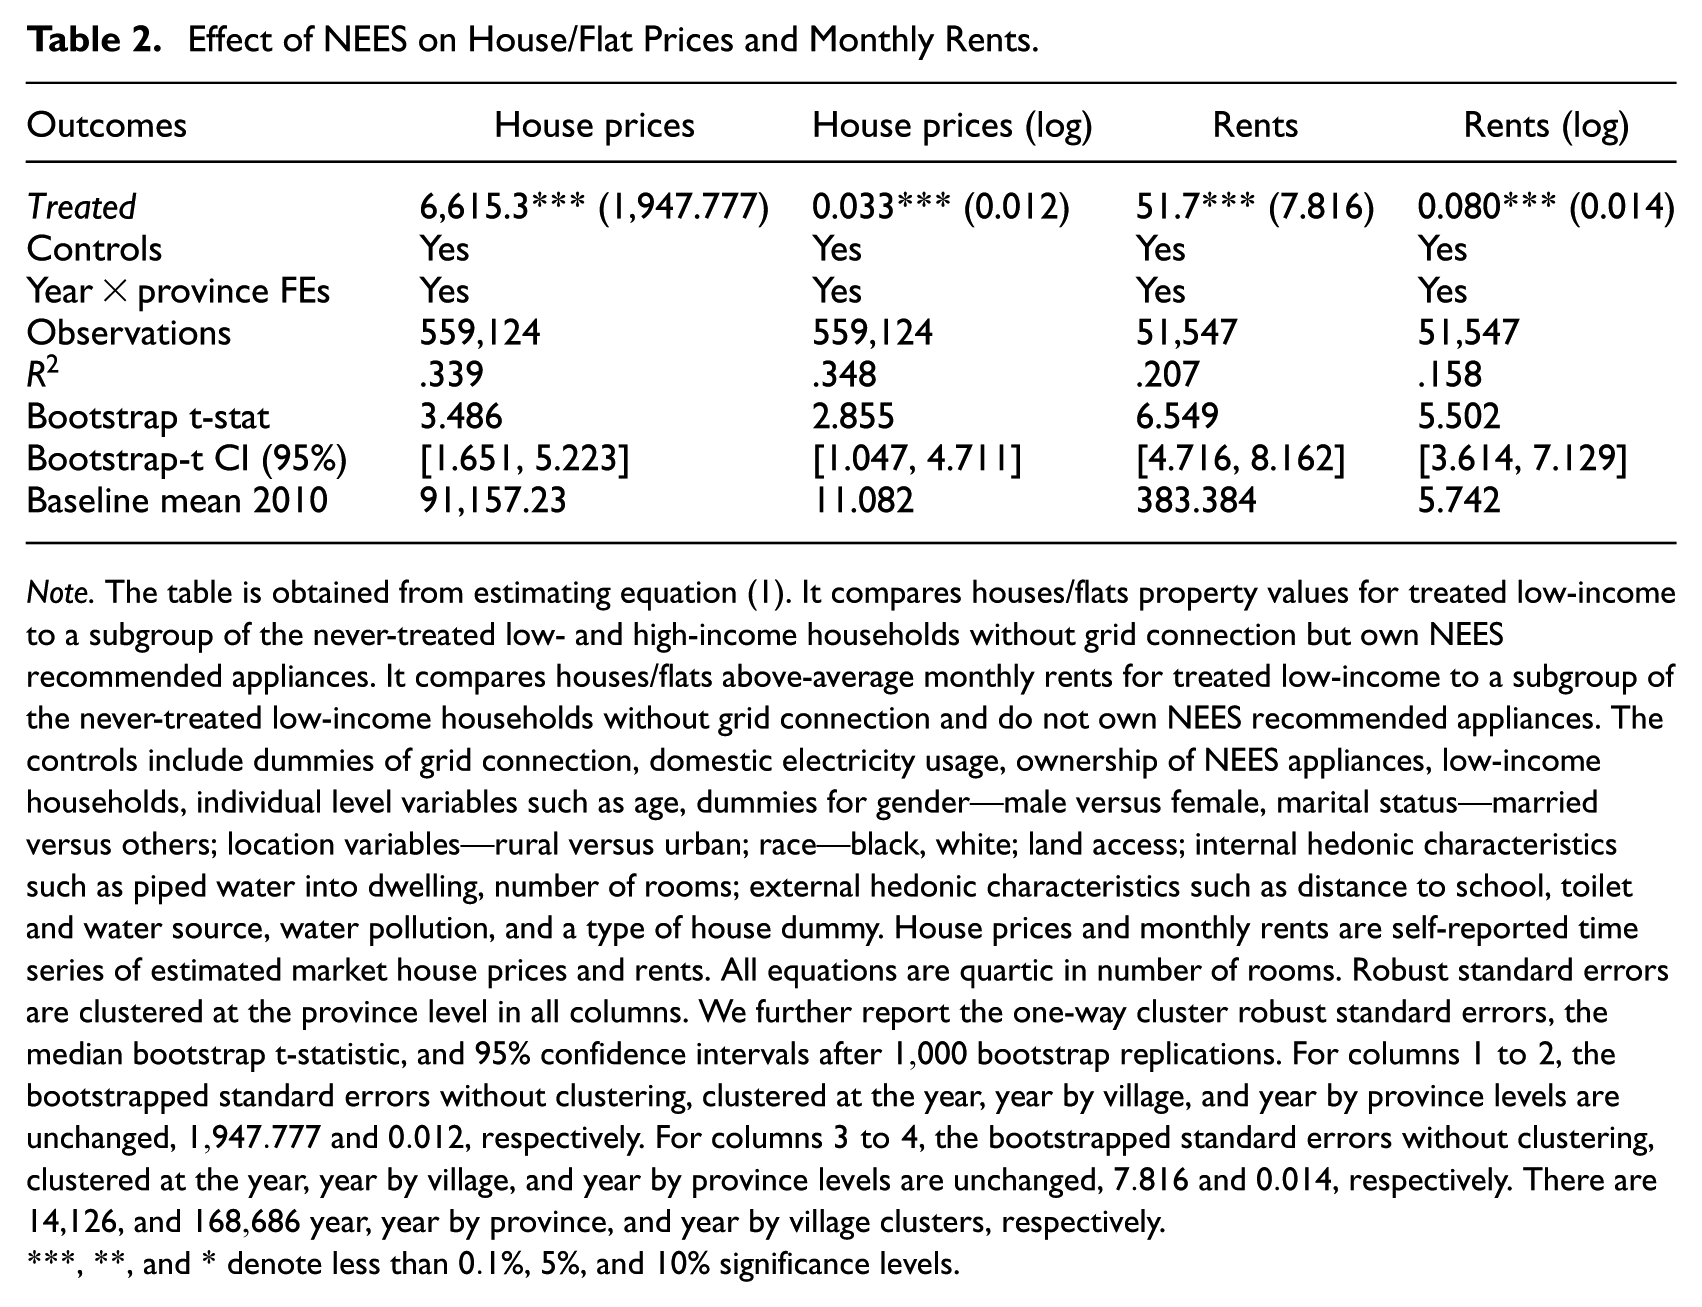
Note. The table is obtained from estimating equation (1). It compares houses/flats property values for treated low-income to a subgroup of the never-treated low- and high-income households without grid connection but own NEES recommended appliances. It compares houses/flats above-average monthly rents for treated low-income to a subgroup of the never-treated low-income households without grid connection and do not own NEES recommended appliances. The controls include dummies of grid connection, domestic electricity usage, ownership of NEES appliances, low-income households, individual level variables such as age, dummies for gender—male versus female, marital status—married versus others; location variables—rural versus urban; race—black, white; land access; internal hedonic characteristics such as piped water into dwelling, number of rooms; external hedonic characteristics such as distance to school, toilet and water source, water pollution, and a type of house dummy. House prices and monthly rents are self-reported time series of estimated market house prices and rents. All equations are quartic in number of rooms. Robust standard errors are clustered at the province level in all columns. We further report the one-way cluster robust standard errors, the median bootstrap t-statistic, and
, **, and * denote less than
Likewise, Table 2 reports the results on monthly rents. It shows that the NEES programme significantly raised monthly rents for the treated low-income households relative to the never-treated households. Specifically, NEES raised monthly rents by a size of
Similarly, Figure 3 reports the dynamic treatments effects of NEES on house prices and monthly rents. We find that house prices began to significantly rise from the fourth year after initial-treatment date and persists in the long-run, reaching a size of
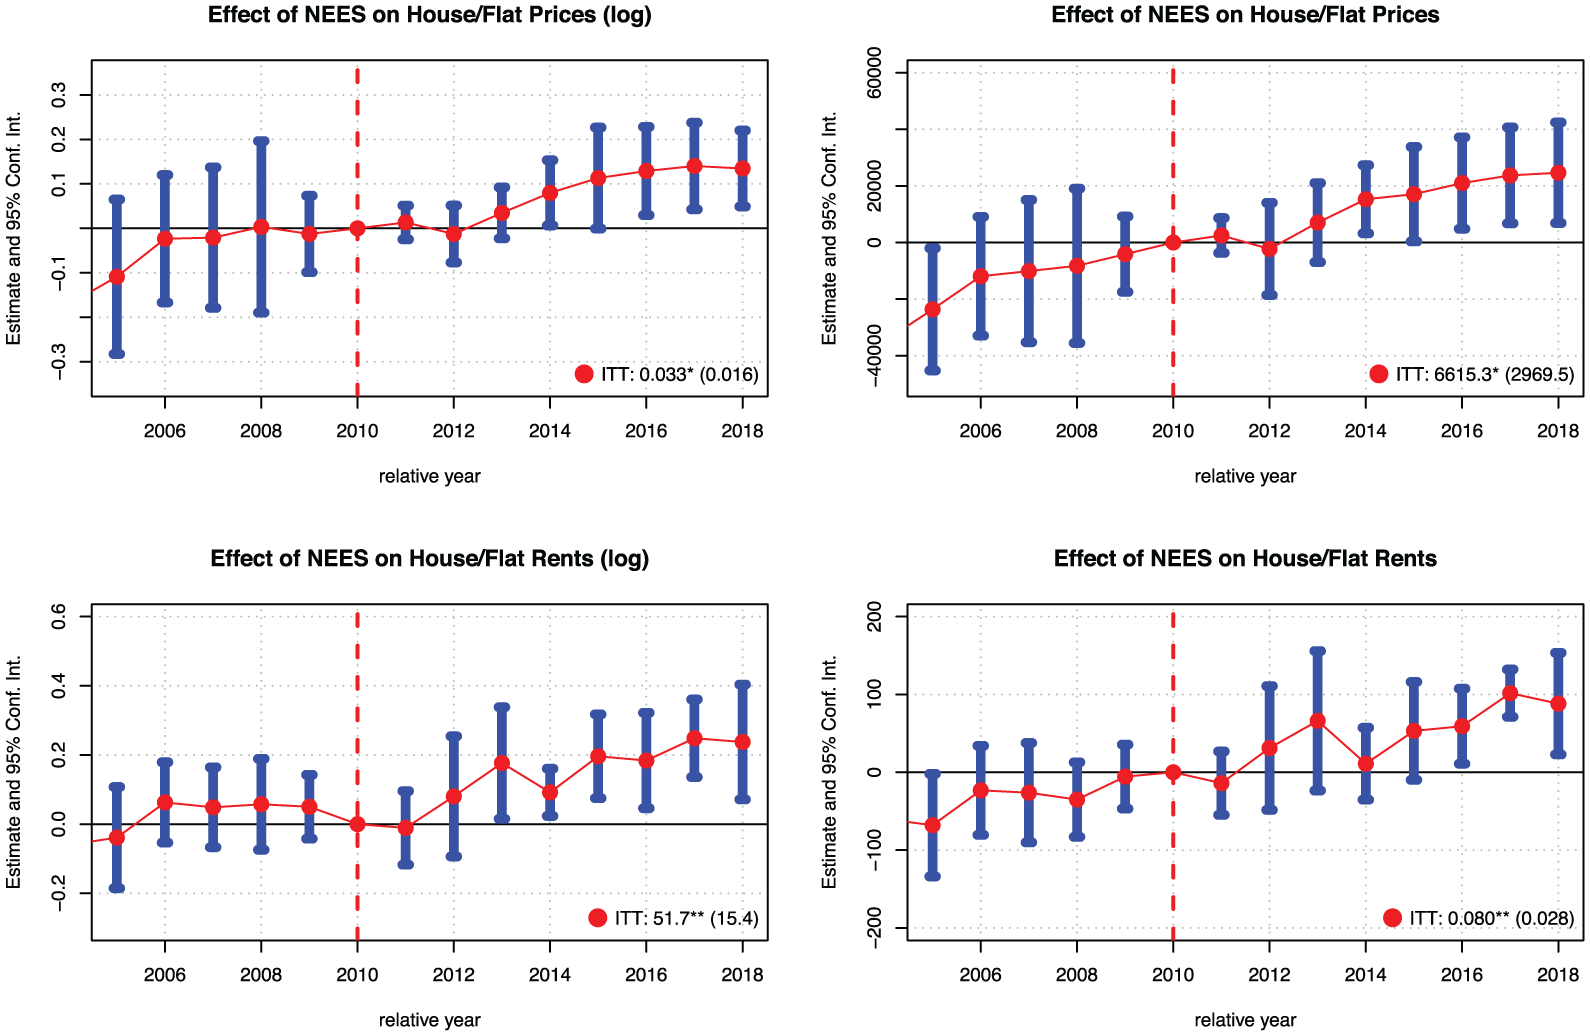
Dynamic effects of NEES on house/flat prices and rents.
Indeed, the results show that the energy efficiency programme is significantly capitalised into the South African housing market. Following, the hedonic framework, the direct adoption of the NEES programme in terms of efficient appliances in treated low-income households, serve as part of the key mechanisms for the rise in house prices and monthly rents. We record no evidence of significant pre-trends, corroborated by Rambachan and Roth (2023) parallel trends sensitivity test in Figure A3 of Appendix A.
6. Robustness Checks
We conduct several robustness checks on the results ranging from falsification exercises, investigating potential issues of selection into treatment, and use of alternative specifications (probit and two-stage differences-in-differences) and alternative experimental design to increase the confidence in the recovered causal effects on the outcomes. In what follows, we discuss these robustness exercises in more detail.
6.1. Falsification Tests
To test the internal consistency of the presented causal results, we estimate a falsifying equation (2) to evidence the effect of NEES on the outcomes attributable to the vector,

Null results from these counterfactual exercises will boost the internal validity of our main results. However, a significant impact would substantially reduce confidence in the results given that there is no clear mechanism linking NEES to animal dung energy usage, prices of informal dwellings, and below-average monthly rents in South Africa.
All RHS vectors are as defined in Section 5. After controlling for the common time-varying provincial fixed effects, the results in Table 3 generally show no correlations between NEES and the aforementioned outcomes, which is precise and robust after
Falsification Tests on the Effect of NEES.
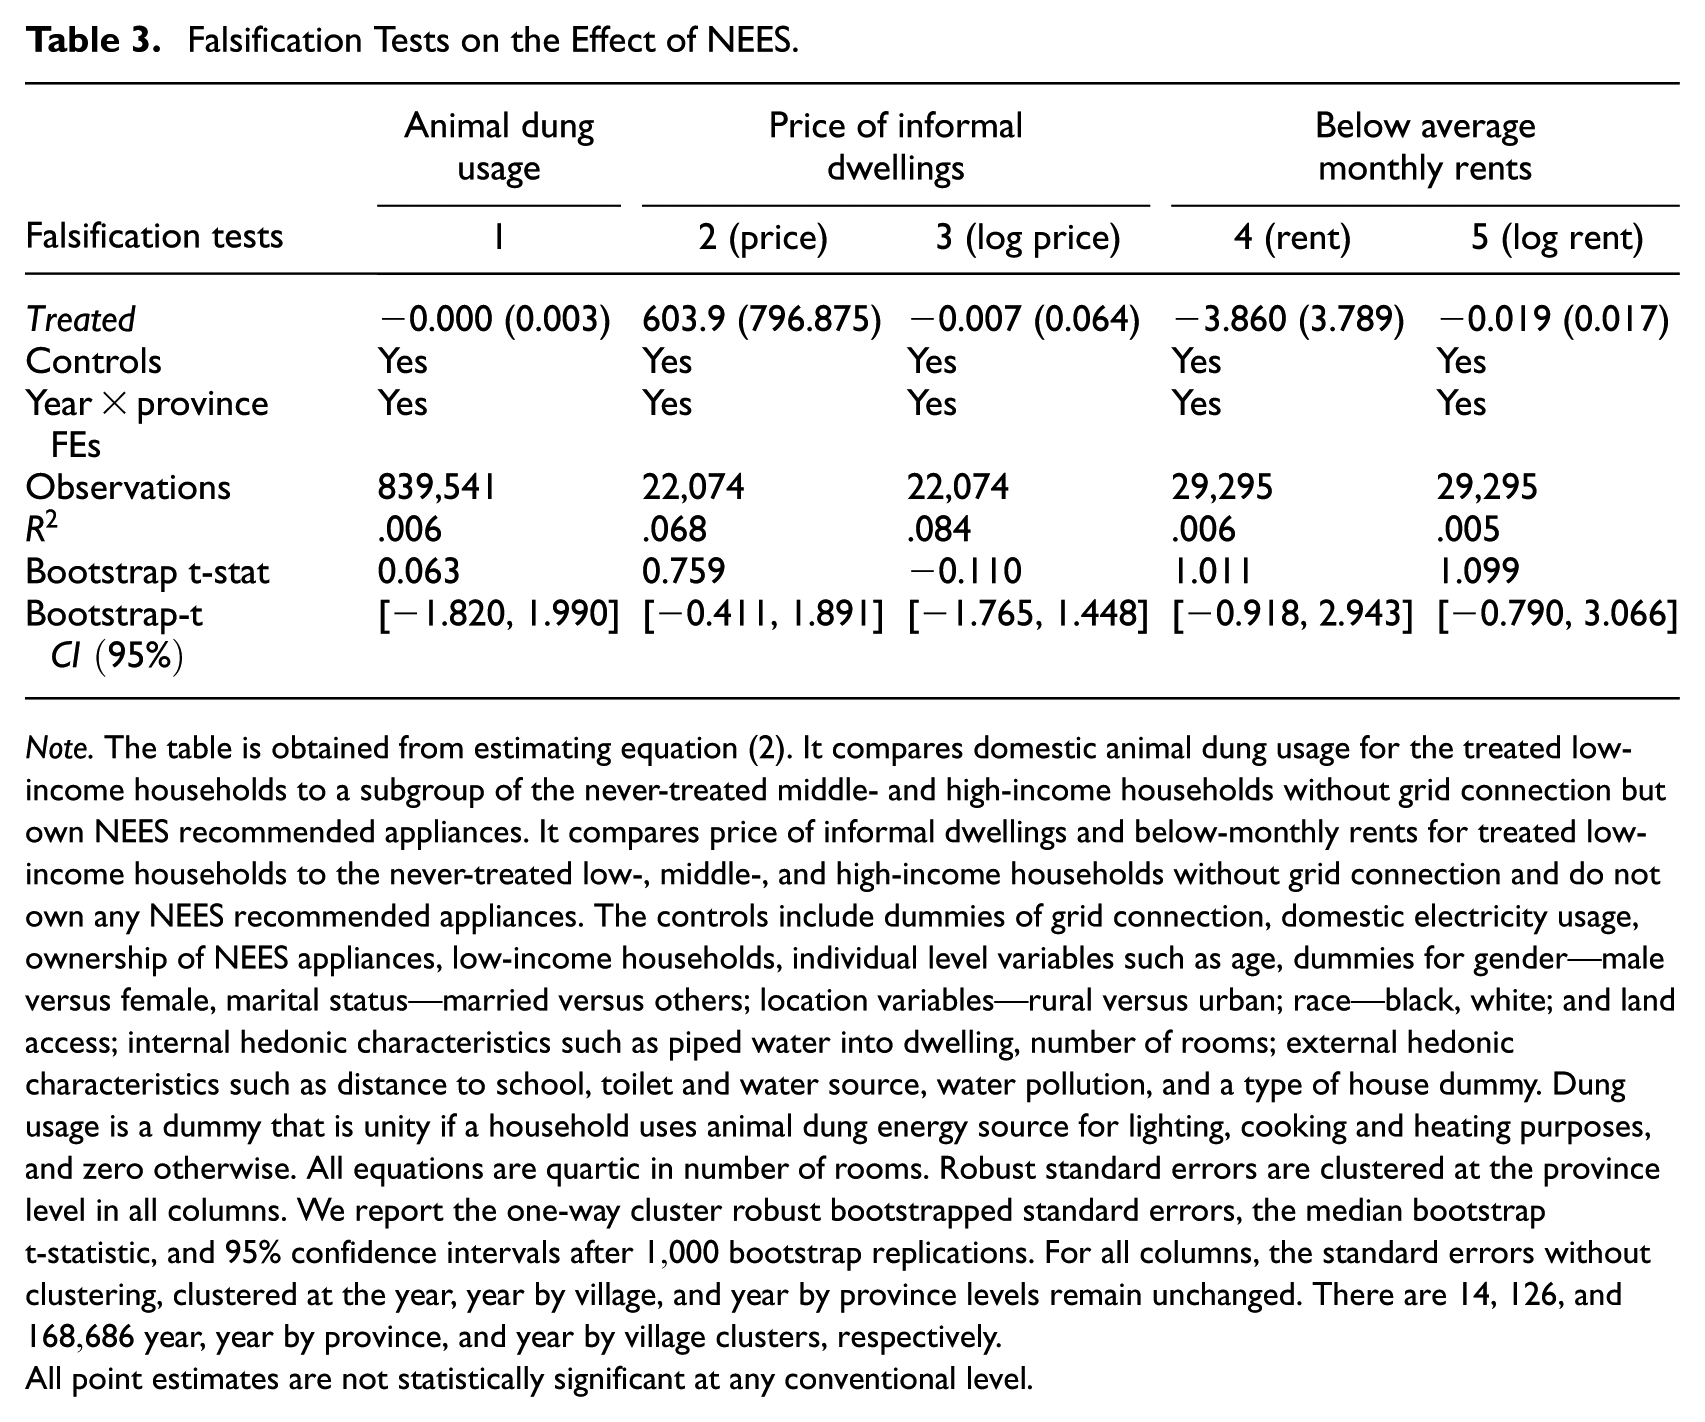
Note. The table is obtained from estimating equation (2). It compares domestic animal dung usage for the treated low-income households to a subgroup of the never-treated middle- and high-income households without grid connection but own NEES recommended appliances. It compares price of informal dwellings and below-monthly rents for treated low-income households to the never-treated low-, middle-, and high-income households without grid connection and do not own any NEES recommended appliances. The controls include dummies of grid connection, domestic electricity usage, ownership of NEES appliances, low-income households, individual level variables such as age, dummies for gender—male versus female, marital status—married versus others; location variables—rural versus urban; race—black, white; and land access; internal hedonic characteristics such as piped water into dwelling, number of rooms; external hedonic characteristics such as distance to school, toilet and water source, water pollution, and a type of house dummy. Dung usage is a dummy that is unity if a household uses animal dung energy source for lighting, cooking and heating purposes, and zero otherwise. All equations are quartic in number of rooms. Robust standard errors are clustered at the province level in all columns. We report the one-way cluster robust bootstrapped standard errors, the median bootstrap t-statistic, and
All point estimates are not statistically significant at any conventional level.
The dynamic null effects are reported in the Appendix D. These results in Table 3 and Figures D1 and D2 rule out any suspicions of spurious relations in the presented causal estimates in Tables 1 and 2, thus, raising the credibility and confidence that the recovered NEES effects on house prices and rents are indeed causal.
6.2. Testing Potential Selection Issues
Another concern in quasi-experimental designs is the issue of potential selection into treatment between the treated and never-treated groups given the differences in their observable compositional characteristics. We investigate this possible selection into treatment in equation (3), where vector

The result in Table 4 shows that the treatment may have been selective on some observable household characteristics such that the treatment may be driven by some pre-treatment covariates. For example, there may be a negative selection of low-income households with unpaid employment or those reporting that water pollution directly poses an environmental problem, or those that have water piped into their dwellings. This means that these low-income households are less likely to be treated and would under-estimate the causal effect on the outcomes if not controlled for in the regression model. On the other hand, there is a positive selection on grid connection, low-income households, race, homeowners, business owners, and income sources of all households. Thus, low-income households characterised by these observables may have been selected into treatment and if not controlled for, would over-estimate the effect on the outcomes.
Checks for Possible Selection on Observables.
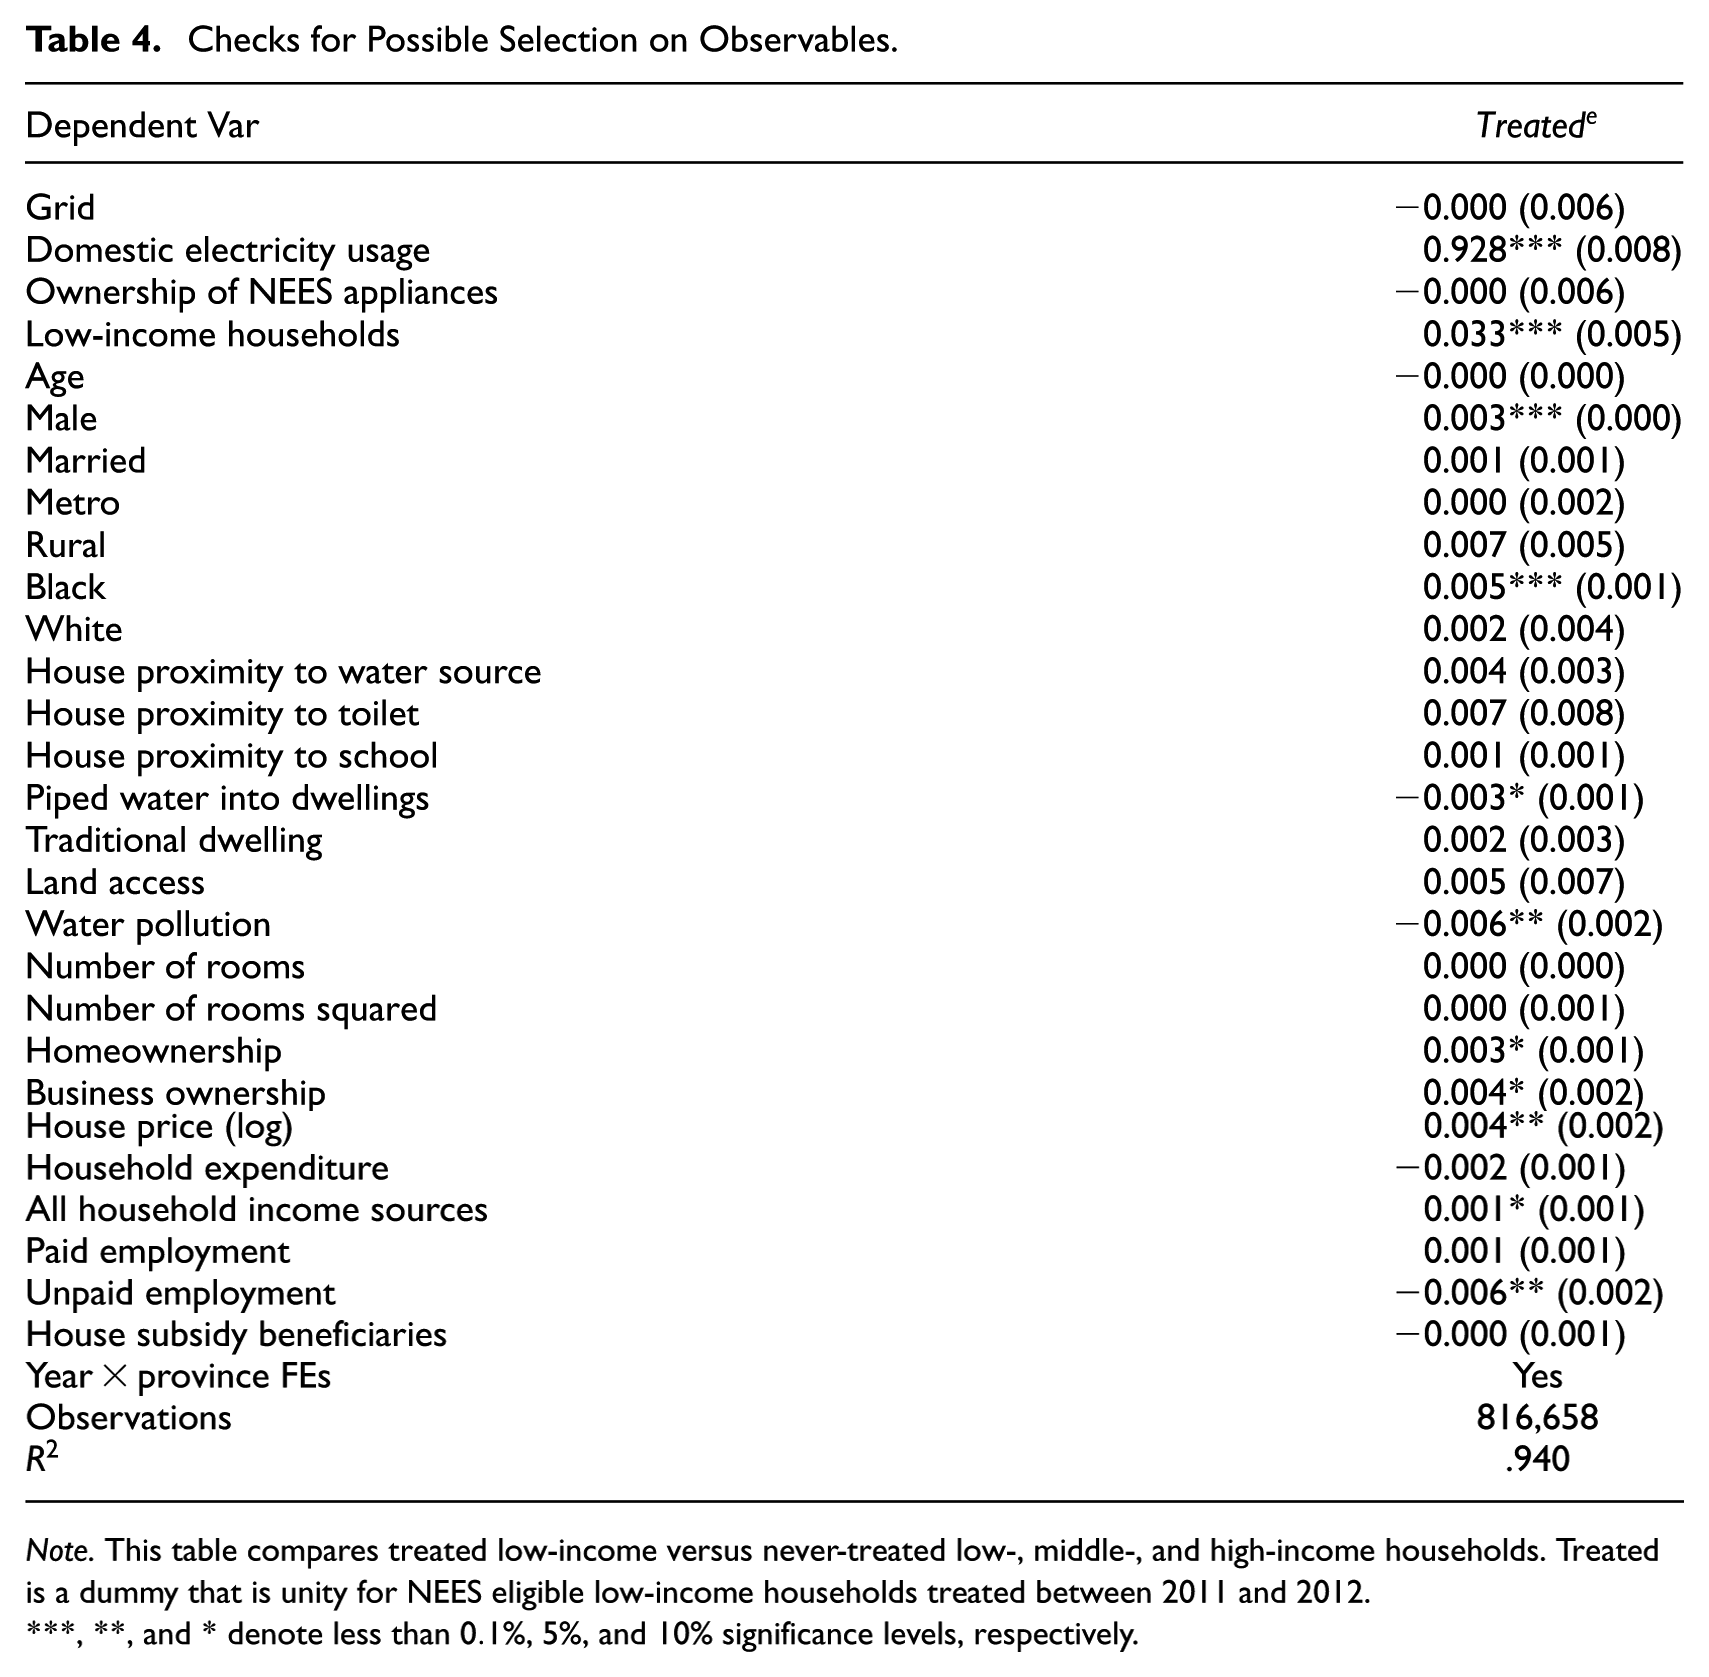
Note. This table compares treated low-income versus never-treated low-, middle-, and high-income households. Treated is a dummy that is unity for NEES eligible low-income households treated between
, **, and * denote less than
Based on these results, we re-estimate equation (1), separately adding these significant variables in Table 4 that are not already controlled for in the regression model. Importantly, the results in Table C1 of Appendix C show that the inclusion of these significant covariates have no substantial impact on the causal estimates in Tables of sub-sections 5.2, and 5.3, further raising confidence in the recovered causal impact of NEES on the housing market. Thus, our causal claims hold given the unconfoundedness assumption.
6.3. Alternative Model Specifications
6.3.1. Probit Specification
Further, we specify a probit model of the form in Section 5 retaining all the left- and right-hand-side (LHS and RHS) variables and definitions, except for programme adoption and grid usage.
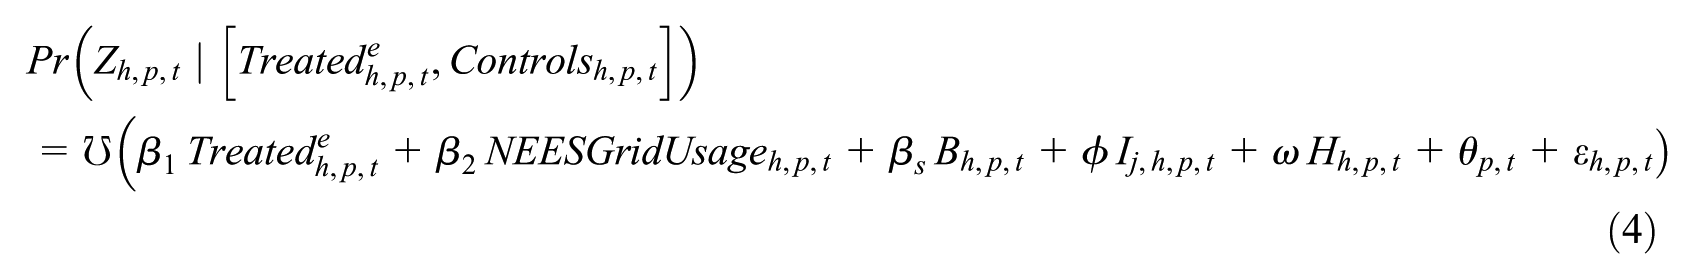
Probit Effects of NEES on Adoption and Grid Usage.
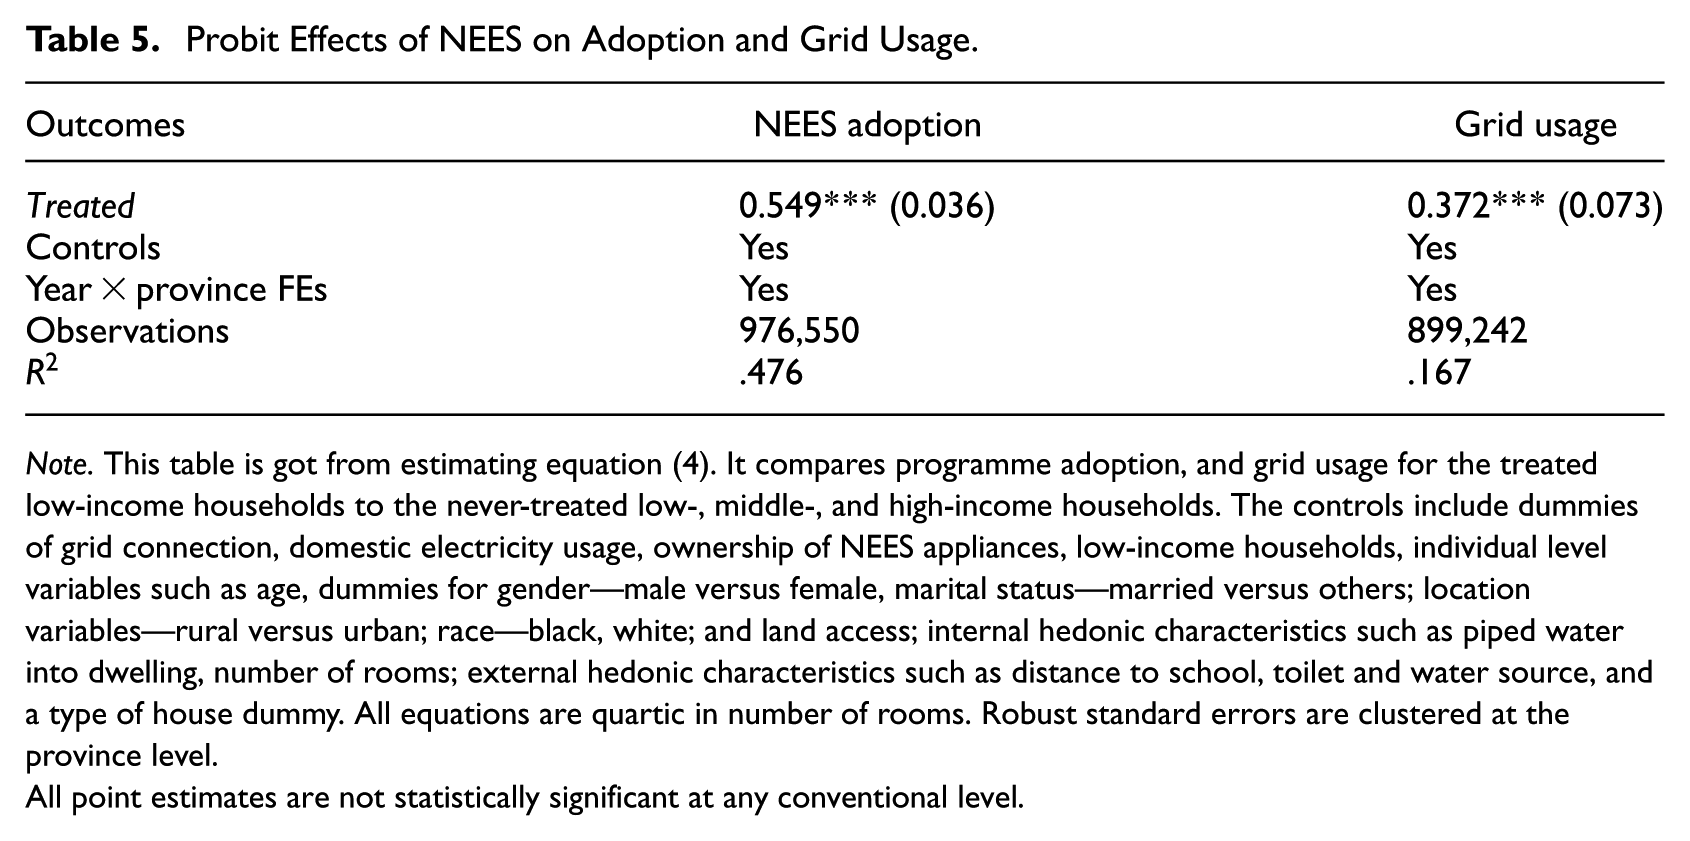
Note. This table is got from estimating equation (4). It compares programme adoption, and grid usage for the treated low-income households to the never-treated low-, middle-, and high-income households. The controls include dummies of grid connection, domestic electricity usage, ownership of NEES appliances, low-income households, individual level variables such as age, dummies for gender—male versus female, marital status—married versus others; location variables—rural versus urban; race—black, white; and land access; internal hedonic characteristics such as piped water into dwelling, number of rooms; external hedonic characteristics such as distance to school, toilet and water source, and a type of house dummy. All equations are quartic in number of rooms. Robust standard errors are clustered at the province level.
All point estimates are not statistically significant at any conventional level.
6.3.2. Two-stage Difference-in-differences Specification
Following the work of Gardner (2022), we specify a two-stage difference-in-differences model retaining all the LHS and RHS definitions as is in equation (1). This model estimates a simple difference-in-differences model accounting for possible negative weighting associated with the TWFE estimator when there are staggered treatment adoption. All RHS variables and vectors are as defined in Section 5. The event-study results in Figure A5 of Appendix A, and Table 6 further show robustness of the main results to this specifications. The robustness of the NEES effects on rents are better characterised using event studies.

Two-stage DID Effects of NEES on Adoption, Grid Usage, House Prices, and Rents.
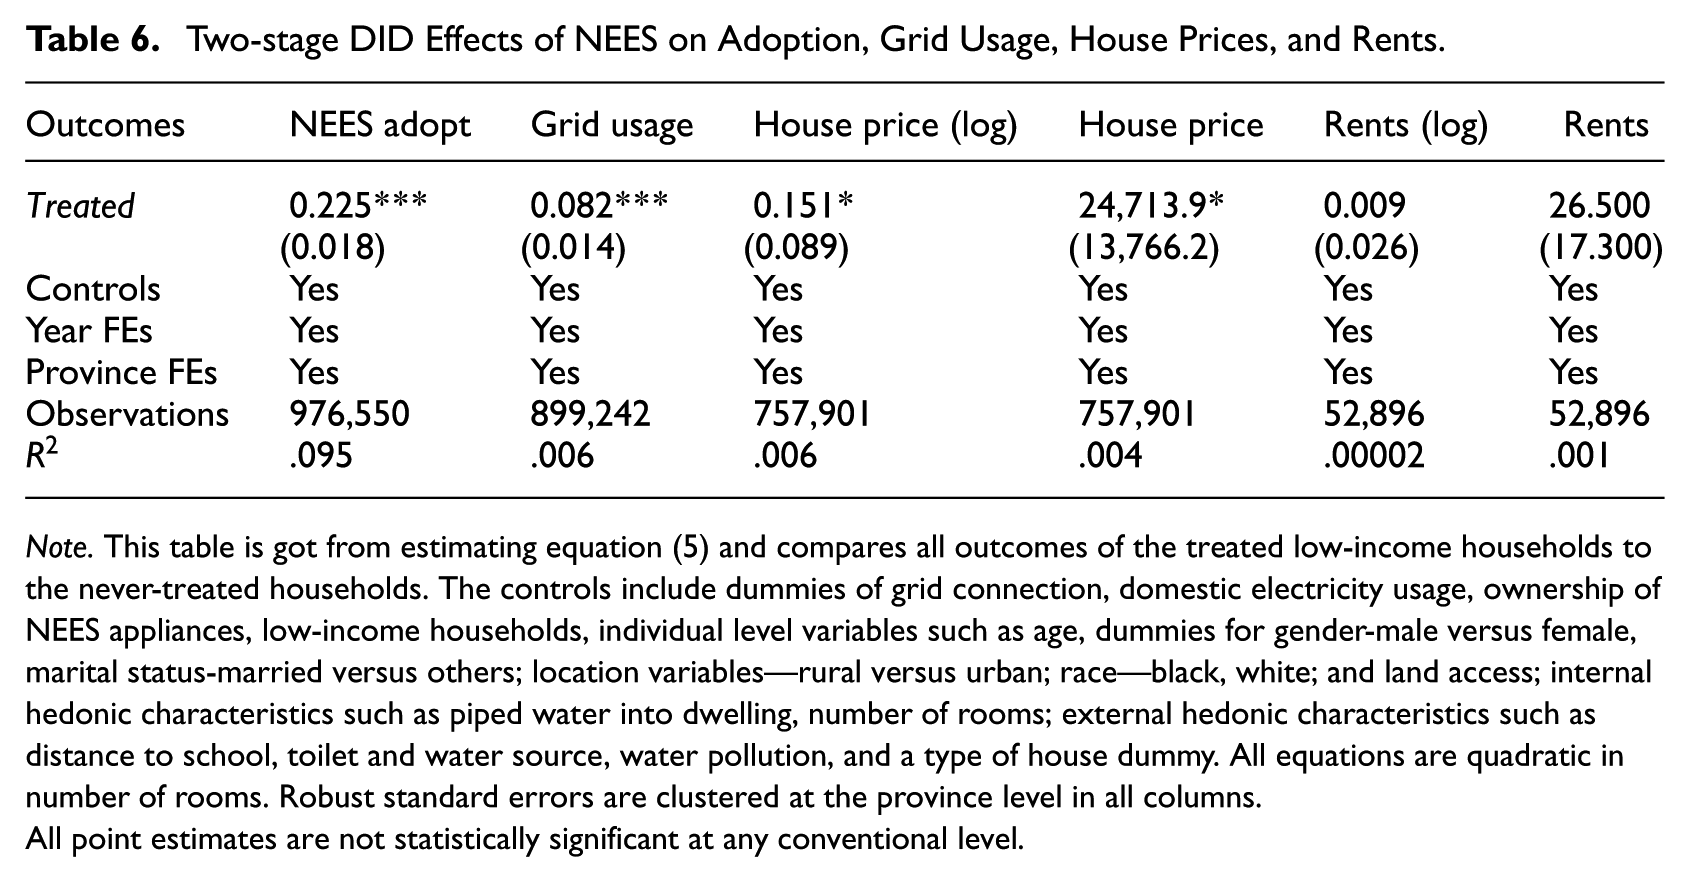
Note. This table is got from estimating equation (5) and compares all outcomes of the treated low-income households to the never-treated households. The controls include dummies of grid connection, domestic electricity usage, ownership of NEES appliances, low-income households, individual level variables such as age, dummies for gender-male versus female, marital status-married versus others; location variables—rural versus urban; race—black, white; and land access; internal hedonic characteristics such as piped water into dwelling, number of rooms; external hedonic characteristics such as distance to school, toilet and water source, water pollution, and a type of house dummy. All equations are quadratic in number of rooms. Robust standard errors are clustered at the province level in all columns.
All point estimates are not statistically significant at any conventional level.
7. Heterogeneous Analysis
This section discusses the heterogeneous characterisations of the observed effects to inform targeted policies. Regarding the adoption of the NEES programme, Table E1 reveals that energy efficiency adoption is most pronounced among low-income Black and Coloured population groups, homeowners, and renters residing in both rural and urban metro- and non-metropolitan areas. While programme adoption is positive for Whites and Asians/Indians, these effects are not statistically significant. Similarly, Table E2 shows that domestic grid usage is predominantly concentrated among low-income Black households and homeowners in rural and urban areas of metro- and non-metropolitan areas. Effects on renters, Whites, Coloureds, and Asians/Indians remain statistically insignificant. Furthermore, in Table E3, we do not find any statistically significant heterogeneous treatment effect of NEES on house prices, but higher monthly rents are dominated in urban areas of low-densely populated provinces, in Table E4.
8. Potential Mechanisms
Given the hedonic framework, we can infer higher house prices and rents by hedonic characterisations. This section explores potential mechanisms to realising these hedonic characteristics and how they contribute to the capitalisation of energy efficiency into the South African housing market, for treated low-income households. We specify a triple DiD in equation (6) to determine the differential impacts of the key channels to higher house prices and rents, given the NEES programme.
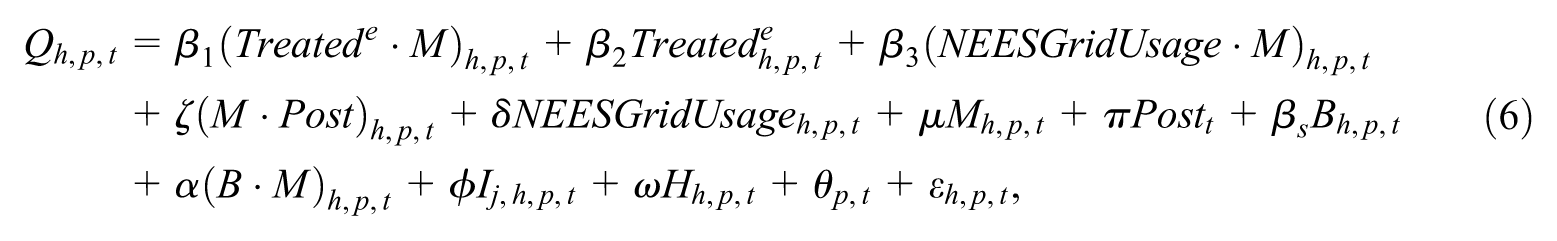
Where
Moderated NEES Effects on Local Housing Markets.
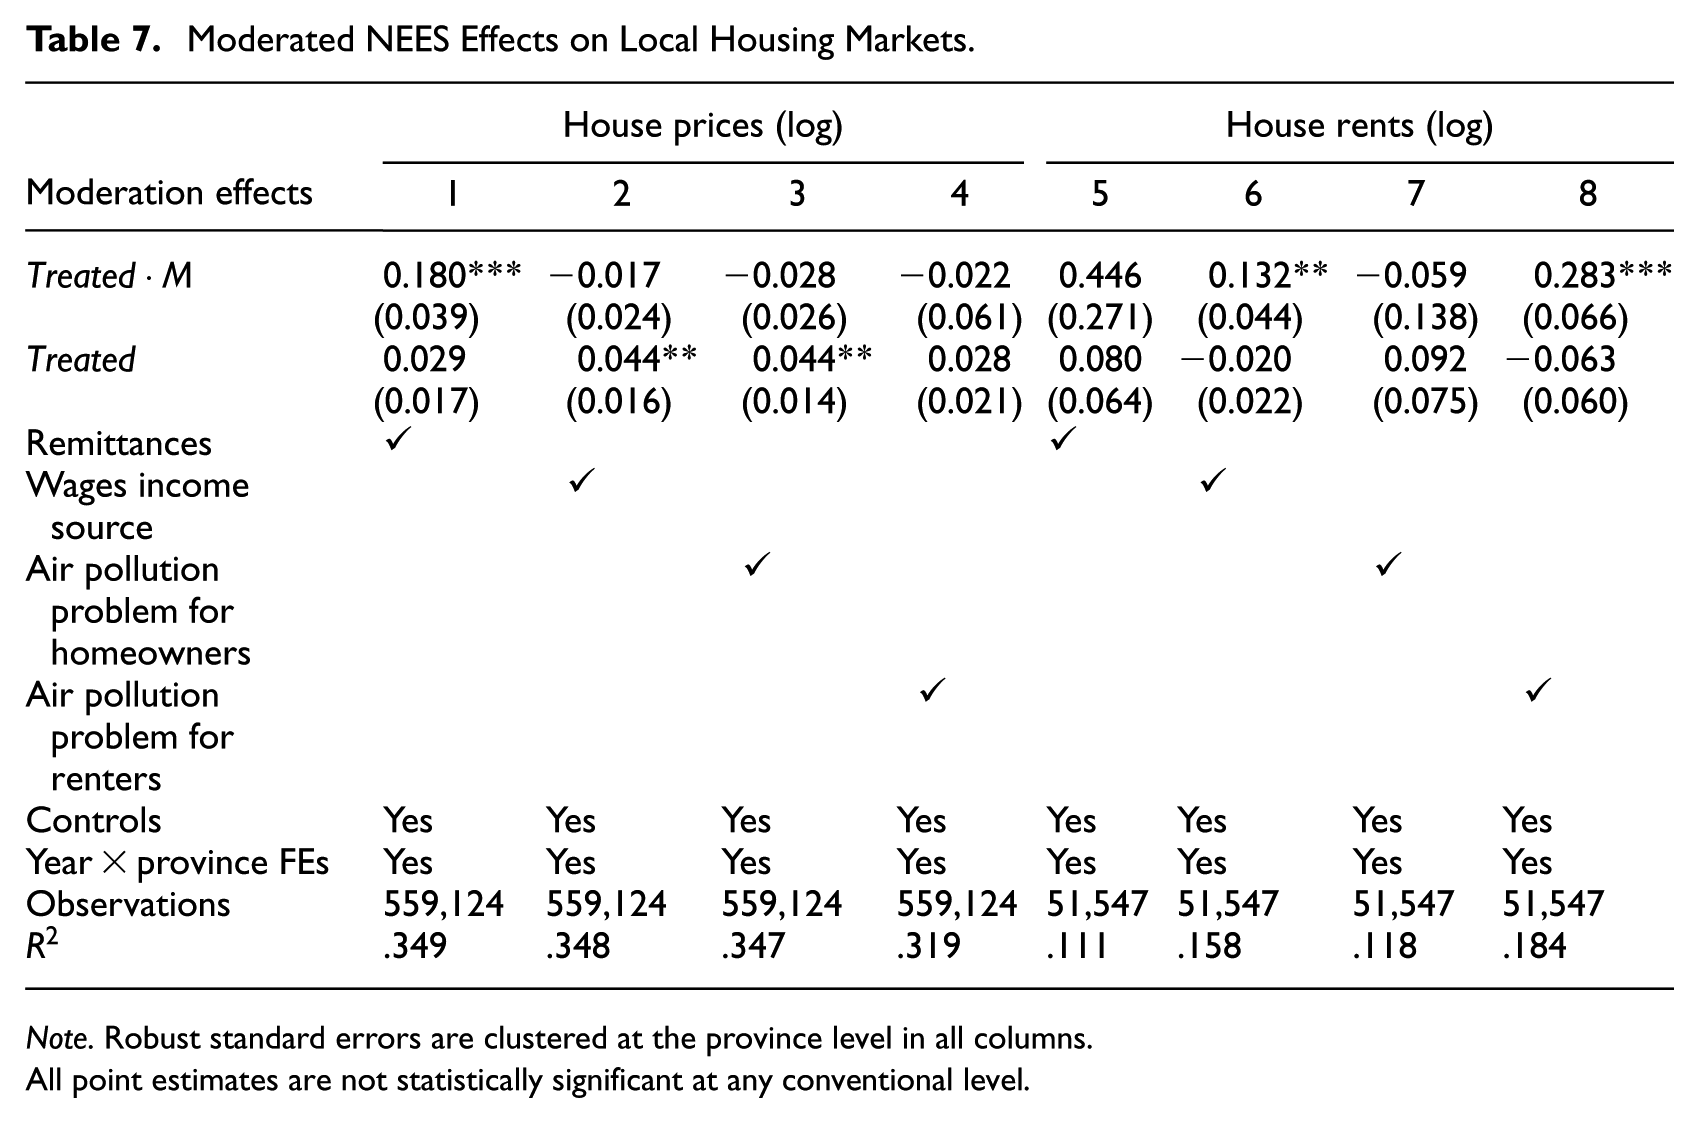
Note. Robust standard errors are clustered at the province level in all columns.
All point estimates are not statistically significant at any conventional level.
For the remittances channel,
Potential Mechanisms on Local Housing Market Effects.
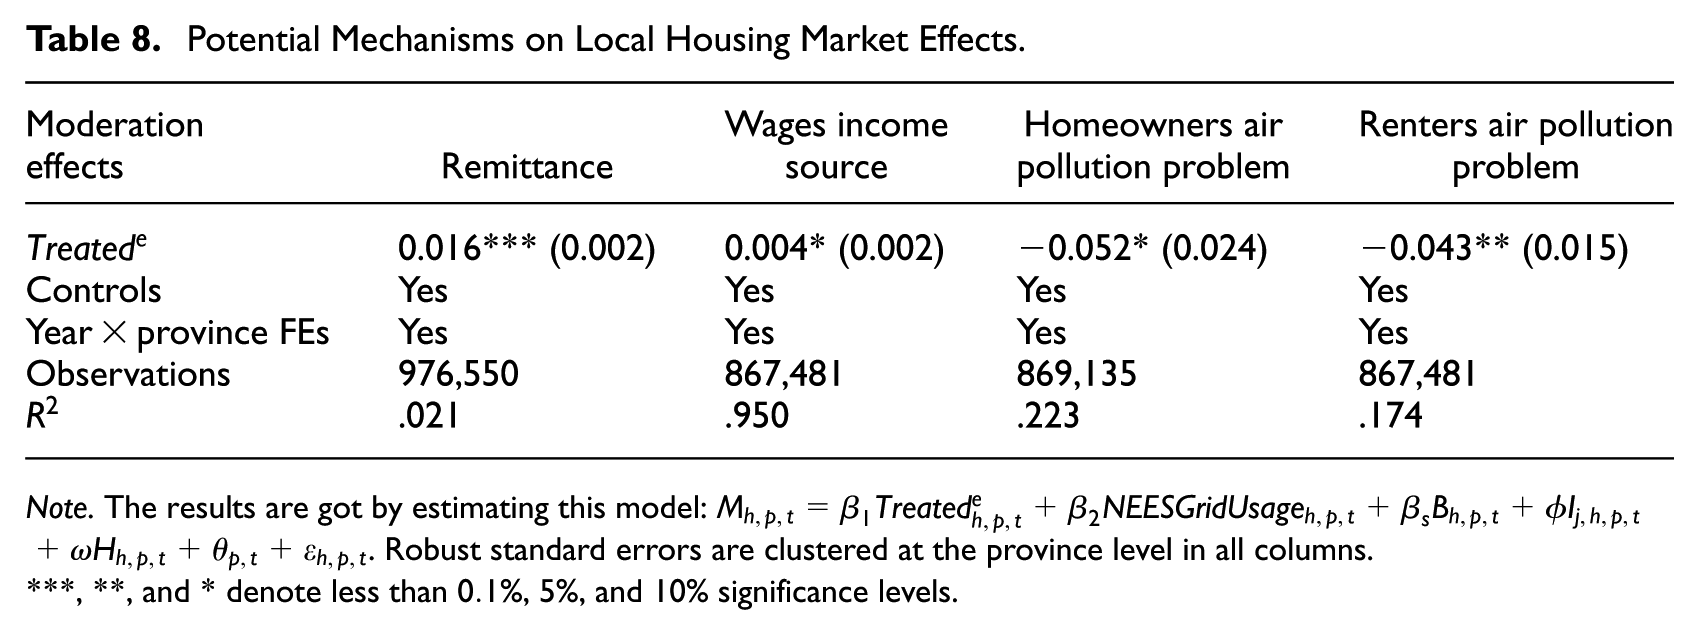
Note. The results are got by estimating this model:
, **, and * denote less than
For the wage channel,
For the air pollution channels for homeowners,
Similarly, for the air pollution channels for renters,
9. Conclusions
This study provides the first causal evidence of the NEES on South Africa’s housing market, demonstrating that energy efficiency policies can significantly influence property values and rents in a developing country context. Leveraging a quasi-experimental design and staggered implementation of NEES, the analysis reveals that low-income households adopting energy-efficient appliances and grid usage under the programme experienced a
The capitalisation of NEES into housing markets is driven by direct adoption of energy-efficient appliances and indirect channels such as remittances, wage income, and reduced air pollution. Remittances facilitated appliance purchases, amplifying house price effects, while wage income predominantly influenced rental increases. Urban areas and low-density provinces (Free State, North West, and Northern Cape) saw the most pronounced impacts, reflecting higher demand for modern, energy-efficient housing in these regions. Notably, the programme disproportionately benefited Black and Coloured low-income homeowners, underscoring socioeconomic disparities in access to energy-efficient technologies.
The success of South Africa’s NEES underscores the potential of energy efficiency as a “first fuel” to drive sustainable development, offering policymakers actionable pathways to amplify its impact. To maximise benefits, governments should prioritise investment in urban and peri-urban areas, where demand for energy-efficient housing is concentrated, while expanding targeted financial incentives—such as rebate programmes linked to wage income and remittance flows—to alleviate upfront costs for low-income households. Energy efficiency initiatives must also be integrated into broader social policies to address systemic barriers like grid inaccessibility and affordability challenges, particularly for marginalised communities. Concurrently, robust monitoring systems should track rebound effects to ensure efficiency gains translate into tangible emissions reductions rather than unintended increases in energy consumption. By aligning energy efficiency goals with equitable access and socioeconomic inclusion, policymakers can foster a sustainable transition that benefits both housing markets and vulnerable populations, balancing climate action with social equity.
This study bridges a critical gap in literature by providing causal evidence from a developing economy, where energy transitions intersect with socioeconomic inequities. The use of staggered difference-in-differences and robustness checks against selection bias strengthens internal validity. However, limitations include reliance on self-reported survey data and the inability to track individual households longitudinally. Future research could explore spatial heterogeneity in greater detail and assess the interplay between energy efficiency and renewable energy adoption in housing markets.
In conclusion, South Africa’s NEES demonstrates that energy efficiency policies can achieve dual objectives: advancing climate goals while stimulating inclusive economic growth through housing market dynamism. These findings offer a blueprint for similar economies seeking to balance sustainability with equitable development.
Footnotes
Appendices
Funding
The authors received no financial support for the research, authorship, and/or publication of this article.
Declaration of Conflicting Interests
The authors declared no potential conflicts of interest with respect to the research, authorship, and/or publication of this article.
1
It can be assumed that the target of a 10% improvement in energy efficiency implies a 10% reduction in the amount of energy required for a given level of activity. South Africa’s Department of Energy measured efficient energy use in terms of socioeconomic group classification of households’ electricity use for lighting, cooking, water- and space-heating purposes.
2
By 2015, the residential sector accounted for 25% of South Africa’s final energy demand, reflecting a notable rebound effect from NEES. The Department of Energy (DoE) envisions promoting energy efficiency as the “first fuel” to drive balanced, socially inclusive, and environmentally sustainable economic growth, stimulate job creation, and foster technological innovation across Sub-Saharan Africa. The “first fuel” concept is gaining global recognition, as energy efficiency is viewed as a hidden resource that should be maximized before considering other energy sources, due to its quicker implementation, longer-lasting benefits, and lack of negative generation impacts.
3
Hitherto to the White Paper on Energy Policy of 1998 in South Africa, energy use in most households came from less convenient and unhealthy sources (![]() ). Further, energy services by previous governments focused on creating an industrial urban society to meet the needs of the industrial sector, affluent and white-minority households. Importantly, previous energy policies have not addressed the energy conservation needs of high-income grid-electricity-dependent households. Some of these major energy policies include the Integrated Energy Planning of 2002, Free Basic Electricity Programme of 2003, National Electricity Regulator Act of 2004, and the National Energy Act of 2008. Hence, the White Paper provides a broad framework for the subsequent development and implementation of government energy efficiency policies for all households by income groups. This was aimed at ameliorating the negative health impacts from the use of certain traditional fuels and reducing energy related emissions that are harmful to the environment and human health. The NEES programme 2005 focused on energy efficiency improvements in all South African economic sectors.
). Further, energy services by previous governments focused on creating an industrial urban society to meet the needs of the industrial sector, affluent and white-minority households. Importantly, previous energy policies have not addressed the energy conservation needs of high-income grid-electricity-dependent households. Some of these major energy policies include the Integrated Energy Planning of 2002, Free Basic Electricity Programme of 2003, National Electricity Regulator Act of 2004, and the National Energy Act of 2008. Hence, the White Paper provides a broad framework for the subsequent development and implementation of government energy efficiency policies for all households by income groups. This was aimed at ameliorating the negative health impacts from the use of certain traditional fuels and reducing energy related emissions that are harmful to the environment and human health. The NEES programme 2005 focused on energy efficiency improvements in all South African economic sectors.
4
The Department of Energy (DoE) in South Africa reviewed the strategy at the end of every third-year of implementation, during which an appraisal and measurement of the energy efficiency strategy were performed.
5
Given that not all low-income households are either grid connected, use grid connection or purchased any NEES recommended appliances, and not all with grid connection purchased any NEES recommended appliances as at 2011, it suggests a non-constant treatment timing on treated low-income households between 2011 and 2012. As a remark, in South Africa, solar electrification programme replaced grid electrification for all low-income households not connected to the grid due to their non-proximity to the grid distribution stations. The solar electrification programme began in 2013, called New Household Electrification Strategy (![]() ). Thus, the NEES treatment applies to only those low-income households already connected to the grid by the end of 31st December 2012.
). Thus, the NEES treatment applies to only those low-income households already connected to the grid by the end of 31st December 2012.
6
The survey does not cover collective living quarters such as students’ hostels, old age homes, hospitals, prisons, and military barracks.
7
Treatment is defined based on the NEES eligibility conditions discussed in Section 3. The GHS dataset used for this study do not have information on the energy performance standards of household appliances. Thus, given the discussed eligibility criteria, it is logical that the component of the never-treated households that are not connected to the grid whether or not they own any appliance, are more likely to own and use energy inefficient ones. Invariably, the treated low-income households are most likely to own energy efficient appliances because they use grid connection for their domestic purposes. The target of households with domestic grid usage is to approximate South African households that actually consume electricity supplied from the grid. This way, we avoid those households that may have grid-connection status without actual supply of electricity to their homes.
8
Low-income households are those whose monthly income is, I≤R1600, middle-income households earn between R1601 ≥I≤R25600, and high-income households earn R25601 > I. Thus multiplying these ranges by 12 gives the annual household income realisations.
9
Although this study is a household staggered treatment design, there is limited available domain knowledge to exactly map household units to their exact year of treatment assignment, which would have necessitated a staggered difference-in-differences (DID) estimation, and clustering at the household level. For example, we have repeated cross-sections at the household level, but lack information about which household units were treated in either 2011 or 2012. However, given household characteristics and NEES eligibility conditions, we can identify any low-income household in any province that meets the NEES eligibility conditions and assumed to have received the treated within this timeframe. Hence, the use of the TWFE estimator. Consequently, given that we have a provincial panel, and it is the level with clear treatment assignment information, clustering at the province level was a cautious way to mitigate the uncertainty in the household treatment assignment.