
Abstract
Using China’s higher education expansion as a natural experiment, we examine the causal effect of education quality on the proclivity to be in energy poverty. We find that education causes a reduction in the likelihood of being in energy poverty and that the point estimates are largest for those that attended elite universities, followed by those who attended non-elite universities and colleges. This finding is robust to alternative ways of measuring energy poverty, as well as a series of sensitivity checks. We find that cognitive ability, employment status, generalised trust and income mediate the relationship between education and energy poverty.
1. Introduction
The European Commission (2021) defines energy poverty as a distinct form of poverty “due to a combination of high energy expenditure, low household incomes, inefficient buildings and appliances, and specific household energy needs.” 1 Reducing the incidence of energy poverty has several potential economic and social benefits (Delugas and Brau 2021; Singh and Inglesi-Lotz 2021). As a consequence, a growing literature seeks to understand the behavioural reasons why so many people are in energy poverty and what can be done to reduce the incidence of energy poverty. Yet, despite the widespread recognition of the importance of education for realising a raft of desirable economic outcomes, there is little research on the role of human capital accumulation in explaining proclivity to be in energy poverty. As far as we are aware, the only study that directly addresses this issue is Apergis, Polemis and Soursou (2021) who examine the effect of education on energy poverty for a sample of 30 developing countries over the period 2001 to 2016 using generalised methods of moments (GMM) to address the endogeneity of education. They find that country-level total education expenditure and secondary school enrolment rates have a negative effect on energy poverty, defined as access to electricity. Relatedly, there is a small body of literature using macro data that finds a negative relationship between human capital (e.g., average years of formal schooling or a human capital index at the provincial or national level) and energy consumption across Chinese provinces (Salim, Yao and Chen 2017), OECD economies (Shahbaz, Gozgor and Hammoudeh 2019; Yao et al. 2019), and other countries (Akram, Jangam and Rath 2020).
There are also a few micro studies that examine the relationship between education, along with other socioeconomic variables, and energy poverty (Abbas et al. 2020; Crentsil, Asuman and Fenny 2019; Dogan, Madaleno and Taskin 2021; Koomson and Danquah 2021; Primc, Slabe-Erker and Majcen 2019; Qurat-ul-Ann and Mirza 2021; Sharma, Han and Sharma 2019). These studies generally find that education is negatively related to energy poverty. This literature, though, has several limitations with respect to ascertaining the relationship between education and energy poverty. The first is that the relationship between education and energy poverty is not their main focus; rather, education is just one of several socioeconomic determinants considered. Second, education is typically measured in a reasonably crude manner, such as using a binary variable for whether the household head is educated (see e.g., Koomson and Danquah 2021). Third, importantly, none of these studies addresses that education is likely endogenous.
We examine the effect of education on energy poverty in China. To do so, we use data from the 2012 to 2018 waves of China Family Panel Studies (CFPS), a nationally representative survey of households. We pay particular attention to the differential effects of education quality on energy poverty, distinguishing whether the respondent attended an elite or non-elite university. To address the endogeneity of university education, we employ China’s higher education expansion policy in 1999 as a quasi-natural experiment. The expansion of the higher education sector in China in the late 1990s created different likelihoods of being admitted to a university, depending on whether applicants took the university entrance exam prior, or subsequent, to the implementation of the expansion policy. Because China has a relatively strict school starting age, whether one belongs to the cohort before, or after, the introduction of the policy change depends on one’s age, which is exogenous to when the policy was introduced, which was long after when first affected cohorts were born. We examine the channels through which education could affect the likelihood of being in energy poverty, focusing on the roles of labour market outcomes and factors affecting expenditure on energy. We find that higher education causes a reduction in energy poverty and that the effect sizes are larger for those that attended elite universities. We also find that income, employment, cognitive function and trust mediate this observed relationship.
We contribute to the literature on education and energy poverty in three ways. First, we provide the first causal estimates of education on the likelihood of being in energy poverty using micro-level household data. Having causal estimates, rather than simply knowing that human capital is correlated with energy poverty, is important for making policy decisions. The only extant study to provide causal estimates of the effect of human capital on energy poverty is Apergis et al. (2021); but because they use macro data, they define energy poverty in a very limited way as access to electricity. The same is true for the very few studies that have examined the causal effect of human capital on energy consumption at the macro level. However, it is important to note that energy consumption does not equate to energy poverty. High income households might spend a lot on energy consumption because, for example, they have large houses or appliances that consume a lot of energy. In addition, because these studies are at the macro level, the best they can do is identify broad cross provincial and cross-national trends. They say nothing about how education affects energy consumption or energy poverty at the household level. Thus, the principal contribution of this study is that we are the first to provide causal estimates of the effect of education on energy poverty at the household level where energy poverty is defined according to the standard measures in the energy poverty literature.
Second, existing studies employing macro data use highly aggregated measures of human capital, such as expenditure on education, school enrolment rates or years of schooling, while micro-level studies use fairly crude measures like education of the household level. Each of these studies focus on the quantity of education received, rather than examining the effect of differences in the quality of schooling on energy consumption or energy poverty. A reasonable hypothesis is that not only the amount of education that one receives, but whether one attends an elite versus non-elite university or college, will be predictive of whether one is in energy poverty. Our study is the first to explicitly consider the effects of differences in the quality of education, defined in terms of the Chinese government classification of higher education institutions, on the probability of being in energy poverty.
Third, we pay particular attention to the channels through which education influences proclivity to be in energy poverty, focusing on the role of education in influencing both household income and energy expenditure.
2. How Does (Elite) University Education Affect Energy Poverty?
We expect higher levels of education to affect the likelihood of being in energy poverty through household income via labour market channels and through influencing energy consumption and expenditure. With respect to the latter, better-educated households choose appliances that are more energy efficient, hence, consuming less energy (Broadstock, Li and Zhang 2016; Pachauri and Jiang 2008; Wang, Wang and Guo 2017). Better educated households are also more environmentally aware and energy conscious, leading them to take steps to reduce energy consumption whenever possible (Broadstock, Li and Zhang 2016; Démurger and Fournier 2011; Jacksohn et al. 2019; Pachauri and Jiang 2008; Wu and Zhang 2017). Better educated individuals are likely to understand complicated energy plans better and be better able to negotiate a better plan with their existing supplier or switch to another supplier, reducing their energy bill. Finally, better-educated individuals are more likely to live in more desirable suburbs with more modern housing and have better quality and more energy-efficient homes (see e.g., Scott 1997).
We conjecture that the returns to education in terms of a lower incidence of energy poverty will not only be limited to the number of years of schooling—for example, if one attended university, as opposed to just high school—but also be reflected in the quality of one’s education. Specifically, we hypothesise that those who attended elite universities will have a lower incidence of energy poverty than those who attended non-elite universities and colleges. We cannot examine all the possible channels through which (elite) education could affect the likelihood of being in energy poverty and do not have the data to do so. We outline four potential channels, concentrating on labour market outcomes and effects on energy expenditure.
2.1. Labour Market Channels
We examine income and employment outcomes. Most studies in China find positive wage returns to (elite) higher education (Jia and Li 2021; Kang, Peng and Zhu 2021; Li et al. 2012b; Zheng, Zhang and Zhu 2021). Income is negatively related to the incidence of energy poverty (Khandker, Barnes and Samad 2012; Ma, Zhou and Renwick 2019; ul Husnain et al. 2021).
The second labour market channel is via employment. The labour market for graduates is polarised. Those who obtained an (elite) university qualification are more likely to secure employment than those with a college or non-elite university qualification (Chan and Zhang 2021; Li, Morgan and Ding 2008). In addition to the signalling effect of one’s elite university qualification (Spence 1973), Chinese employers often openly discriminate against graduates from non-elite universities and colleges and prefer to attract applicants from elite universities via offering named scholarships, internship programs and attending exclusive recruitment fairs (Li et al. 2012a). Being employed is associated with a lower probability of being in energy poverty (Koomson and Danquah 2021).
2.2. Expenditure on Energy
We consider two mechanisms through which expenditure on energy may be a channel through which education could affect the likelihood of being in energy poverty. The first is via cognitive function. We employ memory function, one of the central constructs in the theory of cognition (Oberauer et al. 2000), to proxy cognitive function. Educational attainment is positively correlated with better memory function (Cutler and Grams 1988), while low educational attainment is a risk factor for accelerated memory decline (Schmand et al. 1997). Individuals with higher cognitive/memory function are less likely to be in energy poverty for several reasons. First, much of consumer behaviour, including expenditure on energy, is goal-oriented (Bagozzi and Dholakia 1999). Memory plays a vital role in planning (Baddeley 1992), which is the psychological basis of intelligent goal-directed behaviour (Das, Kar and Parrila 1996). Goal-framing theory suggests that normative goals (e.g., social norms of pro-environmental behaviour) and gain goals (e.g., saving on energy bills) are important determinants of household adoption of energy-saving technology and engaging in energy conservation (Bergquist and Nilsson 2016; Koo and Chung 2016). Second, energy bills and plans, including energy tariffs, are often difficult to understand. Individuals with higher cognitive ability are likely to be able to understand the implications of complicated tariffs and make informed decisions that minimise the cost of the energy they use. Third, individuals with lower cognitive function have lower self-efficacy when it comes to negotiation (Sheehy-Skeffington and Rea 2017), meaning that they are less able to manage the stress that is often attached to switching suppliers or plans (Brooks and Schweitzer 2011).
The second potential mechanism is trust. Previous research finds a strong positive relationship between educational attainment and trust (Borgonovi 2012; Hooghe, Marien and De Vroome 2012; Nannestad 2008). A significant body of literature examines the importance of trust in affecting economic transactions and consumer behaviour. For instance, poor economic outcomes can be attributed to a lack of trust and mutual confidence in economic agents (Arrow 1972). Previous research has found that, in Australia, trust mediates the relationship between ethnic diversity and energy poverty (Awaworyi Churchill and Smyth 2020). Across 1 European countries, a lack of trust in both public and private institutions is widespread among energy-poor households (Grossmann et al. 2021).
There are several reasons why trust affects energy poverty. First, social trust could result in reduced expenditure on energy through fostering pro-social behaviour, such as engendering a personal responsibility for addressing climate change. This, in turn, could promote energy-saving behaviour, such as purchasing energy-efficient home appliances and reducing energy consumption (Caferra, Colasante and Morone 2021; Oikonomou et al. 2009).
Second, individuals who exhibit higher trust are also likely to have more social networks and be better integrated into the local community, meaning that they are likely to spend less time at home and, thus, have less expenditure on energy. Third, individuals with a higher level of trust can reduce information asymmetry through a self-sustaining system that provides economic advantages to those that are better connected. Similar to the argument presented in Awaworyi Churchill and Smyth (2020) on the impact of trust on energy poverty, when new or privileged information about energy consumption reduction opportunities exists, trust can help ensure that this information is circulated more effectively among trusted social networks, and, thus, in the absence of trust energy-saving opportunities could be lost, which contributes to higher energy poverty.
Finally, as Grossmann et al. (2021, 1) argue, “trust in networks or (people in) institutions can strengthen the coping capacities of energy-poor households while a lack of trust even cuts people off from the support they could attain and thus deepens their state of energy poverty.” Thus, trust can facilitate efforts to reduce energy insecurity and poverty (Ambrosio-Albala et al. 2020; Shapira, Shibli and Teschner 2021). For instance, Stojilovska, Yoon and Robert (2021) find that those who are less trusting fear needing to repay energy subsidies and welfare aid and, thus, are reluctant to utilise these sources to adjust their energy consumption. In this regard, a higher level of trust can “ease the journey from passive consumerism to active energy citizenship among the energy poor” (DellaValle and Czako 2022, 1).
3. Data and Measurement of Key Variables
We use panel data from the 2012 to 2018 CPFS, a nationally representative survey of households, which is administered every 2 years by the Institute of Social Science Survey at Peking University. 2 CFPS employs an implicit stratified, multistage, multilevel and probability proportional to the size sampling method. 3 The 2012 to 2018 waves cover 13,315, 13,946, 14,019 and 14,218 households and 35,719, 37,147, 36,892 and 37,354 individuals, respectively. The survey collects detailed information on an individual’s educational attainment, the tier of university attended, household energy expenditure and a wide range of personal and family characteristics.
Our sample is restricted to individuals born in 1970 or later, which helps to rule out the potential confounding impacts of other important historical events, such as the Great Chinese Famine (1959–1961) and the most intensive period of the Cultural Revolution (1966–1970), 4 which have been shown to have long-lasting impacts on adult outcomes (Cheng et al. 2021b, 2022; Hayward, Cheng and Wang 2022; Meng and Zhao 2021). Following existing literature (Chen, Wang and Cheng 2022; Kang, Peng and Zhu 2021), we also exclude individuals who have only completed junior high school education or below (i.e., 9-year compulsory education) and, thus, do not proceed to higher education via senior high school. Our final sample consists of 12,697 individuals across 31 mainland provinces.
3.1. Tiers of Universities
The Chinese higher education sector includes colleges that issue three-year undergraduate diplomas (dazhuan) and universities that issue four-year bachelor’s degrees and higher (master’s and doctoral) degrees. Universities can be elite or non-elite. Elite universities are part of the so-called Project 211 and/or Project 985 of the Chinese government. Project 211, launched in 1993, was a program to strengthen 112 universities as a national priority for the 21st century. Project 985 sought to develop world-class universities in the 21st century. The first phase of Project 985, launched in May 1998, included nine universities. The second phase of Project 985, launched in 2004, expanded the program to 39 universities. All universities under Project 985 were also part of Project 211. Thus, there are 112 officially recognised elite universities among nearly 3,000 colleges and universities in China. In 2020, these elite universities admitted approximately 5.2 percent of the 10.71 million students who attended the college entrance exam. Thus, we define three tiers of higher educational attainment relative to senior high school qualifications: college education, non-elite university education and elite university education.
The 2010 wave of CPFS collected information on the type and tiers of higher education institutions the respondent attended. 5 We match this information to the same individuals in the 2012, 2014, 2016 and 2018 waves of CFPS, which collected information on energy expenditure. Among the final sample employed in this study, 46.36 percent have completed senior high school education, 30.80 percent have obtained a college education, 18.97 percent have a non-elite university qualification and 3.87 percent have an elite university qualification. 6
3.2. Measures of Energy Poverty
We use three objective measures of energy poverty. The first measure of energy poverty is a dichotomous variable indicating whether the respondent’s household spends more than 10 percent of its income on energy (yes = 1; no = 0), following the so-called “10% indicator” or “energy poverty line” that was first employed in the United Kingdom (Boardman 1991). We also employ different thresholds for this indicator since the share of household income spent on energy in China is generally higher than in developed countries (Wang et al. 2015), and threshold indicators have been criticised for being particularly sensitive to the selected cutoff (Hills 2012).
The second indicator is the low-income-high-cost (LIHC) indicator proposed by Hills (2012). The LIHC indicator is a dichotomous variable (yes = 1; no = 0). A household is classified as being in energy poverty if their energy costs are above the median in a particular year in their province and their residual household income per capita is below half of the median household income per capita in a particular year in their province.
The third measure of energy poverty is the double median (2M) indicator, which defines households as being in energy poverty if their equalised energy expenditure to equalised disposable income ratio exceeds twice the province-specific median ratio. Existing studies find that the 10 percent threshold, LIHC and 2M indicators are valid and effective energy poverty measures in China (Cheng et al. 2021a; Lin and Wang 2020).
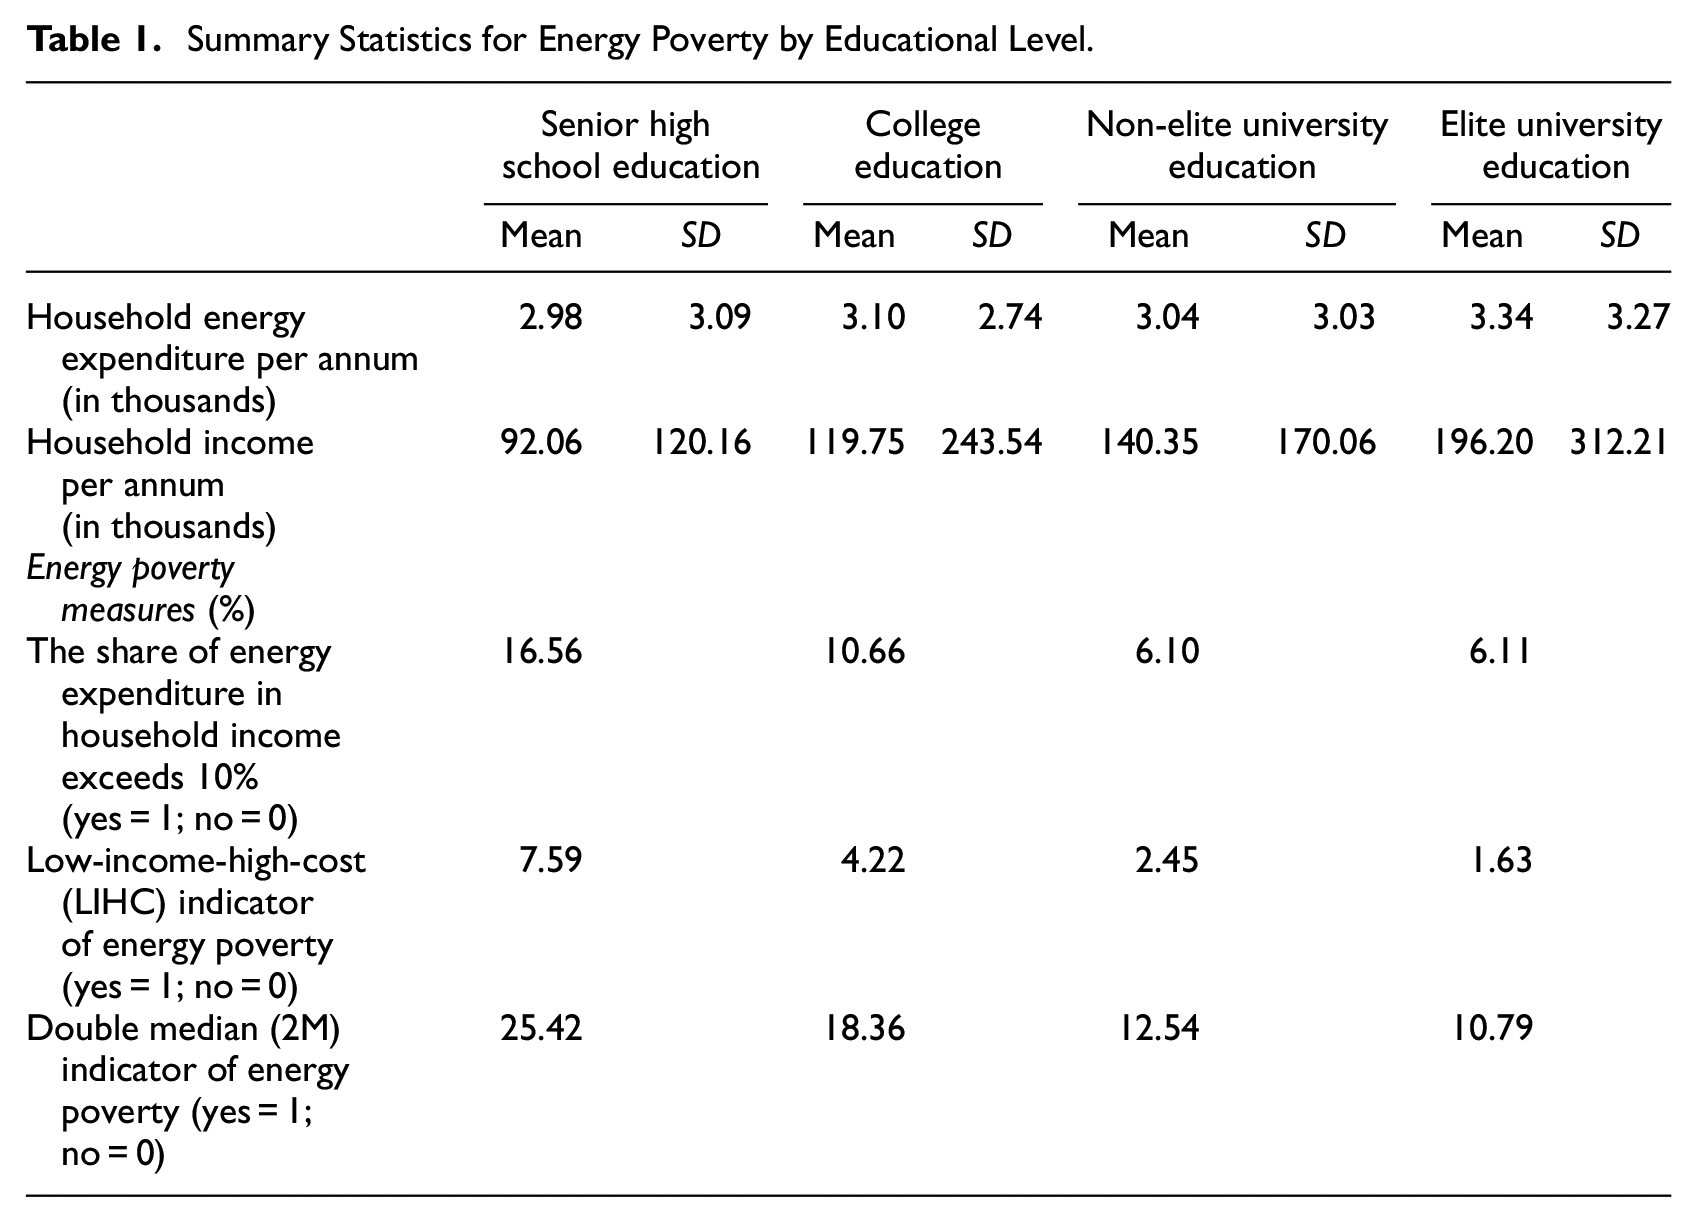
Table 1 shows household income and expenditure on energy by educational status for respondents in CFPS. It also shows the proportion of households in energy poverty by educational status for each of the three energy poverty measures. Overall, there are significant differences in energy expenditure, household income and energy poverty across respondents with different educational levels, while the difference in energy poverty between individuals with non-elite university education and those with elite university education is not significant. 7
Summary Statistics for Energy Poverty by Educational Level.
3.3. Measures of Channels
We test four potential channels between education quality and energy poverty. The first channel is income, which is measured by the natural logarithm of annual personal income. The second potential channel is employment status, which is a dichotomous viable set equal to one if the respondent is employed or self-employed and zero otherwise. The third channel is cognitive/memory function, which is measured on a 5-point scale in response to a question that asks respondents how well they remember important things that occurred within the last week (only a little bit = 1; all of them = 5). The fourth channel is trust, measured on a 10-point scale in response to a question that asks how well the respondent trusts a stranger (lowest = 1; highest = 10).
4. Methods
We estimate the following empirical model:

where EPit denotes whether an individual i is in the state of being in energy poverty, as measured by one of the three energy poverty indicators, in wave t. edui is a categorical variable of higher educational attainment, where the reference group has a senior high school qualification and the other categories include college education, non-elite university and elite university qualifications. Xit is a vector of control variables, consisting of personal, household and regional characteristics that previous studies suggest are correlated with energy poverty (see AppendixTable A1 for a complete list). Of the remaining variables, Pi denotes province fixed effects, δ t indicates wave fixed effects and ε it is an error term.
Since the tiers of highest educational attainment are time-invariant (for the vast majority of respondents), we first use pooled ordinary least squares (OLS) and random effects (RE) estimators to estimate equation (1) to examine the relationship between college, non-elite and elite university education and the probability of being in energy poverty. Since education attainment varies little for the adult population (except for some younger adults), a RE model is preferred because it can provide more stable, efficient and policy-relevant estimates than a fixed effects (FE) model, especially when the selection mechanism in an education system is well-known (Clark and Linzer 2015; Clarke et al. 2015). For example, a body of literature has used a RE model to estimate the effects of human capital, such as educational attainment and language proficiency, which vary little over time, on an individual’s labour market, behavioural and health outcomes (Cheng et al. 2025; Cheng, Wang and Taksa 2021c; Chiswick and Wang 2016; Dustmann and van Soest 2001; Petersen et al. 2013; Wang, Smyth and Cheng 2017; Wang, Cheng and Smyth 2019). Following these studies, we employ a RE model, although we also report OLS estimates for comparison.
Higher educational attainment is not randomly assigned and depends on individual, household and regional factors. Thus, OLS and RE estimates of the coefficient on quality of education may be biased. First, although we have included a full set of control variables to mitigate the potential impacts of omitted variables, unobserved ability may result in an upward bias in the estimated effect of higher education attainment because schooling levels are positively correlated with unobserved ability, which, in our case, is negatively related to the propensity for being in energy poverty. Second, measurement errors, which could occur if education or expenditure on energy is misreported in the survey data, will bias the OLS estimate of higher educational attainment on energy poverty downward. Previous research has shown that respondents in longitudinal surveys like CFPS tend to underestimate their expenditures on energy bill by up to 20 percent (Wilkins and Sun 2010), which can cause a downward bias in OLS estimates. Third, OLS estimates can produce downward biased estimates if individuals with high discount rates choose lower levels of schooling, which provide a higher marginal rate of return (Belzil and Hansen 2002; Card 1999; Lang 1993). Overall, bias due to high discount rates and measurement error is larger than omitted ability bias, biasing OLS estimates of returns to higher education downwards (Fleisher et al. 2004; Heckman and Li 2004). Hence, we expect that the OLS and RE estimates of higher educational attainment will be downward biased.
To address the endogeneity of higher education attainment and downward bias in the OLS and RE estimates, we use an instrumental variable (IV) approach based on the higher education expansion implemented by the Chinese government in 1999. Specifically, we used four IVs in the study. The first three IVs are based on the fact that the higher education expansion has impacted residents with urban and rural hukou (household registration) origins differently (Huang and Zhu 2020). Theoretically, the first cohort affected by the 1999 higher education expansion was born in 1980. Figure 1a shows that those cohorts who held an urban hukou at 12-years-old exhibit an upward trend in the proportion of having a higher education qualification both before, and after, the higher education expansion. Visual inspection of Figure 1a suggests that the slopes of the proportion of urban hukou holders with a higher education qualification are similar for cohorts born before and after 1980. However, higher educational attainment among those with a rural hukou at 12-years-old shows a significant jump following the higher education expansion (i.e., among the cohorts born after 1980). Thus, the exclusion restriction can be satisfied by interacting the type of hukou at age 12 (rural or urban) with three variables that capture the timing of the higher education expansion, which was exogenous to any individual and household circumstances.
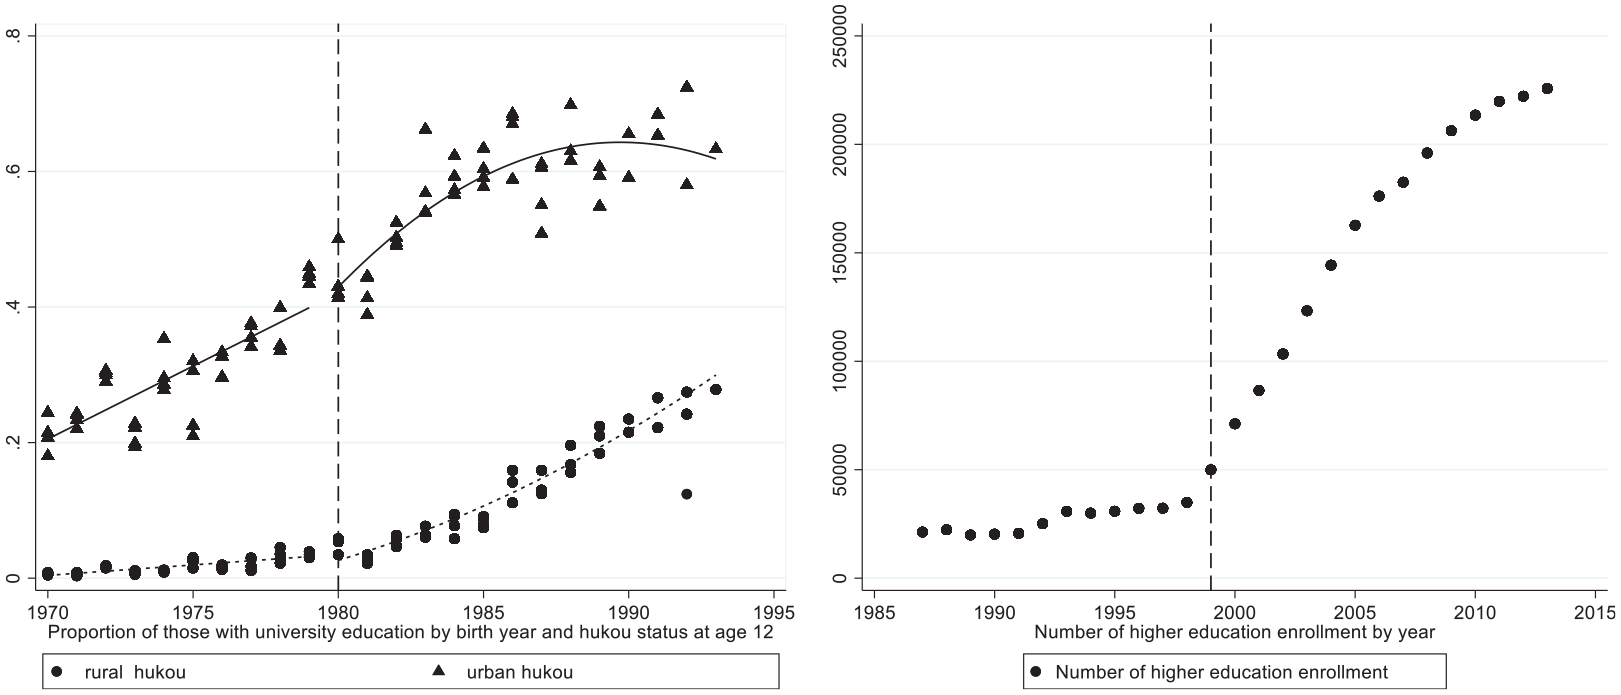
Proportion of individuals with higher education by birth year and hukou status at age 12 and the number of higher education enrolment by year.
The first three IVs that we employ are the interaction between a dummy variable for one’s hukou status at 12-years-old (Hukou12; urban (non-agricultural) hukou = 1; rural (agricultural) hukou = 0) and each of a dummy variable for whether the respondent was born after 1980 (Post1980), a birth year linear trend (Trend) and a post-1980 birth year linear trend (Post1980 × Trend). Specifically, the urban hukou status at 12 (Hukou12) captures the persistent urban-rural gap in higher education attainment before the higher education expansion; the post-1980 birth dummy (Post1980) captures the instantaneous effect of the higher education expansion on those born in and after 1980; the birth year linear trend (Trend) captures the baseline before the higher education expansion; and the post-1980 birth year linear trend (Post1980 × Trend) captures the change in the cohort trend from the baseline before the higher education expansion. In sum, these variables (i.e., Hukou12 × Post; Hukou12 × Trend; Hukou12 × Post × Trend) capture the baseline and heterogeneous effects of the higher education expansion reform on the higher educational attainment of individuals who had an urban or rural hukou as a 12-year-old. A similar set of IVs have been employed in recent studies that use the higher education expansion policy in China as an identification strategy to draw causal inference about the effect of education on a range of economic outcomes (Huang and Zhu 2020; Huang, Tani and Zhu 2021; Wang et al. 2021).
The fourth IV that we employ is the linear trend of higher education enrolments between 1988 and 2013, which is matched to each respondent and province when an individual was 18 years old (i.e., when one is due to graduate from senior high school (or equivalent) to a higher education institution). Figure 1b shows that the number of enrolments in higher education institutions increases significantly after 1998. This IV reflects the availability of higher education options or one’s likelihood of obtaining a higher education qualification. However, the Ministry of Education determines the provincial higher education enrolment quota, which is exogenous to individuals. Thus, it should not directly affect one’s income or likelihood of being in energy poverty at least 3 to 4 years later except through its impact on the propensity for enrolling in a college or university. Other studies also use similar IVs by exploiting the provincial and/or cohort differences in higher education opportunities for eligible cohorts. For example, a few studies use enrolment ratios in a particular stream in a given year and province to instrument for the impact of university education or years of schooling on wages (Chen and Pastore 2021; Cheng, Wang and Taksa, 2021d; Dai and Martins 2020). Another study uses the number of colleges and universities in a province to instrument for the impact of university education on the migration decision (Ding 2021). Compared to these studies relying on the main effect of the supply of higher education opportunities, our suite of IVs is less restrictive since it exploits not only the impact of the exogenous supply of higher education places available at the provincial level across time, but also the cohort- and hukou-specific interactions with the higher education expansion, which can be regarded as a natural experiment. Compared to these studies, which employ only one IV, our identification strategy allows us to test the exogeneity of these IVs because the model is over-identified.
We employ Baron and Kenny (1986) approach to mediation combined with Sobel (1982) mediation test to examine the roles of income, employment status, memory and trust as mechanisms through which higher educational attainment may affect the propensity to be in energy poverty. The mediation analysis quantifies the proportion of the total effect explained by the meditating variables in four steps: first, we examine the effect of higher educational attainment on energy poverty without controlling for the mediator; second, we investigate the effect of higher educational attainment on the mediator; third, we explore the impacts of both higher educational attainment and the mediator on energy poverty; and fourth, we estimate the significance of the mediating effect using the Sobel mediation test. In our analysis, asymmetric confidence intervals for the mediating effect are estimated through bootstrapping, a more accurate method than the conventional theory of confidence limits (Nadkarni et al. 2011).
5. Results
The OLS and RE results in Panel A of Table 2 show that those who attended colleges, non-elite universities and elite universities are 2.7 to 5.3 percentage points less likely to spend greater than 10 percent of their income on energy, compared to senior high school graduates. 8 The RE-IV results, which address the endogeneity of education, show that those who hold an elite university qualification are 46 percent less likely to spend greater than 10 percent of their income on energy compared to senior high school graduates, which is 21 and 25 percentage points higher than those with college education and non-elite university education, respectively. Our results suggest that OLS and RE underestimate the effects of high education on reducing the probability of being in energy poverty. 9
Higher Education and Energy Poverty.
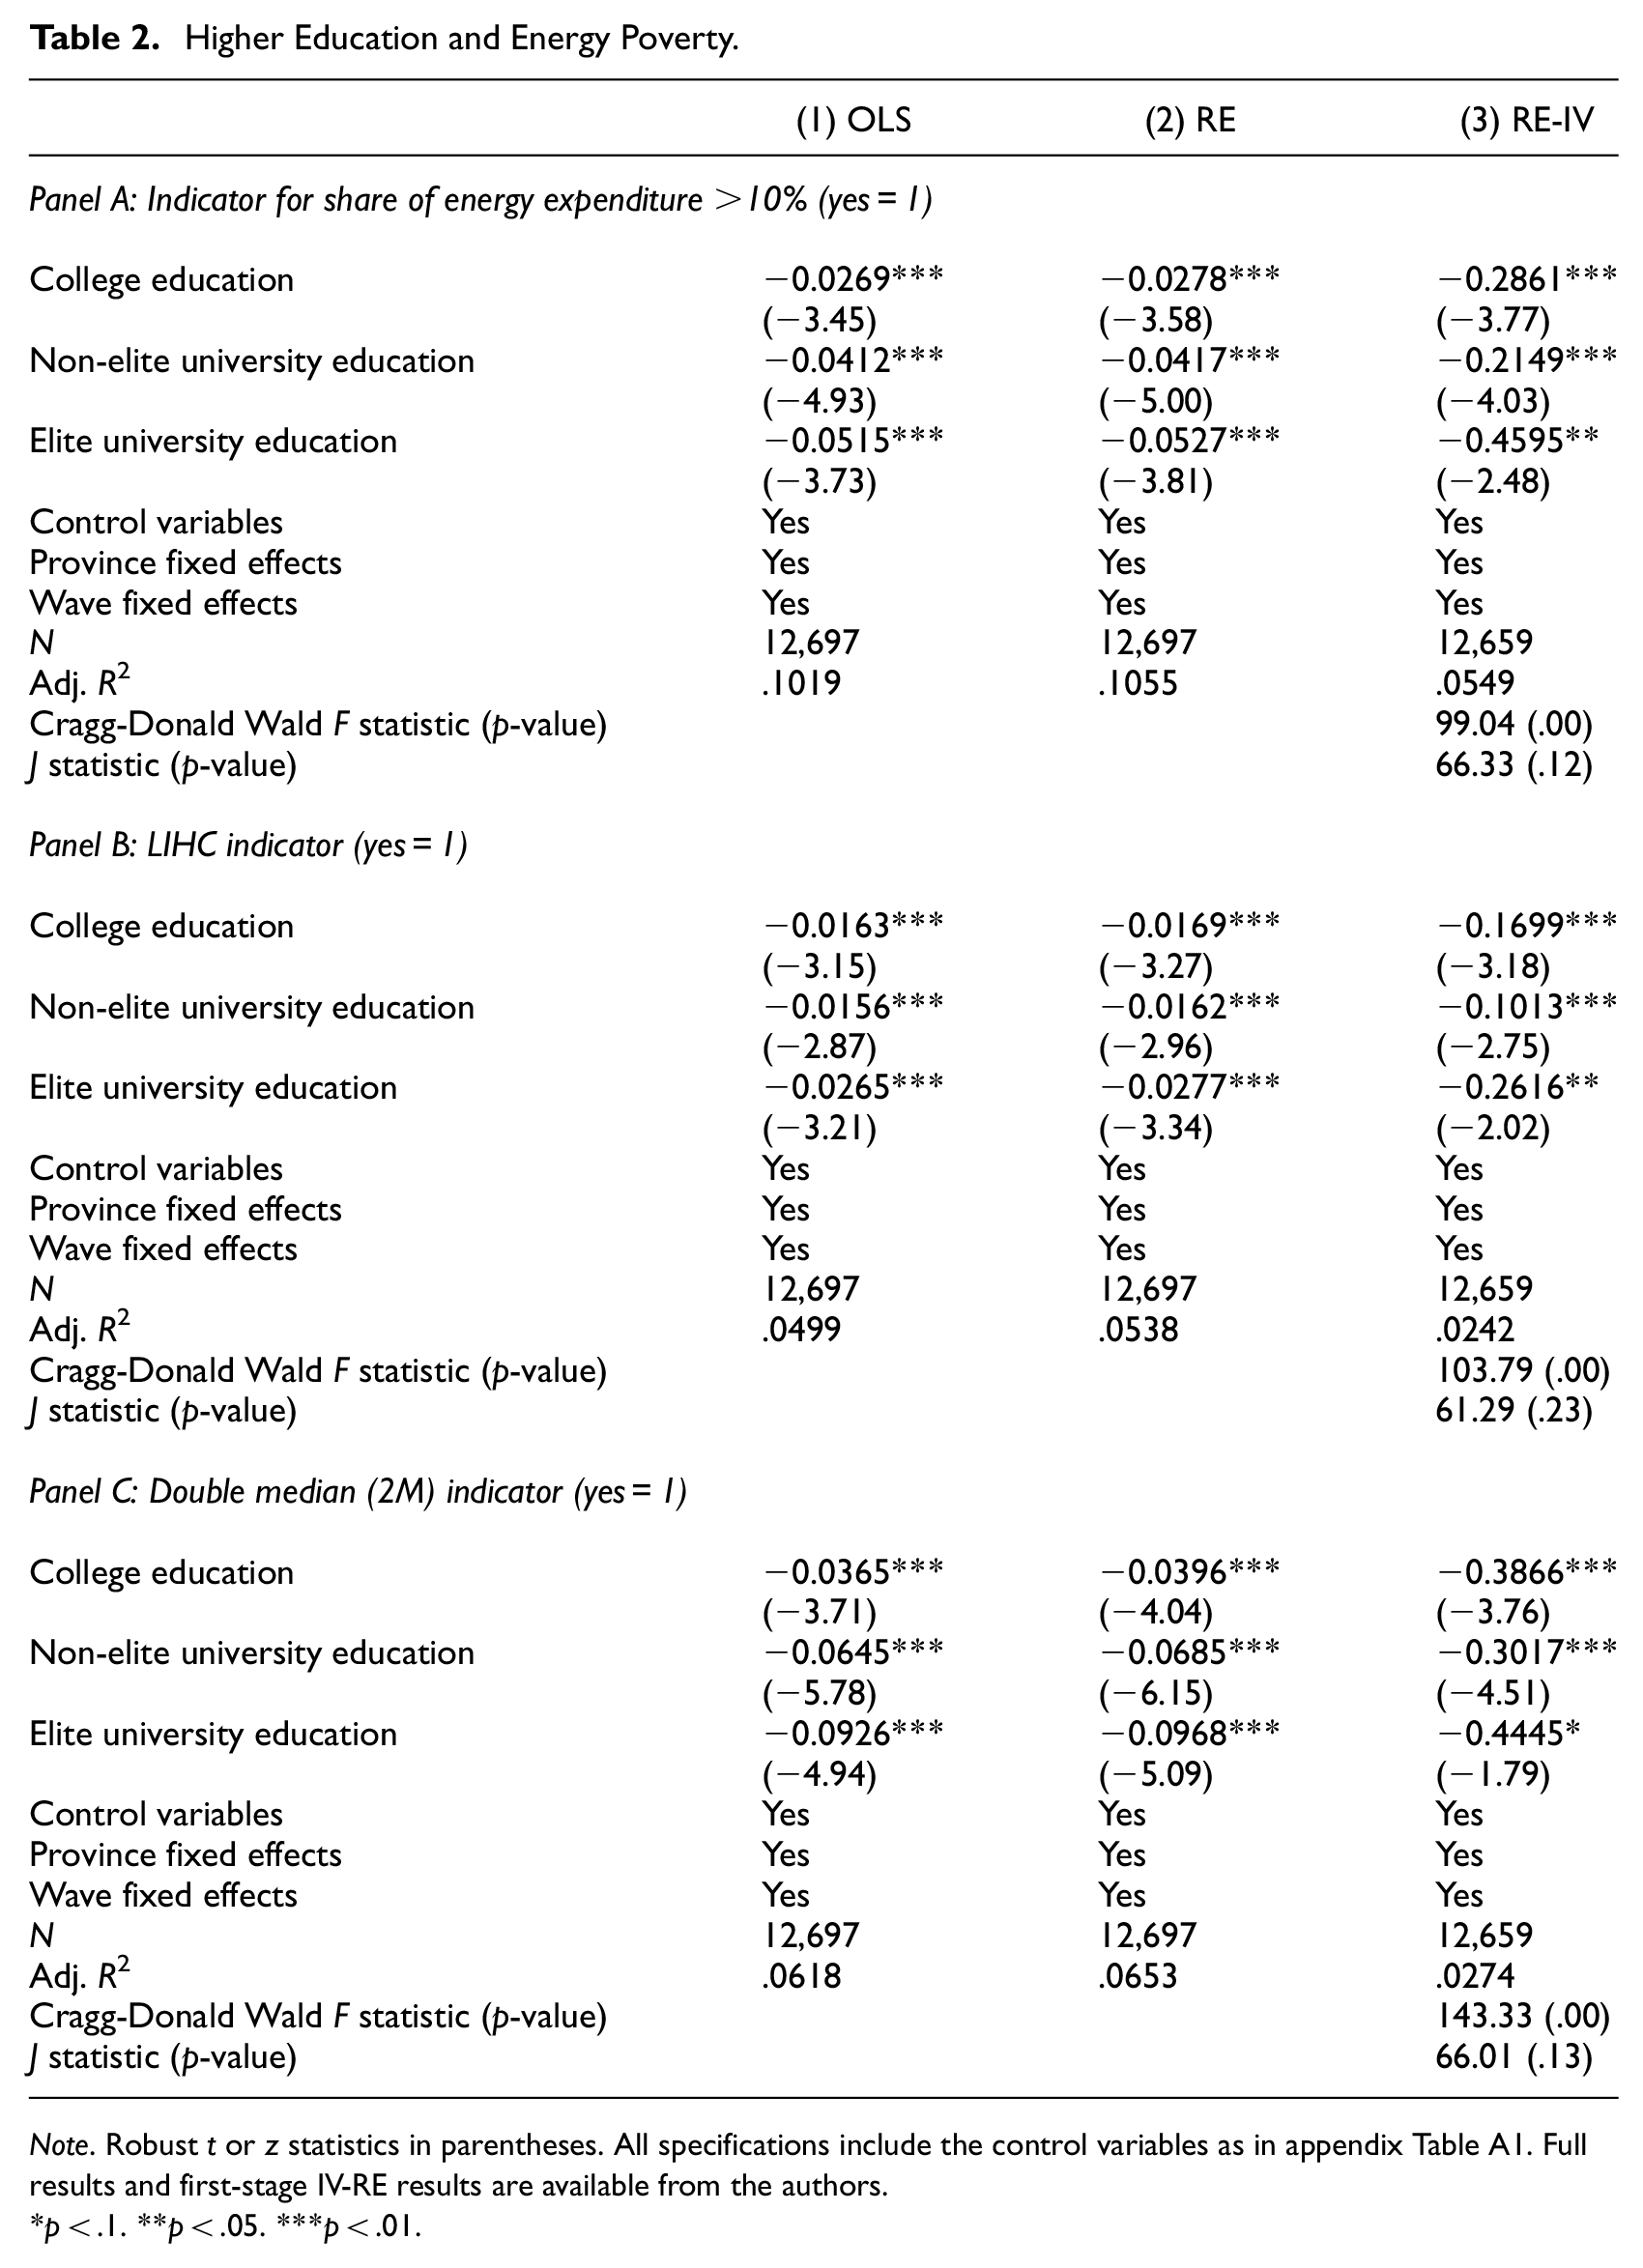
Note. Robust t or z statistics in parentheses. All specifications include the control variables as in appendixTable A1. Full results and first-stage IV-RE results are available from the authors.
p < .1. **p < .05. ***p < .01.
The OLS and RE results in Panel B show that, compared to senior high school graduates, those who attended college, a non-elite university or an elite university are 1.7 to 2.8 percentage points less likely to be in energy poverty measured by LIHC. The RE-IV results show that those who hold an elite university qualification are 26 percent less likely to be in energy poverty, where energy poverty is defined in terms of the LIHC measure, compared to senior high school graduates.
The OLS and RE results in Panel C show that, relative to having a senior high school qualification, those who attended colleges, non-elite universities and elite universities are 3.9, 6.9 and 9.7 percent less likely to be in energy poverty measured by the 2M indicator. The RE-IV estimates suggest that obtaining an elite university qualification could reduce one’s likelihood of being in energy poverty by 44.5 percentage points.
We test four potential channels or mechanisms through which higher education, relative to senior high school education, affects one’s probability of being in energy poverty among subsamples of respondents with college, non-elite university and elite university education. To do so, we define energy poverty using the 10 percent indicator. For each subsample in each panel of Table 3, we present the direct effect of higher educational attainment on the propensity for being in energy poverty, the effect of higher educational attainment on the mediator and the combined effects of higher educational attainment and the mediator on the propensity for being in energy poverty. We also calculate the proportion of the indirect effects for each channel.
Channel Analysis—Indicator for Share of Energy Expenditure >10%.
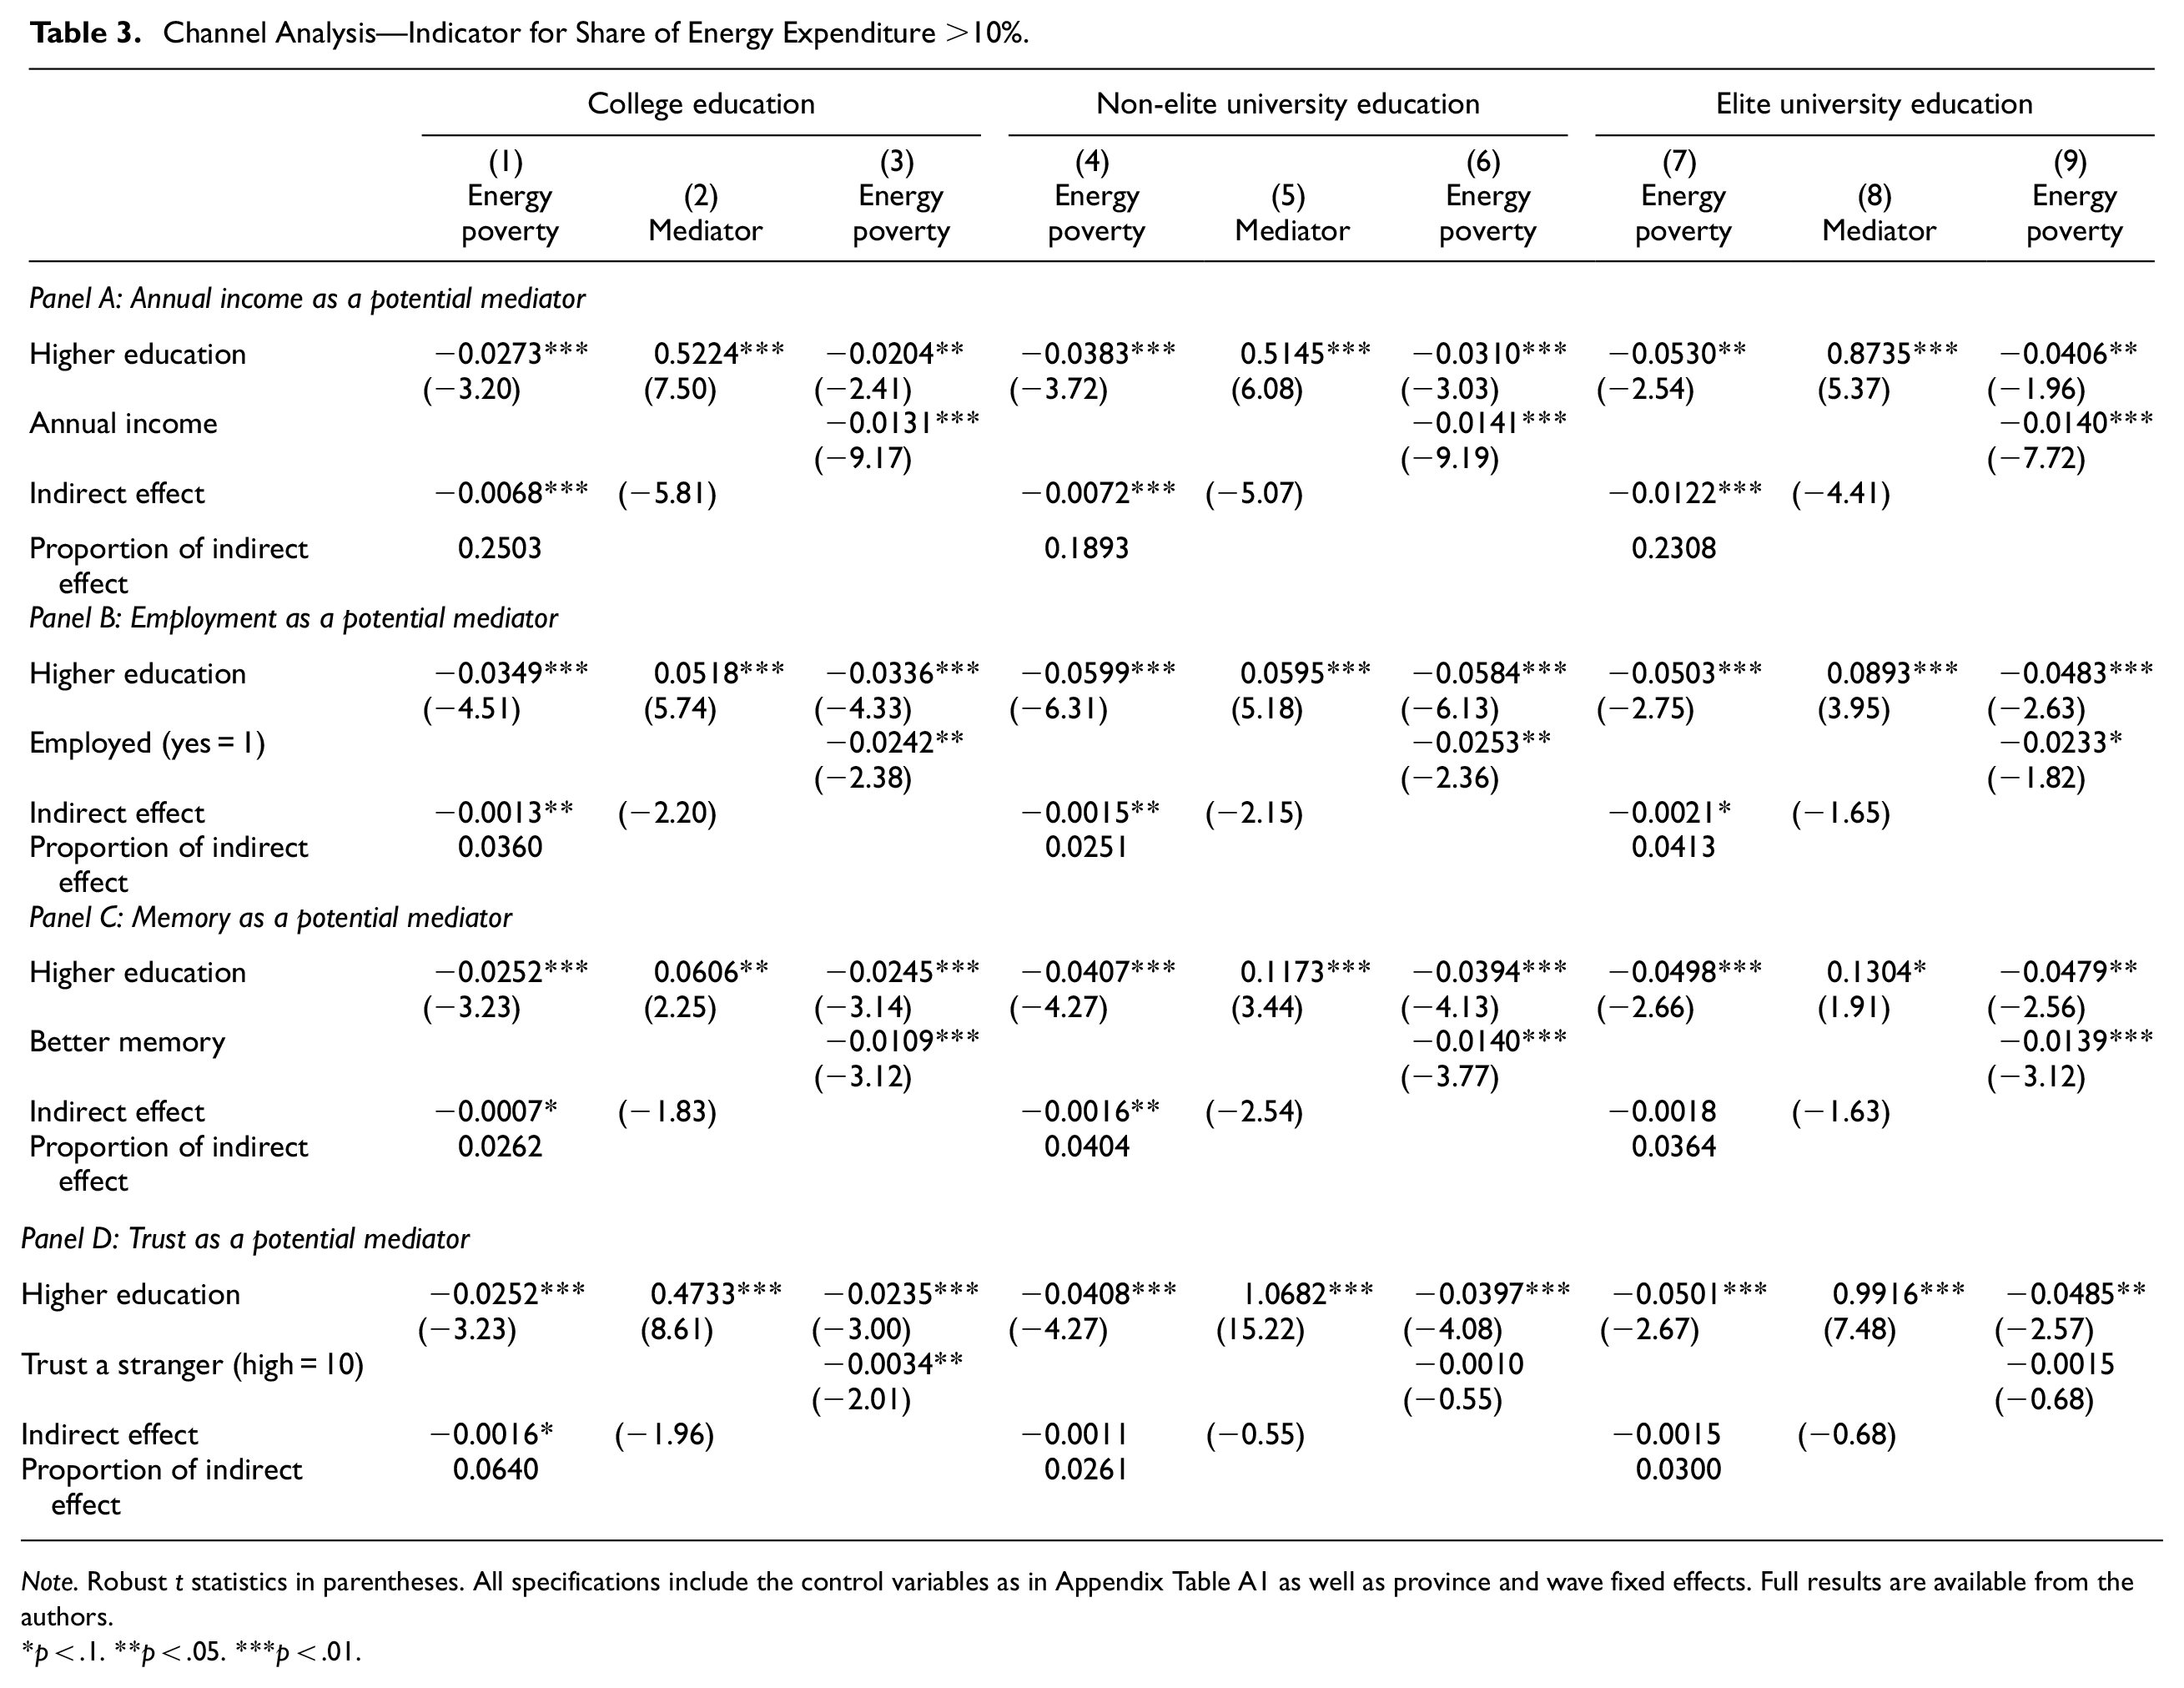
Note. Robust t statistics in parentheses. All specifications include the control variables as in AppendixTable A1 as well as province and wave fixed effects. Full results are available from the authors.
p < .1. **p < .05. ***p < .01.
Table 3 suggests that employment, income, cognitive function and trust are channels through which educational attainment is related to the likelihood of being in energy poverty. Specifically, educational attainment increases employment probability, income, cognitive function and trust. Higher levels of employment, income, cognitive function and trust are associated with a lower probability of being in energy poverty.
When higher educational attainment and each of the mediators are included in individual models, they are both statistically significant. A Sobel test of the significance of the mediating effect confirms the existence of mediation via annual income (19–25 percent of the mediating effect) and employment (2.5–4.1 percent of the mediating effect) across all tiers of higher education, via memory (2.6–4.0 percent) among those with college and non-elite university education and via trust (6.4 percent) among those with college education.
6. Back of the Envelope Calculations
We provide some back of the envelope calculations on the potential social welfare implications of the higher education expansion policy in terms of energy poverty reduction based on the RE estimates reported in Table 2. Figure A1 shows that the higher education enrolment remained relatively stable before 1999, with the annual enrolment growth rate being 7.47 percent, while there was a sharp increase in the number of enrolments in higher education institutions after the implementation of the expansion policy, increasing from 16 to 967 million between 1999 and 2020.
First, we simply assume that the higher education enrolment trend remains at the same low level as the previous period after 1999; that is, enrollment increases 7.47 percent annually, and then estimate the difference between the predicted and actual number of higher education enrolments between 1999 and 2020. We find that the enrolment gap (Gap) widened from 4.3 million in 1999 to 43.9 million in 2020.
Second, we further assume that the structure of higher education enrolment (Structure) remains unchanged over time; namely, college, non-elite and elite university education account for 57.42, 35.37 and 7.21 percent of higher education, respectively, based on the CFPS. We use the following equation to calculate the number of people that could be lifted out of energy poverty by the higher education expansion policy:
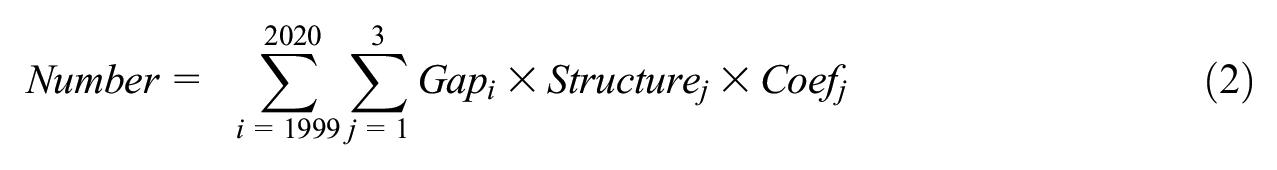
where subscript i denotes the year and j denotes the tier of higher education. Number is the total number of people that could be lifted out of energy poverty by the expansion policy between 1999 and 2020. Gapi is the difference between the predicted and actual number of higher education enrolments for each year. Structurej is the proportion of individuals who obtained college, non-elite and elite university education among those with a higher education qualification. Coefi is the estimated coefficients for different tiers of universities.
We find that the 1999 higher education expansion could lift 12 to 38 million population out of energy poverty measured by the three energy poverty indicators, which is comparable to the amount of Europeans who were unable to keep their homes adequately warm in 2018 (Rodriguez-Alvarez, Llorca and Jamasb 2021).
7. Robustness Checks
We conduct a number of sensitivity checks to examine the robustness of our results. The 10 percent threshold has been criticised for being sensitive to the cutoff. In the first check, we examine the sensitivity of our results in Panel A of Table 2 to a range of other thresholds. Table A2 shows that, relative to having a senior high school qualification, those who attended colleges, non-elite universities and elite universities are less likely to be in energy poverty across the 5, 15, 20 and 30 percent thresholds.
One may be worried that respondents who turned 18 years old between 1995 and 1998 could retake the national university entrance exam after the implementation of the 1999 higher education expansion. In the second check, we drop respondents who turned 18 between 1995 and 1998 and rerun the models. The results in Table A3 are consistent with those in Table 2.
Our sample in the main results is restricted to individuals born in 1970 or later. Given that some people take the college entrance examination at an older age, we relax the restrictions (the birth time of the individual) on sample screening. Specifically, we extend our sample to individuals born in 1965 or later and individuals born in 1960 or later and then re-examine the impact of higher education on energy poverty. The results, which are reported in Table A4, are consistent with our main findings reported in Table 2.
In the baseline results, we exclude respondents who did not complete senior high school and use those who completed senior high school as the reference group. We conduct a robust check on whether our findings differ if the analytical sample includes those who did not complete senior higher school. The results in Table A5 are consistent with those in Table 2.
A heterogeneous earnings premium to university education exists across cohorts in China (Hu and Bollinger 2021). To address this, we further control for birth year fixed effects to take into account cohort-specific effects, such as the impacts of cohort size and other shocks common to a cohort or, in a more demanding form, control for the interaction between the birth province and cohort-specific fixed effects to take into account the potential impacts of province-specific cohort differences on energy poverty. The results in Table A6 are consistent with the baseline results.
Given that we match the respondents’ individual-level educational attainment with their household energy expenditure and income, some individuals within the same family may have different education qualifications, but have the same energy poverty status. Therefore, our matching method may give rise to a concern that multiple observations from the same family may bias our estimates. To circumvent this problem, we keep the first observation for each individual and re-estimate model 1 in Table 2. The OLS estimates, reported in Table A7, are qualitatively consistent with our baseline estimates reported in Table 2.
While China is fully electrified, a large share of the population still does not use modern forms of energy for cooking and, thus, can be considered to be energy poor. Next, we use the multidimensional energy poverty indicator proposed by Zhang, Li and Han (2019), in which a household is defined as being in energy poverty if it spends more than 10 percent of its income on energy consumption or uses solid fuel for cooking. The results in Table A8 are consistent with the baseline results.
Earlier, we suggested that the downward bias in the OLS estimates was likely due to measurement error and that bias due to unobserved heterogeneity was unlikely to be important. In Table A9 we employ the bounding approach proposed by Oster (2019) to check whether, and to what extent, the OLS results are biased by unobserved heterogeneity. Columns 1–3 report the estimated effects of higher education quality with no control variables, a full set of control variables listed in Table A1, and both a full set of control variables and unobservables, respectively. The results from columns 1 to 3 suggest that the inclusion of a full set of controls and unobserved characteristics moves the coefficients on higher education towards zero, except for the coefficient on college education in panel C. Nonetheless, the bias-adjusted effects in column 3 still have the same sign as the estimated effects with control variables. Our results meet the robustness standards suggested in Oster (2019) because the bounds of the set
In our main analysis, we have controlled for province fixed effects to capture the influence of province-specific heterogeneity on energy poverty status. To mitigate the potential impacts of omitted variables, we further control for the county and community fixed effects in our specifications. The results in Table A10 are very close to the RE estimates in Table 2, which is in line with the results from Oster (2019) test reported in Table A9 and provides supportive evidence that unobservables are unlikely to be driving our main results.
In Table 3, we used the 10 percent indicator for the mediation analysis. As an alternative, use a relative indicator of energy poverty, namely, 2M, to re-examine the mediating roles of income, employment status, memory and trust. The results in Table A11 are qualitatively consistent with those reported in Table 3.
As the measures of cognitive function and social trust are self-reported, one may be concerned about the presence of misclassification bias associated with self-reported data (Rosenman, Tennekoon and Hill 2011). To attenuate the risks of over-reporting or under-reporting of the respondents’ cognitive function and social trust, following the approach in the previous literature (Wang and Cheng 2022; Wang, Cheng and Smyth 2019), we recode these two measures as dummy variables equal to one if they can remember most, or all, of the important things that occurred within the last week or rate their level of social trust as being larger than the median scores at the provincial level, and zero otherwise, respectively. In Table A12, we re-examine the mediating roles of cognitive function and trust between higher educational attainment and the likelihood of being in energy poverty using this reclassification. The results in panel A in Table A12 show that the magnitudes and significance of the mediating effect of cognitive function are very close to those reported in panel C in Table 3. However, in panel B in Table A12, the Sobel test results suggest that social trust as a mediator becomes significantly negative among those with non-elite and elite university education and explains approximately 7.5 percent of the total effect.
8. Conclusion
We have provided the first causal estimates of the effect of education on the likelihood of being in energy poverty using a household panel dataset. We have also provided the first estimates of the effect of education quality on the proclivity to be in energy poverty and identified the channels through which education is related to the likelihood of being in energy poverty. We find that the OLS and RE estimates are biased downwards due to measurement error and that higher education causes a significant reduction in the likelihood of being in energy poverty across a suite of widely used measures of energy poverty. We find that education quality matters with the point estimates for those with elite university education, relative to those with senior high school education, consistently being higher than the point estimates for those who attended a non-elite university or college. We find that income, employment status, cognitive ability and generalised trust are all channels through which education is related to the likelihood of being in energy poverty.
Our study has some important policy implications for reducing the incidence of energy poverty. The first is increasing public investment in education, especially for disadvantaged left-behind children of rural-urban migrant parents and rural-urban migrant children who do not have equal access to the urban education system, in order to increase their chances of completing high school and advancing to university education (Wang, Cheng and Smyth 2018). There are sizeable disparities in education resources between rural and urban areas and between local and migrant children that limit opportunities for disadvantaged students to attend elite universities or any universities. Most students at elite universities are from advantaged backgrounds. While disadvantaged students can access financial aid, such as student loans and scholarships at colleges and universities (Yang 2010), the main barriers are not at the point of university admission but before students matriculate into senior high schools (Wang et al. 2011). This reflects that higher income parents have more resources to invest in private tutoring and purchase housing in catchment areas of good schools. Even after the higher education expansion program in China, rural students from poor counties were seven and 11 times less likely than urban students to access any university and the elite Project 211 universities, respectively (Li et al. 2015). The marginal returns to education for reducing the incidence of energy poverty are likely to be the highest for precisely this demographic. This suggests that the Chinese government should consider extending the current nine-year free compulsory education to at least 12 years of free education in order to reduce the financial burden that is placed on disadvantaged households (Cheng and Smyth 2021).
Elite universities in China, by their very nature, can only admit a small proportion of the population. Other pathways potentially exist to provide Chinese students with an elite education, such as sponsoring students to study abroad. More than 1 million self- and state-funded Chinese students study at elite universities in other countries, such as the United States, Australia, the United Kingdom, Japan and Canada (UNESCO Institute for Statistics 2021). Nurturing a sense of obligation to save energy among young people has proved to be an effective strategy for promoting energy-saving behaviour (Tan, Ooi and Goh 2017; Xu, Hwang and Lu 2021). Another avenue for strengthening the link between education and reducing the incidence of energy poverty would be introducing energy conservation programs into school, college and university curriculums.
There are several avenues for future research. First, future studies could consider the differential effects of majors on energy poverty, either in China or elsewhere. Second, changes in education policies have been used to identify the effects of education on other outcomes, such as health, in other countries (see e.g., Hamad et al. 2018). It would be interesting to use the same identification strategy to examine the effect of education on energy poverty in other countries. Third, one of the limitations of our research is that some of our channels are self-reported. Future research could use experimental methods either in the lab or field to better examine the role of channels such as cognition and trust in linking education to better education outcomes.
Supplemental Material
sj-docx-1-enj-10.1177_01956574251330238 – Supplemental material for Education Quality and Energy Poverty: Evidence from Chinese Elite Universities
Supplemental material, sj-docx-1-enj-10.1177_01956574251330238 for Education Quality and Energy Poverty: Evidence from Chinese Elite Universities by Haining Wang, Zhiming Cheng and Russell Smyth in The Energy Journal
Footnotes
Appendix
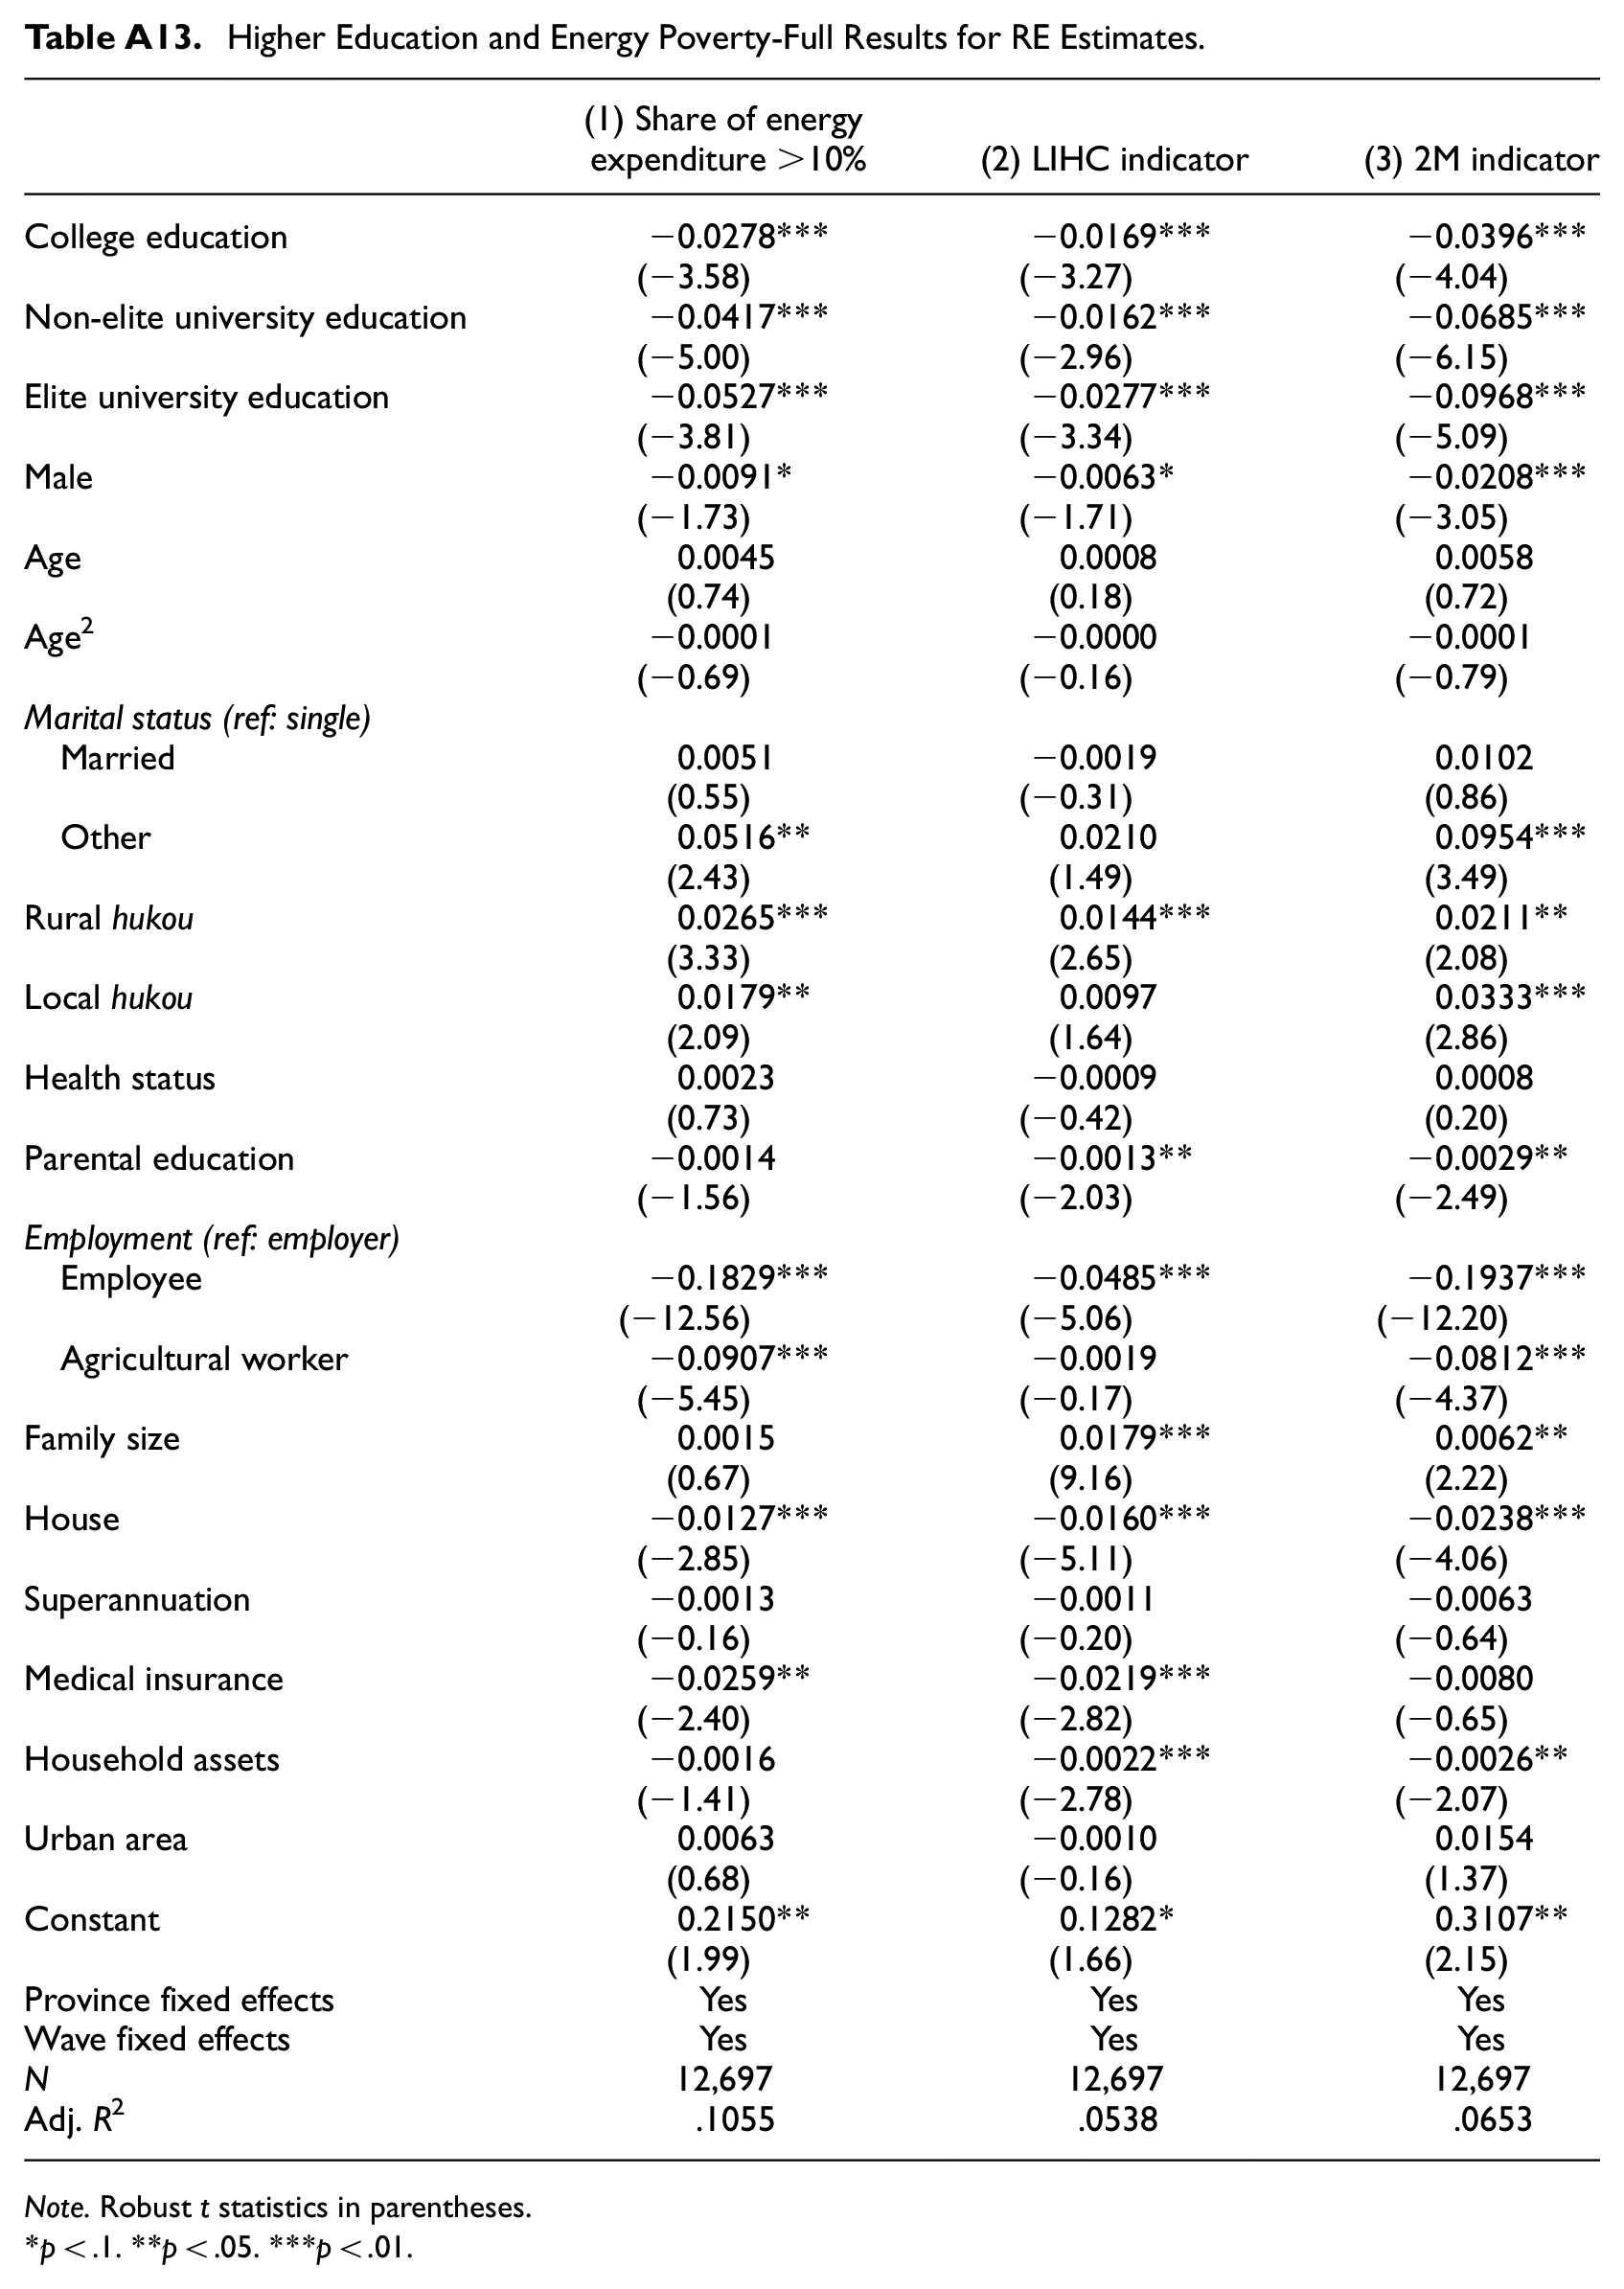
Higher Education and Energy Poverty-Full Results for RE Estimates.
| (1) Share of energy expenditure >10% | (2) LIHC indicator | (3) 2M indicator | |
|---|---|---|---|
| College education | −0.0278*** | −0.0169*** | −0.0396*** |
| (−3.58) | (−3.27) | (−4.04) | |
| Non-elite university education | −0.0417*** | −0.0162*** | −0.0685*** |
| (−5.00) | (−2.96) | (−6.15) | |
| Elite university education | −0.0527*** | −0.0277*** | −0.0968*** |
| (−3.81) | (−3.34) | (−5.09) | |
| Male | −0.0091* | −0.0063* | −0.0208*** |
| (−1.73) | (−1.71) | (−3.05) | |
| Age | 0.0045 | 0.0008 | 0.0058 |
| (0.74) | (0.18) | (0.72) | |
| Age2 | −0.0001 | −0.0000 | −0.0001 |
| (−0.69) | (−0.16) | (−0.79) | |
| Marital status (ref: single) | |||
| Married | 0.0051 | −0.0019 | 0.0102 |
| (0.55) | (−0.31) | (0.86) | |
| Other | 0.0516** | 0.0210 | 0.0954*** |
| (2.43) | (1.49) | (3.49) | |
| Rural hukou | 0.0265*** | 0.0144*** | 0.0211** |
| (3.33) | (2.65) | (2.08) | |
| Local hukou | 0.0179** | 0.0097 | 0.0333*** |
| (2.09) | (1.64) | (2.86) | |
| Health status | 0.0023 | −0.0009 | 0.0008 |
| (0.73) | (−0.42) | (0.20) | |
| Parental education | −0.0014 | −0.0013** | −0.0029** |
| (−1.56) | (−2.03) | (−2.49) | |
| Employment (ref: employer) | |||
| Employee | −0.1829*** | −0.0485*** | −0.1937*** |
| (−12.56) | (−5.06) | (−12.20) | |
| Agricultural worker | −0.0907*** | −0.0019 | −0.0812*** |
| (−5.45) | (−0.17) | (−4.37) | |
| Family size | 0.0015 | 0.0179*** | 0.0062** |
| (0.67) | (9.16) | (2.22) | |
| House | −0.0127*** | −0.0160*** | −0.0238*** |
| (−2.85) | (−5.11) | (−4.06) | |
| Superannuation | −0.0013 | −0.0011 | −0.0063 |
| (−0.16) | (−0.20) | (−0.64) | |
| Medical insurance | −0.0259** | −0.0219*** | −0.0080 |
| (−2.40) | (−2.82) | (−0.65) | |
| Household assets | −0.0016 | −0.0022*** | −0.0026** |
| (−1.41) | (−2.78) | (−2.07) | |
| Urban area | 0.0063 | −0.0010 | 0.0154 |
| (0.68) | (−0.16) | (1.37) | |
| Constant | 0.2150** | 0.1282* | 0.3107** |
| (1.99) | (1.66) | (2.15) | |
| Province fixed effects | Yes | Yes | Yes |
| Wave fixed effects | Yes | Yes | Yes |
| N | 12,697 | 12,697 | 12,697 |
| Adj. R2 | .1055 | .0538 | .0653 |
Note. Robust t statistics in parentheses.
p < .1. **p < .05. ***p < .01.
Acknowledgements
The authors thank David C. Broadstock (editor) and the three referees for their helpful comments on earlier versions of the paper and Yao Yao for a helpful discussion about the energy pricing system in China.
Declaration of Conflicting Interests
The author(s) declared no potential conflicts of interest with respect to the research, authorship, and/or publication of this article.
Funding
The author(s) disclosed receipt of the following financial support for the research, authorship, and/or publication of this article: Zhiming Cheng acknowledges support from the University of New South Wales Scientia Program (Grant Number: PS45957) and Macquarie University Research Acceleration Scheme (Grant Number: 173988730). Haining Wang acknowledges support from the National Social Science Fund of China (Grant Number: 20BGL236).
Supplemental Material
Supplemental material for this article is available online.
1
On the differences between energy poverty and income poverty see Charlier and Legendre (2019) and ![]() .
.
2
The information about household energy expenditure is not available in the 2010 wave.
4
While the Cultural Revolution formally concluded with the arrest of the Gang of Four in 1976, the worst excesses and violence occurred between 1966 and 1968. Several scholars of Chinese politics treat the Cultural Revolution as concluding with the suppression of mass factions in the autumn of 1968 or slightly later in 1970 (Unger, 2007).
5
We treat Project 211 universities as elite universities. Ideally, as a check on our results, we would have preferred to have also used Project 985 universities as a narrower definition of elite universities, but CFPS does not allow us to separate out whether respondents attended a Project 985 university.
6
The relevant degree is where respondents received their undergraduate degree. Less than 2 percent of respondents have a master’s or PhD degree and the results are qualitatively the same if we exclude them.
7
The results for the Kwallis chi-squared test are available from the authors.
8
The full results for RE estimates in Panels A to C are presented in appendix ![]() . One may be interested in understanding the degree to which education affects the prevalence of energy poverty, in other words, the magnitude of its effect. For instance, the results in column (1) of Table A13 indicate that the impacts of possessing a college education, a non-elite university education, or an elite university education are 3.05 to 5.79 times greater than being male and 1.07 to 2.03 times greater than having medical insurance. In contrast, these educational factors are only 0.15 to 0.29 times that of being an employee and 0.31 to 0.58 times that of being an agricultural worker.
. One may be interested in understanding the degree to which education affects the prevalence of energy poverty, in other words, the magnitude of its effect. For instance, the results in column (1) of Table A13 indicate that the impacts of possessing a college education, a non-elite university education, or an elite university education are 3.05 to 5.79 times greater than being male and 1.07 to 2.03 times greater than having medical insurance. In contrast, these educational factors are only 0.15 to 0.29 times that of being an employee and 0.31 to 0.58 times that of being an agricultural worker.
9
In the RE-IV models in Panels A to C in ![]() , the first stage F statistic for the test of weak instruments ranges from 99 to 143 and the p-values of the J statistic for the test of overidentifying restriction are not statistically significant at the 5 percent level. These tests suggest that the IVs are strong and valid.
, the first stage F statistic for the test of weak instruments ranges from 99 to 143 and the p-values of the J statistic for the test of overidentifying restriction are not statistically significant at the 5 percent level. These tests suggest that the IVs are strong and valid.
References
Supplementary Material
Please find the following supplemental material available below.
For Open Access articles published under a Creative Commons License, all supplemental material carries the same license as the article it is associated with.
For non-Open Access articles published, all supplemental material carries a non-exclusive license, and permission requests for re-use of supplemental material or any part of supplemental material shall be sent directly to the copyright owner as specified in the copyright notice associated with the article.