
Abstract
In numerous countries, electricity Distribution System Operators (DSOs) function as local monopolies. To counter potential abuse of monopoly power, regulators, especially in Europe, often employ mechanisms like DSO-specific revenue caps to encourage cost reductions among regulated DSOs. Despite its widespread use, literature concerning ex-post evaluation of the effectiveness of revenue cap regulation, particularly divided into its individual components, is lacking. This paper offers two contributions: First, it shows the advantages of utilizing a semi-parametric panel data StoNED framework methodology as a tool for assessing the impact of revenue caps by evaluating the cost efficiency of regulated DSOs in its individual components. Second, the effectiveness of revenue cap regulation is assessed using the Danish DSOs as a case study. The empirical analysis finds evidence that part of the revenue cap incentive scheme appears to promote cost reductions among regulated Danish DSOs.
Keywords
1. Introduction
Following the decoupling of energy supply chains in the 1990s and early 2000s, particularly in Europe and the US, electricity Distribution System Operators (DSOs) often emerged as local natural monopolies. The decoupling itself has garnered significant attention since Joskow and Schmalensee (1983) provided an early framework for deregulation and decoupling mechanisms. Hogan (1993, 1998, 2002) expanded on Joskow and Schmalensee’s (1983) work by proposing a detailed model for market segmentation and decoupling into competitive and non-competitive sectors, wherein distribution networks were identified as a sector that would remain as local natural monopolies. The adverse consequences of the remaining non-competitive sectors of the supply chain were then to be offset by economic regulation. In a later paper, Joskow (1997) examined the structure of the US energy sector subject to decoupling, while Hogan (2002) and Joskow (1996, 2008a) examined decoupling worldwide, including Europe, South America, Asia, and Oceania.
After the decoupling, various regulatory mechanisms have been proposed to address the challenges associated with the electricity distribution monopolies, particularly in mitigating monopolistic rent-seeking behavior that disadvantages consumers. These initiatives are often influenced by papers such as Shleifer (1985), who introduced the concept of incentive regulation through yardstick competition. Shleifer (1985) presents the method of yardstick competition through the means of economic benchmarking, by comparing costs of comparable companies to establish efficient cost levels and thus improvement potentials for lesser efficient companies. In Europe, regulation typically takes the form of revenue caps or price caps, with revenue caps being the more prevalent of the two. These mechanisms set limits on the revenue DSOs can earn or the prices they can charge consumers, often incorporating incentivizing components that align with the principles of yardstick competition (see e.g., CEER 2023 for further insights into contemporary incentive regulation in Europe).
Extensive research has examined the structure of these incentive schemes in great detail: Crew and Kleindorfer (1996), Jamasb and Pollitt (2000), Yatchew (2001), Vogelsang (2002), Filippini, Hrovatin and Zoric (2004), Pollitt (2005), Joskow (2006, 2008b, 2014), Lantz (2008), Haney and Pollitt (2009), Bogetoft and Agrell (2017), Campbell (2018), Kuosmanen and Nguyen (2020), and Kuosmanen and Johnson (2021) have detailed various types of incentive regulation, including revenue caps and price caps, describing both methods and challenges. In particular, Kuosmanen and Johnson (2021) provide a detailed overview of the revenue cap framework prevalent across much of Northern Europe. At its core, the revenue cap represents an estimate of the acceptable revenue that regulators allow each DSO to earn over a defined period, with regulators adjusting the cap to incentivize specific behaviors from the DSOs. A commonly integrated incentivizing element of the revenue cap specification is an efficiency component. This component is intended to encourage continuous ongoing cost reductions among DSOs in the absence of competitive pressure. This is achieved by gradually reducing the acceptable revenue, indirectly pushing DSOs to lower their costs over time.
While revenue and price caps may appear conceptually straightforward, their implementation is notably complex, and poorly designed regulation can have significant negative consequences for both DSOs and consumers. For example, the efficiency component often includes multiple elements, each intended to encourage specific types of cost reductions adding to its complexity. As a consequence, regulators must carefully consider interactions between these components and address the substantial demands for data collection and analysis required to enforce these measures effectively.
Similar insights have been presented as early as Shleifer (1985), and later by Hogan (2002) and Joskow (2006, 2008a, 2008b), who highlight the potential ramifications of poorly implemented incentive regulation. Joskow (2006, 2008a) specifically addressed the challenges posed by information asymmetry between regulators and the regulated companies, highlighting the possibility of regulatory gaming, wherein regulated entities exploit poorly designed frameworks for their own benefit, a sentiment also put forth by Filippini and Wild (2001). Joskow (2008b) further elaborated on the difficulty regulators face in accurately predicting industry behavior, which complicates the design of effective incentive schemes. In an updated discussion, Joskow (2014) continued by highlighting ongoing challenges, particularly in quantifying the improvement potential within the regulated industry.
The choice between price caps and revenue caps has also faced scrutiny, particularly following Crew and Kleindorfer’s (1996) early critique. Crew and Kleindorfer argued that revenue cap regulation could, paradoxically, push prices even higher than the monopolistic levels that might arise in an unregulated market. Lantz (2008) argued that although the drawbacks of revenue caps discussed by Crew and Kleindorfer apply only under certain conditions, revenue caps generally offer weaker incentives than price caps, an opinion shared by Jamison (2007). Campbell (2018) contributed to this debate by concluding that revenue caps may be less effective than price caps in achieving price reductions, especially where information asymmetry exists between regulators and the entities they oversee.
A more recent study by Kuosmanen and Nguyen (2020), focusing on revenue regulation in Northern Europe, suggested that while revenue caps may not achieve outcomes as efficient as a fully competitive market, some regulation is still better than no regulation. However, Kuosmanen and Nguyen (2020) also noted potential incentive issues in the current revenue cap structure, which may encourage over-investment, while Kuosmanen and Johnson (2021) highlights another possibility for under-investment due to inadequate compensation for investment risks acquired by the regulated entities. Kumbhakar et al. (2020) echoed these concerns of under-investment risks, though they suggest different solutions compared with Kuosmanen and Johnson (2021).
In evaluating the effectiveness of revenue caps, these previously stated insights become crucial, particularly in light of Crew and Kleindorfer’s (1996) early warnings about its potential drawbacks. However, as Littlechild (2003) notes, empirical evidence at the time offered limited support for these claims, a perspective echoed later by Joskow (2008b), who remarked: Unfortunately, there are been relatively little systematic analysis of the effects of the application of incentive regulation mechanisms on the performance of electric distribution and transmission companies. (Joskow 2008b, 556).
Later Bogetoft and Agrell (2017) noted: There are very few studies of the actual impact of introducing different types of benchmark based regulations. (Bogetoft and Agrell 2017, 33).
These statements, though several years old, still holds: much empirical research has focused on quantifying efficiency improvement potentials of DSOs, often with limited or no connection to the underlying regulatory framework (see e.g., Farsi and Filippini 2009; Farsi, Fetz and Filippini 2008; Filippini 1996; Filippini and Wetzel 2014; Filippini, Greene and Masiero 2018; Filippini, Hrovatin and Zoric 2004; Hattori, Jamasb and Pollitt 2005; Kumbhakar et al. 2020; Masau et al. 2021; Tsionas and Kumbhakar 2023; Yatchew 2000). Hence, while several studies have quantified significant improvement potentials for DSOs, there is arguably a scarcity of empirical studies that have delved into the effectiveness of incentivizing cost-minimizing behaviors among regulated entities.
Studies that does examine regulatory impacts include the early work by Domah and Pollitt (2001) who evaluated the initial regulatory framework that shaped the privatization and restructuring of the UK electricity market. Through a cost-benefit analysis, Domah and Pollitt (2001) found that the early regulatory efforts had failed to establish effective incentives, resulting in consumer price increases in the mid-1990s. However, stronger regulatory measures in subsequent periods led to measurable consumer price decreases in the late 1990s and early 2000s. Later Jamasb and Pollitt (2007) reviewed the UK’s regulatory framework, uncovering mixed results for its effectiveness and providing a detailed analysis of the implementation process for incentive regulation. More recently, Dimitropoulos and Yatchew (2017) examined productivity trends among Canadian DSOs under revenue cap regulation using total factor productivity measures and found an overall decline in productivity over the period studied.
These insights suggest that the effectiveness of incentive regulation through revenue caps in mitigating the drawbacks of a monopolistic market largely depends on its implementation and how its different incentivizing components are enforced by the regulator, as studies provide evidence both for and against its success depending on the country and regulator in question. Hence, although years have passed since Joskow (2008b) and later Bogetoft and Agrell (2017) encouraged further empirical investigations, the topic remains highly relevant. Furthermore, even among the limited existing studies, the literature often addresses the revenue cap as a single unified framework. However, it is essential to recognize that revenue caps usually consist of multiple components, each aimed at incentivizing specific behaviors within regulated companies. Yet, the decomposition and subsequent empirical analysis of these individual components are rarely presented in the literature.
To advance research on the effectiveness of revenue cap regulation, the main scientific contribution of this paper is to provide a unified framework for conducting an ex-post assessment of the effectiveness of individual components within established revenue caps, as well as the caps abilities to encourage sustained cost reductions within regulated entities. This evaluation is carried out through an empirical examination of the Danish electricity DSO regulation. To the best of my knowledge, no study has previously conducted such a detailed evaluation of the effectiveness of the Danish revenue cap regulation. Yet, the proposed method itself could be generalized to other similarly regulated sectors and DSO regulation in different countries as well. To attain this objective, a panel data methodology is utilized, which allows for the separate quantification of the individual efficiency components present in the cost-minimizing incentive component of the revenue cap. The Stochastic Non-parametric Envelopment of Data (StoNED) framework is used for this analysis, as it offers several advantages over other commonly used estimators such as Data Envelopment Analysis (DEA) and Stochastic Frontier Analysis (SFA) for this specific purpose. While previous applications of StoNED in the electricity distribution industry have mainly focused on quantifying individual improvement potentials (see, e.g., Bjørndal and Bjørndal 2016; Kuosmanen 2012; Kuosmanen and Johnson 2021; Kuosmanen, Saastamoinen and Sipiläinen 2013), this paper contributes to the literature by demonstrating its effectiveness as a tool for ex-post evaluation of regulatory measures as well.
Several indicators suggest that the Danish electricity distribution industry may be influenced by the revenue cap regulation imposed by the Danish regulator. Notably, the industry’s interactions with the regulator, including several legal cases filed to challenge the efficiency requirements (Nævnenes Hus 2024). This investment of time and resources in contesting the imposed revenue caps strongly suggests that the regulation is having at least some impact on the DSOs.
Additionally, consumer price data from Kuosmanen and Johnson (2021) and the regulator shows modest declines in electricity prices between 2014 and 2022 (Forsyningstilsynet 2024). This suggests that the regulation may have contributed to lowering DSO revenues, leading to reduced consumer prices (further details can be found in Appendix A). However, as previously mentioned, a comprehensive analysis of the effectiveness of the revenue cap regulation in promoting cost reductions among Danish DSOs has not yet been undertaken. Therefore, the empirical contribution of this paper is to assess the effectiveness of the Danish regulation in promoting quantifiable cost reductions among regulated DSOs.
The rest of the paper is organized as follows: Section 2 reviews existing literature concerning panel data StoNED specifications. Section 3 provides a concise overview the regulatory scheme promoted by DUR as well as the panel data utilized in the analysis. Section 4 offers a formal introduction to the StoNED specifications applied. Section 5 presents the results of the empirical analysis, while concluding remarks are presented in Section 6.
2. Previous Literature on Panel Data StoNED
The StoNED benchmarking estimator was originally introduced by Kuosmanen (2006) and further elaborated upon by Kuosmanen (2008), Kuosmanen and Kortelainen (2010), Johnson and Kuosmanen (2011), Kuosmanen (2012), and Kuosmanen, Johnson and Saastamonien (2015). Its development was originally intended to bridge the gap between the commonly used benchmark estimators, DEA and SFA, by combining the strengths of both into a single estimator, maximizing their benefits while minimizing their individual drawbacks. The application of StoNED has, however, primarily been carried out on cross-sectional data (see e.g., Andor and Hesse 2014; Kuosmanen 2012; Kuosmanen, Saastamoinen and Sipiläinen 2013). The body of literature on panel data StoNED is still quite limited, especially in comparison to more established methodologies like DEA and SFA. Hence, its application in panel data settings is still underdeveloped, especially in empirical settings, and the literature on the application of StoNED in panel data contexts remains scarce. A few contributions include the aforementioned work by Kuosmanen (2006), where two distinct panel data specifications are briefly presented: one in which inefficiency is assumed to be time-independent and another that parametrically model change in inefficiency over time. Furthermore, Kuosmanen and Kortelainen (2010) presents a first-difference approach as well. However, the majority of Kuosmanen (2006) and Kuosmanen and Kortelainen (2010) are dedicated to cross-sectional specifications.
In Kuosmanen (2007), various panel data StoNED specifications are explored, encompassing both fixed-effect and random-effect approaches. Additionally, one of these specifications enables the modeling of technical change over time. The paper also features practical applications of these estimators, with a small simulation study comparing the fixed-effect and random-effect StoNED specifications to their fixed-effect and random-effect SFA counterparts. In the simulation study, both StoNED specifications outperform their SFA alternatives in terms of accuracy. Finally, Kuosmanen (2007) includes an empirical evaluation of one of the panel data StoNED variants presented. The StoNED specification, allowing for technical change over time is used to evaluate productivity and efficiency changes in wholesale and retail trade across fourteen OECD countries, which marks one of the earliest empirical applications of panel data StoNED in literature.
Years later, in a study of Norwegian electricity DSOs, Bjørndal and Bjørndal (2016) examine a pooled panel data StoNED specification as a possible alternative to the two-stage DEA approach previously employed by Norwegian DSO regulators. The data encompasses yearly DSO specific observations from 2007 to 2012, divided into two distinct samples covering the periods from 2007 to 2011 and 2008 to 2012. Bjørndal and Bjørndal (2016) identify a potential issue with their StoNED application, as they observe implausible and inconsistent estimated parameters related to the separation of inefficiency from stochastic variation when estimating DSO-specific cost reduction requirements. Consequently, Bjørndal and Bjørndal (2016) conclude the StoNED unfit for their regulatory purpose.
In a recent StoNED application by Rødseth et al. (2023), inefficiency is decomposed into time-variant and time-persistent components, following a fashion similar to the decompositions proposed in Kumbhakar and Heshmati (1995) and Kumbhakar, Lien and Hardaker (2014), while treating persistent inefficiency similarly to Schmidt and Sickles (1984). However, the empirical application of the paper concerns Norwegian sea ports and not DSOs.
Recognizing the gaps in the existing literature, both in the evaluation of imposed revenue cap policies and the scarcity of panel data in StoNED applications, this paper seeks to contribute to both areas by advancing the understanding of revenue cap regulation and expanding the scope of panel data applications within the StoNED framework.
3. Data for the Empirical Application
3.1 Overview of the Regulatory Framework Utilized by DUR From 2012 to 2022
In Denmark, the Danish Utility Regulator (DUR) imposes revenue caps on DSOs comprised of two key cost reduction components. The first, introduced in 2018, sets a general efficiency requirement mirroring productivity increases in a comparable competitive industry. The second measures individual efficiency, identifying additional cost reducing potential for less efficient DSOs. By combining these requirements, DUR aims to address variations in productivity and efficiency levels among DSOs due to the lack of competition (see e.g., Forsyningstilsynet 2019a, 2020a, 2021a for further insights).
The general efficiency requirement enforced by DUR takes the form of an annual universal percentage-based cost reduction requirement derived from a yearly productivity index averaging approximately 2 percent (1.88% to be precise). This results in an average annual cost reduction target of around 1 percent (0.72%) after certain adjustments are made. In contrast, the individual productivity requirement is estimated using economic benchmarking, resulting in a relative DSO specific cost reducing requirement. From 2012 and onwards, three different benchmarking methodologies have been deployed in order to estimate this additional cost reduction potential:
From 2012 to 2018, a methodology referred to as the net volume model was utilized, essentially determined as the ratio of costs to standardized assets,
from 2018 to 2021 two different benchmarking estimators, DEA and SFA, were employed and combined into a single catching up potential denoted the “Best-of-Two” (BoT) method,
in 2022 SFA was replaced by a Modified OLS specification (MOLS). Additionally, an attempt was made to integrate panel data by averaging data over multiple years.
3.2. Data
The empirical analysis of the study is based on yearly DSO specific observations, covering the period from 2012 to 2022. Data collected prior to 2012 was considered incomparable due to substantial changes in practices and methodologies of DUR. However, to ensure comparability over the entire analyzed time span, some adjustments are made, which are detailed further below. For the empirical analysis, two different samples are created. One with observations spanning from 2012 to 2022, which represent the full sample, and one with observations from 2018 to 2022 representing a reduced sample.
Following Forsyningstilsynet (2019b, 2020b, 2021b, 2022) as closely as possible, the benchmarking data selected consists of one input and three outputs:
Granted
Furthermore, opportunity cost of invested capital is part of the
Table 1 presents descriptive statistics of inputs and outputs for all DSOs except three entries from 2012, which were excluded due to missing data, resulting in a total of 561 observations:
Descriptive Statistics of Input and Outputs.
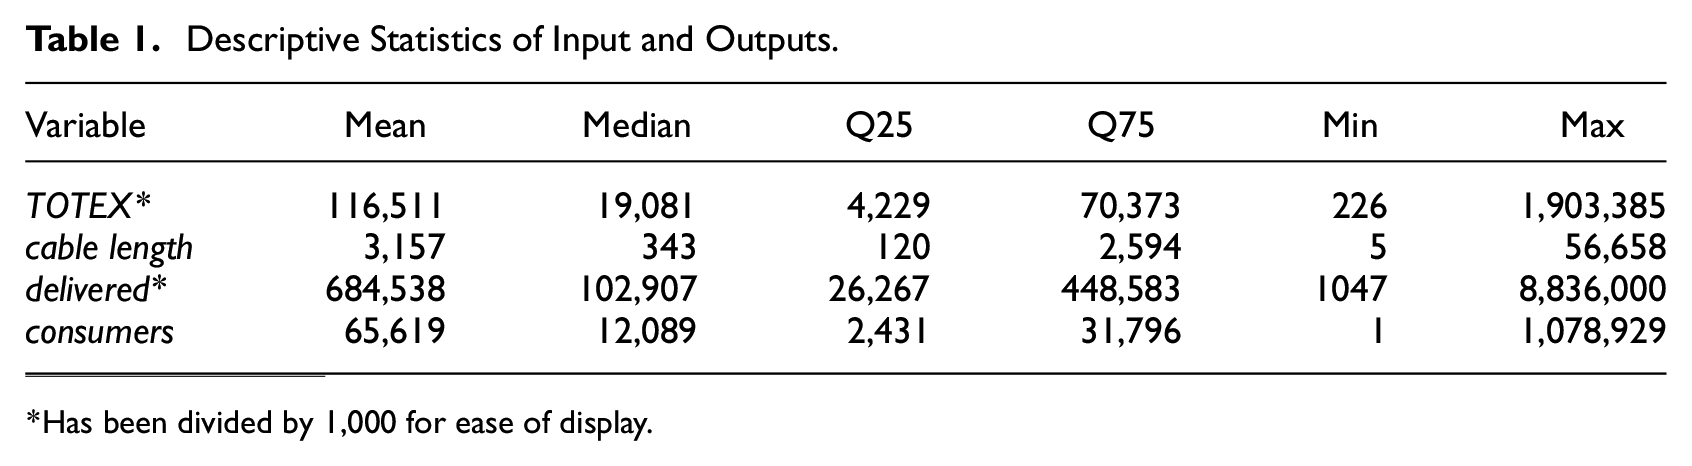
Has been divided by 1,000 for ease of display.
Table 1 indicates notable differences in numerical values of both input and outputs, suggesting significant size variations among the DSOs in the sample. The developments of input and outputs over time are presented in Figure 1:
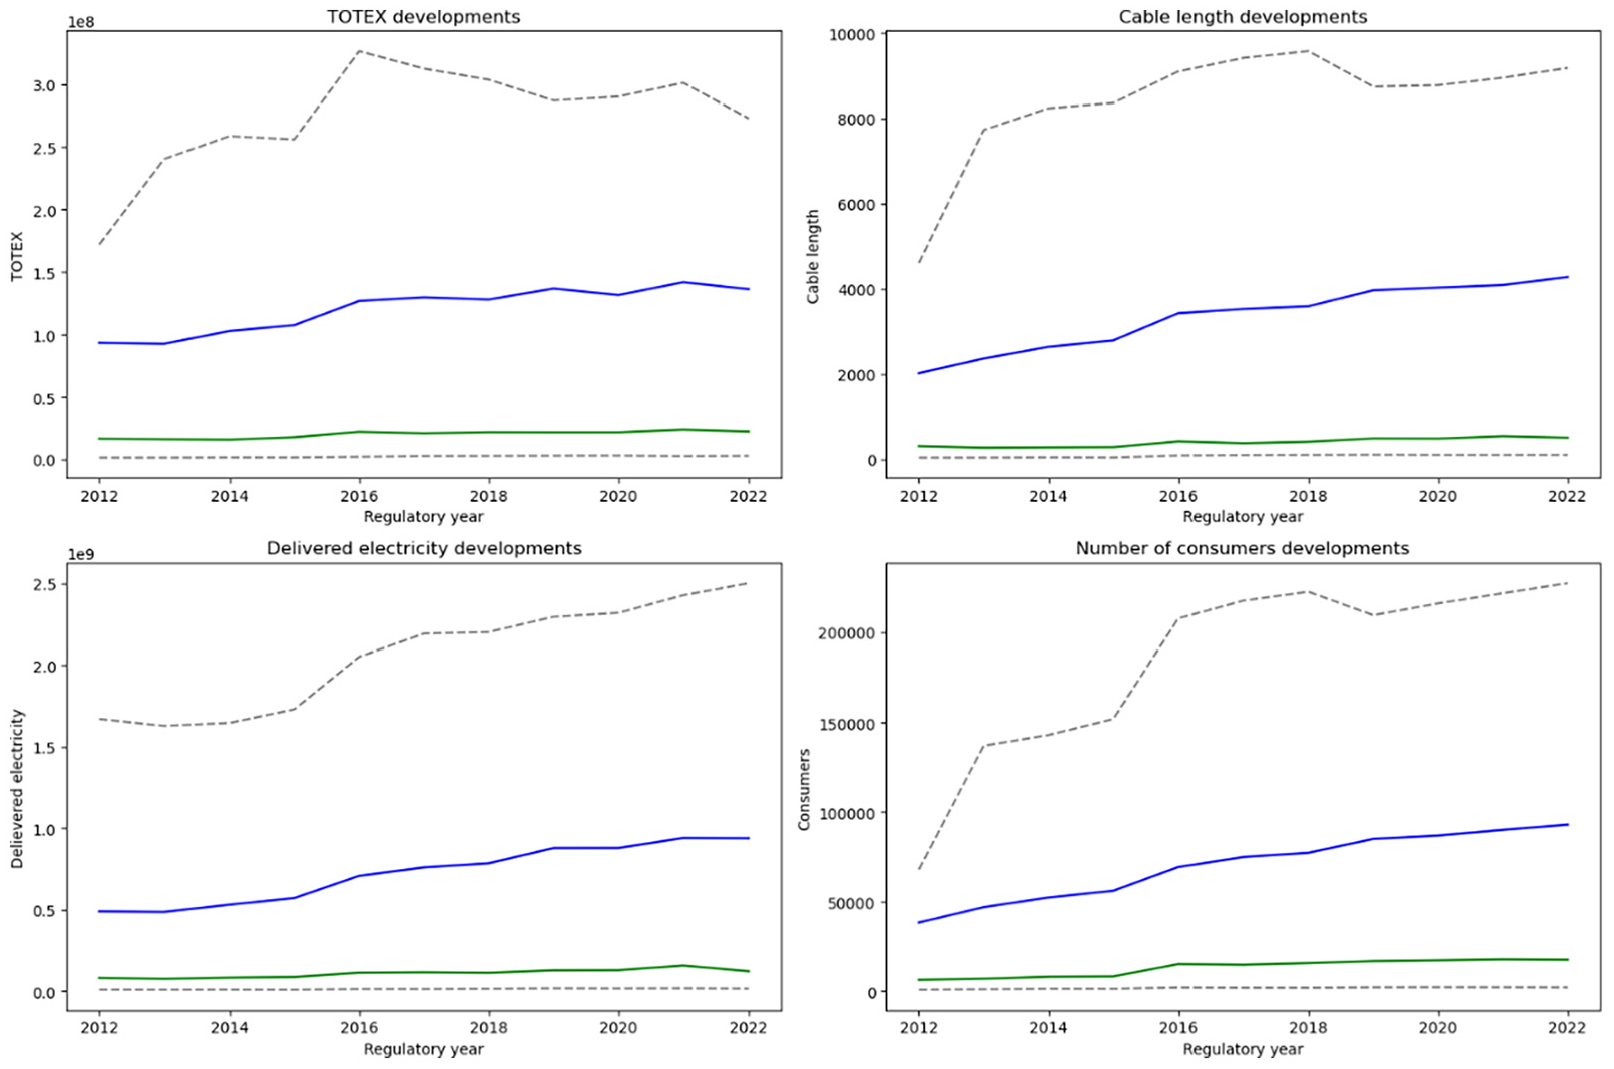
Development of input and outputs over time.
Figure 1 illustrates an overall increase in average input and output throughout the period. However, the development in the median input and output is less obvious, suggesting that this growth may be driven by a few relatively large DSOs. This is even more apparent when examining the 90th percentile lines, which further supports the claim of significant size differences among DSOs.
3.2.1. Exclusion of Outliers
As highlighted in both Johnson and Kuosmanen (2011) and Kuosmanen and Johnson (2021), ensuring comparability among regulated DSOs is crucial. Kuosmanen and Johnson (2021) demonstrates how the Finnish regulator incorporates environmental variables into their regulation to account for assumed heterogeneity among DSOs. Similarly, DUR has recently excluded a significant number of DSOs from benchmarking to maintain comparability. 1 After removing these outliers, the remaining DSOs are considered reasonably comparable by the regulator. However, before 2018, outlier classification and omission performed by DUR was less rigorous. To address extreme and potentially incomparable observations, an outlier classification similar to the one used in the most recent regulation was applied to the years prior to 2018. After the outlier removal, the panel consists of 372 observations spanning eleven years, with 133 in the reduced sample. Therefore, the notation “full sample” will refer to the dataset spanning from 2012 to 2022, with outliers removed, consisting of 372 observations. Meanwhile, the notation “reduced sample” will refer to the dataset spanning from 2018 to 2022, also with outliers removed, consisting of 133 observations. Appendix B presents the annual count of DSOs before and after the outlier removal along with descriptive statistics for inputs and outputs, organized by year after outlier removal.
Additionally, Appendix C replicates the analysis of the main paper using nearly the entire dataset, including outliers (excluding only the three DSOs with missing data). While the results in Appendix C cannot be directly linked to the regulatory framework established by DUR, since the excluded DSOs were subject to different regulatory treatments compared to non-outliers, their inclusion illustrates StoNED’s adaptability in handling datasets characterized by significant heterogeneity.
4. Methodology
Initially, a universal cost reduction requirement should result in a general downward trajectory of costs throughout the regulatory period, with a slope of comparable magnitude to the annual universal cost reduction target. The identification of a similar trend in the panel data specification would suggest that the general efficiency requirement indeed has influenced the overall operational practices of the DSOs, encouraging them to adopt cost-minimizing strategies.
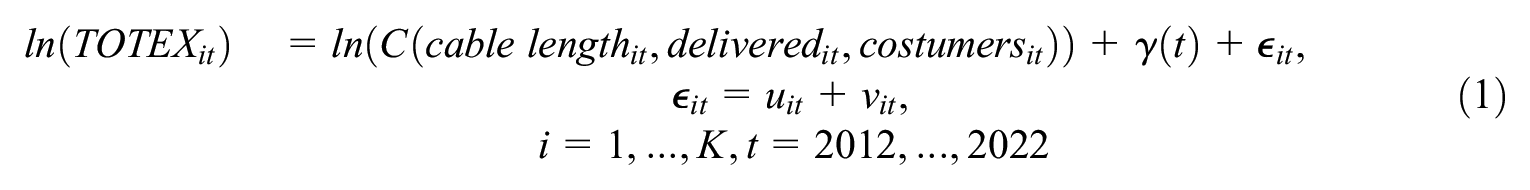
Furthermore, the supplementary individual efficiency requirement would presumably lead DSOs to converge toward an equal level of cost efficiency over time. Consequently, observing a similar convergence through the examined period would indicate that the individual efficiency requirement exerts an influence on the behavior of inefficient DSOs, compelling them to further improve their cost efficiency over time. Therefore, a specification capable of capturing both average cost trends, as well as converging behaviors of the DSOs is needed. To achieve this, a cost function (assuming common input prices) is specified. The general representation is as follows:
for the full sample and
Three different specifications of
1.

The number of dummy variables is lower in the reduced sample.
2.
3.
The parameterization of
If the general efficiency requirement has influenced the general cost-reduction behavior of the DSOs, the majority of the included dummy variables, along with the linear and quadratic trends, would display negative values and exhibit joint significance. This would imply an overall reduction in costs over the examined period. Additionally, by analyzing the annual variations of the estimated coefficients of specification 1, it is possible to assess whether the cost reductions are evenly spread across years.
Each of the three specifications in the full sample captures changes that occurred prior to the introduction of the general efficiency requirement in 2018. This motivates the reduced sample spanning from 2018 to 2022. Estimating each specification on the reduced sample ensures that the linear and quadratic trend does not capture variations in costs predating 2018.
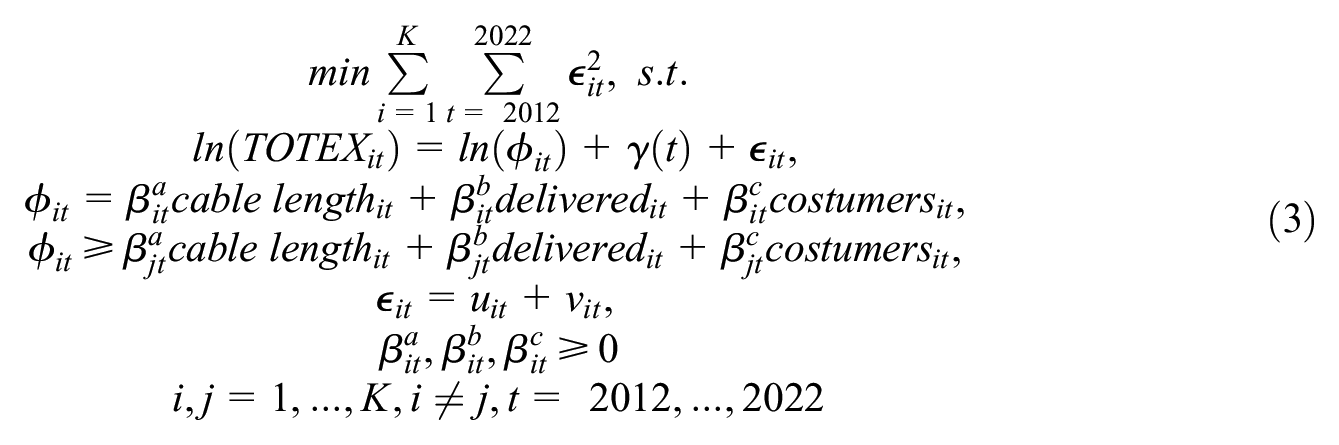
4.1. The StoNED Estimation
Following the StoNED framework, equation (1) is estimated by Convex Non-parametric Least Squares (CNLS). The specification follows the multiplicative CNLS specification from Kuosmanen, Johnson and Saastamonien (2015) in which a parametric part, as well as a time dimension is added 2 :
Following the arguments and empirical insights from Kuosmanen (2006, 2008, 2012), Kuosmanen and Kortelainen (2010), Johnson and Kuosmanen (2011), Kuosmanen, Johnson and Saastamonien (2015) and Andor and Hesse (2014), utilizing a panel data StoNED framework for the estimation of equation (1) is especially attractive for this application when compared to other commonly used methods like DEA and SFA. Mainly, because it provides a highly flexible way of estimating the relationship between inputs and outputs compared with an SFA framework, as the estimated elasticities of the three outputs,
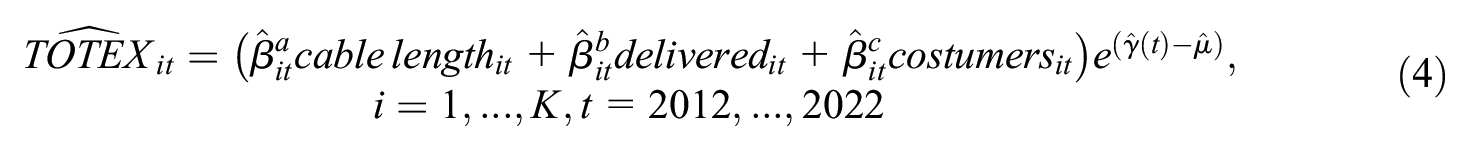
providing DSO- and time specific cost norms,
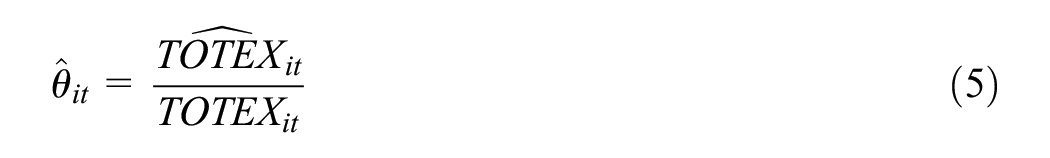
which yields an efficiency score, representing the cost efficiency level for DSO
To obtain the expected inefficiency estimate, Method of Moments (MoM) estimation is utilized, beginning with the third empirical moment (Kuosmanen 2012; Kuosmanen, Johnson and Saastamonien 2015):
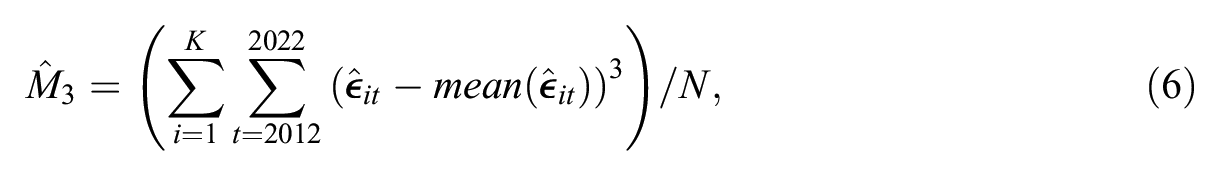
where
Note that the third empirical moment estimated in equation (6) is the parameter subject to inconsistency in Bjørndal and Bjørndal (2016). The problem of an inconsistent third empirical moment becomes evident, as this estimated parameter is utilized as a key part of the scaling of the average CNLS function into a frontier.
By the distributional assumption of
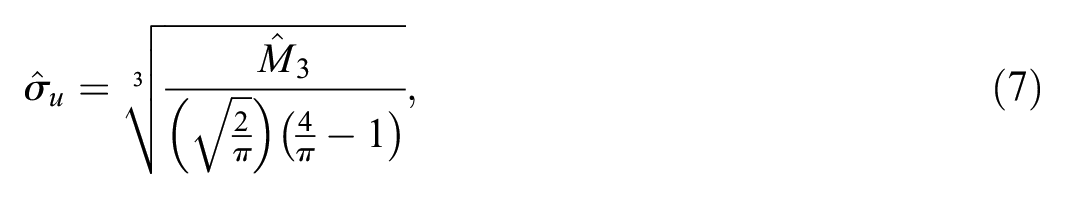
from which the expected inefficiency can be estimated as (Kuosmanen 2012; Kuosmanen, Johnson and Saastamonien 2015):
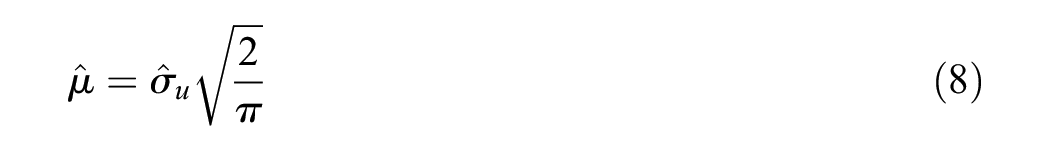
which constitutes the expected inefficiency imposed in equation (4).
DSOs not considered outliers have been consistently governed by individual efficiency requirements during the entire 2012 to 2022 period examined. As a result, the
As mentioned in Section 2, Rødseth et al. (2023) present another way to capture efficiency changes over time by extended residual decomposition. Similarly, Filippini, Greene and Masiero (2018), Kumbhakar et al. (2020), Musau et al. (2021), and Tsionas and Kumbhakar (2023) also present ways to decompose the estimated residual into various time varying and time-invariant efficiency elements, albeit in a SFA framework. Arguably, the main motivation for this extensive decomposition is to account for unobservable heterogeneity exogenous to the DSOs, which may otherwise affect the efficiency estimates or alternatively to identify endogenous drivers of efficiency. Regarding adjustments for heterogeneity, the CNLS framework itself presents another appealing approach, by allowing the estimated
4.2. Evaluating Consistency of the Estimated Efficiency Scores
To evaluate the consistency of the empirically estimated efficiency scores, the jack-knife re-sampling technique is used (see e.g., Efron and Gong 1983; Tukey 1958). Re-sample by jack-knifing itself is a simple method to obtain a distribution of estimated results by iteratively leaving out one or more randomly drawn observations of the sample.
Particularly in DEA, jack-knifing has been deployed for various purposes including evaluating differences in biases between frontiers as, for example, Asmild, Kronborg and Rønn-Nielsen (2021) and identification of outliers as, for example, Ondrich and Ruggiero (2002). The main motivator for its inclusion in this paper is that it allows for the assessment of the potential method dependence of the estimates, by providing an empirical distribution of each time- and DSO specific efficiency score. A distribution, which can be used to estimate Standard Errors (SE) of the underlying results. Following Tukey (1958) and Efron and Gong (1983) the jack-knifed SE is calculated as when omitting a single observation from each iteration:
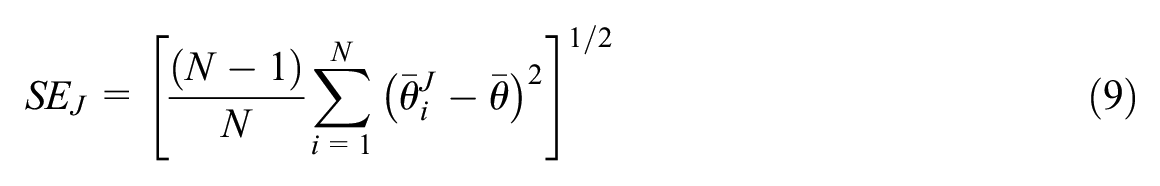
in which
However, the jack-knifing technique is not without its limitations. Compared to a pure simulation study, the true bias and SE of the estimated efficiency scores cannot be derived. It is only the estimated jack-knifed SE, which informs about the empirical consistency of the result. Furthermore, any re-sampling technique in a StoNED environment is complicated by the extensive estimation time needed, which naturally grows with the number of jack-knife iterations. Therefore, the number of iterations is 50 for each
5. Results
5.1. Estimated Coefficients of the Three Panel Data Specifications
The three panel data StoNED specifications are estimated in accordance with equations (3) to (8) for both the reduced and full sample.
4
The
The coefficients, SE and p-values of the coefficients contained in
Inference of the Coefficients Contained in
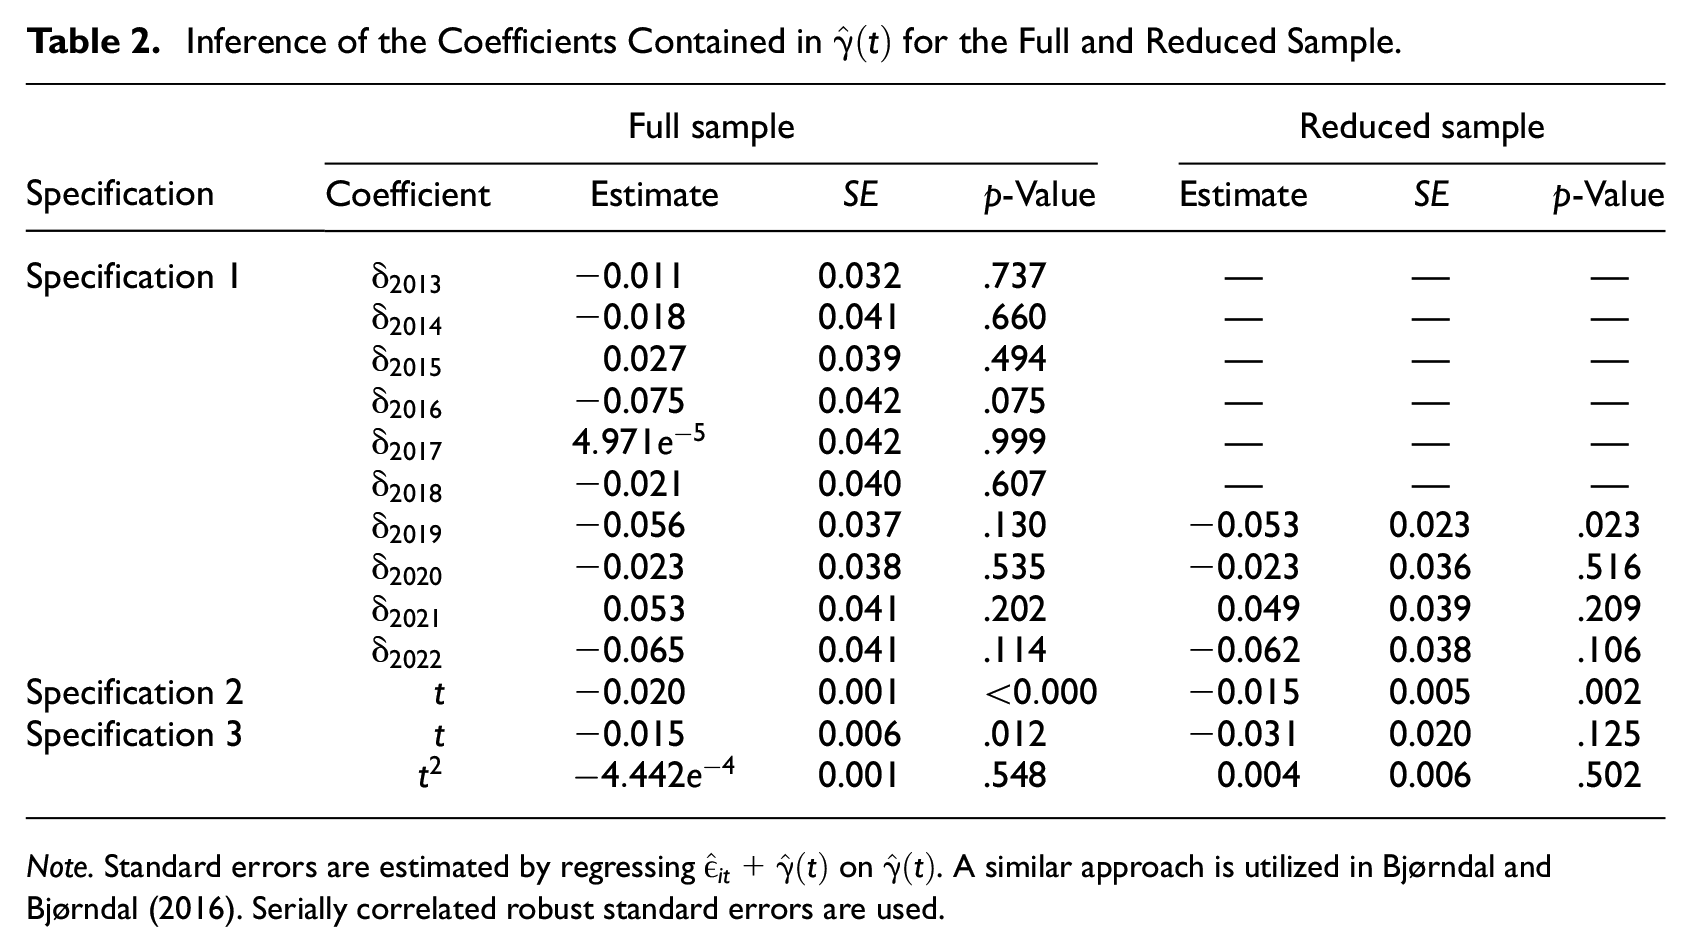
Note. Standard errors are estimated by regressing
Examining Table 2, specification 2, the linear time trend, shows a notable annual cost reduction, significant at a 95% confidence level for both the full and reduced samples. Specification 3, featuring a quadratic time trend, also indicates an annual cost decrease, also jointly significant. Lastly, when comparing the general trends with the results of specification 1, the time dummy specification, subtle distinctions emerge. Each yearly negative shift is relatively minor, with some failing to reach significance, and a few years even exhibiting positive shifts. Yet, the estimated coefficients of the dummy variables appear jointly significant for both the full- and reduced sample.
Considering the full sample, the compounded cost difference over the entire observed period exhibit similarities across all three specifications. Summarizing the time dummies reveals a jointly significant decrease of 0.190 (approximately a 19% cost reduction), a joint percentage reduction shared by quadratic trend, while the linear trend display a decrease of around 20 percent. For the reduced sample, the compounded effect of the time dummies suggests a cost reduction of 9 percent, while the linear trend indicates a cost reduction of 6 percent, and the quadratic trend implies a reduction of approximately 6 percent as well.
Hence, all parametric specifications indicate a notable overall cost decrease ranging from 19 percent to 20 percent throughout the eleven-year period, and from 6 percent to 9 percent throughout the five-year period for the reduced sample. The 6 percent to 9 percent overall cost reductions in the reduced sample, equivalent to roughly a 1 percent to 2 percent cost reduction per year, are similar in magnitude to the yearly general efficiency requirement of approximately 1 percent. However, based on the results of the time dummy specification, it becomes evident that cost reductions are not evenly distributed across each year. This holds true for the full sample as well. The remainder of the analysis only considers the full sample.
5.2. Estimated Expected Inefficiency of the Three Panel Data Specifications
The estimated third moment,
Estimated
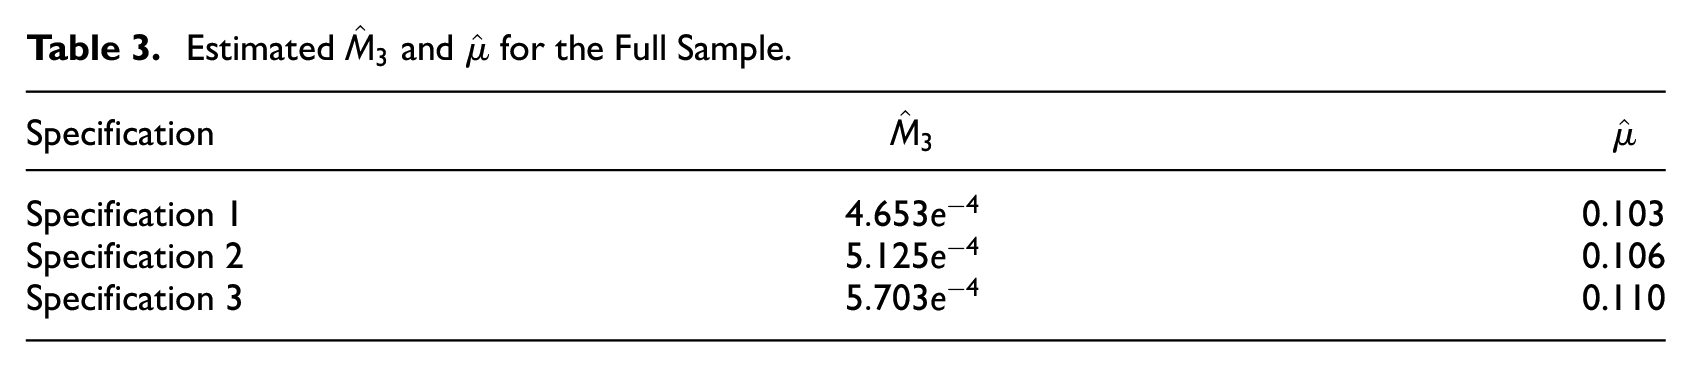
Each specification yields similar estimates of
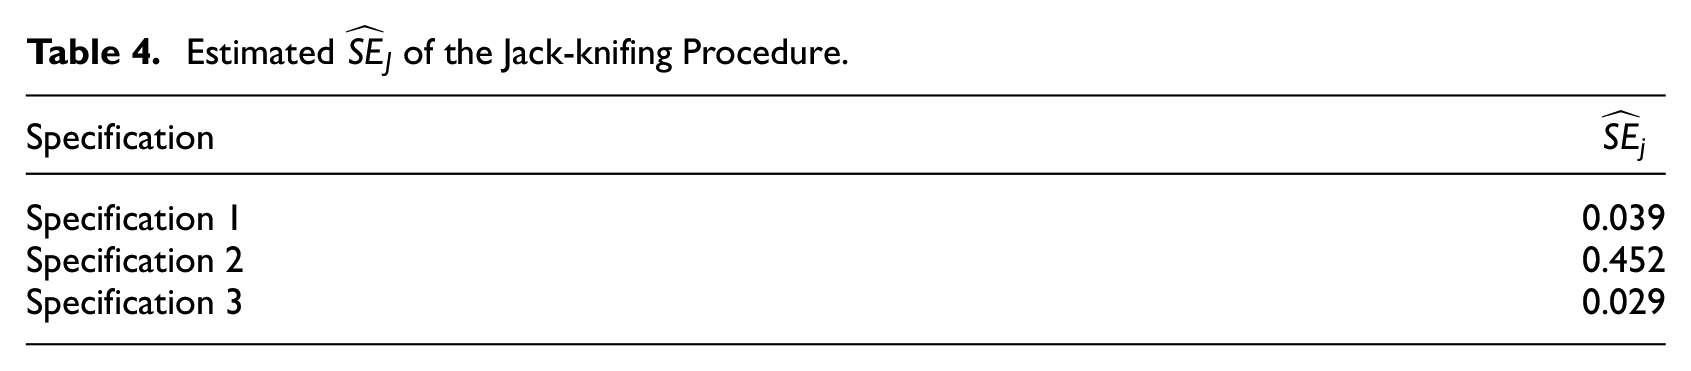
5.3. Jack-knifing Evaluation of the Three Panel Data Specifications
Based on the jack-knifing method described in Section 4.2, equation (9), empirical standard errors are calculated for the estimated efficiency score means:
Based on the results of Table 4, specification 1 and 3 produce the most consistent mean efficiency levels out of the three specifications considered. Specification 1 offers a slightly higher estimated
Estimated
5.4. Convergence and Catching-up Effects of the Selected Panel data Specification
Following specification 1, a full sample estimation of the DSO-specific efficiency scores is conducted for all 372 observations. The left panel of Figure 2 illustrates the evolution of mean, median, as well as the 10th and 90th percentile levels of estimated efficiency scores over time, while the right panel illustrates the difference in efficiency scores for each DSO between adjacent years:
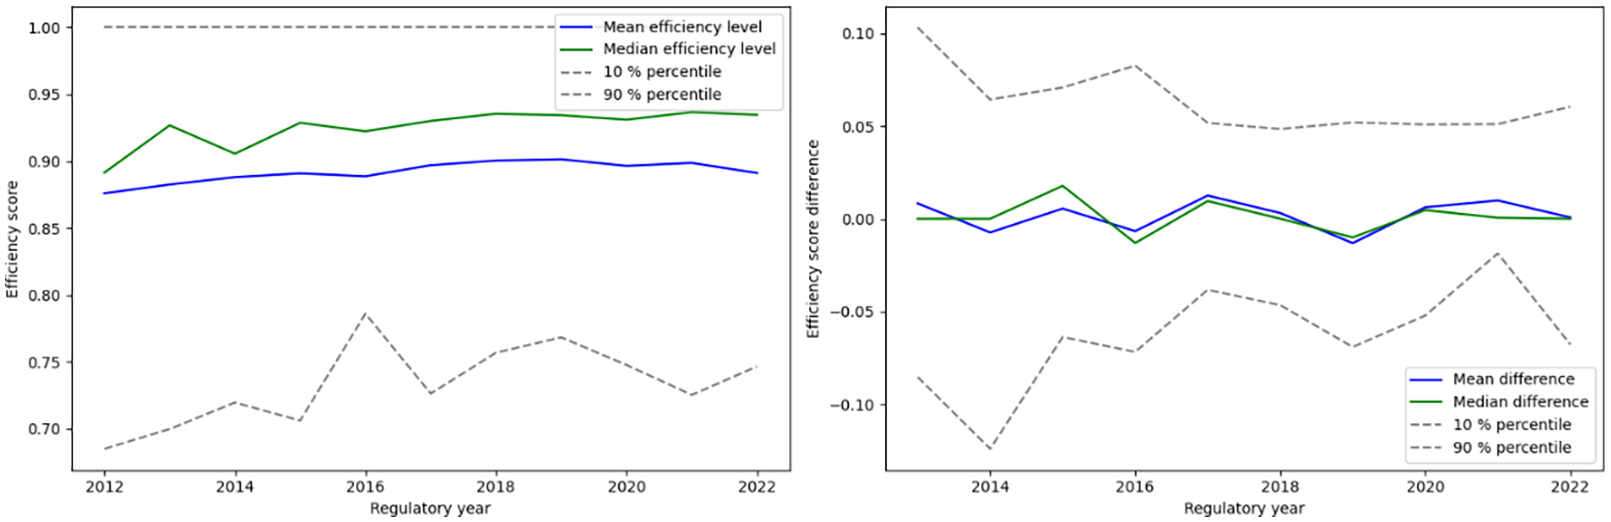
Development StoNED efficiency scores for the full sample.
Examining the mean and median efficiency scores from the left panel of Figure 2 reveals general stability throughout the period, implying no consistent convergence to peak efficiency throughout the eleven-year period. Below the 10 percentile, a slight efficiency increase appears, implying that a small number of DSOs might experience some efficiency gains. For the 90 percentile, it is hard to detect any progress or regress as the efficiency scores are capped at 1.
The mean and median differences from the right panel exhibits similar trends of overall stability. Beyond 2014, most DSOs experience year-on-year efficiency changes of less than 5 percentage points. However, a few DSOs exhibit significant fluctuations, with some showing improvements or declines exceeding 10 percentage points year-on-year. Consequently, while the majority of DSOs do not demonstrate any noticeable progress or decline in their relative efficiency levels, a small number experience substantial fluctuations in efficiency. These DSOs account for around 8 percent of the sample, with an almost equal number of DSOs experiencing increases and decreases. Notably, the majority of extreme fluctuations happen prior to 2018, which may be attributed to the change in benchmarking methodology.
Among the 8 percent of observations with year-on-year variations exceeding 10 percentage points, three DSOs are notable for experiencing efficiency declines of over 20 percentage points between adjacent years. Analysis of these three DSOs indicates that their efficiency drop was primarily due to increases in
Based on the notable stability of efficiency scores over time presented in Figure 2, and the further stability of estimated
6. Discussion and Concluding Remarks
This study presents the StoNED estimator as an attractive method for ex-post evaluation in order to measure the impact of the individual components of incentive regulatory frameworks employed in the monopoly regulation of DSOs. A semi-parametric panel data StoNED specification is presented and applied in an empirical study of the effectiveness of the DSO-specific revenue caps imposed by the Danish regulator, DUR. The result reveals a jointly significant reduction in average costs, amounting to around 19 percent to 20 percent, spanning DSOs over an eleven-year period (2012–2022). This corresponds to an average annual cost decrease of approximately 2 percent. Considering the last five years (2018–2022), a 1 percent to 2 percent average cost reduction is identified. These figures align with the approximately 1 percent yearly universal cost reduction requirement imposed by DUR during the same period, indicating that the general cost reduction requirement may influence the cost-minimizing behavior of DSOs. However, these cost decreases may not be uniformly distributed across years, as indicated by the time dummy specification in both the full- and reduced sample.
Yet, additional relative cost reductions among cost inefficient DSOs are not consistently observed. In fact, certain DSOs display declines in cost efficiency during specific years. This implies that while a general decrease in costs is noticeable over time, possibly due to the general cost reduction requirement, no additional convergence effect is observed. On the contrary, in some years, some DSOs show a decline in cost efficiency, indicating that the individual efficiency requirement may fail to promote proper additional cost reducing incentives for the inefficient DSOs, at least within the scope of this empirical analysis.
In summary, there are strong indications that the general cost reduction requirement, on average, encourages cost-minimizing behavior among regulated DSOs. Consumer price statistics also align with the paper’s findings of modest average cost reductions among DSOs, and interactions through legal proceedings between DSOs and the Danish regulator also suggest that the imposed regulation has had some impact. However, the individual cost reduction requirement may not consistently and quantifiably induce additional cost-minimizing behavior among inefficient DSOs. On the basis of this insight, it may be advisable for DUR to improve the incentive structure of the individual efficiency requirement, as the results suggests that inefficient DSOs do not consistently demonstrate improvements in cost efficiency beyond what may be imposed by the general productivity requirement. Yet, while the study provides compelling evidence for a measurable effect of at least the general cost reduction requirement imposed by DUR, results must be considered indicative as no counterfactual research design exists, allowing for the comparison of unregulated and regulated DSOs, as all DSOs were subject to at least parts of the regulatory requirements.
Footnotes
7. Appendix
Acknowledgements
I would like to thank Jonas Månsson (Blekinge Institute of Technology), Anupama Unnikrishnan (Blekinge Institute of Technology), and Søren Arnberg (Forsyningstilsynet, the Danish Utility Regulator) for their valuable insights and for engaging in discussions during the formation of this article.
Furthermore, I would like to express my sincere gratitude toward the two anonymous reviewers who provided valuable feedback and insights, ultimately leading to a number of improvements of the article.
Declaration of Conflicting Interests
The author declared no potential conflicts of interest with respect to the research, authorship, and/or publication of this article.
Funding
The author received no financial support for the research, authorship, and/or publication of this article.
1
Further details are available in Forsyningstilsynet (2019b, 2020b, ![]() ).
).
2
The specification follows the semi-parametric StoNEZD specification of Kuosmanen, Johnson and Saastamonienet al. (2015). However, since the parametric component of the CNLS specification,
3
An intriguing extension of the analysis could involve identifying and incorporating potential drivers of inefficiency into the modeling of inefficiency estimates derived from the residuals. However, since this paper primarily focuses on assessing the effectiveness of revenue cap regulation, exploring these drivers is considered beyond its scope.
4
Gratitudes toward Dai S., Fang Y.H, Lee C.Y and Kuosmanen T. for the open access to the Python package pyStoNED, which was used for the CNLS estimations.