
Abstract
In the US, there has been a movement toward competitive electricity markets with system-operator auctions. However, the impact of such market reforms on non-market outcomes like emission rates remains unclear. We decompose how competition in wholesale electricity markets can affect carbon emission rates of electricity generating units (EGUs) through process, reallocation, and selection effects. Using event-study and difference-indifference strategies, we quantify the Day-Ahead Market’s (DAM) environmental impact in the Southwest Power Pool and assess the importance of each channel, with Pennsylvania, New Jersey, and Maryland interconnection serving as the comparison group. We find DAM reduced average carbon emission rates of EGUs by 0.033 tons per MWh, a roughly 4 percent reduction. This reduction is primarily driven by the selection effect: emission-intensive and uneconomical EGUs retire after the DAM market reform. This corresponds to an annual avoidance of 7.66 million tons of carbon dioxide emissions, worth approximately $383.4 million in avoided damages.
Keywords
1. Introduction
A core feature of environmental economics is the study of how market behavior affects non-market outcomes. The electricity sector in particular has been a source of much interest, given the substantial local and global environmental externalities it generates. Recently, there has been a move toward more integrated and competitive electricity markets in the US and EU, where the wholesale electricity price and dispatch are determined via system-operator market auctions. While the impact of wholesale electricity market reforms on market outcomes has been studied (e.g., Cicala 2022), their impact on non-market outcomes such as emissions per unit of electricity generation (i.e., emission rate) is less clear. In this paper, we empirically quantify the effects of introducing integrated and competitive electricity markets on the emission rates of electricity generating units (EGUs) and decompose the channels underlying the changes in emission rates to understand whether increased competition has led to a “cleaner” fleet of thermal EGU’s in the Southwest Power Pool (SPP).
To investigate the environmental effects of the creation of competitive electricity markets, we focus on a 2014 market reform in SPP that launched the day-ahead auction markets (DAM). Prior to this reform, most electricity transmission between balancing authorities (BAs) within SPP was conducted via bilateral contracts. To efficiently and reliably meet market demands, SPP established an integrated and competitive market that facilitated electricity trade between BAs. Specifically, EGUs in SPP would submit price-quantity bids the day before the actual demand is realized, and if their bid is below the market clearing price, they would be dispatched. 1 With the creation of the DAM, EGUs were able to find their trade counterparts efficiently (via market auction) and thus reduce average production costs (Cicala 2022). In trade theory, a greater extent of market openness via reduced trade costs and entailed competition induces market responses such that (a) market participants are encouraged to improve efficiencies and/or (b) productive entities survive while unproductive ones exit (Baggs 2005; Melitz 2003; Nataraj 2011 and many others). We shed light on the role of these market responses to the DAM that in turn affect environmental quality through altering carbon emission rates (total emissions of carbon dioxide per MWh of generation) of EGUs.
Utilizing an event-study difference-in-differences method, we find that introducing integrated and competitive markets reduced emissions rates by 0.033 short tons per MWh, a roughly 4 percent reduction in emission rates, mainly via the exit of “dirtier” and less productive EGUs within power plants utilizing multiple fuel varieties. This implies that 7.66 million tons of carbon dioxide (CO2) are saved annually, on average, which is equivalent to $383.4 million nominal 2021 US dollars of economic value. Our findings are similar in spirit to those in Cicala (2022), which finds competitive markets reduced the market production costs of EGUs via facilitated trade as well as discouraged utilization of uneconomical units. As such, our contribution is quantifying how these market responses impact non-market values, particularly with respect to improved environmental quality.
Our empirical work has several key features. First, we use detailed hourly and monthly data on EGUs and plants, capturing total load, heat input consumption and emissions alongside their attributes such as the fuel type and prime movers. Second, we use this detailed information to conduct event-study difference-in-differences analyses to quantify the environmental impact of DAM. This empirical analysis is guided by a theoretical model that decomposes the potential channels by which the DAM may affect environmental outcomes. Lastly, we use these estimates to measure annual total carbon emissions savings and their associated non-market economic value.
To intuitively understand how sectoral emission intensity is determined, we apply the trade-environment framework introduced in Najjar and Cherniwchan (2021) to the electricity sector. Specifically, this framework decomposes the channels through which international trade liberalization affects manufacturing industries’ environmental accounts into (i) process, (ii) reallocation, and (iii) selection effects. While there are some fundamental industrial differences between the electricity and manufacturing sectors, the intuition the framework delivers is still informative and generalizable. We show emission rates can be affected by the DAM through (a) improvement of emission rates of EGUs (the process effect), (b) market share reallocation toward less carbon-intensive EGUs from “dirtier” and less efficient ones (the reallocation effect), and/or (c) the retirement of uneconomical units (the selection effect).
The delineation of these potential market response channels guides the empirical analyses, which we use to quantify their relative significance. Specifically, we adopt an event-study difference-in-differences approach with Pennsylvania, New Jersey, and Maryland interconnection (PJM) as the comparison group. PJM has a similar energy portfolio to SPP when the DAM is introduced, and it is unlikely to be directly affected by the DAM in SPP due to geographical distance, reducing Stable Unit Treatment Value Assumption (SUTVA) concerns that could arise from using a geographically adjacent ISO like the Midcontinent Independent System Operator (MISO) or the Electric Reliability Council of Texas (ERCOT). In the baseline model, key controls include time-varying factors such as the total load at the ISO level and local natural gas prices, in addition to fixed effects to control for time-invariant attributes and common long-term and seasonal temporal shocks.
The estimated reduction in emission rates of 0.033 tons of CO2 per MWh due to the DAM reflects the composite effect of the process, reallocation and selection channels described above. Through the use of (i) market share controls and (ii) EGU fixed effects, we find reallocation and process effect channels play little role in affecting SPP’s environmental accounts after the DAM. Hence, we conclude the selection effect explains most of the reduction in emission rates, specifically the exit of dirtier EGUs. 2 To verify this, we further examine EGU retirements around the creation of the DAM. After excluding planned retirements pre-DAM, we find natural gas steam turbine EGUs began to rapidly and frequently retire in the post-DAM period in SPP. We also find the retired EGUs tend to be more carbon-intensive per MWh and less efficient (higher heat rates) compared to the surviving and operating EGUs after the DAM, and they are more likely part of mixed-fuel power plants. This suggests that plants with diverse fuel varieties may react to intensified competition by retiring less competitive units, which in turn yields positive environmental externalities. 3
The findings of this paper indicate that the non-market value of establishing an integrated and competitive market structure can be substantial. Applying the 2021 social cost of carbon (i.e., $50/ton), the improvement of carbon intensity by 0.033 short ton per MWh has an annual value of $383.4 million nominal US dollars. Introducing well-designed competitive markets in electricity markets improves the efficiency of dispatch (Cicala 2022) and can also assist with finding ways to address climate change concerns. While the exact non-market effects will vary depending on market specifics, we suspect our findings will generalize to other electricity markets to the extent that less efficient generators are driven to retire by market reform and less efficient generators are dirtier (see Figure 1b). Given that nearly 40 percent of the US has not adopted competitive market dispatch, our results suggest the potential for environmental improvements from market adoption in the western and southeastern US.
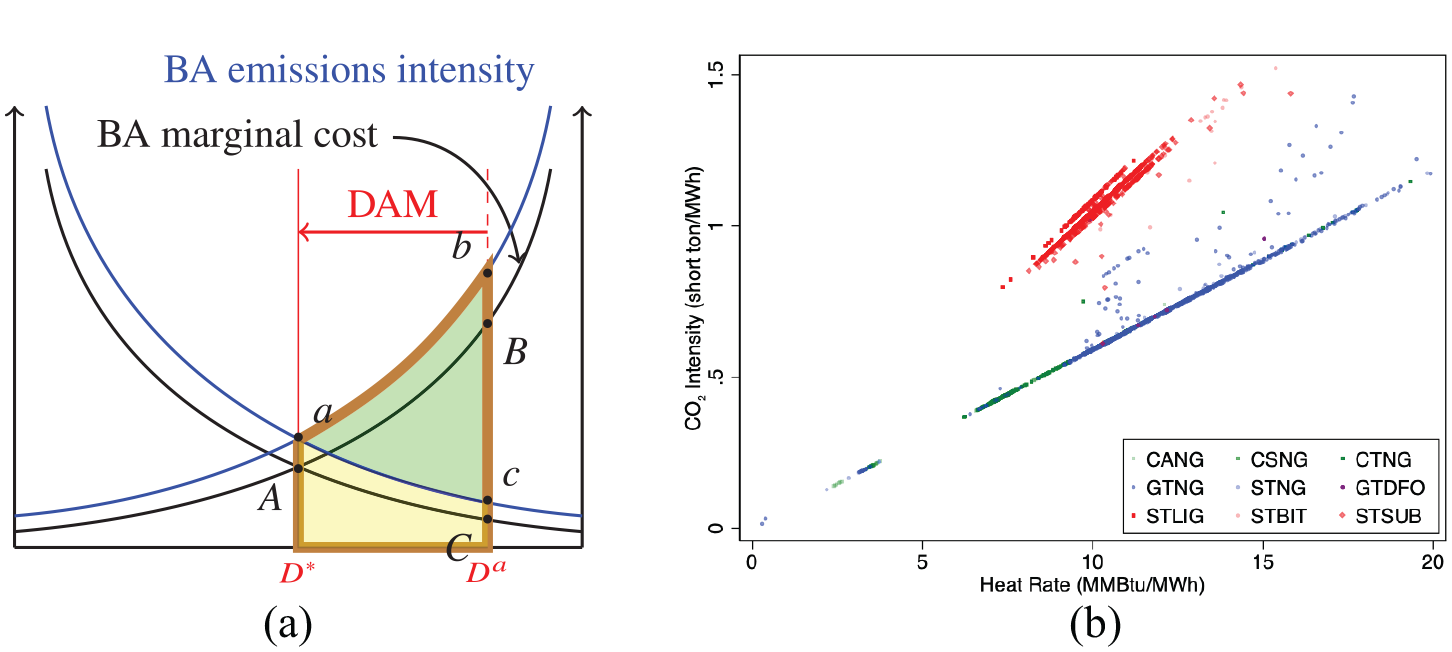
Market integration and emissions: (a) DAM and emission savings and (b) heat rate and CO2 intensity.
Our work contributes to several strands of literature. First, it is connected to a broad trade-environment literature investigating the effect of market openness on market entities’ environmental accounts. For example, Martin (2011), Forslid, Akerman and Prane (2021) and Cherniwchan (2017) shed light on the role of better foreign intermediate input access via trade liberalization on manufacturing for Indian firms’, Swedish firms’ and US plant emissions, respectively. They find that market entities were able to reduce pollution emissions via enhanced production efficiencies or offshoring dirty inputs thanks to the importing channel. In contrast to the manufacturing setting, here we examine how a market reform which expedited electricity trade 4 affected emission rates, with results consistent with the positive environmental consequences of improved market openness found in the manufacturing sector.
Second, this paper contributes to the recent empirical trade-environment literature which specifically decomposes channels through which sectoral emission intensity is affected at the micro unit level. For example, recent empirical studies such as Najjar and Cherniwchan (2021), Holladay and LaPlue (2021) and Shapiro and Walker (2018) find that the time-consistent cleanup of the US/Canada manufacturing sector over the past decades is attributable to (a) the improvement of the manufacturing process efficiency, (b) the reallocation of market shares, and (c) the market selection of production units (e.g., firms, plants or establishments). 5 Such an approach has not been undertaken for the electricity sector at the EGU-level. In addition, we reveal a unique feature of the US electricity sector, whereby the selection effect plays a more crucial role in reducing sectoral emission rates than the process effect, which stands in contrast with the studies focusing on the manufacturing industry.
Finally, this paper contributes to the environmental literature on the non-market effects of market forces in the electricity sector, such as the entry of renewable generators (Bigerna, Bollino and Polinori 2016; Kaffine, McBee and Lieskovsky 2013; Novan 2015; Sexton et al. 2021) or the sharp decline in natural gas prices (Coglianese, Gerarden and Stock 2020; Fell and Kaffine 2018; Holladay and LaRiviere 2017). Our analysis of the DAM market reform is most similar to Chan et al. (2017) and Doyle and Fell (2018), who find that the restructuring of electricity markets away from traditional vertically-integrated utilities yields environmental benefits via efficiency improvements and input cost reductions for coal power plants. An important distinction is that these papers focus on the role of cost-of-service regulation, whereby investor-owned utilities were obliged via regulation to fully pass through fuel costs to customers (Cicala 2015), prior to restructuring. Utilities in the SPP territory are generally not restructured and still have cost-of-service pricing—the DAM market reform primarily affects competition through facilitating least-cost dispatch of generation. This distinction may, in part, explain why they find a strong process effect of improved efficiency while we do not.
2. Motivation
After a period of long and deliberate planning, Southwest Power Pool (SPP) underwent major market restructuring after 2014. The integrated marketplace went live on March 1, 2014, which is comprised of a day-ahead market, real-time balancing market, congestion-hedging markets and reliability unit commitment. 6 This was followed by the Phase 2 “Project Pinnacle” in March 2015, which included long-term congestion rights, market-to-market coordination and regulation compensation. Through the DAM commitment of more efficient units to generate and dispatch energy, SPP could reduce excess capacity by 3,000 MW by consolidating 16 legacy BAs, which in turn helped them save an additional $131 million on top of the $170 million savings from the real-time balancing market. 7
What are the possible environmental implications from such a market integration? Intuition comes from Cicala (2022), who demonstrates that market mechanisms introduced in the U.S. electricity sector reduced production costs thanks to the reallocation of production via trade and retirement of inefficient EGUs. These mechanisms, which arise from trade-induced intensified (import) competition, may have environmental ramifications if the marginal cost of production ($/MWh) is positively correlated with the emission intensities (i.e., emissions per MWh of generation) of the EGUs.
To illustrate, we augment the marginal cost figure in Cicala (2022) by adding curves depicting EGUs’ emission rates in Figure 1a. The upward-sloping black solid lines represent the merit order of marginal costs of EGUs of a legacy BA within SPP and those of another legacy BA in SPP that could serve as a trading counterpart (e.g., Oklahoma Gas and Electric Company and the Kansas City Power and Light Company). 8 The initial electricity price difference between the two BAs prior to market integration (i.e., autarky) is the vertical distance from point B to C. After DAM market integration, however, the price gap disappears and a uniform price is determined at point A, and market demand for one legacy BA-produced electricity diminishes (a shift from D a to D *) due to imports from the other legacy BA. This market opening could entail market rationalization via EGU selection in both BAs, meaning that an intensified import competition in one legacy BA induces relatively inefficient EGUs to retire, while offering new opportunities to efficient ones to meet “foreign” market demand. The uneconomical EGUs within SPP would be more likely to retire, and the marginal EGU’s emission intensity would shift from point b to point a yielding environmental benefits. The net reduction in emissions per unit of generation is shown as the green shaded area abc in the figure. 9
A key requirement for environmental benefits to emerge is that EGUs’ emission intensity would need to be positively correlated with the production costs. In Figure 1b we suggestively show some evidence in favor of this assumption by focusing on the relationship between heat rates and emission intensities of EGUs in SPP. Heat rates indicate the total amount of heat input (MMBTu) that each EGU consumed to produce 1 MWh of electricity, implying that higher heat rates are associated with greater marginal costs of electricity production. This figure shows the positive correlation of heat rates and carbon emission intensity of EGUs in SPP (within a fuel-prime mover type) consistent with our assumption—more fuel consumed means higher costs and higher emissions, at least within a fuel type. 10 However, competition introduced by DAM may lead to switching between fuel-prime mover types, and so it is ultimately an empirical question whether or not environmental benefits emerge.
Before turning to the formal econometric analysis, we plot the observed time trend of average CO2 intensity of generators in SPP in Figure 2a, before and after the implementation of DAM. Visually there is a stark trend break at the start of 2015, with emission rates quickly falling from around 0.93 to around 0.85 tons/MWh. Given this observation and the fact that SPP spent about a year providing information about the new market regime and training potential market participants, we suspect that there is (approximately) a year time lag until the effect of DAM emerges (Cicala 2022). Figure 2b illustrates the percentage growth rate of electricity trade of SPP with its neighboring BAs starting in April 2014 when SPP began to systematically record bilateral trade data. Both exporting and importing activities increased after the implementation of DAM, suggesting a more competitive market environment overall. Motivated by these stylized facts, we estimate the causal effect of DAM on CO2 intensities using an event-study, difference-in-differences below.
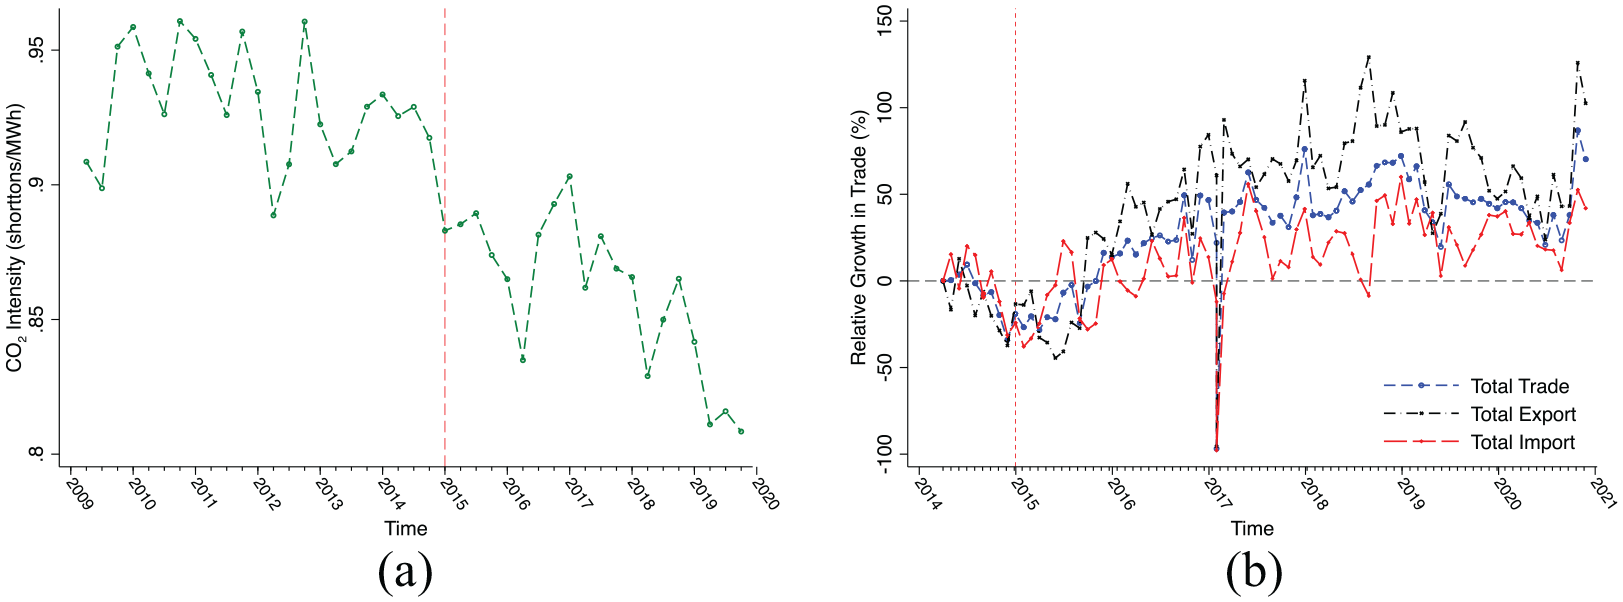
Trend break in CO2 intensity and electricity trade after DAM: (a) average CO2 intensity and (b) growth of electricity trade.
3. Conceptual Framework
The market integration represented by the creation of the day-ahead market (DAM) is driven by a wholesale electricity auction, with dispatch controlled by SPP. Electricity generating units submit hourly quantity-price bids in the auction according to their marginal generation costs, and those who bid below the equilibrium price are dispatched to meet the (projected) market demand by the balancing authority. The intensified competition arising from integrated market system may have a direct effect on the EGUs’ generation efficiency, the composition of EGUs, and/or the retirement of EGUs. In a similar spirit to the sectoral emission intensity decomposition method introduced in Najjar and Cherniwchan (2021), we delineate the potential channels through which the DAM creation can affect emission rates in SPP.
Sectoral Emission Intensity Decomposition
Suppose there is a continuum of g generators in the interval [0, G] where G is the marginal generator. Let e(g) denote the emission level of generator g. The total emissions created by all generators in the economy is

Similarly, the total scale of electricity production is the sum of generation that each generator produces:

where w(g) is the generation from generator g. Hence, the sectoral emission intensity, defined as total emission per load, is

where δ(g) and ϕ(g) are emission intensity and the output share of generator g of total electricity generation, respectively:


Sectoral emission intensity is the weighted average of emission intensities of generators weighted by their output shares. Taking logs and total differentiating emission rates yields
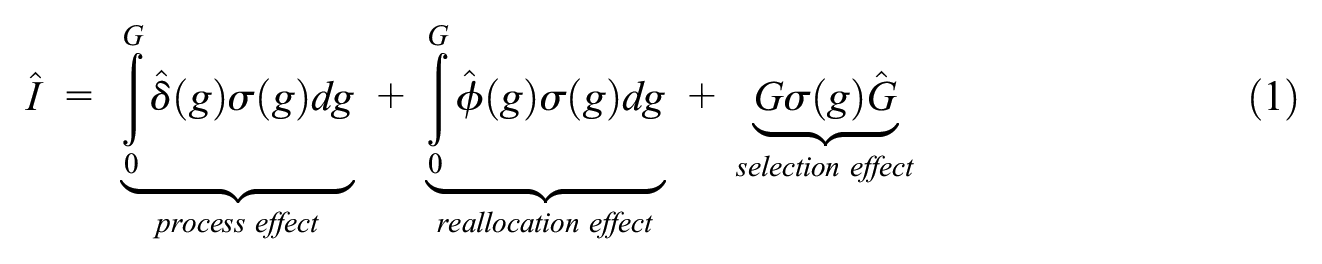
Where
The first term is the EGU-level process effect. The average emission intensity of SPP improves if the emission rates of EGUs decrease. The second term is the reallocation effect meaning that, ceteris paribus, SPP becomes cleaner per MWh, on average, if there exists a composition change within SPP in a way that cleaner EGUs gain market share compared to carbon-intensive EGUs as a result of the DAM. The last term captures the selection effect (i.e., the operation/retirement of the marginal generator) indicating that the DAM would improve sectoral emission intensity if highly emission-intensive and uneconomical EGUs retire, even in the absence of any process and reallocation effects. Hence, the model guides us to test the following hypotheses:
H1: The DAM reduced EGUs’ emission intensity via the improvement of generation efficiency, and/or H2: The market share of cleaner EGUs increased after the introduction of DAM, and/or
H3: The DAM sorted emission-intensive and uneconomical EGUs to retire.
In the next section, we introduce the empirical strategy we adopt to test the above plausible channels through which the integrated market might have affected the environmental accounts of EGUs in SPP.
4. Empirical Methodology
4.1. Data
The empirical analyses we conduct hinge on two main sources of data. First, the information on EGUs’ CO2 emissions, heat inputs (MMBtu) and gross load (MWh) come from the U.S. Environmental Protection Agency’s (EPA) Air Market Programs Database (AMPD). Second, as the AMPD does not report the balancing authority that oversees each EGU, we combine the data with EIA-860 provided by the Energy Information Administration (EIA). We are able to derive aggregate electricity demand and heat input consumption either at the levels of power plant or the balancing authority from these data.
We additionally obtain data on monthly natural gas price by U.S. state from the EIA in order to flexibly control for any change in emission rates arising from price-induced energy portfolio changes independent of DAM. We utilize the EIA-923 database in order to obtain information about the number of fuel varieties and the primary fuel type (by nameplate capacity and prime movers) of power plants. Next, the data utilized in the analyses exclude outliers in CO2 emission (short ton/MWh) and heat rates (MMBtu/MWh) so that the skewness (i.e., close to zero) and kurtosis (i.e., close to three) of the data distribution approximately resembles normal distribution. 11 Lastly, we aggregate to the quarterly level, such that the unit of observation is EGU by quarter.
4.2. Identification of DAM Effects
We conduct a series of difference-in-difference event-study analyses to estimate the dynamic effects on emission rates after the introduction of DAM. The assumptions required for this event-study to yield causal estimates are: (a) the exogeneity of market integration policy of SPP via DAM, (b) the DAM in SPP does not directly affect the dependent variables of the comparison group (i.e., no spillover effects), and (c) a parallel trend in outcomes after controlling for observable confounders between SPP and the comparison group. Given that SPP was part of a nationwide movement toward competitive marketplaces (following PJM, MISO, ERCOT, and others), the creation of the DAM can be taken as exogenous with respect to emission rates.
We select generators in the Pennsylvania, New Jersey, and Maryland interconnection (PJM) as the comparison group since it is also a multi-state balancing authority that shares a reasonably similar energy portfolio to SPP, and at the same time, it is not directly geographically adjacent to SPP and thus free from spatial spillover concerns. 12 PJM has a stable market structure during our sample period, having launched its first wholesale electricity market in 1997 (and as such, any time-invariant effects will be swept into the balancing authority fixed effects).
Table 1 reports the statistical differences in the mean value of the observable characteristics of SPP in comparison to those of PJM from 2009 to 2014, which is the time period prior to the DAM. The mean values are derived from a set of regressions absorbing yearly- and quarterly time trends common to both BAs where the standard errors are clustered at the EGU-level. Importantly, SPP and PJM are similar in average EGU-level CO2 intensities and generation efficiency measured in heat rates. While the event study analysis below will allow for a more direct examination of pre-trends, the similarity in detrended mean values of heat rates and emission rates does show that PJM and SPP are similar along key dimensions pre-DAM. However, Table 1 also shows that each generator in SPP serves a larger market than PJM in terms of average total generation and heat input consumed, as there are fewer but larger EGUs in SPP, which is reflected by the greater market shares compared to those in PJM. Furthermore, SPP experienced relatively lower natural gas prices than PJM prior to the DAM. 13
Differences of SPP Compared to PJM Prior to the DAM.
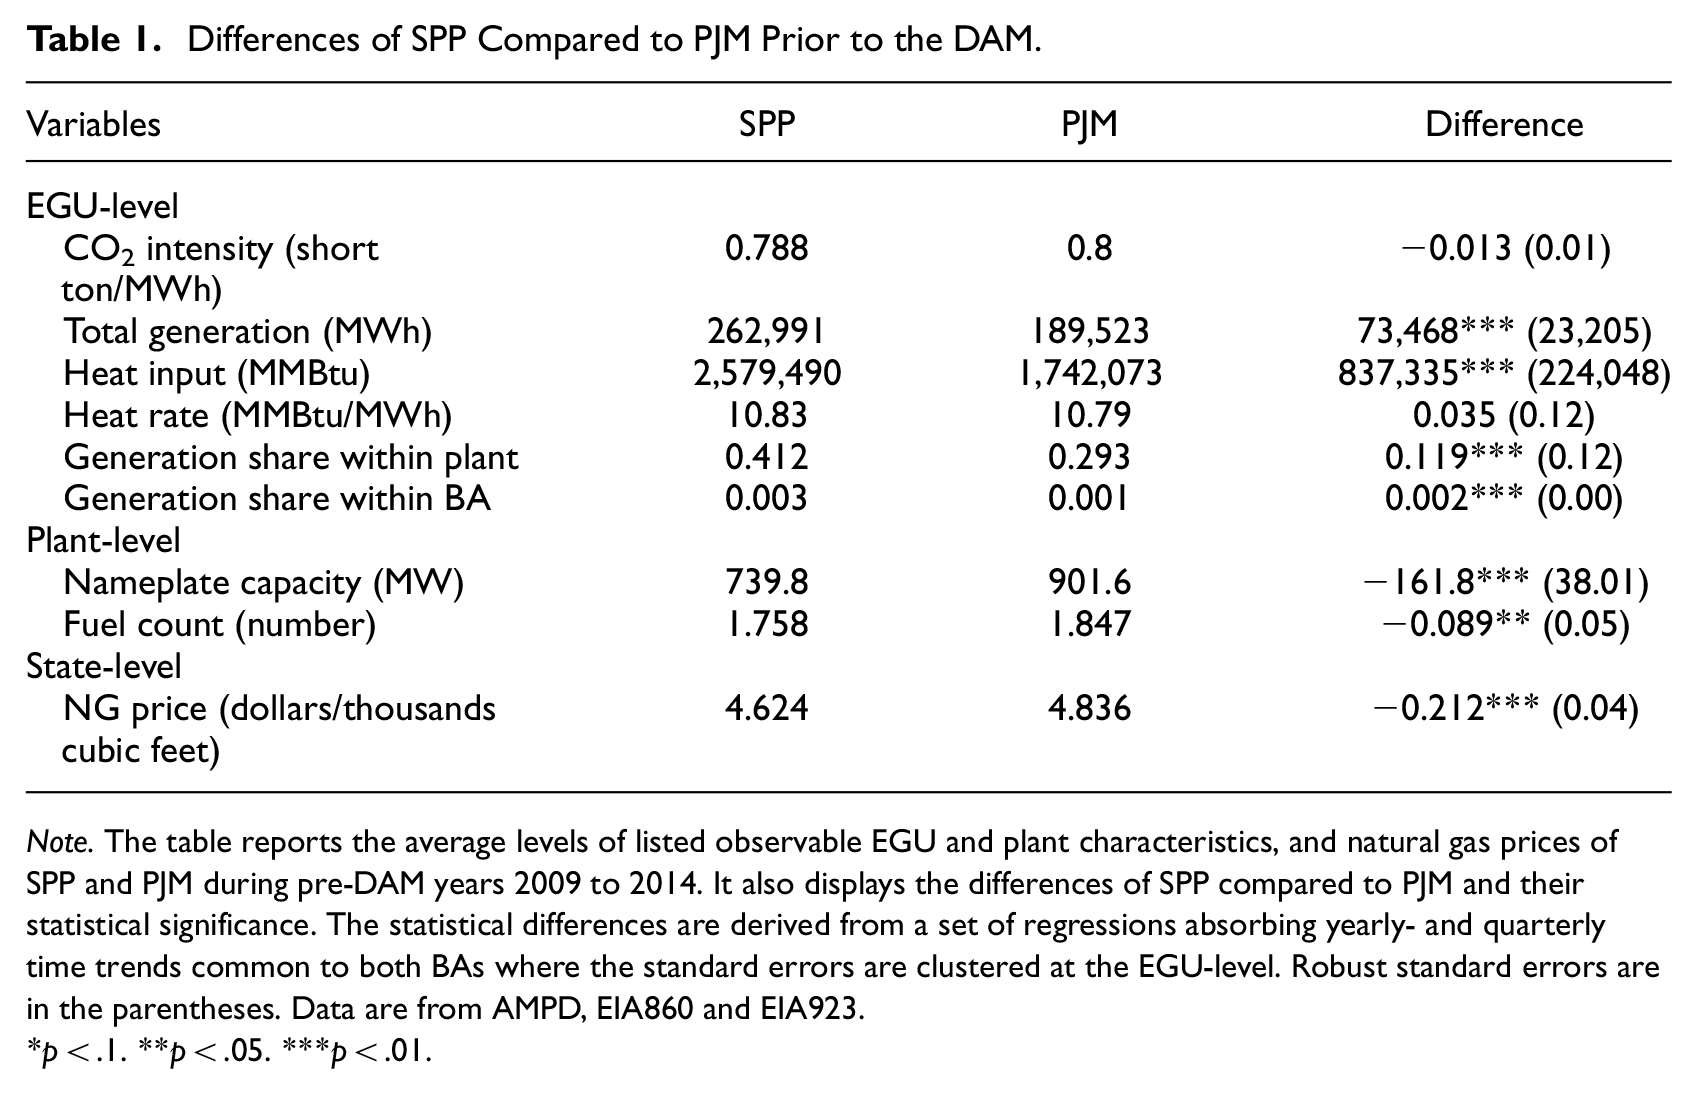
Note. The table reports the average levels of listed observable EGU and plant characteristics, and natural gas prices of SPP and PJM during pre-DAM years 2009 to 2014. It also displays the differences of SPP compared to PJM and their statistical significance. The statistical differences are derived from a set of regressions absorbing yearly- and quarterly time trends common to both BAs where the standard errors are clustered at the EGU-level. Robust standard errors are in the parentheses. Data are from AMPD, EIA860 and EIA923.
p < .1. **p < .05. ***p < .01.
We address the ex-ante heterogeneity of the treatment and comparison groups in three ways. First, we apply the two-way fixed effects method (with controls) in order to control for both observable and unobservable time-invariant BA-specific attributes, as well as time-varying factors commonly applicable to the two BAs that might be correlated with the DAM implementation and the resulting EGU-level environmental accounts. Second, we consider both leads and lags before and after the treatment not only to explore the dynamic effect of the DAM but also to check whether SPP and PJM were on similar pre-trends. Lastly, we apply the Coarsened Exact Matching (CEM) method to only compare observations between the two BAs that are in the same bin of natural gas price for a particular quarter and year due to a potential concern that EGUs’ emissions are highly sensitive (in non-linear ways) to natural gas prices (Cullen and Mansur 2017). We consider the first quarter of the year 2015 as the effective time when the DAM reforms begin to take effect, as SPP spent nearly a year training potential market participants to help them become used to the new market regime. 14 We consider alternative dates of DAM implementation as a robustness check later.
Table 2 shows the summary statistics of the variables used in the empirical analyses. It reveals that EGUs are widely heterogeneous in terms of environmental accounts and load share both within power plants and balancing authorities. It is also clear that the BA-level gross load and the natural gas price vary temporally. The treatment dummy takes the value of one if EGUs belong to SPP while it is equal to zero if they are in PJM. The mean value indicates that a larger share of EGUs are located in PJM in the sample. Due to the rapid growth in wind power in SPP in the later part of the sample (years 2018 and 2019), and the fact that growing wind intermittency can affect emission rates (Kaffine, McBee and Ericson 2020), our main analysis takes the sample period to be 2009 to 2017, with robustness checks to follow below.
Summary Statistics.
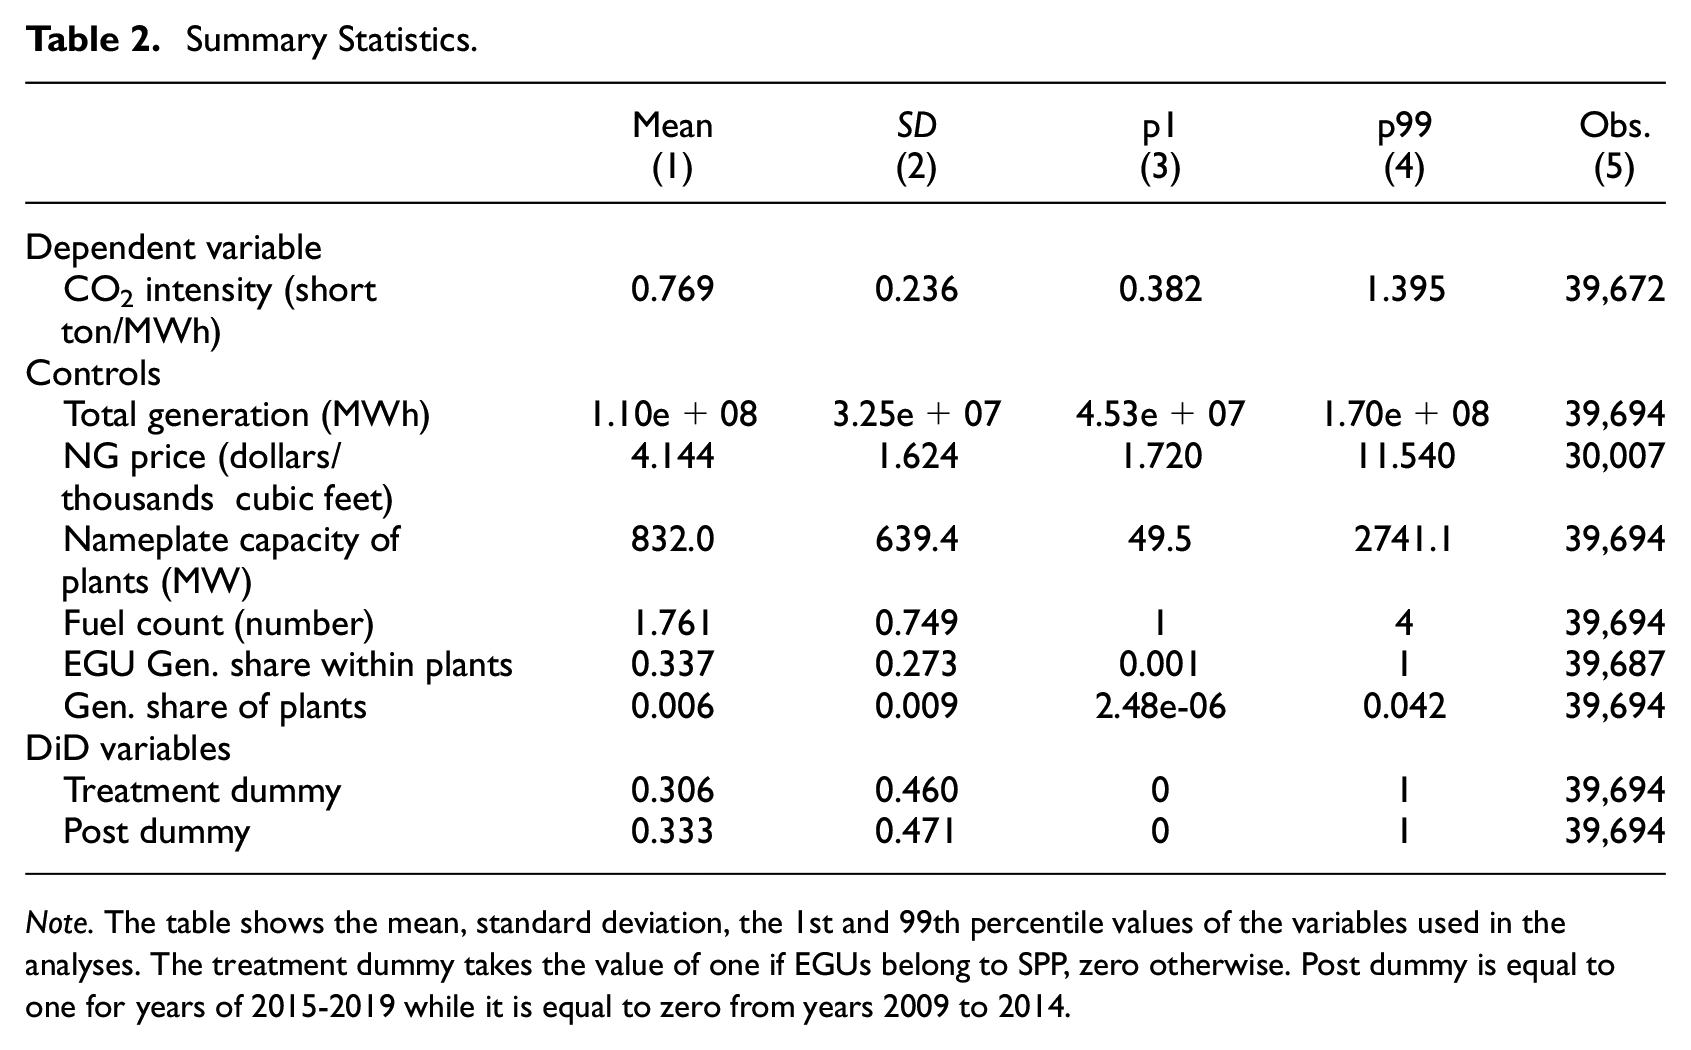
Note. The table shows the mean, standard deviation, the 1st and 99th percentile values of the variables used in the analyses. The treatment dummy takes the value of one if EGUs belong to SPP, zero otherwise. Post dummy is equal to one for years of 2015-2019 while it is equal to zero from years 2009 to 2014.
4.2.1. Dynamic Effects of the DAM
The event-study model we adopt is described as follows:
where ε
ibt
is the emission rate of EGU i in the balancing authority b at time t,
Robust standard errors are clustered at the generator-level to account for serial correlation of EGUs across time. 16 If the DAM reform leads EGUs to be cleaner per MWh on average, we expect β l to be negative and statistically significant in the post-DAM period, but not statistically significant in the pre-DAM period if SPP and PJM are on similar pre-trends.
4.2.2. Difference-in-differences
In addition to the event study analysis above, we adopt a conventional difference-in-difference model (DiD). These DiD causal effects are also used in the structural decomposition per Najjar and Cherniwchan (2021) in Section 6 below. Here, SPP i and DAM t are indicator variables differentiating SPP and PJM EGUs, and quarters before and after the introduction of DAM:

We note here again that we intentionally exclude the EGU i fixed effects to capture the aggregate environmental effect of the DAM (as any change in emission rates could be due to both within or between factors); however, we include it when isolating the process effect. The coefficient of interest β captures the average treatment effect of the DAM and will be reported alongside with the figures obtained from the event-study.
5. Results
5.1 Main Results
Based on the empirical strategies and data described above, we estimate the effect of the DAM on EGU-level emission rates and report results in this section.
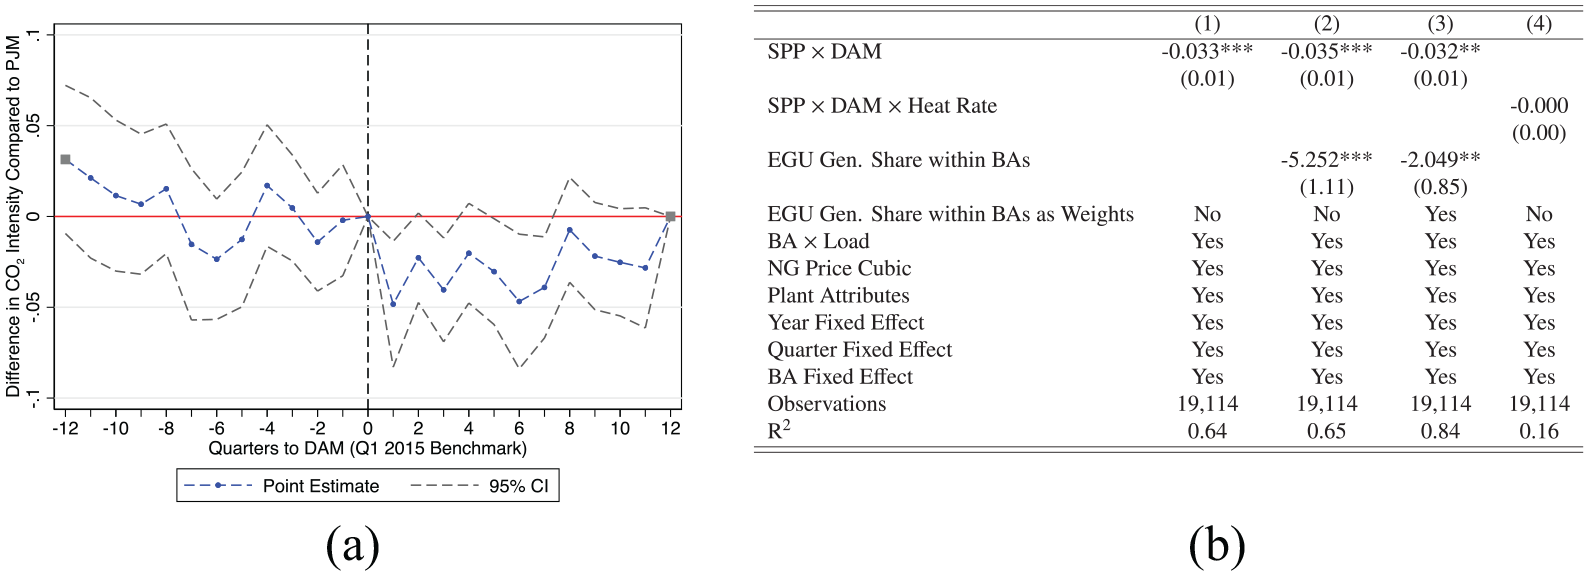
Figure 3a displays the dynamic treatment effects from estimating equation (2), representing the effect of DAM on the average carbon emission intensities (tons/MWh) of EGUs in SPP. The point estimates suggest a roughly 0.04 tons/MWh decline in CO2 emission rates in SPP due to the DAM, relative to baseline emission rate of 0.788 tons/MWh. The pre-DAM estimates, which are statistically indistinguishable from zero, provide evidence that the parallel trend assumption holds. The negative post-DAM estimates show that EGUs in SPP became cleaner per MWh, on average, after the DAM.
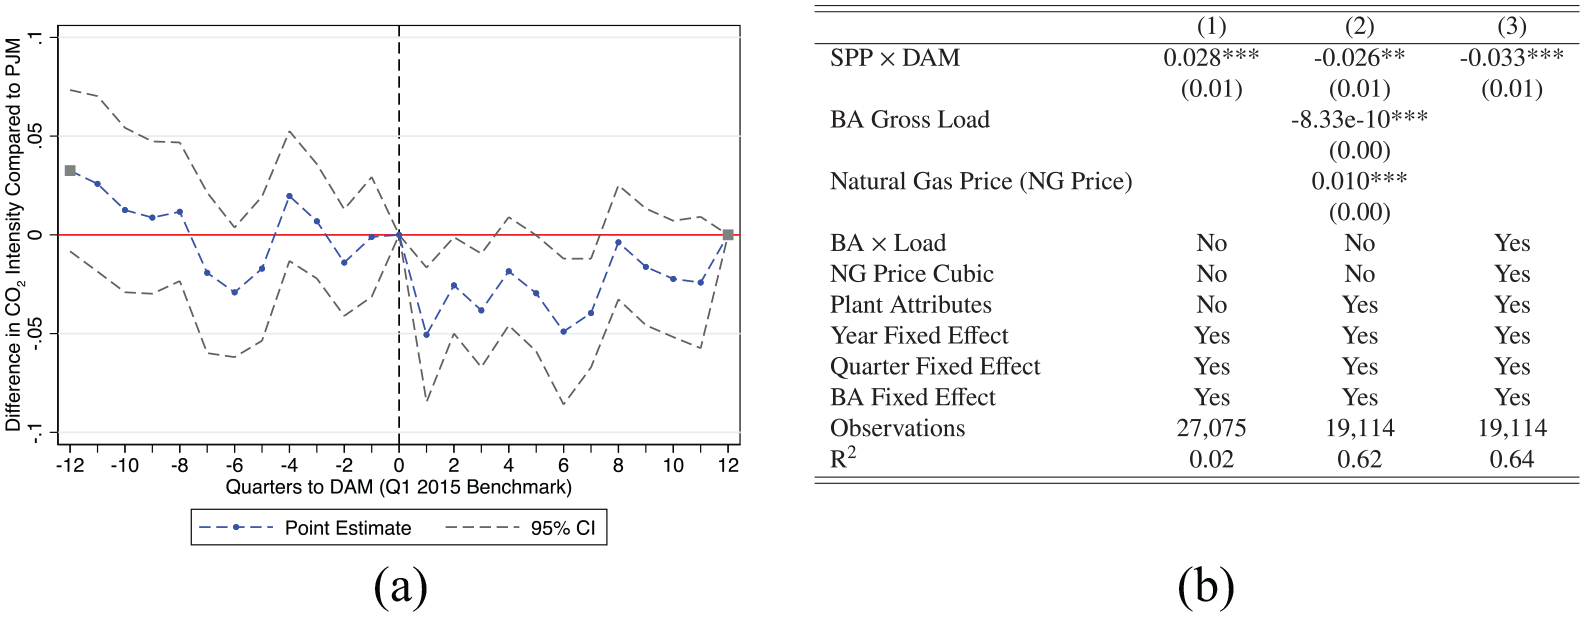
All effects: (a) dynamic effects and (b) average effect of DAM.
Figure 3b reports the difference-in-difference estimation results of equation (3). The first column estimates the change in emission rates in SPP due to DAM with time and BA fixed effects, but no controls, finding a 0.028 tons/MWh increase in emission rates—this suggests that, unconditionally, while SPP emission rates fell post-DAM, PJM emission rates fell even faster. Given the importance of changing natural gas prices during this period, natural gas price, gross load at the BA level, and other plant attributes (major fuel type and prime movers for each plant) are included as controls in the second column, finding estimated reductions in emissions of 0.026 tons/MWh The final column reports our preferred specification where we additionally allow for flexibility in natural gas prices (cubic per Fell and Kaffine [2018] and Cullen and Mansur [2017]) and allow for differential load effects by BA. In this specification, on average EGUs in SPP emit 0.033 fewer tons of carbon dioxide per MWh (approximately 4 percent reduction in carbon emission rates) after the DAM. Considering the fact that SPP’s average annual production of electricity from 2015 to 2019 is approximately 232,400 GWh, the back-of-the-envelope calculation of carbon-saving is 7.66 million tons of CO2 per year, which is equivalent to $383.4 million nominal US dollars annually after applying a $50/ton of social cost of carbon.
5.2. Channels
Next, we decompose the channels (process, reallocation, or selection) by which the DAM led to the reduction in emission rates in SPP. We first isolate the process effect, which occurs if the DAM improves emission rates of EGUs either via the enhancement of generator efficiency (e.g., fuel use per unit of electricity produced), the rationalization of boilers within EGUs toward less carbon-intensive fuel sources, and/or the shutoff of pollution-emitting boilers. We include EGU fixed effects to capture within-EGU variation as a measure of the process effect. Secondly, we consider the reallocation effect, which arises if the DAM reallocates the share of load toward relatively “cleaner” EGUs. To quantify the effect, we take the generation shares of EGUs within BAs into account. If the reallocation effect is important for the overall DAM effect, we anticipate an attenuated emissions intensity estimate compared to the baseline results, once we control for any changes in market shares. Finally, we capture the magnitude of the selection effect as the remaining treatment effect after controlling for the reallocation and the process effect, as well as examine retirement data for evidence of generator exit post-DAM.
The Process Effect
Isolating the process effect is straightforward—essentially we want to determine if individual generators improved their overall efficiency post-DAM. To capture within-EGU variation in emission rates, EGU fixed effects are included in the regression model.
Figure 4a reveals that controlling for time-invariant characteristics of EGUs yields relatively similar emission intensity estimates in both the pre- and post-DAM period, with perhaps a slight decline in emissions intensity post-DAM attributable to the process effect. The second column of Figure 4b quantifies the extent to which the process effect influences emission rates. It shows that the average emission rate of EGUs in SPP diminishes in the post-DAM period by 0.01 tons/MWh (roughly 30% of the full effect with all three channels shown in Column (1)); however, it is not statistically significant.
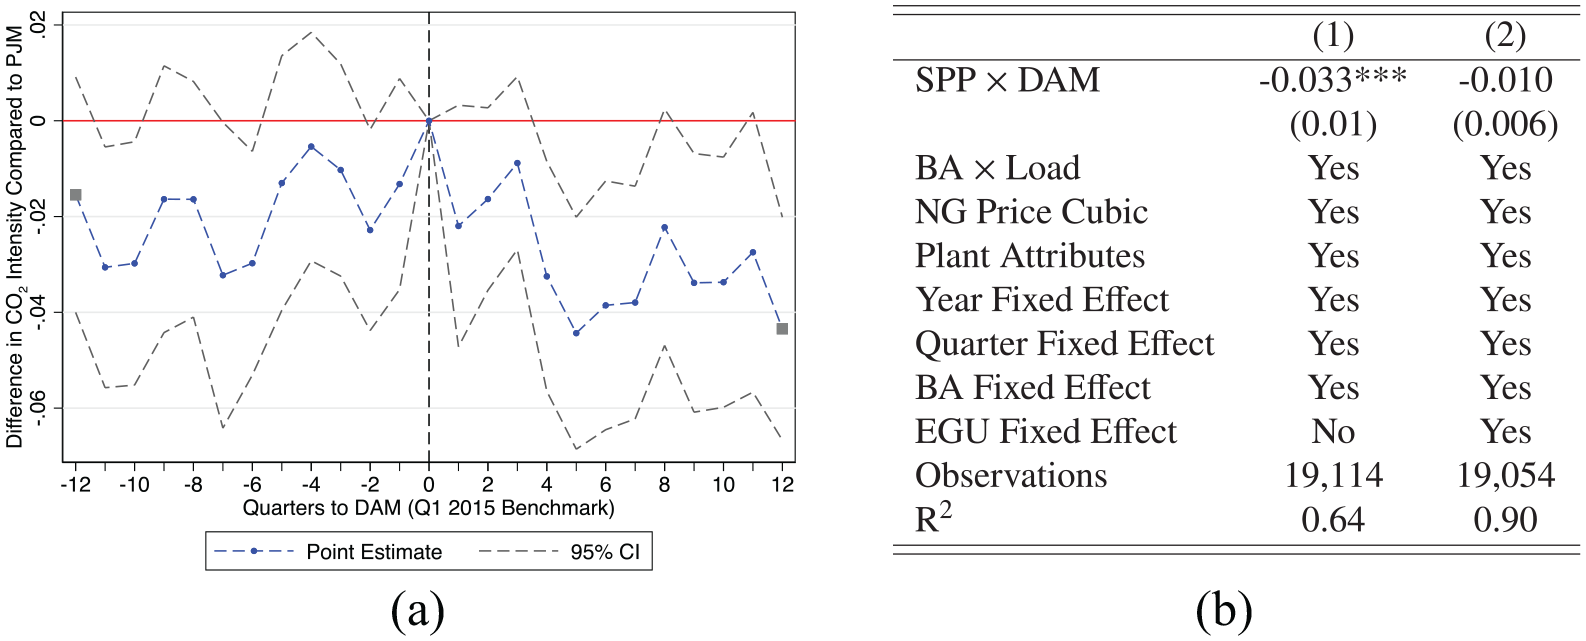
Isolating the process effect: (a) dynamic effects and (b) average effect of DAM.
The Reallocation Effect
Given that the process effect played a modest role at best in affecting average emission rates of EGUs in SPP post-DAM, the remaining channels attributable to the reduction in sectoral emission rates due to DAM are the reallocation and selection effects. Thus, we next control for any reallocation effects of the DAM arising from the changes of market share of EGUs. To do so, we not only control for the EGUs’ generation shares to BA-level total generation to absorb any potential variations in EGUs’ emission rates via the changes in market shares, but we also consider the market shares of EGUs as weights to assess their influence on the overall changes in sectoral emission rates following the DAM.
Figure 5a displays the average dynamic effect of the DAM after controlling for the change in emission rates arising from differences/changes in EGUs’ market shares within BAs. The event study figure, which controls for reallocation effects via market share controls, closely resembles the figure displaying the total DAM effect (Figure 3a). This suggests that there is limited evidence for reallocation effects: if the changes in emission rates at the sectoral level were primarily driven by the shift in generation shares among EGUs, we would expect to observe changes in the total effect when controlling for the market shares of EGUs. Similarly, difference-in-difference estimates in Figure 5b controlling for market share find little evidence for the reallocation effects: estimates in columns (2) and (3) are nearly identical to the total DAM estimates in Column (1). The second column reports the average treatment effect of the DAM on emission rates, controlling for market shares of EGUs whereas the third column weights by generation share within BA, in addition to controlling for market share.
Examining the reallocation effect: (a) dynamic effects and (b) average effect of DAM.
To address potential concerns regarding the use of market shares of EGUs as a control variable—given the possibility that the treatment could have influenced both the outcome and the market shares concurrently—we directly examine whether changes in market shares post-DAM are contingent upon the generation efficiency of EGUs, as measured by their heat rates (i.e., heat input consumption [MMBtu] per MWh). The final column, therefore, directly estimates whether market share (i.e., the load share of each EGUs per total BA-level load) changes occur after the DAM, specifically examining whether there is a decrease in market shares of inefficient EGUs in SPP as indicated by their heat rates. The point estimate on the interaction between the DiD term and heat rate indicates a very small differential reduction in average market share for high heat rate EGUs post-DAM, and it is statistically insignificant. Across all specifications, our findings suggest limited evidence that the DAM has led to a redistribution of market shares among existing EGUs toward more efficient entities. 17
The Selection Effect
Given the absence of strong evidence for process and reallocation effects, the findings thus far indicate that the post-DAM reduction in emission intensity in SPP is primarily driven by the selection effect. One interpretation is that emission rates in SPP decreased as the integrated market system encouraged electricity trade between market participants. This in turn created competition with the wholesale auction process effectively inducing uneconomical and “dirtier” EGUs to retire.
To further support this interpretation (which, to be clear, is based entirely on the “leftover” treatment effect after controlling for the other two channels), we next consider the retirements of EGUs in SPP in the wake of DAM. If selection is the key channel at play, we would expect a substantial increase in retirements of dirty EGUs post-DAM.
5.3. EGU Selection After DAM
We next consider the quantity and type of EGU retirements over time in SPP and PJM. We first examine the total (cumulative) number of EGUs that stopped operating over the last decade in SPP in comparison to PJM.
Figure 6 shows that SPP experienced a sharp increase in the number of retired EGUs after the DAM, which stands in stark contrast with PJM where the retirements of EGUs took place at a much more steady rate over time. The national trend (SPP retirees excluded) in retirements similarly shows a steady rate of retirements over time. This suggests that the uptick in SPP EGU retirements after DAM is unlikely to be explained by national factors; for example, lowered natural gas prices or environmental regulations (Linn and McCormack 2019). We also see that a particularly sharp and frequent increase in EGU selection began from the fourth quarter of 2015, suggesting the presence of potential time lag until EGU owners actively decided to retire their uneconomical units.
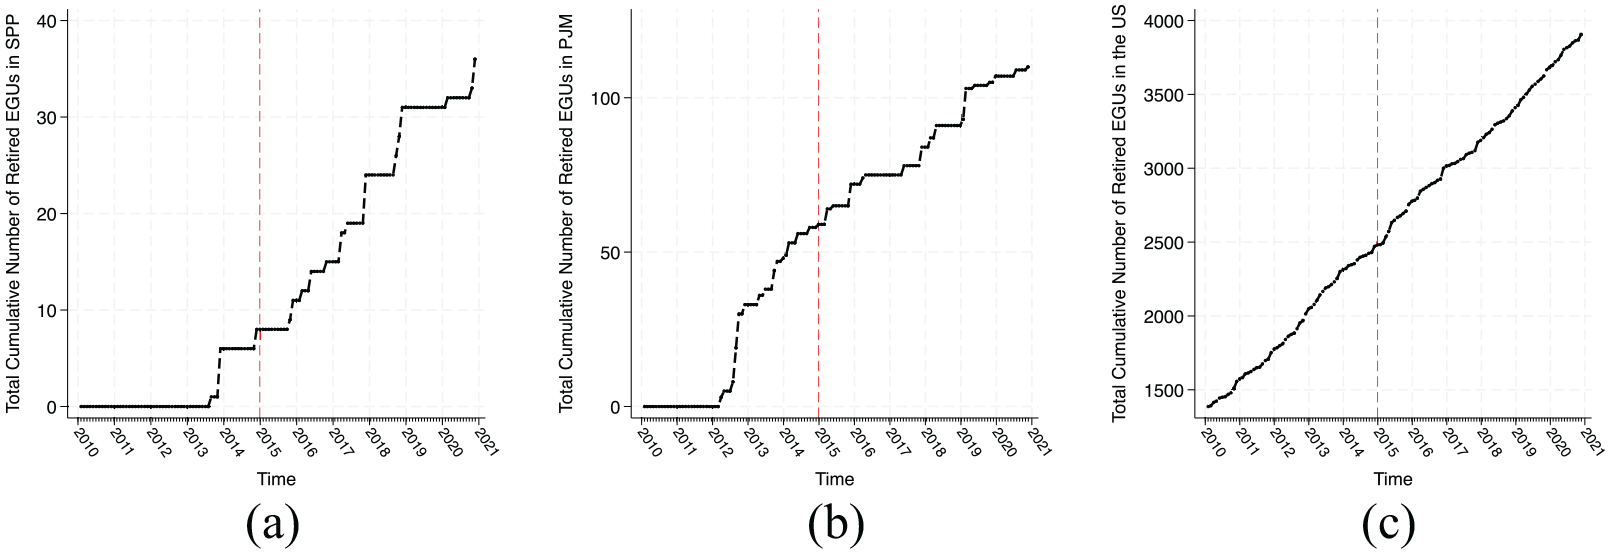
Total cumulative retired EGUs: SPP versus PJM: (a) SPP, (b) PJM, and (c) nationwide trend.
Figure 7 shows the attributes of retired EGUs by their fuel types and prime movers (e.g., CANG: EGUs using combined cycle steam boilers fueled by natural gas; CTNG: Combined cycle combustion turbine-based EGUs using natural gas; STNG: EGUs supported by steam boilers using natural gas; STBIT: EGUs using steam turbines fueled by bituminous coal; STSUB: EGUs using steam turbines fueled by sub-bituminous coal).
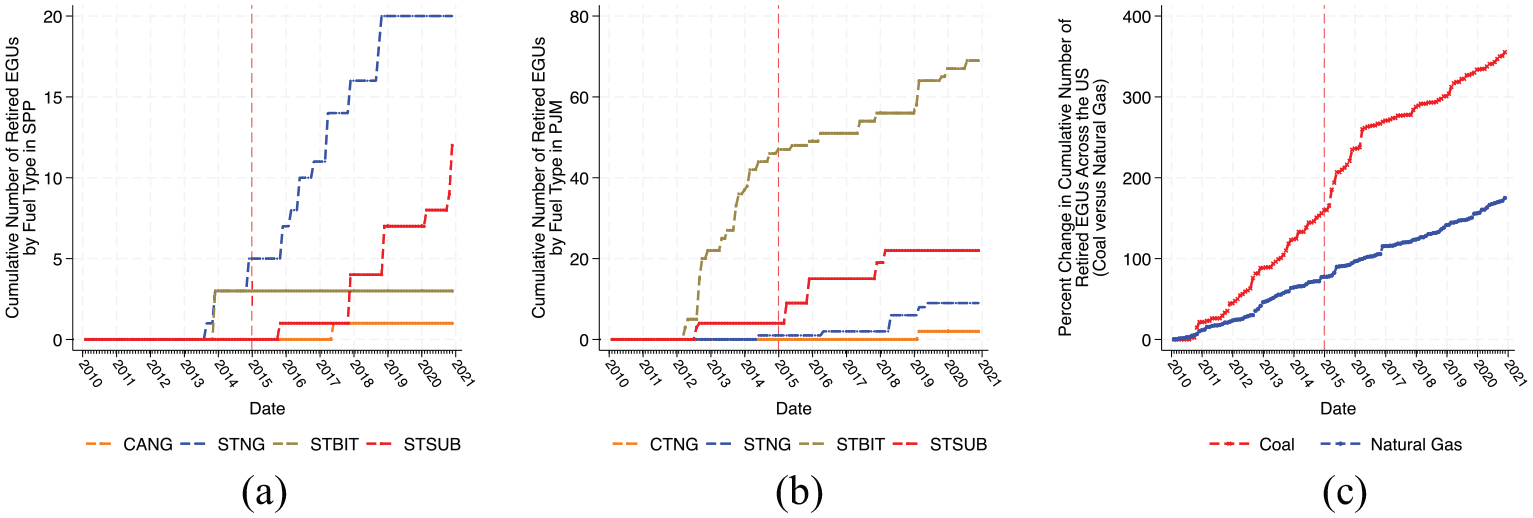
Cumulative retired EGUs by fuel type: SPP versus PJM: (a) SPP, (b) PJM, and (c) nationwide trend.
SPP and PJM have clearly different retirement trends by fuel type, with PJM retirements (a) consisting of primarily EGUs using steam turbines fueled by bituminous coal and (b) no sharp trend changes in 2015. The nationwide trend in retirement, which is quantified as the percentage change in the total cumulative number of retirees in the US relative to the year 2010, can be separated into retirements of coal units versus natural gas units. The rest of the country sees substantial retirements of coal (particularly during 2014–2016), with a smaller but steady pattern of natural gas retirements over time. By contrast, EGUs in SPP utilizing natural gas steam turbines began to rapidly retire in the post-DAM period. The fact that natural gas generators are retiring in SPP strongly suggests that the post-DAM decline in emission intensity is not being driven by fracking and natural gas prices.
Are the Retirees Dirtier and Less Efficient per MWh Than the Non-retirees?
An increase in retirements post-DAM is not, on its own, indicative of a selection effect on emission rates—it also must be the case that those retired EGUs are dirtier than the remaining EGUs. We next compare carbon and heat rates of retired and non-retired EGUs in SPP. Furthermore, we separate retired EGUs into those that retired prior to DAM and those retired post-DAM.
Table 3 reports average CO2 emission and heat rates across time of retired and non-retired EGUs. It indicates that retirees exhibit, on average, higher emission rates (dirtier) and heat rates (less-efficient) compared to non-retirees. We do not observe evidence that EGUs retired in the post-DAM period are particularly dirtier and less productive than those that retired in the pre-DAM period. This suggests that the market reform may have expedited the retirement process for the most unproductive and carbon-intensive EGUs, and it is this expedited retirement of dirty and inefficient plant that drives the selection effect.
Retirees Versus Non-retirees.
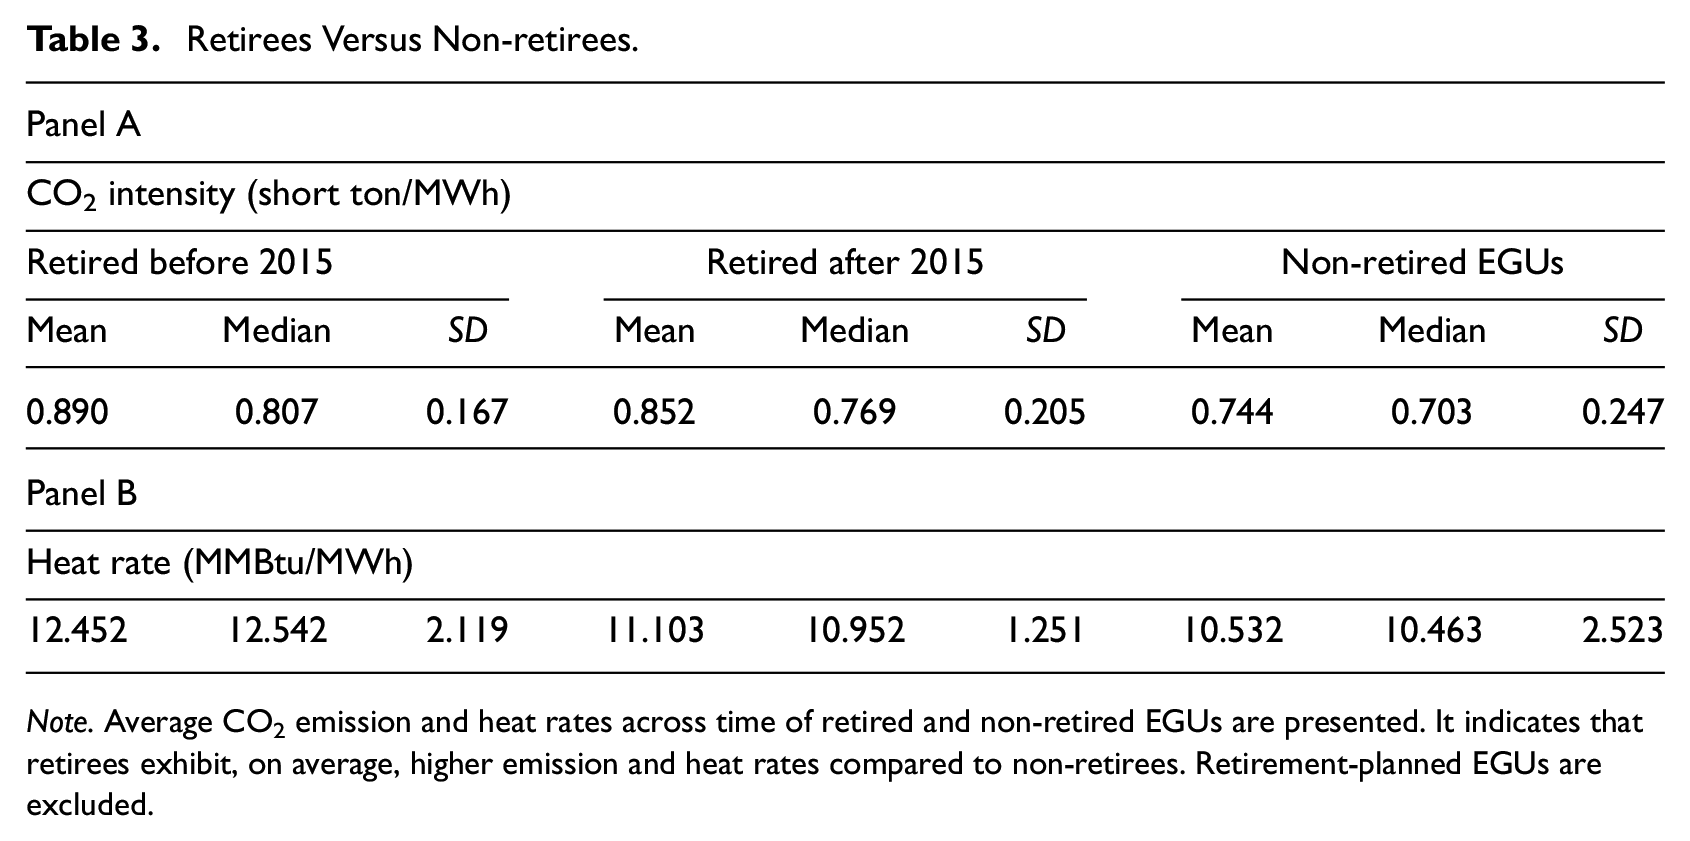
Note. Average CO2 emission and heat rates across time of retired and non-retired EGUs are presented. It indicates that retirees exhibit, on average, higher emission and heat rates compared to non-retirees. Retirement-planned EGUs are excluded.
5.4. Mixed-fuel Plants Versus Single-fuel Plants
We have thus far found that the environmental effects of the DAM arise from the selection effect of dirtier and uneconomical units due to intensified competition. In theory, we might expect that selection follows a straightforward process where the most uneconomical EGUs retire based solely on merit-order considerations. In practice however, there may be practical transmission constraints and other considerations that might lead different types of plants to be more responsive. For example, it is possible that power plants utilizing multiple energy varieties (i.e., mixed-fuel plants) may respond more elastically to the intensified competition in the open market place in comparison to those relying just on a single source of energy (i.e., single-fuel plants).
Figure 8 illustrates heterogeneous average treatment effect of the DAM on emission rates for the mixed- and single-fuel power plants. It shows that most of the estimated reduction in emission intensity due to the DAM arises within mixed-fuel plants: a 0.051 tons/MWh reduction in emissions intensity for generators in mixed-fuel fuel power plants. This is suggestive that plants with diverse energy portfolios reacted more elastically to the DAM by retiring relatively more carbon-intensive and less productive units compared to single-fuel plants. While we found modest evidence (at best) of a process effect for the full sample, we next examine if generation units within the mixed-fuel plants become more efficient via the process effect.
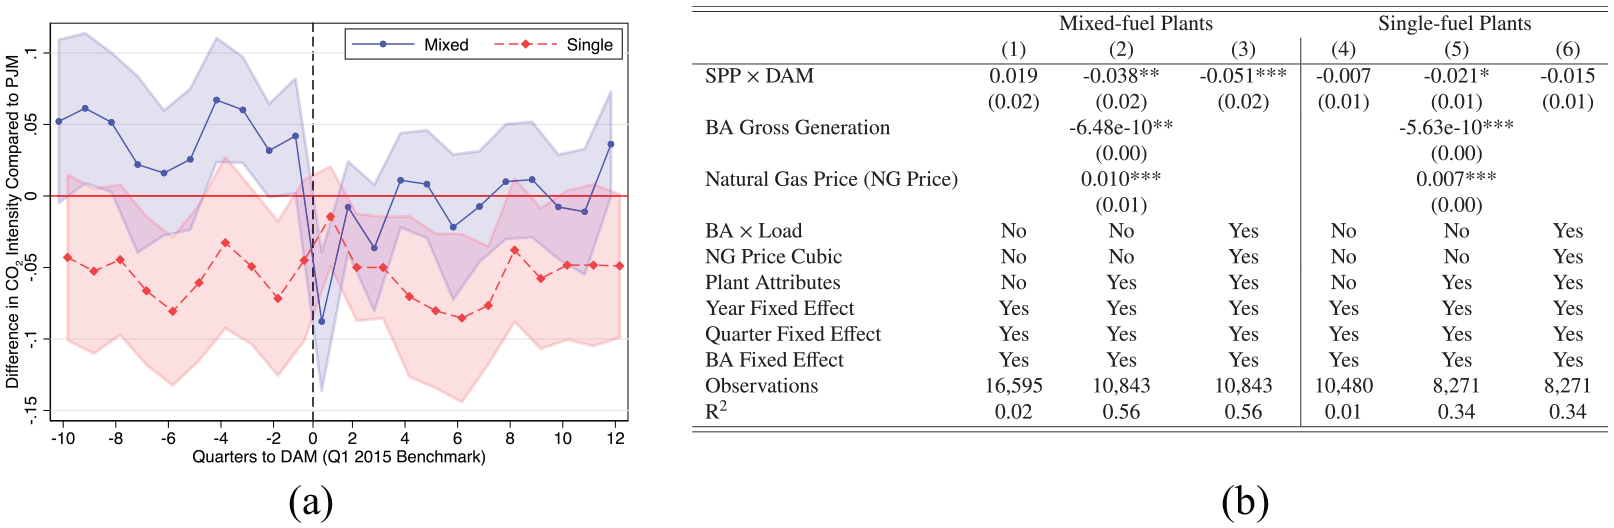
All effects: Mixed versus single fuel plants: (a) dynamic effects and (b) average effect of DAM.
By including EGU fixed effects, we again isolate the process effect in Figure 9. We find modest evidence that the DAM induced improvement in generation efficiencies of EGUs in mixed-fuel plants, with a 0.014 tons/MWh reduction in emissions intensity, but similar to the full sample, the estimate is not statistically significant. Finally, we examine any reallocation effects within mixed-fuel plants after the DAM.
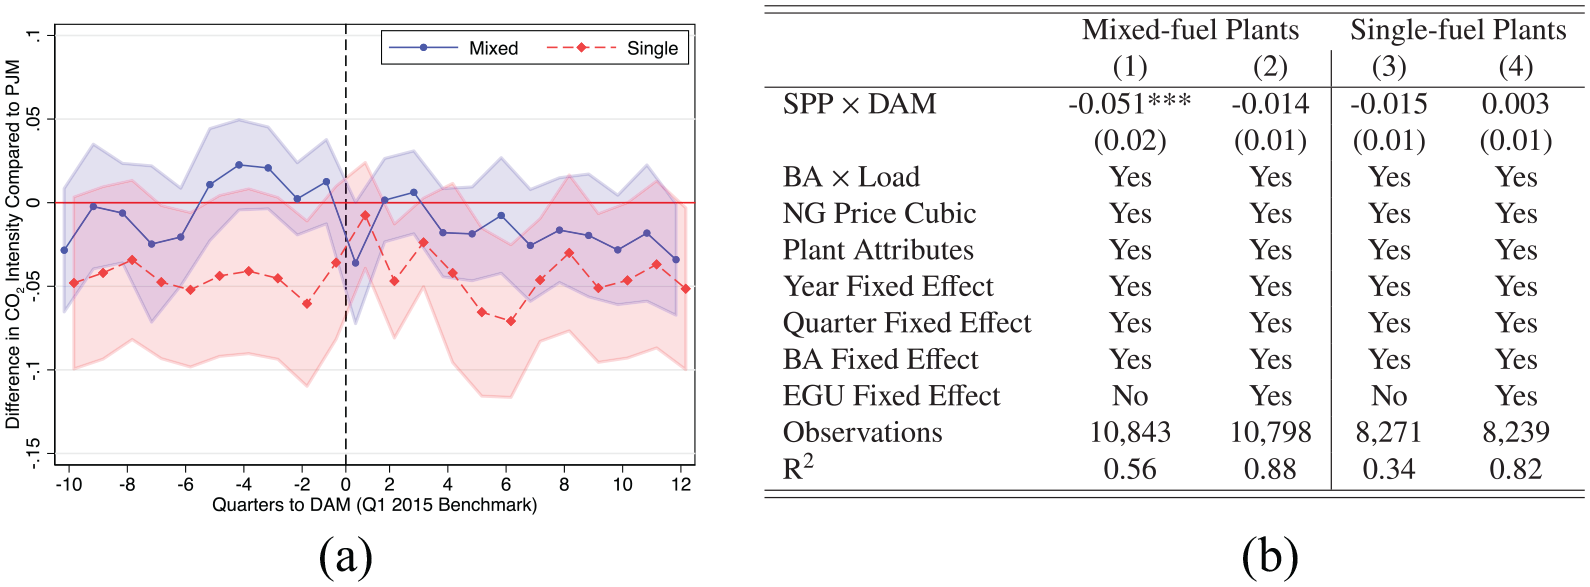
Process effect: Mixed versus single fuel plants: (a) dynamic effects and (b) average effect of DAM.
Figure 10a shows the dynamic changes of average emission rates of EGUs both in mixed and single-fuel plants after controlling for market share. We additionally investigate the change of weighted average of emission rates after the DAM which is presented in columns (3) and (6) of Figure 10b by the types of plants. Both results tell us that the DAM did not induce a meaningful reallocation of market shares toward efficient and thus “cleaner” units within mixed-fuel plants. We therefore conclude that the retirement of EGUs within mixed-fuel power plants in the post-DAM period is the primary channel through which the DAM reduced SPP’s average emissions intensity.
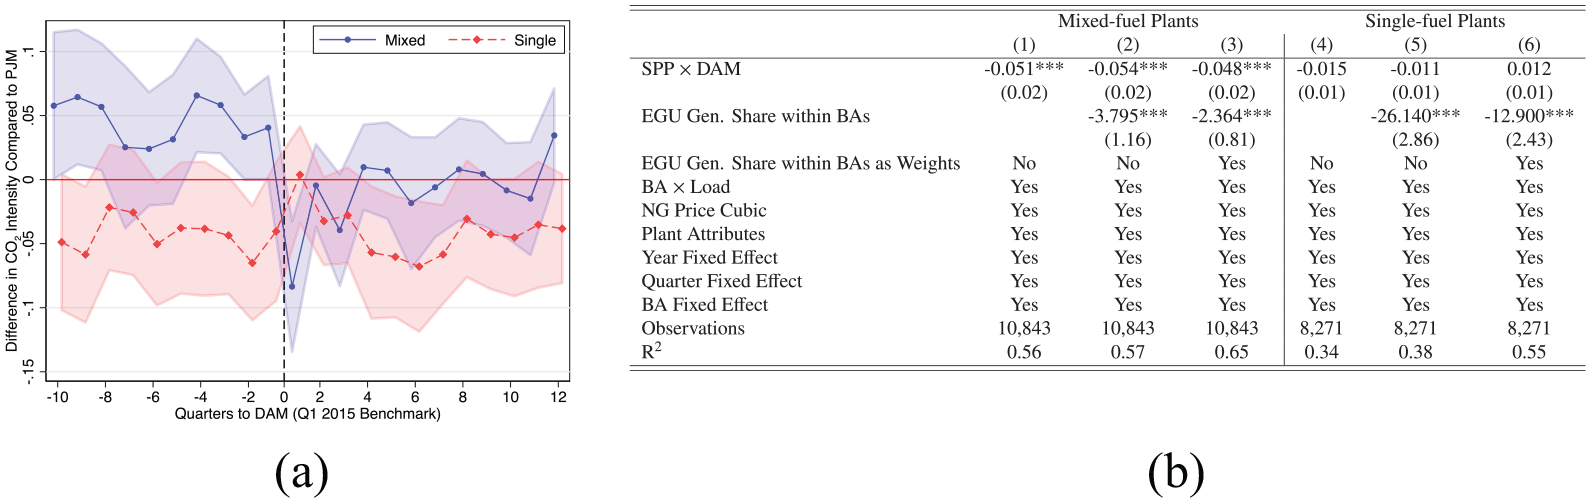
Reallocation effect: Mixed versus single fuel plants: (a) dynamic effects and (b) average effect of DAM.
5.5. Robustness Checks
5.5.1. Incorporation of Integrated System
The DiD and event study estimates we report are valid if there are no other changes that take place at the same time as the implementation of DAM. One potential concern is that the spatial footprint of SPP expanded in the 4th quarter of 2015 due to the incorporation of the Western Area Power Administration’s Upper Great Plains Region, Basin Electric Power Cooperative, and Heartland Consumers Power District (referred to as the Integrated System, IS). The IS entities has revealed their intention to join SPP in early 2014, and received full membership in October, 2015. The inclusion of IS entities’ memberships added over 5,000 MW of peak demand and 9,848 miles of high-voltage transmission lines, which was an 18 percent increase in the number of SPP-managed transmission lines to 58,316 miles.
To ensure this expanded SPP footprint does not confound our estimates of the DAM, we conduct two tests: First, we exclude IS entities from the sample and only include SPP plants pre- and post-DAM, and second, we treat the IS entities as if they belonged to SPP and not the Western Area Power Administration (WAPA) all along. Table 4 shows that there is little change in estimates when we either exclude the IS entities from the sample (columns (2), (6), and (10)) or we include IS entities as if they were SPP (columns (3), (7), and (11)). 18
Robustness Check – Integrated System Membership and Planned Retirements.
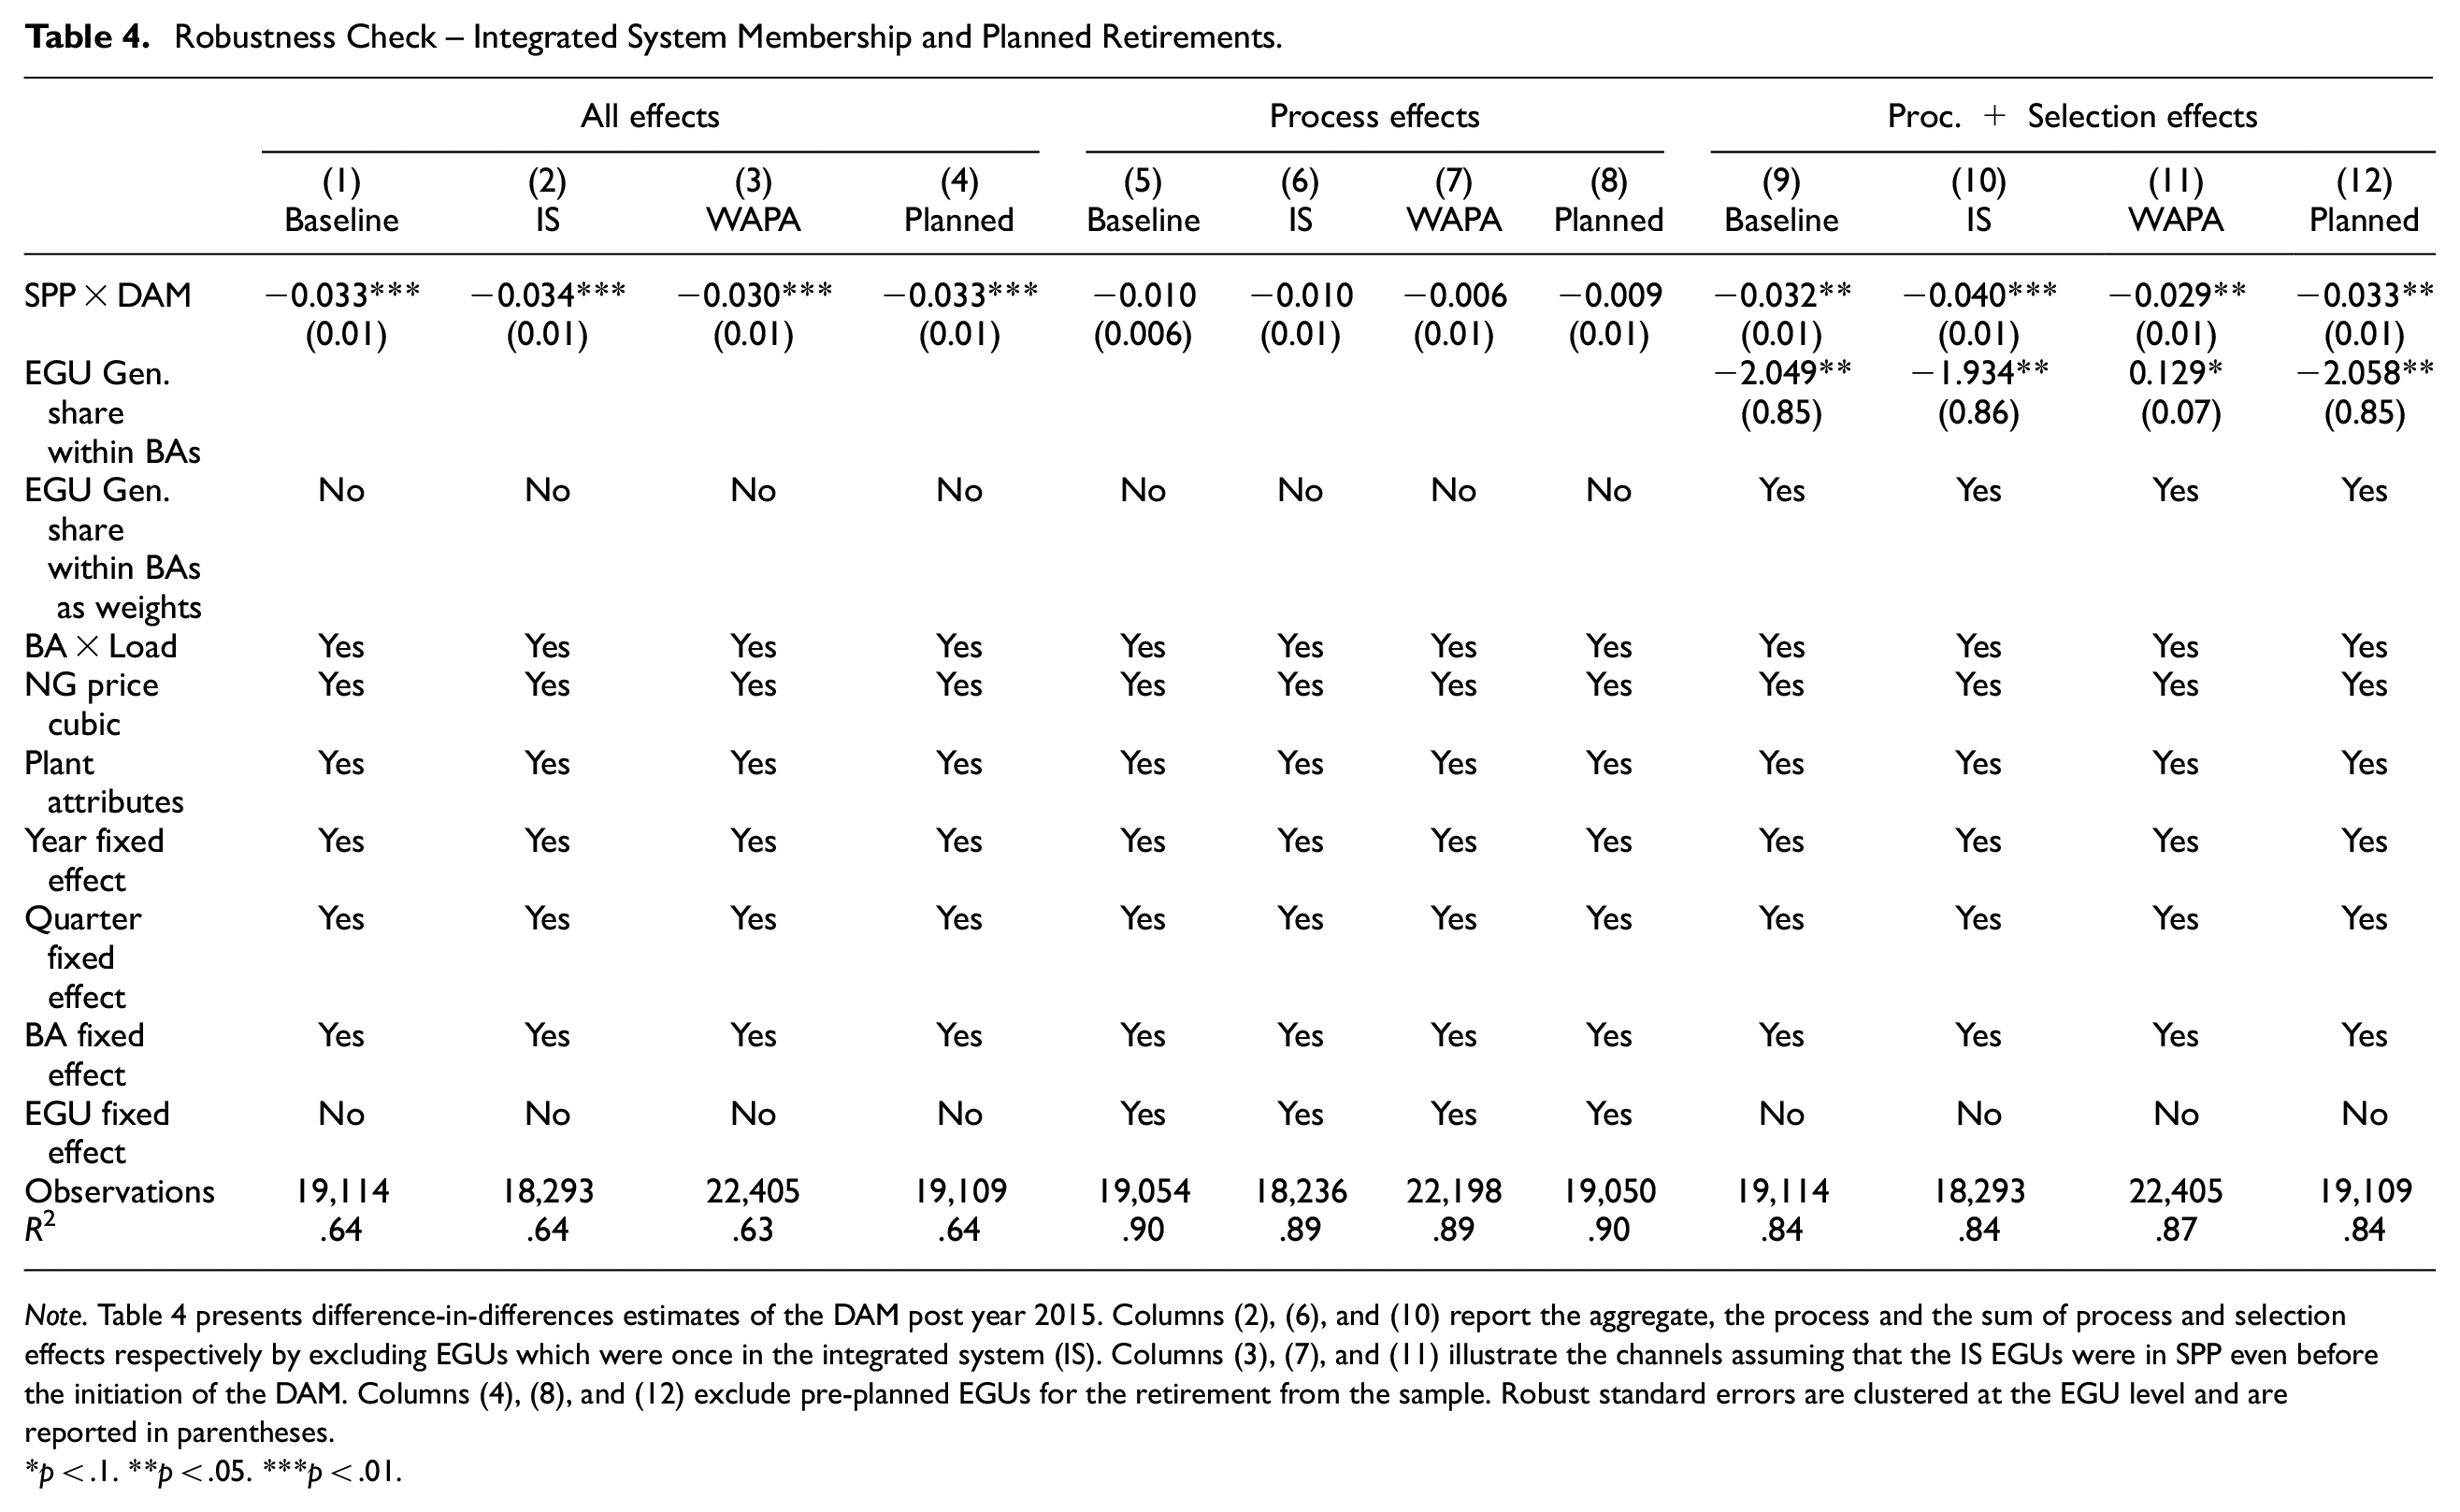
Note. Table 4 presents difference-in-differences estimates of the DAM post year 2015. Columns (2), (6), and (10) report the aggregate, the process and the sum of process and selection effects respectively by excluding EGUs which were once in the integrated system (IS). Columns (3), (7), and (11) illustrate the channels assuming that the IS EGUs were in SPP even before the initiation of the DAM. Columns (4), (8), and (12) exclude pre-planned EGUs for the retirement from the sample. Robust standard errors are clustered at the EGU level and are reported in parentheses.
p < .1. **p < .05. ***p < .01.
5.5.2. Exclusion of Retirement-planned EGUs
We find that the retirement of carbon-intensive and uneconomical units plays a pivotal role in improving emission rates in SPP. However, some EGUs that retired in the post-DAM period may have already planned to retire, regardless of the actual implementation of the policy. Therefore, we conduct the analyses by excluding EGUs with planned retirements. We use EIA-860 (2011) data showing those EGUs that operated until 2011 and planned to retire afterwards. Our sample includes those EGUs that did not plan to retire as of 2011, but did in fact retire during the sample period (2009–2017), as well as those plants that remained operating through the time period. Table 4 reports that our key findings still hold when the retirement-planned EGUs are removed from the sample (columns (4), (8), and (12)).
5.5.3. Alternative Specifications
We additionally conduct several alternative specifications to verify the robustness of the findings reported above. Recall that our main specification relies upon several features such as (a) standard errors are clustered at the generator level, (b) assuming that a time lag “learning period” exists until the policy effect truly arises, (c) the last two years of the sample (i.e., years 2018 and 2019) are truncated due to the concern of rapidly emerging renewable energy sources in SPP during that time period, (d) the use of CEM to better compare between treatment and control BAs, (e) the quarterly average of outcome and control variables is the unit of observation, and (f) the use of natural gas price to control for coal-to-gas switching.
We now relax these assumptions. First, we cluster the standard error at the plant level due to the possibility of serial correlations between EGUs within power plants, finding slightly larger standard errors, though estimates are still statistically significant. Second, we start the DAM at the actual date when the integrated market system launched (Q2 2014). 19 We observe from the third column of the table that the average effect of the DAM is relatively unchanged—though the dynamic estimates in the event figure (Figure 3) provide stronger evidence for the existence of a “learning period.” Third, instead of truncating the sample time period to 2009–2017, we use the full sample including years 2018 and 2019 incorporating BA-level quarterly wind generation as a control variable, yielding results that are qualitatively similar to the baseline results. 20 Fourth, we recover similar results to the baseline results when we do not apply the CEM method as shown in Column (5; Table 5).
Alternative Specifications.
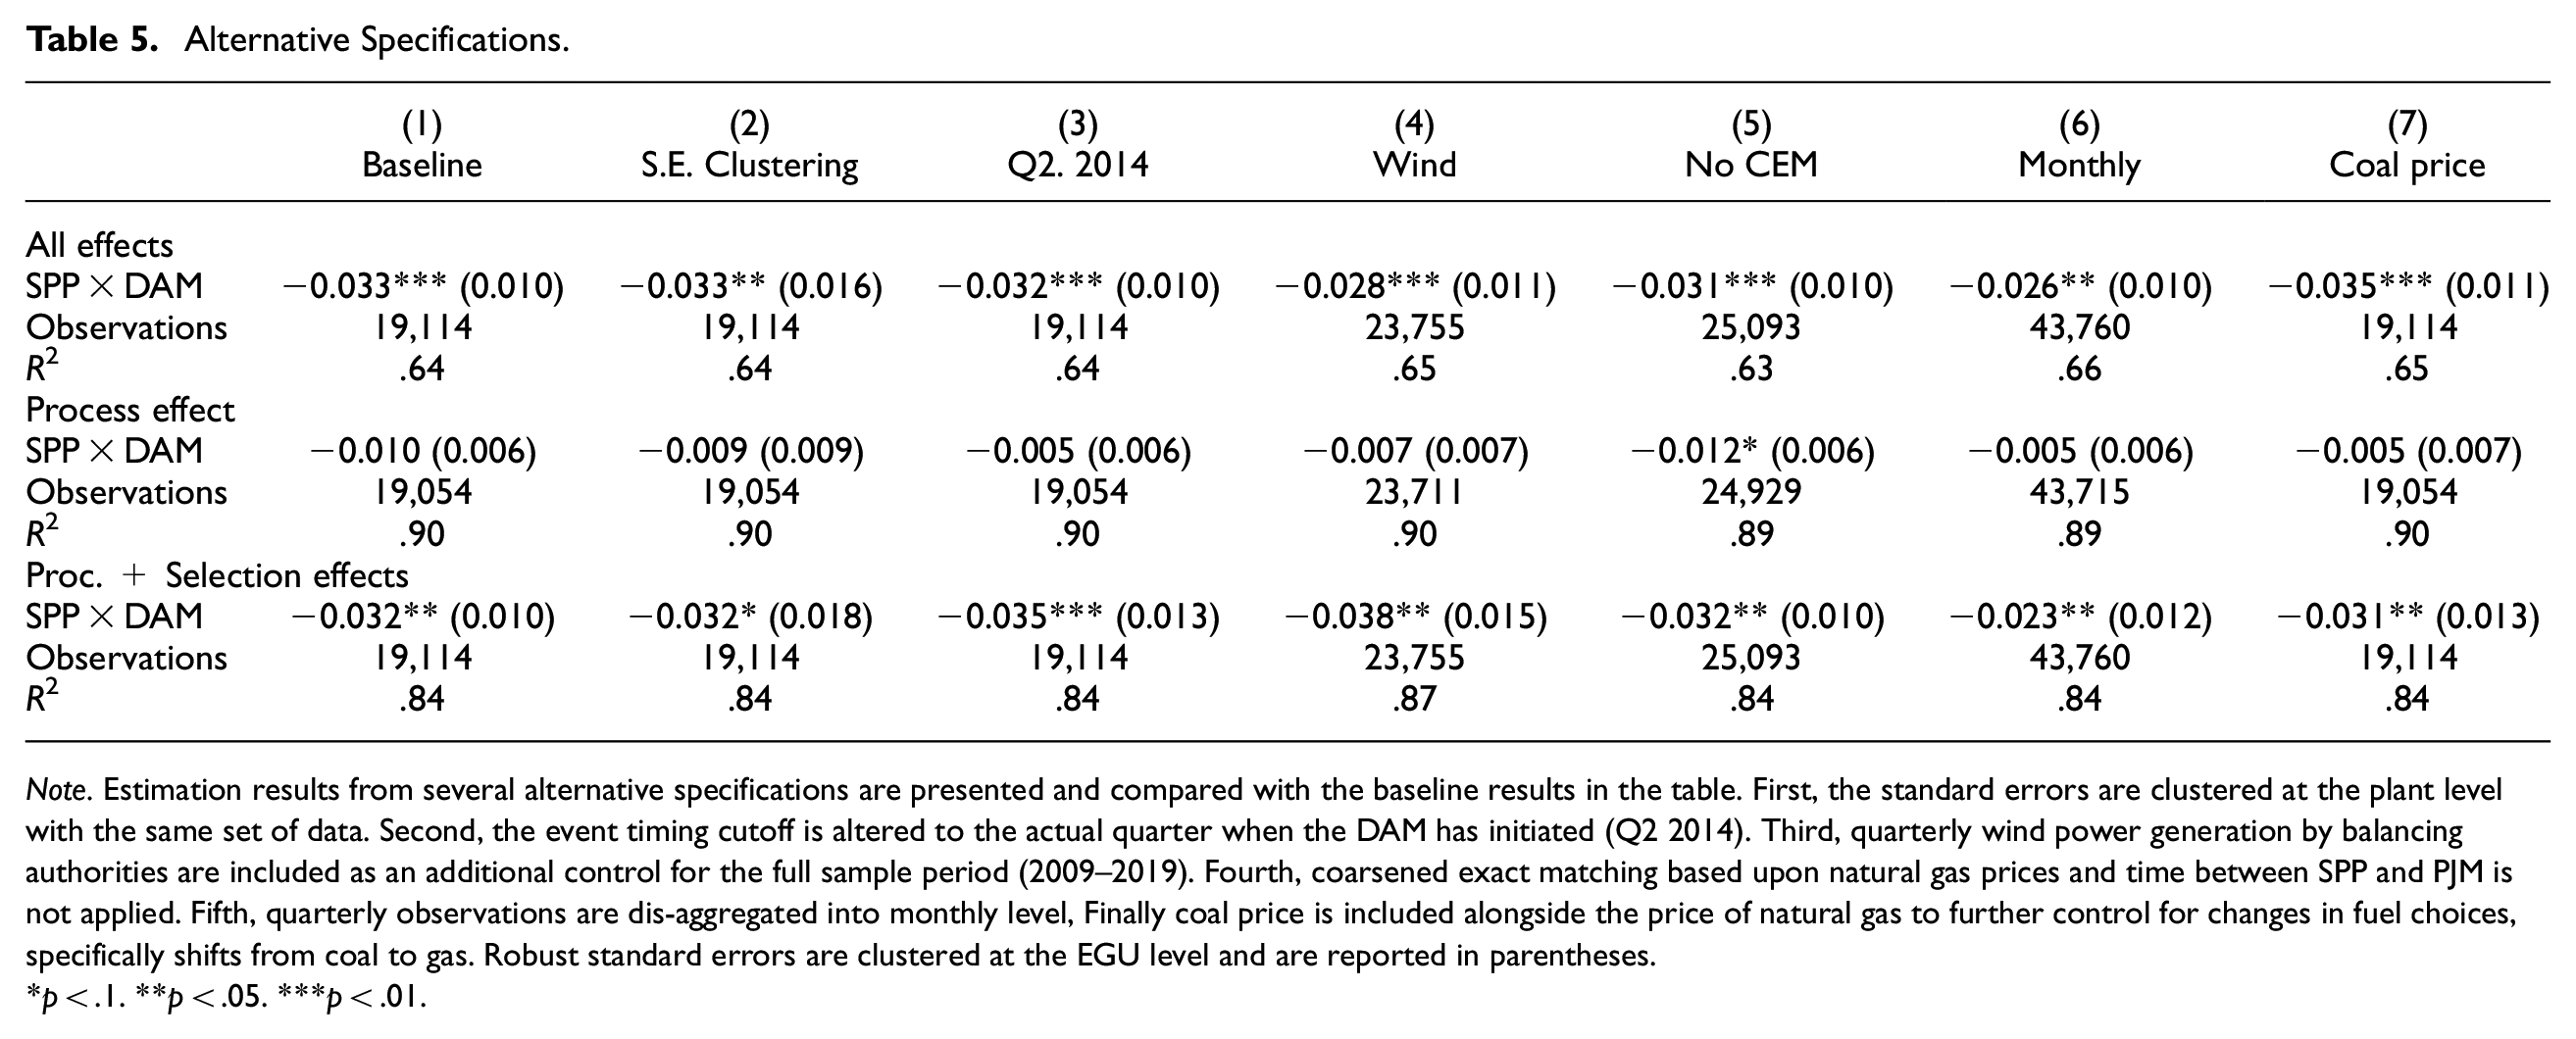
Note. Estimation results from several alternative specifications are presented and compared with the baseline results in the table. First, the standard errors are clustered at the plant level with the same set of data. Second, the event timing cutoff is altered to the actual quarter when the DAM has initiated (Q2 2014). Third, quarterly wind power generation by balancing authorities are included as an additional control for the full sample period (2009–2019). Fourth, coarsened exact matching based upon natural gas prices and time between SPP and PJM is not applied. Fifth, quarterly observations are dis-aggregated into monthly level, Finally coal price is included alongside the price of natural gas to further control for changes in fuel choices, specifically shifts from coal to gas. Robust standard errors are clustered at the EGU level and are reported in parentheses.
p < .1. **p < .05. ***p < .01.
Interestingly, the process effect is larger and statistically significant at the 10 percent level when not applying CEM; however, the baseline approach (that only compares EGUs in SPP and PJM in a common range of gas prices) is more credible as emission responses may markedly differ under different natural gas price regimes (Cullen and Mansur 2017). Fifth, we change the unit of observations from the quarterly to the monthly level to potentially leverage the increased number of observations. Column (6) reports slightly smaller point estimates, with similar standard errors (despite the increase in observations). This may reflect potential dynamic effects of EGUs with respect to the key control variable of natural gas price: EGUs’ exits or modest improvements in technical efficiency may not necessarily respond contemporaneously to monthly variation in natural gas prices, leading to misspecification. In addition, there are frequent missing observations in monthly natural gas prices, leading to many observations being dropped entirely. Despite these caveats, we obtain qualitatively similar results to those of the baseline. Finally, we incorporate quarterly state-level coal prices into our control variables, in addition to natural gas prices. In contrast to natural gas, coal prices are more stable and coal is frequently procured via long-term bilateral contracts. As such, the time and balancing authority fixed effects in our baseline model will generally absorb any effects of coal prices, and in Column (7), our estimates closely align with the baseline results when we directly control for coal prices.
6. Alternative Calculation of the Key Channels
In our primary analysis, we estimated the overall environmental impact of the DAM on EGU emission rebates. We then delve into understanding the specific contributions of three key channels: process, reallocation, and selection effects. Based on our reduced-form analysis, we conclude that the most significant driver of change in the average emission rates of EGUs in the SPP post-DAM is the selection effect.
To confirm the accuracy of our empirical interpretation, we also utilize an alternative decomposition approach as outlined by Najjar and Cherniwchan (2021). This more structural approach incorporates the causal estimates above along with some additional analysis to quantify the process, reallocation, selection, and interaction effects in order to calculate the overall total effect. 21 These calculations serve as a useful complement to the reduced-form econometric approach taken above to determine the environmental effect of the DAM.
Table 6 displays the contribution of each channel in reducing average emission rates of EGUs in SPP post-DAM. The process effect, quantified at 0.008 tons/MWh, aligns closely with our primary estimation presented earlier in Column (2) of Figure 4b. The reallocation effect marginally contributes to a reduction of emission rates which is also consistent with our main finding. 22
Alternative Calculation of the Key Channels.
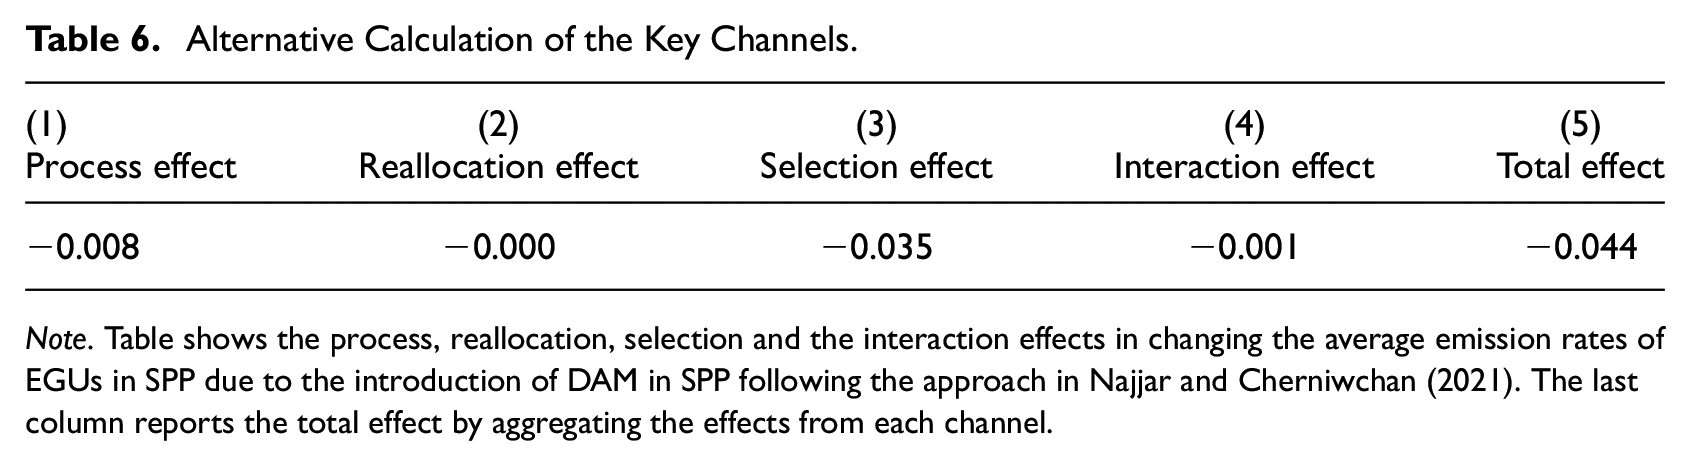
Note. Table shows the process, reallocation, selection and the interaction effects in changing the average emission rates of EGUs in SPP due to the introduction of DAM in SPP following the approach in Najjar and Cherniwchan (2021). The last column reports the total effect by aggregating the effects from each channel.
Again, the selection effect of 0.035 tons/MWh—marked by EGUs exiting the market after the DAM—serves as the major channel through which the average SPP emission rates are affected post-DAM. 23 We additionally find that the interaction effect has a minor influence. The total effect of the DAM on emission rates, at approximately 0.044 tons/MWh, remains broadly consistent with our primary findings above, with the selection effect emerging as the most important factor in the DAM’s environmental impact. These alternative quantification results provide a complementary view bolstering the robustness of our conclusions.
7. Conclusion
We empirically quantify the environmental effects of the launch of the Day-ahead Market (DAM) in the Southwest Power Pool (SPP). Using event-studies and difference-in-differences strategies with PJM as the comparison group, we find that the DAM, on average, improves emission intensities of EGUs in SPP by 0.033 short tons per MWh. This effect emerges primarily through the retirement of relatively more emission-intensive and less-productive EGUs, likely due to intensified competition after the market reform. This implies that 7.66 million tons of carbon dioxide per year are saved, equivalent to $383.4 million nominal US dollars after applying $50/ton of social cost of carbon suggested in 2021 by the Biden administration. Given that 40 percent of the US still has not adopted market dispatch for its electricity grid, this suggests there may be additional environmental benefits to expanding competitive wholesale markets into the west and southeast of the US.
There are several limitations worth noting. First, we could not explicitly show the role of any exporting channel, per Melitz (2003). Theoretically, market integration offers new opportunities for market entities to serve the demand of “foreign” markets, which is reflected by the appearance of new entries. We believe that the environmental effect of the exporting channel may exist; however, causally attributing any new entrants to the DAM presents an interesting but challenging counterfactual issue, given the time lags associated with new construction and the myriad of ongoing changes in the electricity sector during this time period. Second, due to our focus on the emission rates of fossil fuel plants, our study does not account for the effect of the DAM on electricity generation from renewables. DAM may provide renewable EGUs a greater chance to serve market demand as the marginal cost of production is lower than fossil fuels (Dahlke 2018). Since our study only focuses on the environmental accounts of carbon-generating EGUs, the overall impact of DAM on the environmental quality in the SPP regions reported in this paper should be regarded as a lower bound.
Footnotes
Acknowledgements
We are grateful to the attendees of the 2023 Front Range Energy and Environmental Camp for their insightful comments and valuable suggestions.
Declaration of Conflicting Interests
The author(s) declared no potential conflicts of interest with respect to the research, authorship, and/or publication of this article.
Funding
The author(s) received no financial support for the research, authorship, and/or publication of this article.
1
Historically, SPP served as a coordinating entity for roughly a dozen power companies in the central region of the US. Over time, these utilities and other “legacy” balancing authorities consolidated into a larger, single balancing authority managed by SPP, which now handles supply/demand balancing and dispatch over the entire region (parts of 17 states) as a Regional Transmission Operator (RTO) and Independent System Operator (ISO). In 2007, a real-time imbalance market was established to clear at five-minute intervals; however, prior to 2014 there was no competitive market for scheduling day-ahead generation dispatch. Instead, legacy balancing authorities within SPP could engage in bilateral transactions for day-ahead generation (e.g., between Oklahoma Gas and Electric Company and the Kansas City Power and Light Company).
2
3
More generally, we control for regional natural gas prices, so reductions in emission rates are not simply coal-to-gas switching driven by cheap natural gas (![]() ). PJM also has very cheap natural gas in this time period due to the Marcellus Shale formation, but PJM does not see the same sharp retirement pattern in natural gas in 2015. Our results are also robust to accounting for alternative timing of DAM, SPP market expansion, and planned retirements that precede DAM.
). PJM also has very cheap natural gas in this time period due to the Marcellus Shale formation, but PJM does not see the same sharp retirement pattern in natural gas in 2015. Our results are also robust to accounting for alternative timing of DAM, SPP market expansion, and planned retirements that precede DAM.
4
Batalla-Bejerano, Paniagua and Trujillo-Baute (2019) sheds light on the effect of electricity market integration on electricity trade in Europe. Our study extends the discussion to study the environmental ramification of market integration in the US electricity sector, which is largely understudied in the literature.
5
See Cherniwchan, Copeland and Taylor (2017) for an overview of the recent trade-environment literature.
6
Several of these markets already existed prior to this date—the creation of the day-ahead market was the most substantive feature of the integrated marketplace roll out.
8
While we motivate this figure via reference to the SPP DAM creation, the mechanisms behind the change in emissions holds for any sort of market integration between balancing authorities or grids (Gonzales, Ito and Reguant 2022).
9
The positive environmental externality is in part offset by the operation of new EGUs in the trading partner BA, “emission outsourcing” depicted by the area of aD*D a c (i.e., the marginal EGU at the neighboring BA becomes point a shifting from point c). Hence, the net environmental benefit of the entire economy would be the area abc .
10
Fuel-prime mover type codes for ![]() are: CANG: EGUs using combined cycle steam boilers fueled by natural gas; CSNG: EGUs using combined cycle single shaft fueled by natural gas; CTNG: Combined cycle combustion turbine-based EGUs using natural gas; GTNG: EGUs run by combustion gas turbine fueled by natural gas; STNG: EGUs supported by steam boilers using natural gas; GTDFO: EGUs operated by combustion gas turbine using distillate fuel oil; STLIG: Steam turbine-using EGUs fueled by lignite coal; STBIT: EGUs using steam turbines fueled by bituminous coal; STSUB: EGUs using steam turbines fueled by sub-bituminous coal.
are: CANG: EGUs using combined cycle steam boilers fueled by natural gas; CSNG: EGUs using combined cycle single shaft fueled by natural gas; CTNG: Combined cycle combustion turbine-based EGUs using natural gas; GTNG: EGUs run by combustion gas turbine fueled by natural gas; STNG: EGUs supported by steam boilers using natural gas; GTDFO: EGUs operated by combustion gas turbine using distillate fuel oil; STLIG: Steam turbine-using EGUs fueled by lignite coal; STBIT: EGUs using steam turbines fueled by bituminous coal; STSUB: EGUs using steam turbines fueled by sub-bituminous coal.
11
Specifically, observations reporting positive load with no emissions as well as those exhibiting positive emissions with no load are excluded. We also remove observations above the top 1 percent of CO2 intensity and heat rates distribution which respectively take 0.6 percent and 1.4 percent of the total observation.
12
Both SPP and PJM used coal intensively as the primary energy sources for electricity generation in early 2010s: roughly 60 percent of electricity from 2009 to 2013 was coal-fired in SPP, and nearly 50 percent in PJM. In addition, both balancing authorities have utilized natural gas as either secondary (around 20% in SPP) or tertiary (in the range of 10%–20% in PJM) source of energy production.
13
We also examined pre-DAM emission and heat rates of EGUs in SPP compared to those in the Midcontinent Independent System Operator (MISO) and the Electric Reliability Council of Texas (ERCOT). Our analysis reveals statistically significant differences: MISO EGUs display a difference in emission rates of 0.047 tons/MWh compared to PJM, while EGUs in ERCOT differ from SPP in both emission and heat rates, with differences of −0.127 tons/MWh and −0.787 MMBtu/MWh, respectively.
14
For more institutional details, see https://www.spp.org/spp-documents-filings/?id=18274. ![]() notes similar lags between the official start date of various market reforms and meaningful impacts on market outcomes.
notes similar lags between the official start date of various market reforms and meaningful impacts on market outcomes.
15
In contrast to typical specifications, we do not include EGU i fixed effects in order to capture all three potential channels of adjustment (process, reallocation, and selection). When we focus on isolating just the process effect, time-invariant characteristics across EGUs are included as fixed effects to capture the within-EGU variation in emission rates. When we focus on isolating the reallocation effect, plant/EGU market shares are included as controls.
16
We introduce the estimation results when the standard errors are clustered at the plant level to potentially account for the serial correlation across EGUs within plants as a robustness check. The results are qualitatively similar to the main results.
17
18
Relatedly, we also considered specifications where MISO generators were included with PJM as control units, despite SUTVA concerns. Point estimates for the DAM effects were similar but noisier.
19
The integrated marketplace has been initiated at the end of the first quarter of year 2014 (March, 2014). Therefore, we view the second quarter as the time when the DAM was “actually” implemented.
20
Wind generation is not an ideal control in the baseline specification due to the fact that after controlling for year and quarter fixed effects, the residual variation in wind generation is essentially like a BA-specific time trend which may absorb some of the emissions effects arising from the DAM.
21
22
Unlike the approach in ![]() , where both treated and non-treated plants are co-located within the same region, we are considering non-treated EGUs in a separate market PJM that is not directly affected by the DAM. Therefore, we have applied a modified method by multiplying the causal estimate of average changes in generation share of heterogeneous EGUs by their respective heat rates in SPP post-DAM to the pollution share of operating EGUs in SPP before treatment. This approach is akin to the methodology utilized by Najjar and Cherniwchan (2021) for computing the process and selection effects.
, where both treated and non-treated plants are co-located within the same region, we are considering non-treated EGUs in a separate market PJM that is not directly affected by the DAM. Therefore, we have applied a modified method by multiplying the causal estimate of average changes in generation share of heterogeneous EGUs by their respective heat rates in SPP post-DAM to the pollution share of operating EGUs in SPP before treatment. This approach is akin to the methodology utilized by Najjar and Cherniwchan (2021) for computing the process and selection effects.
23
In order to apply the derivation in ![]() the number of active EGUs is needed. We estimate a variant of equation (3) with the number of active EGUs in SPP and PJM over time (excluding new EGUs entering after 2011) as the outcome variable, controlling for natural gas prices, finding a treatment effect of a roughly 5 percent reduction in EGUs in SPP, consistent with Figures 6 and 7. Per Najjar and Cherniwchan (2021) the selection effect is quantified by using the causal estimate of the average net-exit of EGUs due to the DAM and the average pollution share of the exiting EGUs. As an alternative approach, we weighted by the intensity share of the existing generators, yielding a slightly smaller selection effect of 0.022 and total effect of 0.031.
the number of active EGUs is needed. We estimate a variant of equation (3) with the number of active EGUs in SPP and PJM over time (excluding new EGUs entering after 2011) as the outcome variable, controlling for natural gas prices, finding a treatment effect of a roughly 5 percent reduction in EGUs in SPP, consistent with Figures 6 and 7. Per Najjar and Cherniwchan (2021) the selection effect is quantified by using the causal estimate of the average net-exit of EGUs due to the DAM and the average pollution share of the exiting EGUs. As an alternative approach, we weighted by the intensity share of the existing generators, yielding a slightly smaller selection effect of 0.022 and total effect of 0.031.