
Abstract
This study empirically analyzes factors related to companies’ profits from trading emission allowances in the European Union Emissions Trading System (EU ETS) for the period from 2005 to 2017 by combining information on trading activities with company characteristics of more than 6,000 companies. The factors considered include net position (i.e., free allocation of allowances minus emissions), strategic skills (i.e., banking of allowances, timing of trading, transaction frequency, use of intermediaries), skill-related structural factors (i.e., number of installations, sector affiliation), market pressure, year, and region effects. The results from estimating a Panel Heckman Selection Model suggest that companies’ profits from buying and selling emission allowances are related to a company’s net position, banking of allowances, timing of trading, and the number of installations. The findings further indicate that companies choose the number of banked allowances efficiently, that is, they take into account the opportunity costs of selling these allowances on the market.
1. Introduction
Since the start of the European Union’s Emissions Trading System (EU ETS) in 2005, emissions trading has become a legitimate practice for companies to deal with climate change mitigation. The EU ETS has since grown in terms of the countries, greenhouse gases and activities covered by the system, and a considerable number of companies have become active participants on the market for carbon allowances.
After the first two trading periods (2005–2007 and 2008–2012), which were characterized by a high share of freely allocated European Union Allowances (EUAs), the European Commission introduced far-reaching reforms at the start of the third trading period (2013–2020). For example, most electricity generators no longer benefitted from free allocation of EUAs, and the allocation to companies in industrial sectors was based on benchmarks. Nevertheless, because the total number of available EUAs was still much larger than the demand, the EU ETS has experienced long periods with low prices for EUAs since 2005. More recently, regulations, such as the Market Stability Reserve (MSR), the EU Green Deal, and the “Fit for 55” package 1 of the European Commission, have lowered the (expected) future supply of EUAs. Consequently, EUA prices have increased substantially, reaching a historic peak exceeding €100 per EUA in February 2023.
Emissions trading is a cost-efficient form of environmental regulation because it enables a given emissions target (i.e., the cap) to be achieved at minimum costs. The market price of emission allowances signals scarcity and incentivizes companies to invest in emission abatement measures if their costs are below the price (e.g., Hahn and Stavins 2011). Cost efficiency also requires that companies engage in the market in a way that maximizes their profits from trading allowances. Conditional on abatement, companies can keep their compliance costs down by minimizing the costs of purchasing allowances and maximizing the revenues from selling allowances. A company’s profits from emissions trading depend not only on the number of allowances it receives for free from the government via the primary allocation mechanism, but also on its skills to develop and implement trading and abatement strategies. For example, profits from trading depend on whether a company trades allowances efficiently across years, that is, banks and borrows allowances in an optimal way. Similarly, because the prices of EUAs vary over time, the timing of transactions can affect a company’s trading performance.
In this paper, we empirically investigate factors related to companies’ profits from trading EUAs for the period from 2005 to 2017, specifically considering the roles of free allocation and strategic skills. 2 To identify potential learning effects, we examined whether the role of these factors has changed over time. A better understanding of the factors underlying differences in companies’ profits from emissions trading is important because it can provide insights for companies (into strategies) and for governments (into design) on how to improve emissions trading systems to achieve cost-efficient climate change mitigation.
Our time frame covers the first two trading periods and the first five years of the third trading period of the EU ETS. We employed transaction data from the European Union Transaction Log (EUTL) on all transactions within the EU ETS, which we compiled as a large panel dataset containing transactions, free allocation of EUAs, emissions, and the number of allowances banked per year. We matched this data with information on company characteristics taken from the ORBIS database. We used panel econometric methods to relate companies’ profits from trading to their net position (i.e., the difference between the number of EUAs allocated for free and verified emissions in a given year), their trading strategies including banking of EUAs, timing of transactions, transaction frequency, and use of intermediaries), and company characteristics (e.g., number of installations, size, productivity, sector affiliation). Because trading performance is only observed for companies that participated in trading we used a Heckman procedure to account for potential selection bias.
Our findings suggest that profits from trading emission allowances are higher for those companies that receive a larger number of free allowances, ceteris paribus. Likewise, the more allowances a company banks in a given year, the lower profits are in that year. Remarkably, we find that companies bank allowances efficiently. When they decide on the number of EUAs to bank, companies appear to correctly value the opportunity costs in terms of foregone revenues from selling the EUAs instead. Further, for the first two trading periods, companies that sell (buy) a relatively high share of allowances late in the trading year (February-April of next year) realize lower (higher) profits from trading than companies that spread their trading activities more evenly over the course of a trading year. Finally, our findings suggest that companies with a higher number of regulated installations achieve higher profits from trading.
Several empirical studies have econometrically examined the trading activities (i.e., market participation and/or volumes traded) of companies regulated by the EU ETS. Relying on data for the first trading period, Zaklan (2013) found that company participation in the EU ETS was related to company size, sector affiliation, ownership structure, and the level of free allocation. Also for the first trading period, Jaraitė-Kažukauskė and Kažukauskas (2015) concluded that transaction costs such as search and information costs impeded trading because they found that smaller companies and companies with fewer installations were less likely to participate in the scheme and traded fewer allowances. Based on data from 2009 to 2017 for regulated electricity producers, Zaklan (2022) concludes that, because of transaction costs, Coase’s independence property (i.e., a company’s emissions do not depend on its allocation) may not hold for small companies. Using different measures to capture transaction costs, Baudry, Faure and Quemin (2021), Hintermann and Ludwig (2023), and Naegele (2018) all found trading costs to impede trading activities in the EU ETS. Baudry et al. (2021) and Naegele (2018) relied on data for the second trading period, while Hintermann and Ludwig (2023) used data for the period 2005 to 2013. For 2005 to 2014, Abrell et al. (2022) found companies’ trading activities (i.e., trading volume, number of transactions, use of derivatives market, and use of financial intermediaries) to be related to their net position, company size, sector affiliation, productivity, location (i.e., country), and transaction costs. Employing network analysis, Borghesi and Flori (2018) and Karpf, Mandel and Battiston (2018) analyzed companies’ trading behavior and trading patterns in the EU ETS. Their results suggest that the location of an installation or company affects trading behavior.
Hintermann, Peterson and Rickels (2016) provide a review of the literature on prices and market behavior for the second trading period. They conclude that the market has matured over time and that, in particular, the possibility of banking EUAs has led market actors to take into account future shortages. While they find evidence in the literature that EUA prices depend on fuel prices and the emission cap, they infer that the overall understanding of the EUA price is limited and that one cannot assert with confidence that prices accurately reflect abatement costs.
In a study, which is closest to our approach, Cludius (2018) related trading success in the first trading period—measured as the difference between allowances sold and bought between 2005 and 2007—to allocation, sector affiliation, and emissions levels. She also included information on whether a company had a personal holding account (PHA; in addition to an operator holding account), whether it traded via intermediaries, and the number of trades. Estimating cross-sectional selection models, she found that companies’ profits from trading were positively related to their net position, energy sector affiliation, and their level of verified emissions. 3 If spot and average future prices were used to value transactions, trading performance was positively correlated with PHA and number of trades, but only the coefficient associated with the number of trades was statistically significant. The use of intermediaries was not found to be statistically significantly correlated with trading performance. 4 Liu, Guo and Fan (2017) and Guo et al. (2020) employed quantile regressions to analyze corporate trading performance during the first two trading periods. According to Liu, Guo and Fan (2017), trading success is positively correlated to a company’s net position, emission levels, and belonging to an industrial sector rather than to the energy sector. Guo et al. (2020) found that trading success is positively correlated with carbon abatements.
In sum, only a few studies have explored the factors related to companies’ trading performance and these typically focused on the role of the net position, the level of verified emissions, and sector affiliation. Only Liu, Guo and Fan (2017) included company-specific information in their analyses, while Cludius (2018) considered (some) variables reflecting corporate trading strategies, such as whether a company used intermediaries. No study has yet considered transactions during the third trading period to study trading success. Finally, despite using data from multiple years and periods, previous studies have not employed panel econometric estimators and have thus relied on potentially restrictive distributional assumptions.
Our analysis contributes to the existing literature in several ways. First, while previous studies analyzing companies’ profits from trading in the EU ETS have considered allocation, verified emissions and company characteristics, we also consider factors related to strategic skills. In contrast to previous studies, our analysis includes the number of EUAs a company banks, which enables us to assess whether companies bank efficiently. 5 Second, in addition to transactions for the first and second trading periods, our data includes transactions from five full years of the third trading period and hence covers a longer time frame than previous studies. Because the market has matured over time, it is likely that companies have learned how to deal with this new instrument, and because regulation has changed over time, the results obtained from the early phase(s) of the EU ETS may not hold for later phases. For example, since the second trading period, banking of allowances across trading periods is permitted. In addition, the share of auctioning significantly increased in 2013. Third, we employ panel estimators, which account for potential selection bias. Existing studies analyzing trading performance use cross-sectional models to account for selection (Cludius 2018) or cross-sectional quantile regression models (without selection; Guo et al. 2020; Liu, Guo and Fan 2017). Fourth, we analyze trading performance at the company level, as do Abrell et al. (2022), but in a different context. Previous studies chose the level of the global ultimate owner (Cludius 2018; Hintermann and Ludwig 2023; Naegele 2018; Zaklan 2013) or the level of the national owner (Guo et al. 2020; Jaraitė-Kažukauskė and Kažukauskas 2015; Liu, Guo and Fan 2017). 6 Therefore, our level of analysis is close to the point of regulation, but does not assume that trading decisions are made at the level of individual installations (e.g., Betz and Schmidt 2016). Indeed, employing a cluster analysis, Betz and Schmidt (2016) found that some companies pool the allowances from all their installations in one account. Due to language barriers and coordination efforts, the global ultimate owner is unlikely to be the decision-maker concerned with executing the trading strategy. We believe that, in most cases, trading strategies are selected by the national owner or the individual company. As the trading strategies set by the national owner are likely to be reflected in the strategies at the company level, but not the other way around, we selected the company level for our analysis. Our paper is organized as follows. In section 2, we present the methodology including the data, the variables, and the econometric method. Section 3 presents and discusses the results, while section 4 summarizes the main findings and concludes.
2. Methodology
In this section, we describe the data, the variables used in the econometric analysis and the econometric methods.
2.1. Data
Our study relies on three different data sources: (i) The European Union Transaction Log (EUTL), which provides data on all transactions, account information such as ownership, and installations, including information on primary allocation and verified emissions; (ii) ORBIS from Bureau van Dijk, which contains data on companies such as turnover and the number of employees; and (iii) information on prices, which we collected from the European Energy Exchange (EEX) for spot prices and the Intercontinental Currency Exchange (ICE) for futures prices. Like Abrell et al. (2022), we matched EUTL and ORBIS data using company registration numbers. If this was not feasible, we used the addresses and names of the account holders. Price information was matched using transaction days. We valued all spot transactions at the respective daily price. To identify forwards and futures, we followed Cludius (2018) and Abrell et al. (2022) and considered activities of the clearing accounts on typical delivery days of forwards and futures. 7 For transactions on these days, we used the average one-year December future price of the respective year.
We then aggregated all the transaction data for each company on an annual level. In this step, we excluded administrative transactions, such as primary allocation and allowances surrendered. While these transactions account for almost two-thirds of all transactions in the EUTL, they do not reflect market transactions. All remaining transactions pertain to sales and purchases of EUAs. Because regulated companies may surrender allowances for emissions in year t until the end of April in year t + 1, we follow Cludius and Betz (2020) and aggregate transaction for trading years (rather than the calendar years), which last from May in year t to April in year t + 1. Our data set contains transactions up to April 2018, thus covering a total of five full years of the third trading period. To ensure that only regulated companies were included in our sample, we retained companies, which owned at least one regulated stationary installation and excluded companies, which received a primary allocation of zero allowances and had no verified emissions. We also excluded transactions conducted within the same installation, assuming that these transactions were due to organizational rather than trading-related motives. We did not exclude intra-company transactions, because they may have both strategic and organizational significance. 8 In Supplementary Material S1, we provide a more detailed description of how we compiled the data.
2.2. Variables
In this section, we present the dependent variable and the covariates. Table 1 provides an overview, while Appendix Table A1 presents the descriptive statistics.
Description of Dependent Variable and Covariates. 11

2.2.1. Dependent Variable
Profits from trading reflect the trading performance of regulated companies and are calculated as the difference between the value of all transfers and the value of all acquisitions made by a company. Maximizing profits implies minimizing costs of acquiring EUAs for companies with a negative net position (i.e., net buyers) and maximizing revenues from selling EUAs for companies with a positive net position (i.e., net sellers). Thus, in general, profits may take on positive or negative values. As described in section 2.1, we calculated the value of transactions using spot and futures prices for EUAs.
2.2.2. Covariates
Our choice of covariates is driven by our research question, data availability, and the existing literature. We grouped our set of covariates into allocation, skills, market pressure, and year and region effects.
2.2.1.1. Allocation
Net position is defined as the number of EUAs received for free minus verified emissions. The number of EUAs received for free is the outcome of the primary allocation and does not reflect trading skills. Because a higher net position allows companies to sell more allowances, ceteris paribus, we expected a positive correlation between trading performance and net position. 9
2.1.2.2 Skills
We differentiated between two types of skills: strategic skills and skill-related structural factors. Four variables reflected strategic skills. First, we expected banking to have a negative effect on profits. The more allowances a company transfers into subsequent years, the fewer it can sell in a given trading year, and the lower the profits from trading will therefore be in that year. Controlling for banking is therefore essential but has not been done in previous studies analyzing corporate trading activities or performance. We defined banking as the net position plus acquisitions minus sales for each trading year. 10 Second, we included two variables that reflect the timing of buying and selling activities. Late buyers and late sellers were defined as the number of allowances traded in February, March, and April (i.e., during the so-called true-up period). Late buyers and late sellers were assumed to reflect the extent to which companies trade for compliance purposes, but the relation to profits is not clear and hinges on the EUA price during the true-up period relative to the remainder of a trading year. Late buyers (late sellers) benefit from low (high) prices during the true-up period. Third, transaction frequency, that is, the number of transactions in trading year t, is supposed to reflect experience and learning effects. Assuming that frequent trading leads to learning effects (e.g., larger trading network, benefitting from price fluctuations), we anticipated this variable to be positively correlated with profits. Fourth, use of intermediaries measures the number of different intermediaries a company used in trading year. We assumed that this variable reflects access to better information, thus leading to higher profits. Finally, total transactions stands for the total number of allowances traded in a year. Expecting that higher trading volumes would incur stronger learning effects, we hypothesized a positive correlation between total transactions and profits.
To investigate whether the effects of strategic skills on profits from trading changed over time, we included the interaction between the dummies representing the second and third trading period and the covariates reflecting the strategic skills (except banking).
Skill-related structural covariates include the number of installations, whether a company belongs to the energy sector, company size, and productivity. These variables are believed to reflect the extent to which companies have access to complementary assets and capabilities, which enable them to trade EUAs more successfully. The number of installations captures the number of a company’s installations governed by the EU ETS. Assuming that companies with a higher number of regulated installations more often have complementary assets such as specialized trading teams than companies with a lower number of installations, we expected the number of installations to be positively correlated with profits. Energy indicates whether a company belongs to the energy sector. These companies are more likely to be experienced in energy commodity trading and to have skills that complement trading EUAs. For example, electricity companies usually sell their electricity on spot and futures markets (e.g., on the EEX, where EUAs trading also takes place). We therefore expected energy companies to perform better than non-energy companies. Similarly, larger companies are more likely to have complementary assets and lower transaction costs per trade than smaller ones. We therefore hypothesized profits to be positively correlated with company size, measured by the number of employees. Finally, conjecturing that companies with more productive operations would to also perform more successfully when it comes to buying and selling allowances, we anticipated profits to be positively associated with productivity. Like Abrell et al. (2022), we calculated productivity as the ratio of revenues to the number of employees.
To capture the effect of market pressure on trading performance, we included carbon leakage. Companies are assumed to face import competition from non-EU countries if they primarily produce products, which appear on the carbon leakage list of the EU ETS regulations. Because these companies should have particularly strong incentives to keep compliance costs low, we anticipated a positive correlation between carbon leakage and profits.
Finally, we included dummies to control for effects, which are specific to trading periods (i.e., 2005–2007, 2008–2012, and 2013–2020) and to regions. For regions, we used the same definition as Jaraitė-Kažukauskė and Kažukauskas (2015). In the empirical specification, we used the first trading period and Region 1, which consists of German-speaking countries, as the base categories.
2.3. Econometric Model
We employed a multivariate panel econometric analysis based on annual data at the level of individual companies. 12 However, profits from trading are only observed for companies that trade, that is, participate in the market. In our final dataset, for example, we did not observe profits for about 44 percent of the observations, because companies decided not to buy or sell allowances. For these companies, data on profits are missing not at random but because they decided not to trade. We employed a Heckman-type selection estimator because unobserved factors may affect both participation (i.e., selection) and profits (i.e., outcome). We included the shares of companies participating in emissions trading at the country level as an additional covariate in the participation equation. We assumed that this share affects participation but not profits.
We modeled participation as

where
We modeled profits as

where
Our methodology differs substantially from previous studies on corporate trading performance in the EU ETS, for example, Cludius (2018), Liu, Guo and Fan (2017), and Guo et al. (2020). Our findings are therefore not directly comparable to these studies.
3. Results and Discussion
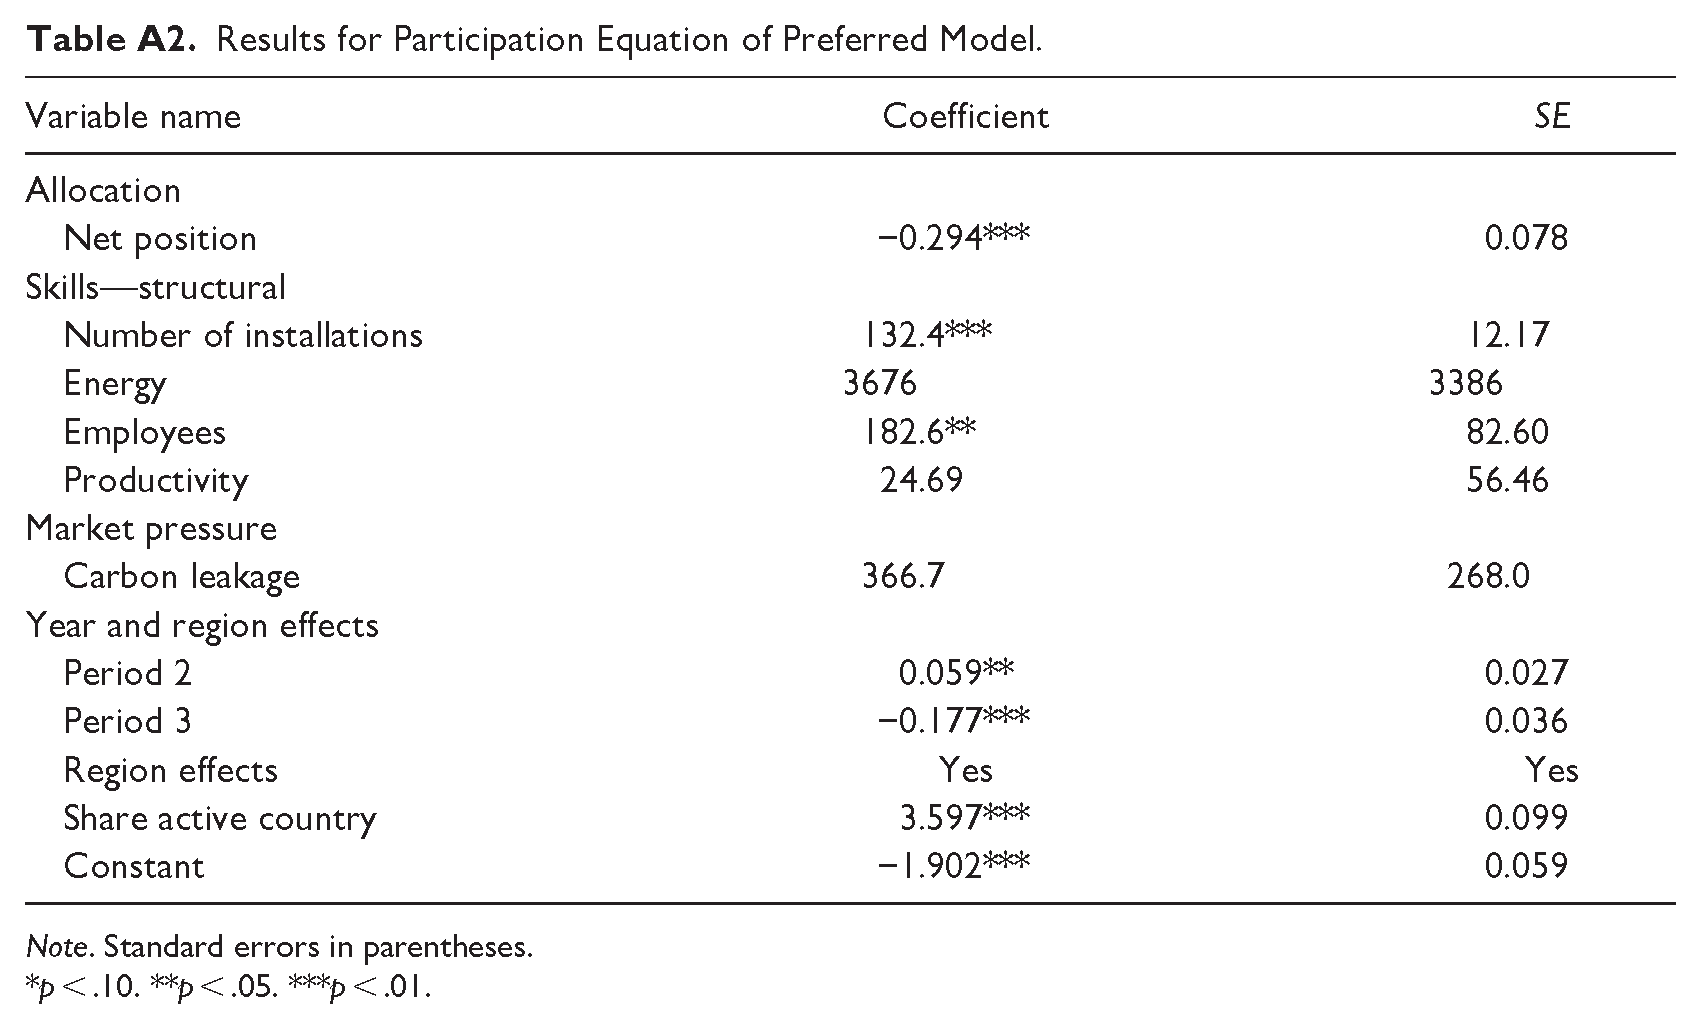
We first present and discuss the results for the period 2005 to 2017 for our preferred specification and then the results obtained for a series of robustness checks. The results for the profits equation (2) are shown in Table 2 and for the participation equation (1) in Appendix Table A2. First, we note that both the correlation of the error terms in the profit and participation equations and the correlation of the panel-level random effects are statistically significant (at p < .01), which supports the estimation of a selection model.
Results for Profit Equation of Preferred Model.

Note. Standard errors in parentheses.
p < .10. **p < .05. ***p < .01.
The results for the participation equation suggest that companies with a higher net position, with more employees, and with a higher number of regulated installations are more likely to participate in emissions trading, ceteris paribus. We note that our additional covariate in the selection equation, that is, the shares of companies participating in emissions trading at the country level (share active country), is statistically significant and positive. In general, the results for the participation equation appear intuitive. Next, we turn to the results for the profit equation in Table 2.
3.1. Allocation
As expected, the higher a company’s net position, the higher the profits from trading, ceteris paribus. This finding is consistent with the results of Cludius (2018) and Liu, Guo and Fan (2017). The point estimate of the coefficient associated with net position suggests that profits increase by €5.99 for an increase in the net position by one unit, that is, receiving one additional EUA for free in the primary allocation or emitting one ton less of CO2eq..14,15
3.2. Strategic Skills
We found, as expected, a negative and statistically significant correlation between banking and profits. The results in Table 2 suggest that banking each additional EUA lowers profits by €5.72 on average. Interestingly, the coefficients associated with banking and net surplus are of about the same magnitude (but with opposite signs). This finding is therefore consistent with companies choosing the number of banked allowances efficiently, that is, they adequately take into account the opportunity costs of banked allowances: rather than transferring allowances to the next period, they could have sold them on the market in this period. 16 To the best of our knowledge, this finding has not been previously derived using company-level data on transactions. Efficient banking (and borrowing) by companies, however, is a prerequisite for intertemporal profit maximization by companies and for emissions trading systems to be economically efficient, that is, to lead to minimal costs for meeting a given emissions target over time (see also Rubin 1996). 17
Our results for late buyers (late sellers) suggest a positive (negative) correlation with profits for the first trading period. On average, during the first trading period, profits were estimated to be €2.26 higher for each EUA purchased during the true-up period than for an average purchase of EUAs during the trading year, ceteris paribus. Vice versa, profits were estimated to be on average €2.84 lower for each EUA sold between February and April than for an average sale of EUAs during the trading year. Thus, in the first trading period, late buyers were better off and late sellers were worse off in terms of profits from trading than companies that spread their trading activities more evenly over the course of a trading year, ceteris paribus. This finding is inconsistent with the concept of an efficient market as defined by Fama (1970). This effect found for the timing of trading activities for the first trading period also holds for the second period, yet less pronounced, and—in terms of magnitude—essentially disappears for the third period. 18
Our results for the first period can be explained by companies (erroneously) expecting the market to be short. Once it became known that the market was in fact long (i.e., once data on verified emissions in 2005 were published in late March of 2006) prices fell, leaving late buyers better off and late sellers worse off. Findings for later periods differ possibly because market participants have learned from their experience in the first trading period. Also, because banking of allowances into future trading periods was permitted from the second period onwards (but not from the first period to the second period), companies with a surplus of allowances could bank them instead of being compelled to sell them on the market. This helped dampen price volatility, especially during the true-up period.
For transaction frequency, we found no evidence that companies trading more frequently in period 1 or period 2 realized higher profits. For period 3, we even found a negative correlation between profits and transaction frequency (p-value of Wald test for sum of coefficients on transaction frequency and interaction term = .04). Similar to our findings for the first two periods, Cludius (2018) did not find a statistically significant correlation between trading success and the number of trades in most of her models.
For use of intermediaries, we found no statistically significant correlation with profits for period 1 and period 3. For period 2, our results suggest, as anticipated, that using intermediaries was associated with higher profits (p-value of corresponding Wald test = .01). Similar to our findings for period 1 and period 2, Cludius (2018) also failed to find a significant correlation between trading success and the use of intermediaries. For period 1, Cantillon and Slechten (2023) conclude that significant market fragmentation hindered the aggregation of information concerning the overall supply and demand in the market. Hence, employing more intermediaries may not guarantee enhanced information quality. Further, the transactions carried out through intermediaries may be measured with error because we use the spot price on the transaction day rather than the price specified in the contract, which was not available to us.
Finally, the coefficient associated with total transactions displays the expected positive sign, but it is not statistically significant (p-value = .77).
3.3. Skill-Related Structural Factors
The coefficient for the number of installations is, as expected, positive and statistically significant. This result supports our proposition that companies with more installations governed by the EU ETS also have more complementary assets that enable them to achieve higher profits from emissions trading than companies with fewer such installations.
As expected, we found a positive correlation of profits with energy, employees, and productivity. However, the associated coefficients were not statistically significant at conventional levels. Therefore, we failed to find support for our proposition that energy companies find it easier to cope with the EU ETS market due to their experience with commodity exchange trading. Cludius (2018) did not find any positive correlation between affiliation to the electricity sector and trading performance in the model, which is closest to our approach, but did find a significant positive correlation in the other three models. We also found no-results for productivity, a finding that might be explained by the large amount of missing data.
3.4. Market Pressure
The coefficient associated with carbon leakage had the expected positive sign but failed to be statistically significant at conventional levels (p-value = .35). Thus, we found no support for our conjecture that companies facing higher competitive pressure have a higher incentive to optimize their trading performance than companies not facing such pressure. A possible explanation for our “no-result” is that our proxy for leakage (i.e., a dummy, which is set to 1 if the company is in a sector exposed to a significant risk of carbon leakage) may not adequately reflect the competitive pressure a company is facing from international trade. For example, we have identified companies as being at risk of carbon leakage if they belong to an industry sector where the majority of its products appear on the carbon leakage list used in EU regulations. Because these companies may, possibly as their main business, also produce products that are not on this list, they may erroneously be categorized as being at risk of carbon leakage in our data. An additional explanation for this “null result” could be attributed to the relatively low prices for EUAs prevailing throughout most of the time frame considered in our analysis. Hence, the incentive to enhance trading performance due to competitive pressures from international markets remained comparatively low.
3.5. Year and Region Effects
In terms of trading periods, we observed that in the second trading period regulated companies were significantly more successful than in the first trading period, whereas they were significantly less successful in the third trading period than in the first trading period, ceteris paribus. The effect sizes, however, are small. The sum of the value of all trading transactions in a year add up to zero (the seller receives exactly the amount the buyer pays), that is, companies that are not analyzed in our dataset (e.g., financial intermediaries) form the counterpart position. In our case, this means that these participants, which our analysis did not include, traded less successfully in the second period than in the first and more successfully in the third period than in the first.
3.6. Robustness Checks
We examined the robustness of the results presented in Table 2 by employing a different estimation approach, modifying the specification of key variables, and considering the inclusion or exclusion of covariates. 19
First, to account for the correlation between time-invariant unobserved factors and the covariates, we included the company-specific mean of the time-varying variables in our main model, akin to Mundlak (1978). Thus,

where
Next, previous literature investigating company trading behavior in the EU ETS (e.g., Abrell et al. 2022; Liu, Guo and Fan 2017) distinguishes between net buyers and net sellers to account for their different settings. Net buyers must acquire extra allowances to prevent incurring penalties on top of fulfilling their shortfall, ceteris paribus. In comparison, net sellers have the option to either sell or bank any surplus allowances. To allow for heterogeneity in the effects of our key covariates by net position, we also estimated a model, which includes interaction terms for the variables reflecting strategic skills, using a dummy that reflects the net position of a company. We set this dummy variable net seller to 1 if the net position is positive. Table S2 shows the results of this model. We find that an increase in the net position by one ton of CO2eq is associated with higher profits for both net buyers and net sellers, but this increase is about €1.8 higher for net buyers than for net sellers, ceteris paribus. Similarly, an increase in banking by one ton of CO2eq is associated with lower profits for both net buyers and net sellers, but this decrease is about €1.9 lower for net buyers than for net sellers, ceteris paribus. The results for net position and banking, and net position × net sellers and banking × net sellers suggest that both net seller and net buyer companies bank efficiently. Hence, our key finding derived for our preferred specification (see Table 2) also holds if we allow for heterogeneity by net position and banking. The results for late buyers (late sellers) imply a positive (negative) relationship with profits for net buyers during the first trading period. The coefficients associated with late buyers × net sellers (late sellers × net sellers) are of about the same magnitude as the coefficients associated with late buyers (late sellers), but of opposite signs. This finding is hardly surprising and suggests that net buyers (net sellers) benefitted (suffered) from buying (selling) allowances late in trading period 1. In other words, the findings for our preferred model for late buyers (late sellers) are essentially driven by net buyers (net sellers). Akin to our findings for our preferred model, the results for the triple interaction terms associated with late buyers and late sellers depicted in Table S2 suggest that any effects of late buying and selling vanish over time. For the remaining indicators reflecting strategic skills, skill-related structural factors, and market pressure, distinguishing between net buyers and net sellers does not appear to provide any additional insights compared to our preferred model.
In our main specification, forwards/futures transactions and company-internal transactions 21 are included in the acquisitions and transfers considered. However, for forwards/futures transactions we cannot observe the actual price paid for the EUA because the contract and the transaction do not correspond to the same day. We use the average annual futures price as an approximation. As average prices cannot reflect price fluctuations, any profits from arbitrage would not be captured in the dataset. Therefore, our data may not fully capture the effects of using forwards/futures on profits from trading. Likewise, using the spot price to value intra-company trades (i.e., transactions between two installations of the same company) may prove inadequate, especially when companies consolidate their allowances in a single account (as discussed in Betz and Schmidt 2016). As additional robustness checks, we therefore estimate a model where we exclude all forwards/futures from the transactions considered and a model where we exclude all internal trades. The results are depicted in Tables S3 and S4 and are very similar to those obtained for our preferred specification. Hence, our results appear robust to excluding forwards/futures and internal acquisitions and transfers from the transactions considered in the analysis.
To examine whether the effects of strategic skills on profits changed across trading periods, our main specification included interaction terms between period dummies and late buyers, late sellers, transaction frequency and use of intermediaries (see Table 2). As an additional robustness test, we also analyzed whether the effects of net position, banking, and total transactions changed across trading periods. We found no evidence that the impact of net position and total transactions on profits changed across trading periods. 22 Unfortunately, models, which included interaction terms between the period dummies and banking did not converge.
To capture the extent to which companies trade for compliance purposes, we considered all transactions during the true-up period to calculate late buyers and late sellers. It is possible, however, that some of those trades were driven by speculative motives. To control for speculative motives in our analysis, we estimated a model that incorporates an additional covariate capturing these motives. Specifically, we included the net volume share for the true-up period, that is, the ratio between net acquisitions (= acquisitions-transfers) and total volume (= sum of acquisitions and transfers). A larger positive (negative) ratio is supposed to reflect a stronger speculative motive for net buyers (net sellers) during the true-up period. We find the coefficients associated with this indicator to be statistically significant and negative (positive) for the first (third) period at p < .1. The size effect is rather small, however. Because all other findings are very similar to those obtained for our preferred specification, our results do not appear to be sensitive to potential speculative motives.
Finally, we estimated a model, which included a company’s emission intensity among the set of covariates. We defined emission intensity as verified emissions per employee. Emission intensity relates emissions to company size and is expected to be indicative of the financial pressure a company participating in the EU ETS experiences. We expected companies with a higher emission intensity to have stronger financial incentives to trade profitably. The coefficient associated with emissions per employee displayed the expected positive sign but failed to be statistically significant (p-value = .93). Possibly, and similar to our no-result for carbon leakage, this no-result for emission intensity may be attributed to the low EUA prices during most of the time frame considered in our analysis.
Overall, these additional robustness checks corroborate the findings obtained for our preferred specification. In particular, our finding that companies bank their allowances efficiently appears robust. Allowing for heterogeneity in the effects of strategic skills by the net position provides additional insights compared to our main specification for late byers and late sellers which resonate intuitively.
4. Conclusions
Cost-efficient emissions trading presumes that companies engage in the carbon market to maximize profits from emissions trading, minimize compliance costs and avoid fines for non-compliance. In this paper, we relied on a comprehensive dataset to empirically investigate factors related with companies’ profits from trading emission allowances in the EU ETS for the period from 2005 to 2017. We considered the role of free allocation, strategic skills, and skill-related structural factors.
Our results obtained from estimating a panel selection model suggest that profits from emissions trading are, as expected, to a large extent related to a company’s net position: higher amounts of free allocation lead to higher profits from emissions trading, ceteris paribus. We also found evidence that profits from emissions trading are driven by strategic skills and some skill-related structural factors. With regard to strategic skills, our findings suggest that companies bank allowances efficiently: when they decide on the number of allowances to be transferred into future periods, companies adequately take into account the opportunity costs, that is, the revenues they could have realized by selling these allowances on the market instead. This result also holds if we allow for the role of strategic factors on trading performance to differ between net sellers and net buyers. Further, we found that late buying (late selling) of allowances within a trading year was correlated positively (negatively) with profits from emissions trading in the first trading period. Distinguishing effects by net sellers and net buyers reveals that these findings for late buying (late selling) are essentially driven by net buyers (net sellers). In subsequent trading periods, such results could no longer be observed; this may reflect that companies had achieved learning effects. For skill-related structural factors, we found that companies with more installations achieve higher profits from trading, ceteris paribus.
Our findings have several implications for policymakers involved in the design of emissions trading schemes for companies engaged in emissions trading. On the one hand, the results imply that companies were able to use banking of EUAs efficiently, which highlights the importance for policymakers to allow for unrestricted banking of allowances in emissions trading systems to help companies meet emission targets at the lowest costs to society. On the other hand, the results concerning the timing of trading suggest that while some firms were able to time their trading activities well, others failed to profit from spreading their trades evenly over the year. Hence, it pays off for companies to invest in developing strategic trading skills because that way they can create a financial benefit. However, since quite a few companies still failed to realize that they could have used the EU ETS more cost-efficiently to comply with climate regulation, policymakers should make sure that participating companies are fully aware of the need to actively use the EU ETS’ trading mechanism to lower their cost of compliance. Because the EUA price has increased over the past years, the EU ETS’ regulatory burden has only grown, making it even more important for companies to use emissions trading in the most cost-efficient way. Further, the finding that having more regulated installations lead to higher profits from trading, ceteris paribus, suggest that there may be increasing returns to scale from trading in the EU ETS. In other words, to profit from emissions trading, scale matters which possibly reflects the conducive role of complementary assets in this context. If companies cannot achieve sufficient scale on their own, they could consider collaborating with other companies to aggregate their trading activities and share the costs of making structural investments for emissions trading such as specialized trading desks.
In conclusion, our findings were obtained for the period 2005 to 2017, which was characterized by relatively low prices for EUAs. Once data become available, future work could investigate the extent to which our findings also hold for periods with substantially higher prices, which mean stronger financial incentives for companies to buy and sell allowances efficiently and to enhance their strategic trading skills and structures.
Supplemental Material
sj-docx-1-enj-10.1177_01956574241288994 – Supplemental material for Allocation or Skill? What is Driving Corporate Trading Performance in the EU ETS?
Supplemental material, sj-docx-1-enj-10.1177_01956574241288994 for Allocation or Skill? What is Driving Corporate Trading Performance in the EU ETS? by Sascha Lehmann, Joachim Schleich and Jonatan Pinkse in The Energy Journal
Supplemental Material
sj-docx-2-enj-10.1177_01956574241288994 – Supplemental material for Allocation or Skill? What is Driving Corporate Trading Performance in the EU ETS?
Supplemental material, sj-docx-2-enj-10.1177_01956574241288994 for Allocation or Skill? What is Driving Corporate Trading Performance in the EU ETS? by Sascha Lehmann, Joachim Schleich and Jonatan Pinkse in The Energy Journal
Footnotes
Appendix
Results for Participation Equation of Preferred Model.
| Variable name | Coefficient | SE |
|---|---|---|
| Allocation | ||
| Net position | −0.294*** | 0.078 |
| Skills—structural | ||
| Number of installations | 132.4*** | 12.17 |
| Energy | 3676 | 3386 |
| Employees | 182.6** | 82.60 |
| Productivity | 24.69 | 56.46 |
| Market pressure | ||
| Carbon leakage | 366.7 | 268.0 |
| Year and region effects | ||
| Period 2 | 0.059** | 0.027 |
| Period 3 | −0.177*** | 0.036 |
| Region effects | Yes | Yes |
| Share active country | 3.597*** | 0.099 |
| Constant | −1.902*** | 0.059 |
Note. Standard errors in parentheses.
p < .10. **p < .05. ***p < .01.
Acknowledgements
We thank Jan Abrell for his contribution in compiling the data, Regina Betz for early-stage discussions on the topic, and two anonymous reviewers for their insightful comments. For some parts of the paper, we used ChatGPT to refine the phrasing. Afterward, we reviewed and edited the content as needed and assume full responsibility for the content. Finally, we thank Gillian-Bowman Köhler and Anja Klotz for their thorough language editing.
Declaration of Conflicting Interests
The author(s) declared no potential conflicts of interest with respect to the research, authorship, and/or publication of this article.
Funding
The author(s) disclosed receipt of the following financial support for the research, authorship, and/or publication of this article: Part of this research was funded by Stiftung Energieforschung Baden-Württemberg (funding code A 328 18).
Supplemental Material
Supplemental material for this article is available online.
Notes
References
Supplementary Material
Please find the following supplemental material available below.
For Open Access articles published under a Creative Commons License, all supplemental material carries the same license as the article it is associated with.
For non-Open Access articles published, all supplemental material carries a non-exclusive license, and permission requests for re-use of supplemental material or any part of supplemental material shall be sent directly to the copyright owner as specified in the copyright notice associated with the article.