
Abstract
Using a unique European dataset, we examine “green” (renewable energy) and “gray” (non-renewable energy) IPOs in terms of ownership characteristics, withdrawal probability, post-withdrawal survival, and post-IPO performance. We find greater private equity and venture capital involvement and higher levels of retained ownership for green IPOs. Gray firms prefer London’s AIM, known for lighter regulation. Green firms are less likely to withdraw in recent years, survive longer, and are less likely to be sold post-withdrawal. These results, indicating a positive market and “insider” sentiment toward green firms, suggest insiders of gray firms are more often motivated by “exit” desires. Initially, green IPOs underperform with more negative BHARs and lower alphas. However, over time, this underperformance decreases due to increased institutional ownership and a higher return “reward” for greater business risk.
1. Introduction
As the world races to mitigate the worst effects of climate change and meet the goals of the Paris Agreement, climate, sustainable, and green finance are emerging fields of research for mainstream finance journals and researchers (Andersson, Bolton and Samama 2016; Baldauf, Garlappi and Yannelis 2020; Barnett, Brock and Hansen 2020; Huynh, Nguyen and Truong 2020; Huynh and Xia 2021; Murfin and Spiegel 2020; Pástor, Stambaugh and Taylor 2021; Rao et al. 2022; Tang and Zhang 2020; Zerbib 2019). These are important contributions that help understand whether a range of markets and participants are pricing climate risks and opportunities. The preponderance of this literature is, however, concerned with secondary markets (the trading of existing securities) from an empirical and theoretical perspective. Most climate scientists and policy makers would observe that an equally important, if not more important, issue is that of climate financing, that is, primary markets, the raising of new equity capital through the issuance of new securities, either an initial public offering (IPO) or seasoned equity offering (SEO). Primary and secondary markets are strongly related (Mauer and Senbet 1992), there is clearly a need to examine primary markets explicitly in the context of climate change. We do so in the context of the European IPO market, which has been the largest IPO market in the world, worth $563bn between 2001 and 2015, relative to the U.S. IPO market that had a size of $529bn over the same period (Helbing 2019).
A core focus of the Paris Agreement is financing the decarbonization of the global economy (UNFCCC 2015). As governments have limited ability to finance new projects, financial markets, investors, and banks will play a large role in providing the bulk of the capital required (IPCC 2018, 2023). With global greenhouse gas emissions dominated by carbon emission, decarbonization of the energy system and financing energy transition, where fossil fuels are replaced by renewables, is at the heart of this effort. There have been various endeavors to measure the scale of investment required—they range from an annual (U.S. $) “Clean Trillion” of investment needed through to 2050 to keep temperatures within 2 degrees, to $ 2.4 trillion annual investment between 2016 and 2035 to stay within 1.5 degrees (Fulton and Capalino 2014; IPCC 2018, 2023). Irrespective of which of these two estimates is adopted, there is a considerable shortfall in investment, with global investment in renewables averaging around $300 billion per annum between 2016 and 2019 (UNEP 2020).
This estimate of actual investment includes the full continuum of new technology development financing, starting from government and corporate research and development (R&D), venture capital (VC) and private equity (PE) investment, public equity markets financing, asset finance, and finance for small scale projects. Though small relative to asset finance ($230 billion in 2019), equity market finance ($1.8 billion in 2019) is critical to energy transition as it provides capital that can be leveraged through debt and helps finance the next generation of renewable energy companies with leading edge technologies (Fulton and Capalino 2014; UNEP 2020). As noted above, the focus of this paper is on this last category of finance; new equity issuance, specifically IPOs, in the context of energy transition.
Energy transition and the decarbonization of the economy are going to be a multi-decadal effort. Even the most optimistic IPCC scenarios do not expect “net zero” until 2040 (IPCC 2008, 2023). Indeed, a growing number of governments are adopting net zero targets focused on 2050, including the three largest emitters (China, the E.U., and the U.S. with the Biden administration), though even these are seen as ambitious (Bazilian and Gielen 2020). Energy transition will take time. In the intervening period, technology and opportunities will change for conventional fossil fuel producers—most clearly evident in recent times by the shale revolution that has seen the U.S. become increasingly energy independent and a net oil exporter (Diaz-Rainey et al. 2021). Thus, energy transition and technological change mean that new players are emerging in the sector; with some of these new players categorized as “green,” while others may be developing technologies and products related to the extraction and burning of fossil fuels (“gray”).
Emerging (private) green and gray firms need to raise capital, and many will do so by raising equity capital via an IPO. However, they have very different long-term prospects and therefore potentially different motivations for going public (Bancel and Mittoo 2009). Gray firm management and/or shareholders may be seeking to “exit,” while green firms may be funding expansion. Further, the level of pre-IPO involvement of VC and PE investors as “smart money” may proxy for their prospects (Krishnan et al. 2011). Conversely, green firms may be riskier than more conventional gray firms given that they are utilizing unproven technologies with greater technological uncertainty (Masini and Menichetti 2012). In this context, IPO withdrawal, post-withdrawal survival, and post-IPO performance are likely to be different for green and gray firms. Further, as investors have embraced environmental, social, and governance (ESG) investing and have increasingly signed up to United Nations Principles for Responsible Investment (UNPRI), it is likely that investor appetite for (including changing perception of risk) green and gray firms will have changed over time. There is mounting evidence that investors have re-evaluated the prospect of green and gray firms following major policy announcements such as the Paris Agreement in 2015 (Diaz-Rainey et al. 2021; Monasterolo and De Angelis 2020).
This paper addresses these issues using a unique dataset of European IPOs to provide the most comprehensive analysis of green and gray IPOs to date, in the largest combined IPO market in the world. The dataset by Helbing, Lucey, and Vigne (2019) provides holistic IPO prospectus-level data on all IPO filings, completed and withdrawn, including offer, firm, and corporate governance characteristics, making the data unique in depth and breadth compared to the fragmented data on European IPOs from conventional information providers. IPO firms from eight European countries (including the U.K., France, Germany, Spain, Italy, Denmark, Sweden, and Norway) are categorized as green and gray from the dataset across a 17-year period, beginning January 2001. Specifically, we address the following research questions:
Are green IPOs replacing gray IPOs in terms of volume over time?
Do green IPOs have more favorable ownership characteristics, as measured by insider retention and “smart money” involvement?
Are green IPOs more likely to be withdrawn?
If so, is this reflected in lower survival for green firms post-withdrawal?
How do green firms perform post-IPO relative to gray firms, and has this relative performance changed over time?
We explore the first question via a simple descriptive evolution of green versus gray IPOs over time, the next two questions are addressed with probit models where the dependent variable takes the value of one, respectively, when a firm is categorized as green, and when the IPO is withdrawn. The fourth question is addressed via Kaplan–Meier survival estimates. The final question is addressed using the two approaches dominant in literature, buy-and-hold abnormal return (BHAR) analysis, and factor return regressions (Gao and Jain 2011). Finally, we explore two channels that may moderate the relative post-IPO performance of green versus gray firms over time; namely, the proportion of institutional ownership and business risk.
In short, we aim to map the universe of European green and gray IPO firms. In doing so we contribute to research on primary market financing in a climate change context. Though there is a growing literature on bonds and climate change issues, for instance Painter (2020) explore the issuance of municipal bonds in the context of climate risk, only a limited number of papers have explored primary equity markets in related contexts (Anderloni and Tanda 2017; Chan and Walter 2014; Feng, Chen and Tseng 2018; Pástor, Stambaugh and Taylor 2021). Chan and Walter (2014) find positive and significant excess returns for U.S. “environmentally-friendly” IPOs and SEOs. Feng, Chen, and Tseng (2018) also for the U.S. find that high corporate social responsibility (CSR) issuers experience fewer negative market reactions to SEO announcements. Pástor, Stambaugh, and Taylor (2021) find that green stocks have negative performance alphas whereby green investments in general underperform. In the closest study to our own, Anderloni and Tanda (2017) explore the post-IPO performance of green energy IPOs in Europe and find that non-green energy IPOs are more underpriced and perform better compared with green energy IPOs.
Relative to these papers, our study has a number of points of difference. First, distinct to Chan and Walter (2014), Feng, Chen, and Tseng (2018), and Pástor, Stambaugh, and Taylor (2021), who focus on broader CSR and environmental performance across all sectors, our study is more concentrated on climate change and the need for capital raising for energy transition. As outlined above, energy transition and the capital raising needed to achieve it, is at the heart of mitigating the worst effects of climate change. Second, and most critically, our unique dataset allows us to explore pre-IPO withdrawals and ownership characteristics, including insider retention and the participation of PE and VC investors for green and gray firms. This has not been done before in the context of ESG investing or climate finance. Third, Chan and Walter (2014), Anderloni and Tanda (2017), Feng, Chen, and Tseng (2018) have all explored post-IPO performance or market reaction to seasoned offering announcements. We also explore post-IPO performance but add survival analysis for withdrawn IPOs. Finally, we explore how an increased focus on sustainable investment may have changed post-IPO performance over time by splitting the sample into different time periods.
We find that there is significant involvement of both PE and VC in green IPOs and higher levels of retained ownership in green IPOs. In our withdrawal analysis, we find that green IPOs are less likely to withdraw than gray IPOs in recent years. Also, gray firms are more likely to end up inactive post-IPO withdrawal and, on average, become inactive 3 years earlier than green firms. Green firms predominantly remain private or engage in M&A. By comparing the post-IPO shareholder returns of green and gray IPOs in a BHAR and four-factor model, we find that green IPOs are subject to more consistent negative returns of greater magnitude than gray firms; though the differences in performance are only marginally statistically significant for 12-month returns for certain benchmarks. Further, we find evidence in favor of an evolution of green post-IPO performance in our subsample analysis, whereby the green BHAR differential turns positive in 2010 to 2017; though this finding is only statistically significant in some of our models (namely, in robustness checks where we define green firms with the 100% revenue-based identification). Testing the channels via which these changes in relative performance occur, we find some limited evidence that institutional ownership and business risk may moderate the relative post-IPO performance of green versus gray IPOs.
In addition to the academic contribution of this paper (outlined above), our results are of relevance to financiers, regulators, and policymakers. Our results show an improving (declining) outlook for green (gray) firms undertaking an IPO. This is important if the world is to meet the goals outlined in the Paris Agreement. Interestingly, our descriptive results show a declining number of gray IPOs over the period but surprisingly there is not a large uptick in green IPO. This is puzzling and may be due to ongoing concerns around the risk of green IPOs. Finally, London, like many financial centers, has sought to become the leading “green” financial center. However, our evidence casts a dark shadow on London’s green credentials given that London has been the host of more than two thirds of gray IPOs in Europe over the 2001 to 2017 period.
The rest of the paper is structured as follows. Section 2 develops research hypotheses, Section 3 outlines the data and models, Section 4 presents the results, Section 5 outlines channel testing and Section 6 presents some robustness analysis. Section 7 provides concluding remarks.
2. Green and Gray IPOs: Hypotheses Development
2.1. Green Firm Ownership Characteristics
Previous research on IPOs (Busaba, Benveniste, and Guo 2001; Dunbar and Foerster 2008; Helbing, Lucey, and Vigne 2019) assert a special role to PE and VC investors in the IPO process. From an investment point of view, the motives and roles of PE and VC appear to differ. PE firms traditionally invest in mature, established firms that may have operating or financial issues that can be “turned-around” by the expertise of private equity investors (Gompers, Kaplan, and Mukharlyamov 2016). This differs from the role of VC firms, who invest in relatively young companies in new industries with high growth potential, exposing themselves to high risk, but potentially above average returns in the process. Green VC firms are defined as high-risk capital providers for new ventures that contribute to sustainable development (Randjelovic, O’Rourke, and Orsato 2003). Moore and Wüstenhagen (2004) highlight the role of VC in financing high-risk firms utilizing innovative intellectual capital that produce and market new cost-effective renewable energy technologies. Bocken (2015) states that, although sustainable investment is on the rise, VC has an important role in the development of these new ventures. Therefore, it appears that renewable energy industries provide an investment opportunity consistent with those desired by VC firms, inferring one would expect to see greater VC involvement in green IPOs as follows:
The literature has historically found that green enterprises are riskier as they have tended to use unproven technologies (Masini and Menichetti 2012). However, green firms’ long-term prospects in absolute terms, and relatively to gray fossil fuel companies, will improve as the technologies they use mature and as energy systems and economies are decarbonized. In this respect, there is mounting evidence that investors are starting to understand and price the risks and opportunities of energy transition and climate change (Diaz-Rainey et al. 2021; Monasterolo and De Angelis 2020). This suggests that insiders (e.g., management that are also owners of the firm) may have very different motivations for going public (Bancel and Mittoo 2009). In green firms, owners are likely motivated by the need to raise capital to funding growth and business development. By way of contrast, it is conceivable that, in the context of gray firms, owners are more likely motivated by a desire to exit or “cash-in” before their firms start to decline due to falling demand for their fossil fuel products and/or investors lower their valuations of these firms due to energy transition risks. Accordingly, when doing an IPO, we would expect managers in gray firms to sell a higher proportion of their own shares (described as “retained ownership”) in the IPO process than the owners of green firms.
To summarize, hypotheses 1 and 2 address research question 2.
2.2. Determinants of IPO Withdrawal
Not all companies that file for an IPO also list. The company can change course at any time and withdraw the IPO before completion (Busaba 2006). An IPO withdrawal is defined as an event when a company files for an IPO, but does not follow through. Having filed for an IPO, the company can actively cancel the IPO filing or passively not list in due time (Helbing 2019). Generally, an IPO withdrawal is seen as a negative signal about the prospects and valuation of the firm. However, there are many possible reasons for an IPO withdrawal including unfavorable market conditions, lack of investor demand, or alternatives to an IPO such as trade sale opportunities (see for instance Busaba, Benveniste, and Guo 2001; Dunbar and Foerster 2008). One possibility is that the price the market is willing to pay might be below the IPO company’s expectation. In the context of green IPOs, a problem of adverse selection may lead to higher green IPO withdrawals (Akerlof 1970). Green firms may be developing risky new technologies, leading to high information asymmetries between insiders and investors about the probable success of the firm, its technologies, and products (Masini and Menichetti 2012). As such, during the book-building process (when the underwriting bank gauges demand and interest in the IPO), the green IPO company might learn that investors are applying a green “discount” due to green IPO firms being seen as riskier and having higher information asymmetry (Hong, Li and Xu 2019; Masini and Menichetti 2012). A further consequence of higher risks and information asymmetries in green firms might be a lower proportion of institutional investors at the IPO. This matters because previous research has identified the proportion of institutional ownership post-IPO to be an important signal of the quality and future success of the IPO company (see for instance Lo, Wu, and Kweh 2017; Lu and Samdani 2019; Nofsinger, Sulaeman and Varma 2019). In this context, we would expect green IPOs’ survival to be lower.
Overall, we assume that green firms are at an earlier stage of their life cycle, hence are younger, smaller, have higher information asymmetries, are riskier, and file for an IPO to raise new equity capital. Whereas, gray firms are at a later stage, are older, bigger and less risky, and file for an IPO in order for insiders to exit. The combination of greater risk and lower institutional ownership suggests lower quality and lower likelihood of success (IPO and survival) for green firms. Accordingly, this leads to our next hypothesis, which addresses research questions 3 and 4, concurrently.
However, as noted in the discussion of H2, the risk and institutional ownership channels that underpin H3 may be subject to change. Risks and information asymmetries of green firms should reduce over time as the technologies they use mature and as energy systems and economies are decarbonized. As noted earlier, investors are starting to understand and price the risks and opportunities of energy transition and climate change (Diaz-Rainey et al. 2021; Monasterolo and De Angelis 2020). It seems reasonable to assume that it is better informed institutional investors, in contrast to retail investors, that are driving these changes though increased holding of green firms over time.
2.3. Post-IPO Performance
The IPO literature finds that though investors are rewarded with abnormal positive first day returns, there is significant underperformance of offering firms in the long-run (Aggarwal, Leal and Hernandez 1993; Levis 1993; Ritter 1991). Brav and Gompers (1997) suggest that this underperformance is due to an over-optimism of investors in relation to the prospects of firms issuing equity for the first time. In this context, we explore whether green IPOs fare better or worse relative to gray IPOs. This will provide insights into the prospects of these firms and the reward investors can expect from going “green.”
From a theoretical perspective, Porter (1991) indicates that pollution represents an economic inefficiency, and that improved environmental performance is beneficial to firms by fostering innovation. Support for the Porter hypothesis exists from studies that examined accounting returns, though the effect is stronger in the long-run (see for instance Horváthová 2012; Rassier and Earnhart 2011). Whether this long-run improved accounting performance is reflected in secondary markets (stock prices and investment performance) is contested with mixed results in the empirical literature. As noted above, Hong, Li, and Xu (2019) find that markets underreact to this climate risk. Further, Bohl, Kaufmann, and Stephan (2013) examine the German renewable energy stocks during the 2000s and document strong outperformance which, however, completely reversed, as the stocks fell short of investor expectations. Pástor, Stambaugh, and Taylor (2021) find underperformance of green assets, though asserts that investors derive utility from owning green firms. However, the financial performance of renewable firms depends greatly on the behavior of oil prices (Reboredo 2015, 2018) and a positive relationship is documented between rising oil prices and the substitution into green energy sources (Kumar, Managi, and Matsuda 2012).
More general evidence for the underperformance of ESG and environmental stocks and funds can be found in the literature, for example, Brammer, Brooks, and Pavelin (2006), Boulatoff and Boyer (2009), and Cai and He (2014). Climent and Soriano (2011) show significant underperformance of U.S. environmental mutual funds which decreases in later years, suggesting growing positive sentiment toward green firms as climate issues become more publicized. Consistent with this, and as observed earlier, more recent evidence suggests that investors have started to re-evaluate the prospect of green and gray firms following the release of seminal scientific research on climate change and following the Paris Agreement (Diaz-Rainey et al. 2021; Griffin, Lont, and Sun 2017; Monasterolo and De Angelis 2020). Indeed, there is mounting evidence that bond investors favor green bonds (reflected in a green bond premium) or at a minimum the issuance of green bonds benefits shareholders though improved stock returns (Tang and Zhang 2020; Wang et al. 2020; Zerbib 2019).
The limited evidence in the context of equity primary markets is also mixed. Chan and Walter (2014) explore U.S. IPOs and SEOs of “environment-friendly” firms between 1990 and 2012 and find positive and significant excess returns, which strongly contrast with their control group. Feng, Chen, and Tseng (2018) also explore SEOs over a similar period in the U.S. and find that high-CSR issuers experience fewer negative market reactions to SEO announcements. By way of contrast, Anderloni and Tanda (2017) explore the post-IPO performance of green energy IPOs in Europe between 2000 and 2014 and find that non-green energy IPOs are more underpriced and perform better.
How might this mixed evidence be reconciled? The equilibrium model by Heinkel, Kraus, and Zechner (2001) shows that the presence of socially responsible investors within the market drives the share price of irresponsible (gray) firms down, thereby raising the cost of capital for the firm. When the price differential between green and gray firms is large enough, gray firms pay the fixed cost of transitioning to (becoming) green. However, in the Heinkel, Kraus, and Zechner (2001) model, a proportion of around 20% of investors need to embrace ethical investing before the price differential becomes binding, that is, induces transitioning. Thus, the mixed empirical evidence to date may reflect that, in earlier time periods, there were not enough investors embracing ethical investing to really affect downward (upward) pressure on gray (green) stocks. Accordingly, in the early years green stocks did not attract a premium and suffered due to high risk. However, as more investors have embraced sustainable (ESG) investing, in particular institutional investors through initiatives such as UNPRI, downward (upward) pressure on gray (green) stocks will have started to take effect. Investors committing to UNPRI grew from $6.5 trillion in 2006 to $68 trillion in 2017. From the above discussion, we formulate our final hypothesis that addresses research question 5:
To summarize, hypotheses 4 addresses research question 5.
3. Data and Methods
The initial dataset of Western European IPOs (including the U.K., France, Germany, Spain, Italy, Denmark, Sweden, and Norway) covers 3,014 IPOs from 2001 to 2017, of which 2,658 were successfully completed, and 356 were withdrawn (Helbing, Lucey, and Vigne 2019). The IPO filings are downloaded from Bloomberg and cross-checked with the country’s respective stock exchange. Both IPO listings and IPO withdrawals are included in the IPO filings retrieved. The dataset in Helbing, Lucey, and Vigne (2019) contains a wide range of market, offer, outcome (withdrawal, etc.), and firm characteristics (see Table A1 for further description on the variables). While market and economic variables are retrieved from Bloomberg, Thomson Reuters Refinitiv or the World Bank, most offer, firm, and outcome characteristics are hand-collected from the company’s IPO prospectus. Making this a unique cross-country database in depth and breath for Europe.
Consistent with the usual practice in IPO literature (Ritter 1987), the sample is restricted to common stock IPOs. From the initial 3,014 IPO filings, we use Bloomberg industry classifications to filter firms into different broad industries based on their business operations, such as the energy, transport, and building materials sectors (310 IPO filings), with the majority categorized as energy companies (see Table A2). Each IPO is classified as green, gray or ambiguous using information from a combination of the IPO prospectus, Capital IQ, Bloomberg, or other public sources at the time of the IPO filing. This procedure allows a categorization according to the status-quo of operations at the time of the IPO filing and hence a direct comparison of the IPO companies identified in our sample. Classification as green, gray or ambiguous is done through manual coding and subsequently cross-checked. Undertaking this manual coding requires individual judgment, and so the following definition of a green firm is developed.
1
A firm with a majority (over 50%) of its operations (as measured by revenues) focused on renewable, GHG-neutral or reducing methods, technologies and associated enabling “green” services and technologies. This includes renewable energies, carbon-neutral buildings and building materials, electrification of transport and enabling technologies such as Smart Grid and Smart Grid Edge Technologies.
Due to ambiguity in classification or incorrect specification, we exclude 26 IPOs that do not meet the above definition. 2 Based on these data, the sample size of 284 companies covers all IPO filings categorized as green (90) or gray (194), of which 38 were withdrawn.
3.1. Probit Models: Firm Characteristics and Determinants of Withdrawal
To explore our second and third research questions, respectively, on ownership characteristic (hypothesis 1 and hypothesis 2) and withdrawals (hypothesis 3), probit models are run. More specifically, following the methodology of Busaba, Benveniste, and Guo (2001), a probit model is used to identify a binary dependent variable, y, which represents a green (withdrawn) IPO by any given firm. In the ownership characteristics models, the variable will take the value one if the firm is green, and zero otherwise. In the models of withdrawal, the variable will take the value one if the IPO is withdrawn, and zero otherwise. This gives the basic model for ownership characteristics/withdrawals as follows:

whereby
Consistent with the literature on IPOs in Europe, we focus on firm-specific control variables, as economic variables are found to be of little significance in a European withdrawal setting (Helbing, Lucey, and Vigne 2019). Therefore, the control variables we include focus on offer, firm-specific, and corporate governance characteristics (see Table A1).
3.2. Survival Analysis for Withdrawn IPOs
In order to analyze the outcomes of a withdrawn IPO filings (research question 3 and hypothesis 3), we identify different post-IPO withdrawal outcomes: private, inactive, M&A, and second time IPO. The advantage of survival analysis is the connection of the outcome characteristics and the timing of a particular event. We apply the semi-parametric Cox proportional hazard model (Kartsonaki 2016):

where
3.3. Post-IPO Performance: BHAR and Four-Factor Regressions
The final part of our analysis explores post-IPO performance (research question 5 and hypothesis 4). Consistent with previous literature, post-IPO performance is measured using the stock returns for the 3 years directly after the IPO, following the two stock-performance measures implemented by Gao and Jain (2011). We follow Ritter (1991) 3-year period for performance due to data limitations for the most recent IPOs. Returns are obtained from Bloomberg for the 3-year period following the IPO. A time series of oil prices, carbon prices, and market indices is also obtained for analysis, all of which are retrieved from Bloomberg as both daily and monthly series. 3
The results are reported with respect to multiple market index benchmarks, including the Financial Times Stock Exchange 100 Index (FTSE100), the Deutscher Aktien Index (DAX), the Euronext Top 100 Index (N100), the DAX Alternative Energy Index (DAXAE), the WilderHill New Energy Global Innovation Index (NEX), and the Cotation Assistée en Continu 40 Index (CAC40). For each IPO in the sample, similar to both Ritter (1991) and Gao and Jain (2011), the first listed trading day on Bloomberg is defined as day zero in the event framework. Firms are followed from this initial listing date until the earlier date out of delisting or the 3-year anniversary after the IPO listing, meaning the return period will be truncated if the firm is delisted before this 3-year anniversary. Consistent with Ritter (1991) and Loughran and Ritter (1995), 1 year is defined as 12 consecutive 21-day trading day intervals (251 days). This means that the first month contains trading days 1 to 21; the second month contains trading days 22 to 42, and so on. Buy-and-hold returns are calculated as the difference between the product of buy-and-hold returns of the sample firm and the benchmark. This is represented by the following formula:
Gao and Jain (2011) state that there are multiple methods for detecting abnormal performance, each with their own benefits and downfalls. Therefore, using both the BHAR method and the calendar time methodology allows for the mitigation of potential issues associated with each model, providing evidence to confirm the robustness of the results. The calendar time approach involves developing a time-series of monthly portfolio returns and estimating the Carhart (1997) four-factor model. Consistent with the existing literature, the dependent variable is constructed as the excess return of a portfolio of green (gray) firms relative to the risk-free rate. Further, this model contains factors controlling for market risk, size, book-to-market ratios, and momentum as follows:

where
4. Green Versus Gray IPOs
Some interesting findings emerge from a simple descriptive analysis. In Figure 1, it is evident that the majority (172) of the offerings are from the U.K. Germany, Norway, and Italy contribute 31, 29, and 26 IPOs, respectively. It is clear the U.K. is responsible for a large majority of gray IPOs, mainly filed at the Alternative Investment Market (AIM). Proportionally, Germany has the highest number of green IPOs, indicating its role in the transition to renewables (Bohl, Kaufmann, and Stephan 2013). Figure 2 addresses the first research question by showing the evolution of green and gray IPOs across the sample period, highlighting periods of high IPO activity. IPO activity peaks in the years leading up to the 2008 Global Financial Crisis (GFC), with the greatest total number of IPOs occurring in 2005. While 2005 has the greatest number of gray IPOs, with 41 occurring during the year; the peak number of green IPOs is lagged by 1 year, with 14 occurring in 2006. Although the number of IPOs for both groups declines in wake of the GFC, the proportion of green IPOs relative to gray IPOs increases, indicating a deceleration of gray offerings. An interesting observation is the fact that gray IPOs peak in number in 2005, declining significantly from there on out. One explanation for this may be the ratification of the Kyoto Protocol in 2005, acting as a major step in a commitment to reducing emissions, of which gray firms in the energy sector are a major contributor. The lack of gray IPO activity post-GFC also supports this explanation over an economic cycle explanation.
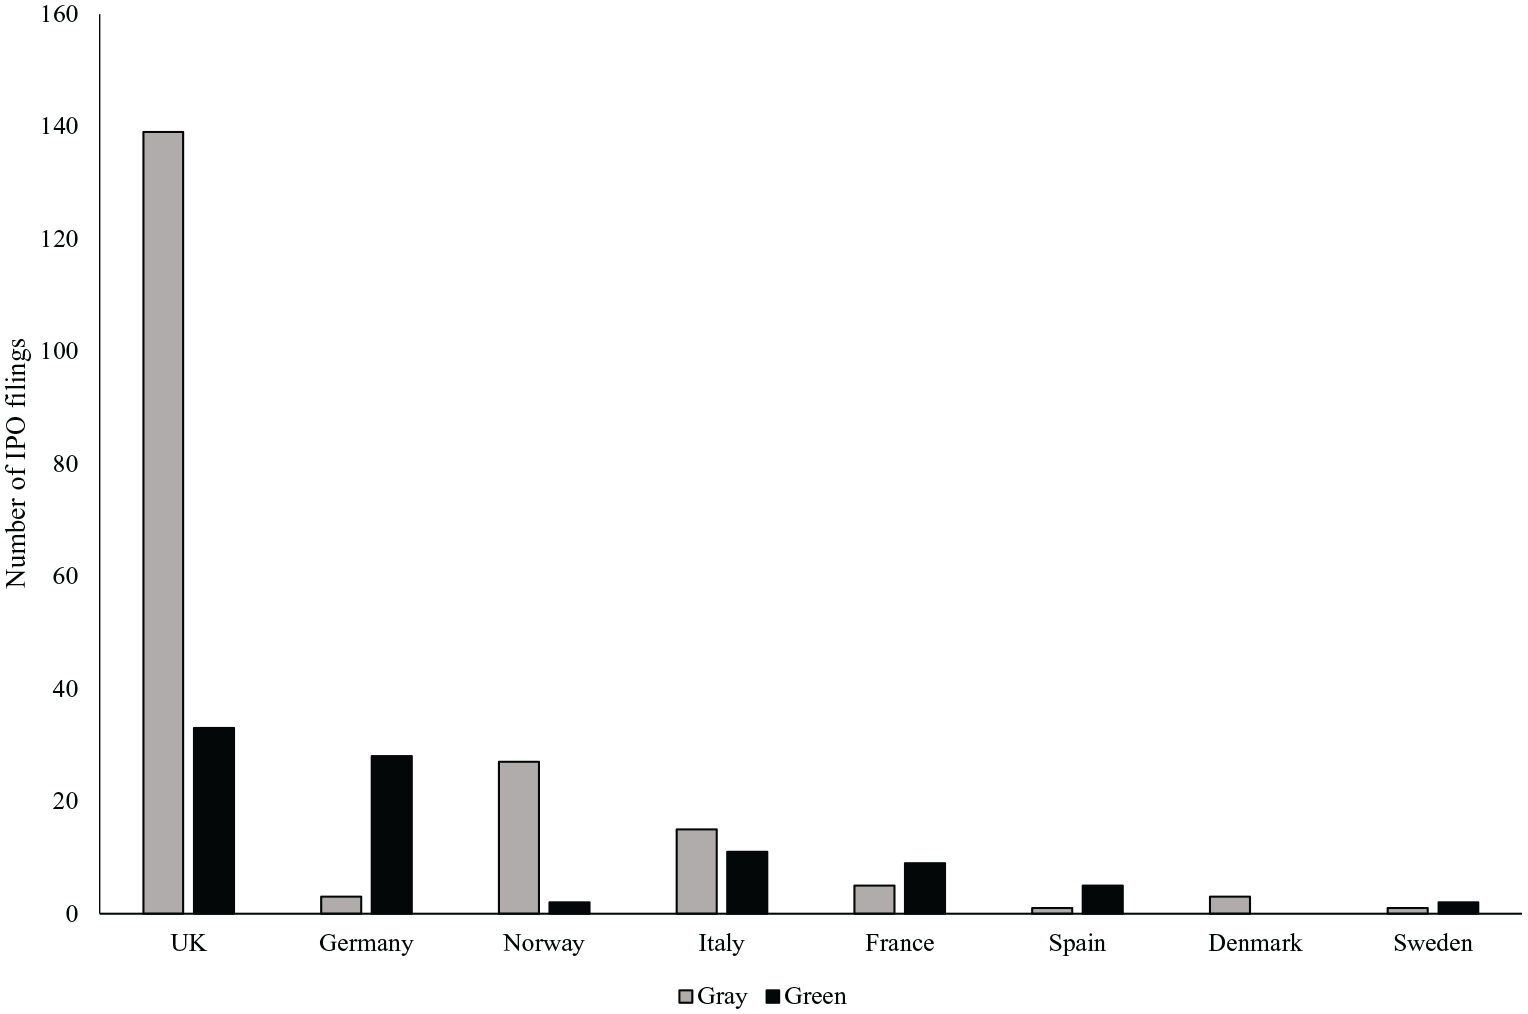
Number of IPO filings by country.
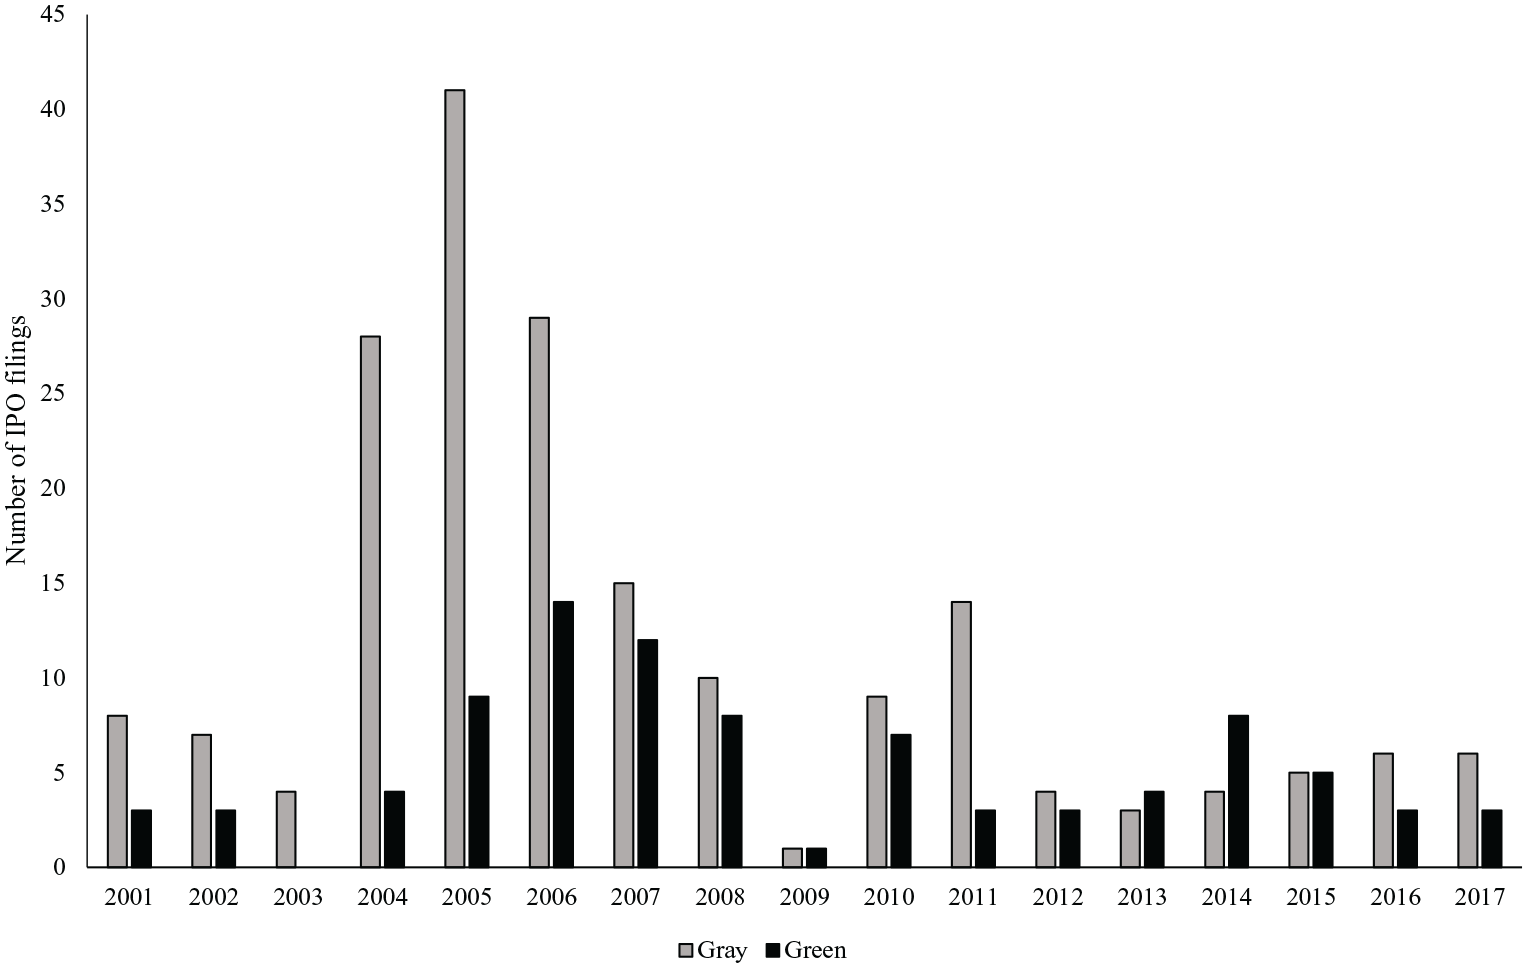
Number of IPO filings by firm type and year.
Table 1 shows the descriptive statistics and reports a significant difference between the frequency of IPO withdrawal for green and gray IPO filings, which suggests that green firms are more likely to withdraw, aligning with hypothesis 3. It appears that significantly more gray IPO companies file for an IPO at the AIM. The AIM is an exchange-regulated stock market with looser regulation and listing standards (Vismara, Paleari, and Ritter 2012). Formally, these second markets are not officially regulated by the European Financial Services Directives (Espenlaub, Khurshed, and Mohamed 2012). Although the difference in offer size is not statistically significant, the economic differences in firm size and age of green and gray firms are substantial, consistent with expectations. Gray firms are on average larger and older than green firms. The recent growth of renewable energy industries supports this finding, as firms in these industries have had less time to both grow and develop, resulting in smaller and younger firms (Jackson 2011). Consistent with this outcome, is the fact that green firms are observed to utilize higher levels of debt than gray firms. Green firms are younger, subject to more uncertainty, and require more external funds to make up for a deficit of internal cash flows, thus making debt a more viable source of capital. The finding that VC backing is more likely in green IPOs supports hypothesis 1, however the greater involvement of PE is surprising. This is because the characteristics of green firms misalign with the traditional characteristics desired by PE firms (Gompers, Kaplan, and Mukharlyamov 2016). Regardless, it appears that green IPOs have greater PE and VC involvement than gray IPOs.
Descriptive Statistics.
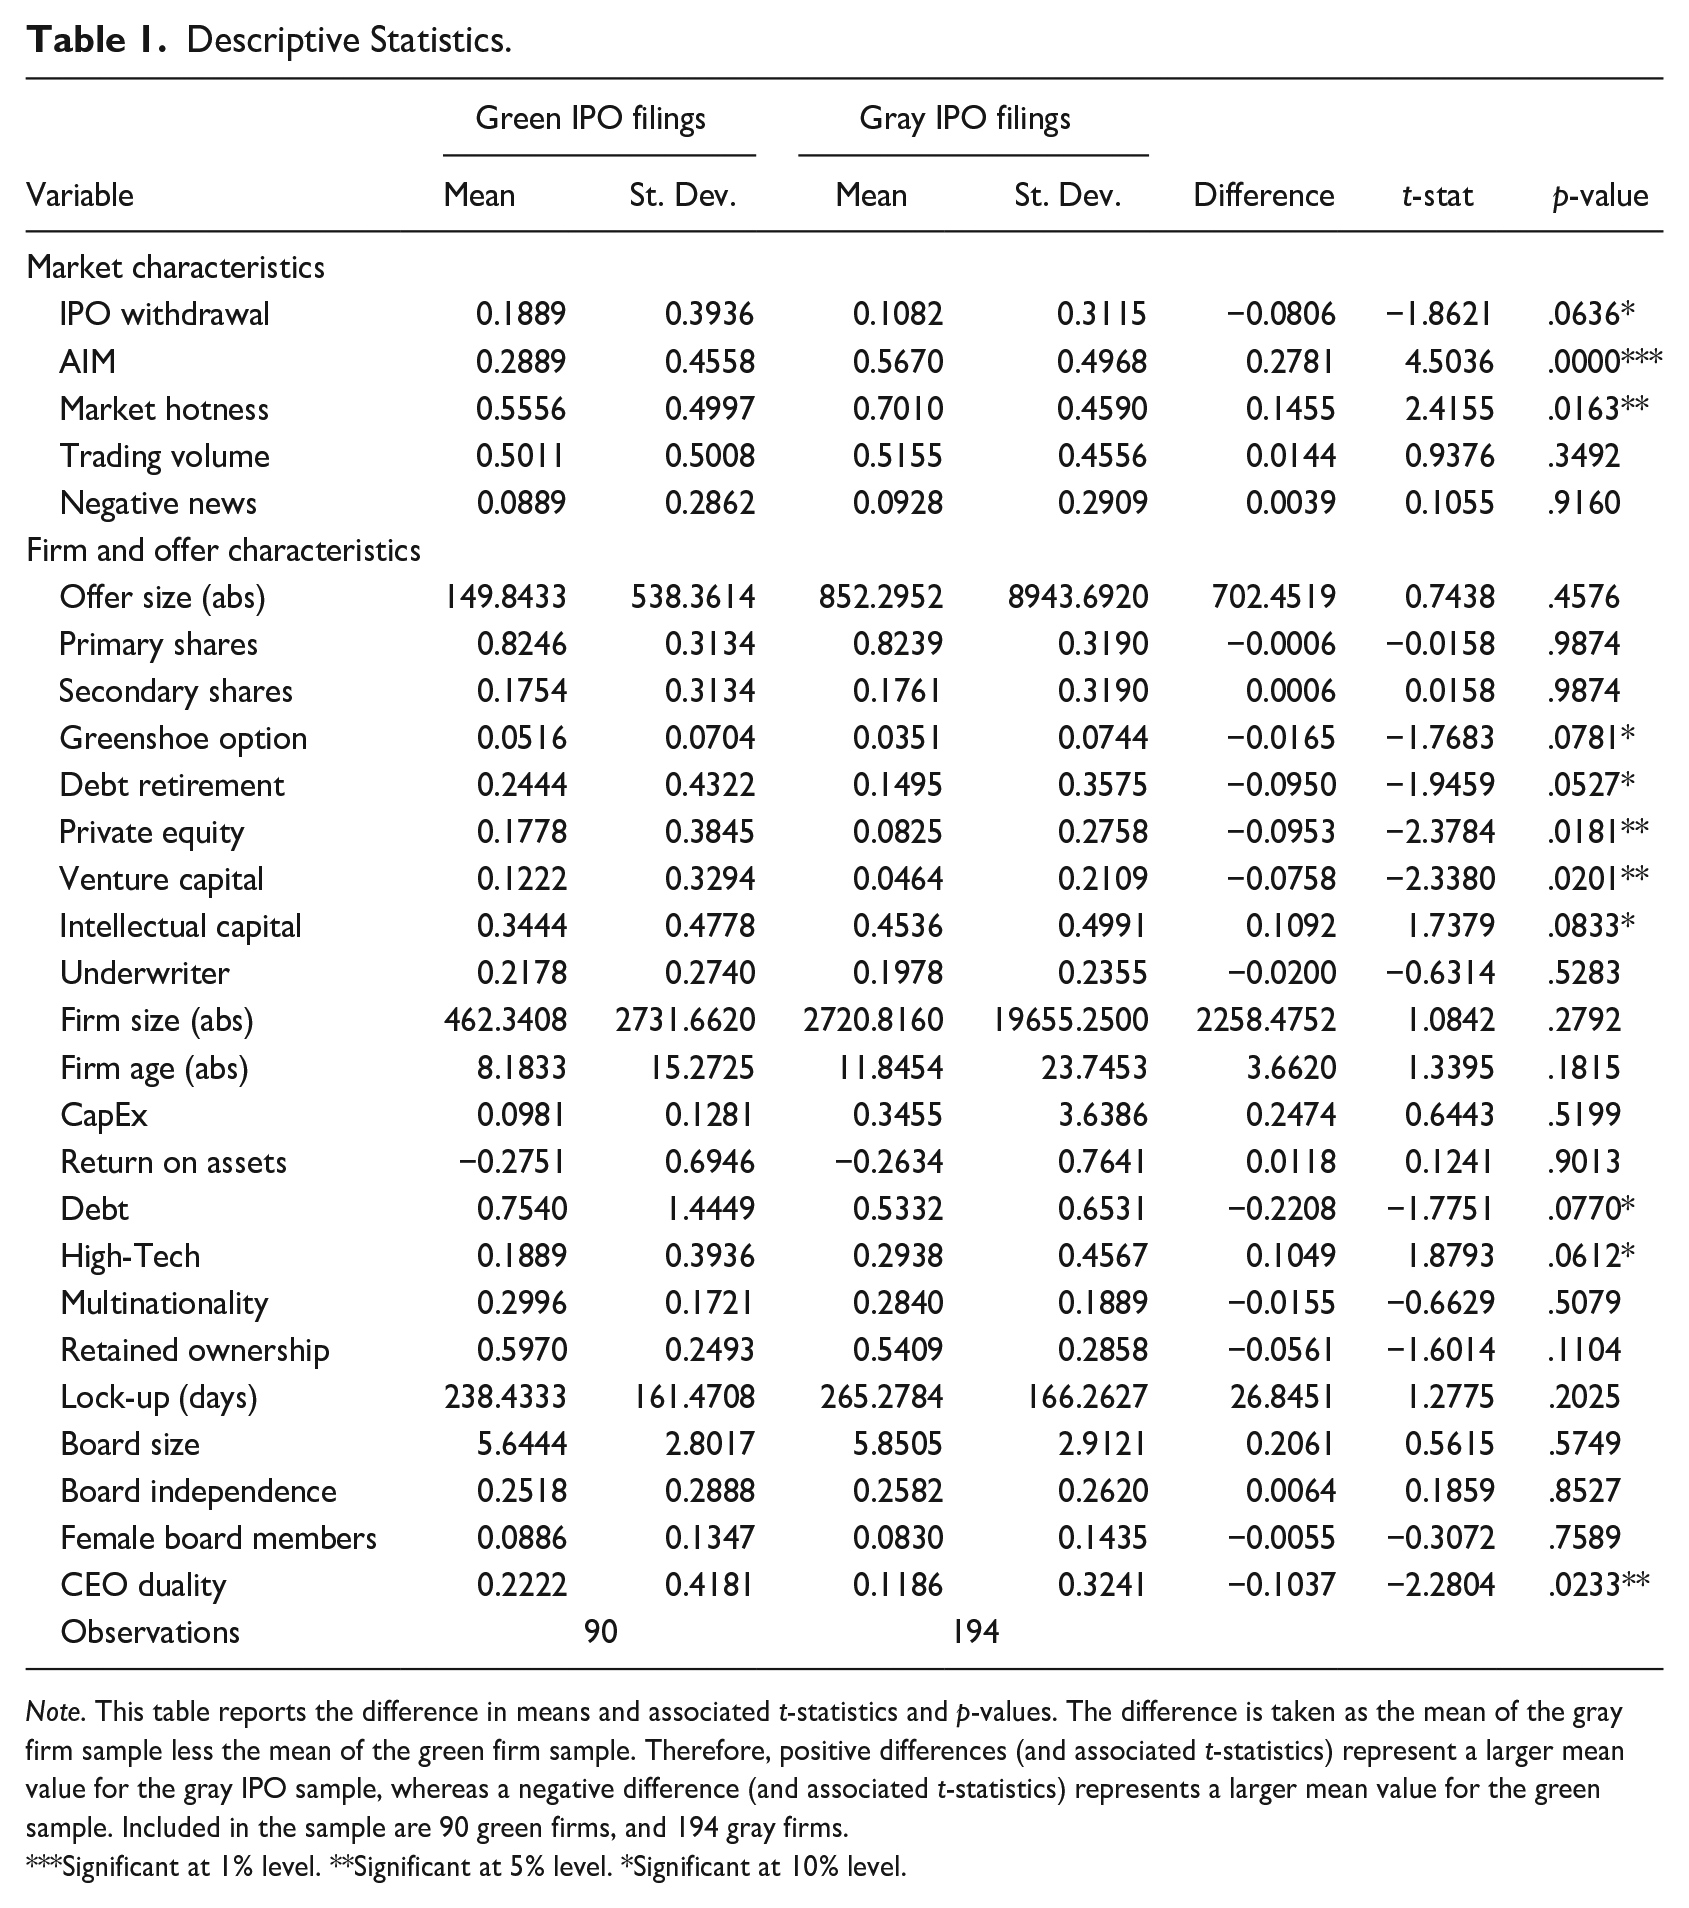
Note. This table reports the difference in means and associated t-statistics and p-values. The difference is taken as the mean of the gray firm sample less the mean of the green firm sample. Therefore, positive differences (and associated t-statistics) represent a larger mean value for the gray IPO sample, whereas a negative difference (and associated t-statistics) represents a larger mean value for the green sample. Included in the sample are 90 green firms, and 194 gray firms.
Significant at 1% level. **Significant at 5% level. *Significant at 10% level.
4.1. Green Firm Ownership Characteristics
Table 2 identifies variables that determine a green IPO company (see Table A1 for further description of the variables). Three models are run; one with only the variables of interest, a stepwise model at the 10% level of significance, and a third model containing all variables of interest and control variables. Both, the PE and VC dummy variables, exhibit significance. We see that the VC dummy has a positive marginal effect of around 28% across the three models, indicating that the presence of VC in an IPO makes the issuing firm more likely to be green, consistent with hypothesis 1. This result is economically significant, while also being consistent with the emphasis Moore and Wüstenhagen (2004) placed on the role of VC in providing financial support to green firms. Surprisingly, we also see a positive marginal effect (13.63%–25.20%) suggesting that PE plays a similar role to VC in supporting green issuing firms; despite PE firms traditionally tending toward mature and developed industries (Gompers, Kaplan, and Mukharlyamov 2016). While it is not surprising to see high levels of PE and VC backing in IPOs, we highlight the fact that green IPO firm characteristics are more aligned with VC investing. Comparing the magnitude of the marginal effects, we can see that whilst the presence of both PE and VC significantly increases the probability of a firm being green, the presence of VC has a larger impact. An explanation for the PE involvement with green IPOs could be due to a shift of investor toward incorporating ESG standards into PE investments (Indahl and Jacobsen 2019).
Probit Analysis: Green Firm Dummy.
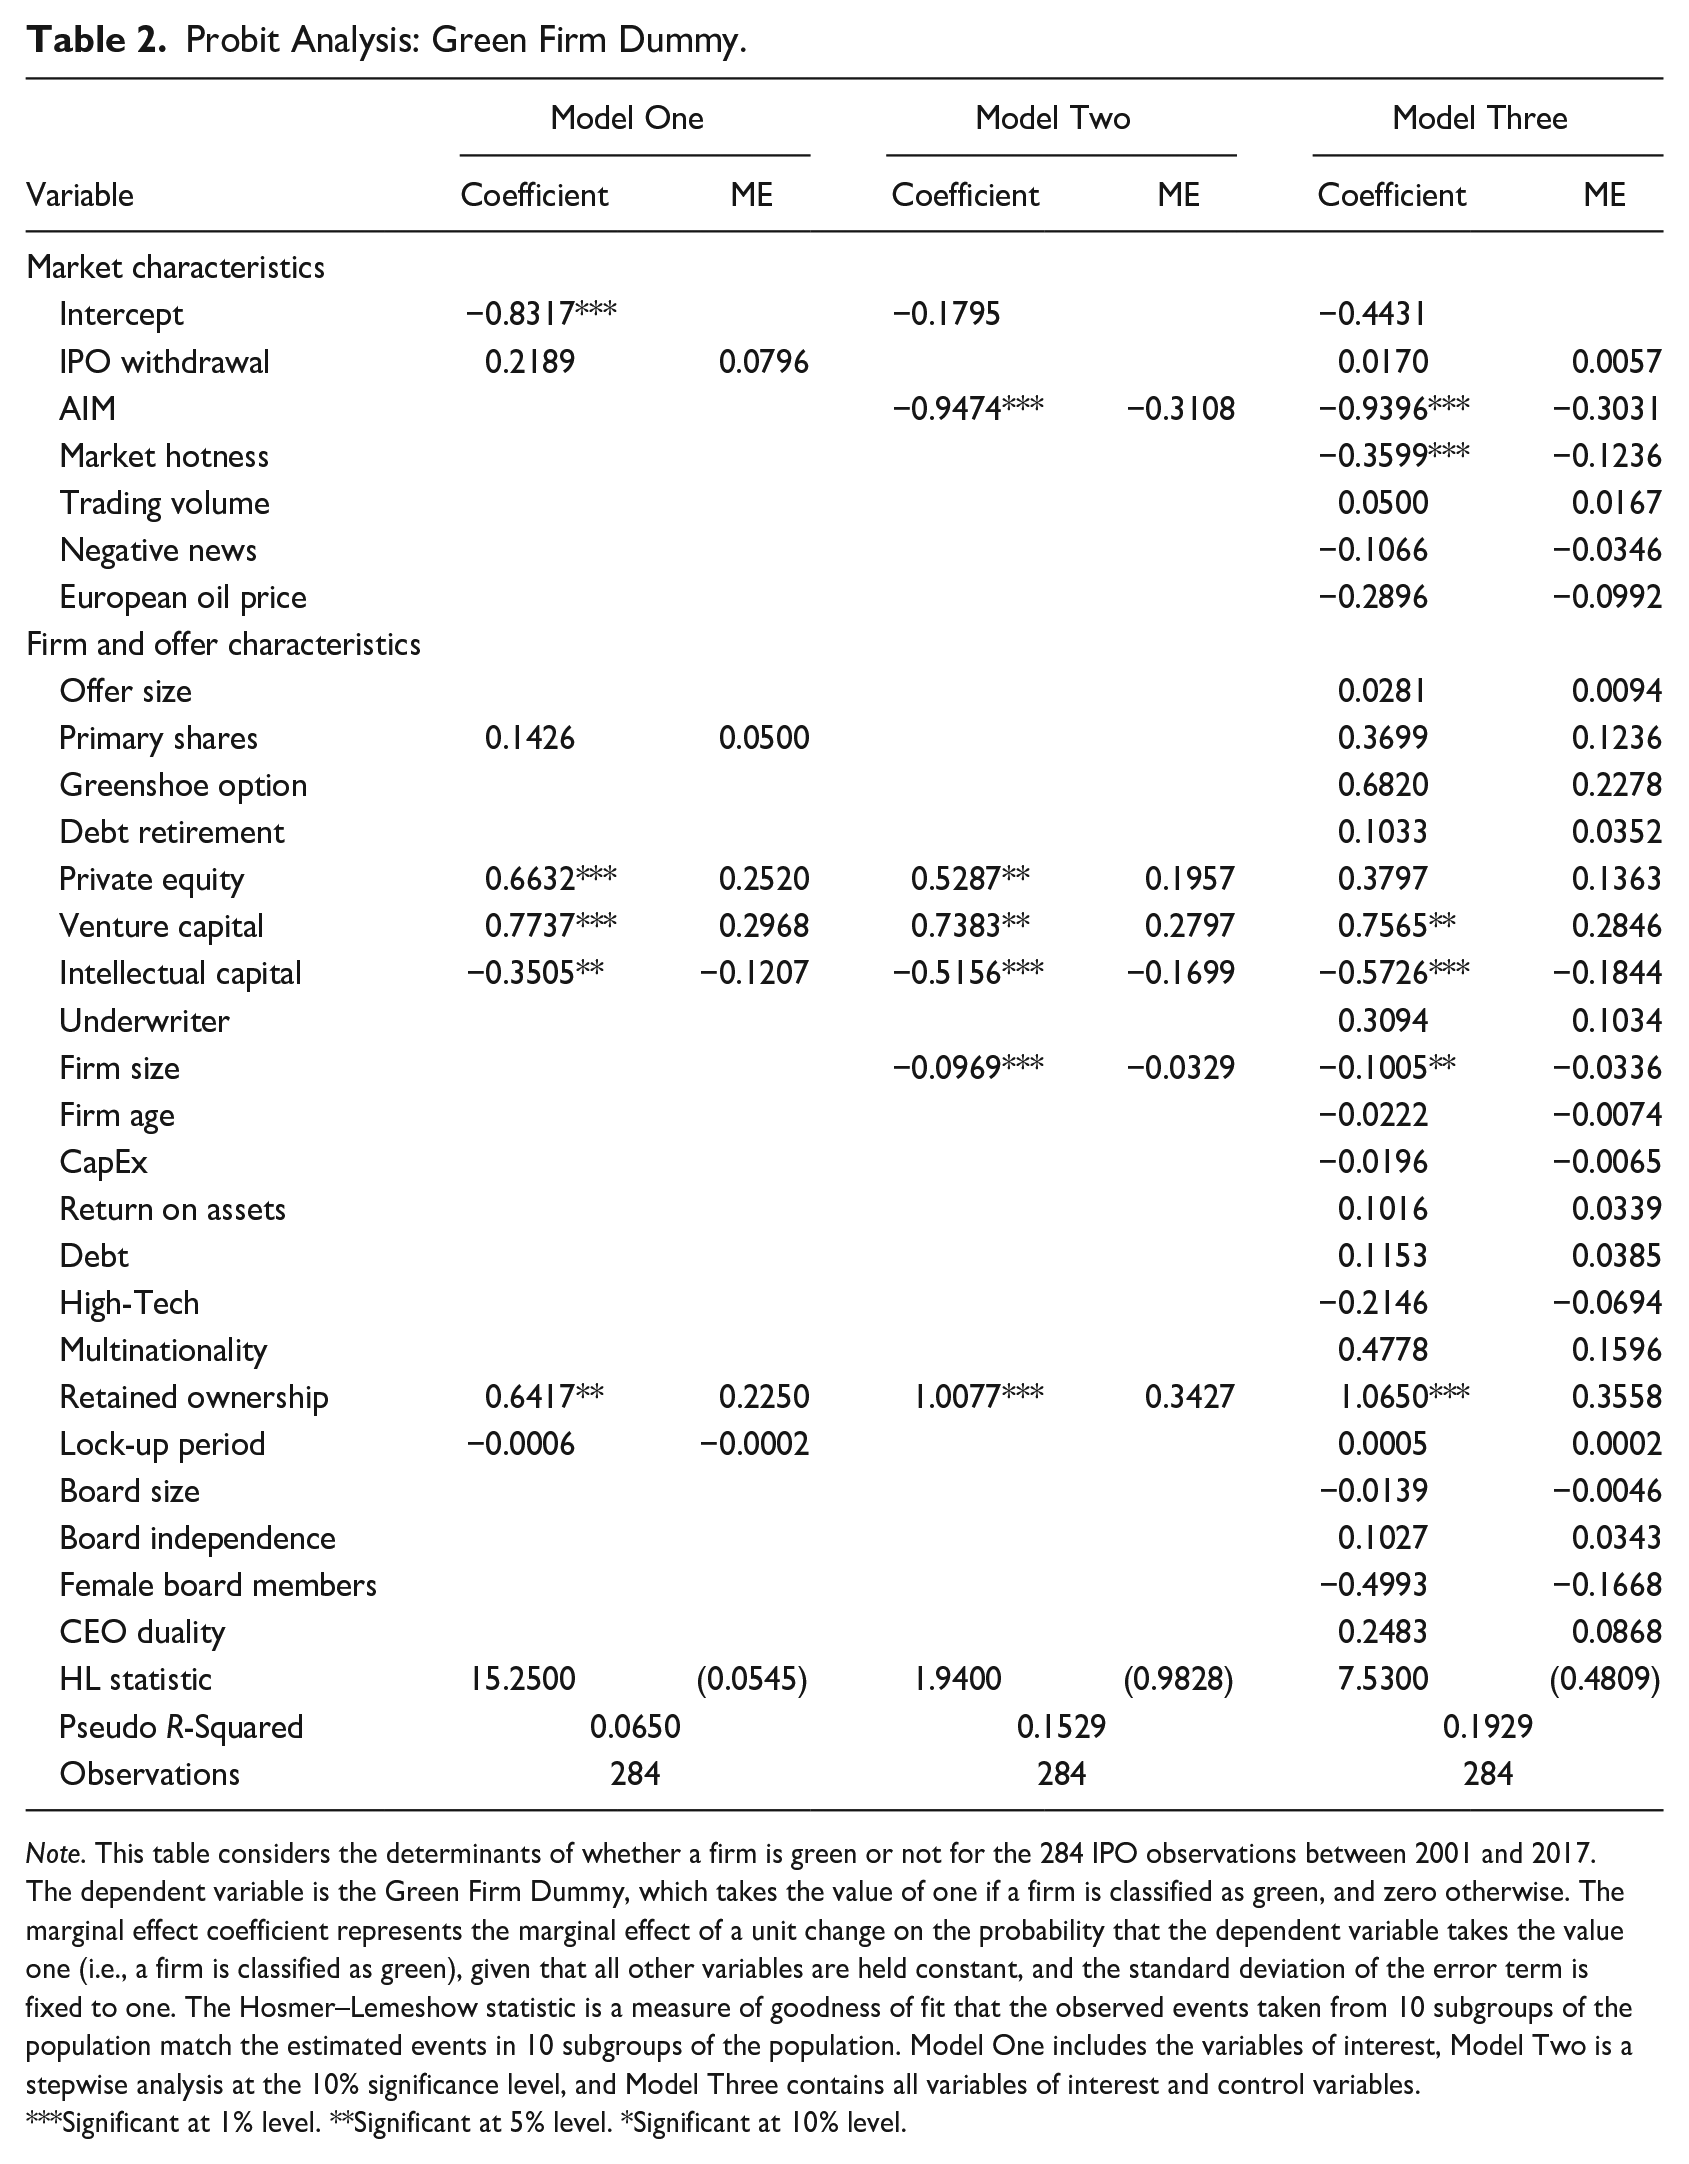
Note. This table considers the determinants of whether a firm is green or not for the 284 IPO observations between 2001 and 2017. The dependent variable is the Green Firm Dummy, which takes the value of one if a firm is classified as green, and zero otherwise. The marginal effect coefficient represents the marginal effect of a unit change on the probability that the dependent variable takes the value one (i.e., a firm is classified as green), given that all other variables are held constant, and the standard deviation of the error term is fixed to one. The Hosmer–Lemeshow statistic is a measure of goodness of fit that the observed events taken from 10 subgroups of the population match the estimated events in 10 subgroups of the population. Model One includes the variables of interest, Model Two is a stepwise analysis at the 10% significance level, and Model Three contains all variables of interest and control variables.
Significant at 1% level. **Significant at 5% level. *Significant at 10% level.
The disclosure of intellectual capital or the company’s competitive advantage in the IPO prospectus appears to have a negative effect on a firm being classified as green. The marginal effects range from −12.07% in Model One to −18.44% in Model Three, this may be explained by gray IPOs requiring more help to “get moving,” leading them to require clearer articulation of their intellectual capital or competitive advantage. This is also consistent with the notion (outlined in Section 2.2.), that green firms have greater information asymmetry and may be less willing and able (e.g., they may have filed for, but not been awarded, patents) to disclose their intellectual capital even if they are more innovation-driven.
Consistent with the descriptive statistics, the results show that firm size has a negative effect on the classification of a firm as green (approximately −3%). As the number of IPO filings in the prior 180 days increase (hotness dummy), the probability that a firm is green decreases. This is in line with Chemmanur and He (2011) and market timing ideas that green IPOs are less reliant on market movements to go public compared to their gray counterparts. This is evident in Figure 2 as well, which shows a large peak in gray IPOs leading up to the GFC and then a significant drop.
In line with hypothesis 2, IPOs with higher levels of ownership retention are more likely to be green. The marginal effects range from 22.50% in Model One to 35.58% in Model Three, suggesting high statistical as well as economic significance. Thus, insiders in green firms retain more ownership than insiders of gray firms. We attribute this to two explanations. The first states that greater earnings uncertainty in green firms leads insiders to use ownership retention as a low-cost signal (Fan 2007). The second looks at this from a climate policy and investment quality perspective. Insiders of green firms may retain more ownership to signal quality by “investing in their own projects.” This ties into the insiders’ motive for the IPO, in particular, whether insiders are selling down their position and reducing their exposure, or whether they are retaining shares. This is especially relevant for this study, as momentum on climate action through policy and other means has grown significantly throughout the 2000s, particularly through events such as the ratification of the Kyoto Protocol in 2005 and the signing of the Paris Agreement in 2015. We conclude that, green firms hold a significantly more positive outlook than gray firms, leading to higher ownership retention. By selling down their ownership stakes, gray firms are taking action to reduce their exposure, sending negative signals to the market about the future of their investment.
Consistent with the descriptive results, the filing for an IPO at the AIM reduces the likelihood that a firm is green by about 30%. It shows that gray firms are more likely to take advantage of looser regulation on the AIM, therefore indicating that they may be trying to circumvent some of the regulations at official stock exchanges. This finding dents London’s reputation as a leading “green” financial center and suggests gray firm owners are “existing” in low regulatory markets where investor disclosure around climate risk may be lower than in other markets (Wardle, Mainelli, and Mills 2020).
4.2. Determinants of IPO Withdrawal
As previously, three models are run in Table 3; one with only the variables of interest, a stepwise model at the 10% level of significance, and a third model containing all variables of interest and control variables. 4 Contrary to our descriptive results above and hypothesis 3, the negative marginal effect of the Green Firm Dummy indicates that these firms are less likely to withdraw from the IPO process, reducing the probability of withdrawal by 6.37% (Model Two) to 12.82% (Model One). However, this effect only shows weak statistical significance. Upon further examination, the Pre-2011 Green Interaction Dummy captures green IPO filings prior to 2011 with a positive marginal effect on the probability of IPO withdrawal of over 22% (Model One). When viewing withdrawal as a lack of market interest, we interpret these two findings as a changing sentiment toward green firms from negative (pre-2011) to positive (post-2011) in recent years (see discussion of hypothesis 4 in Section 2.3).
Determinants of IPO Withdrawal: Green Versus Gray IPOS.
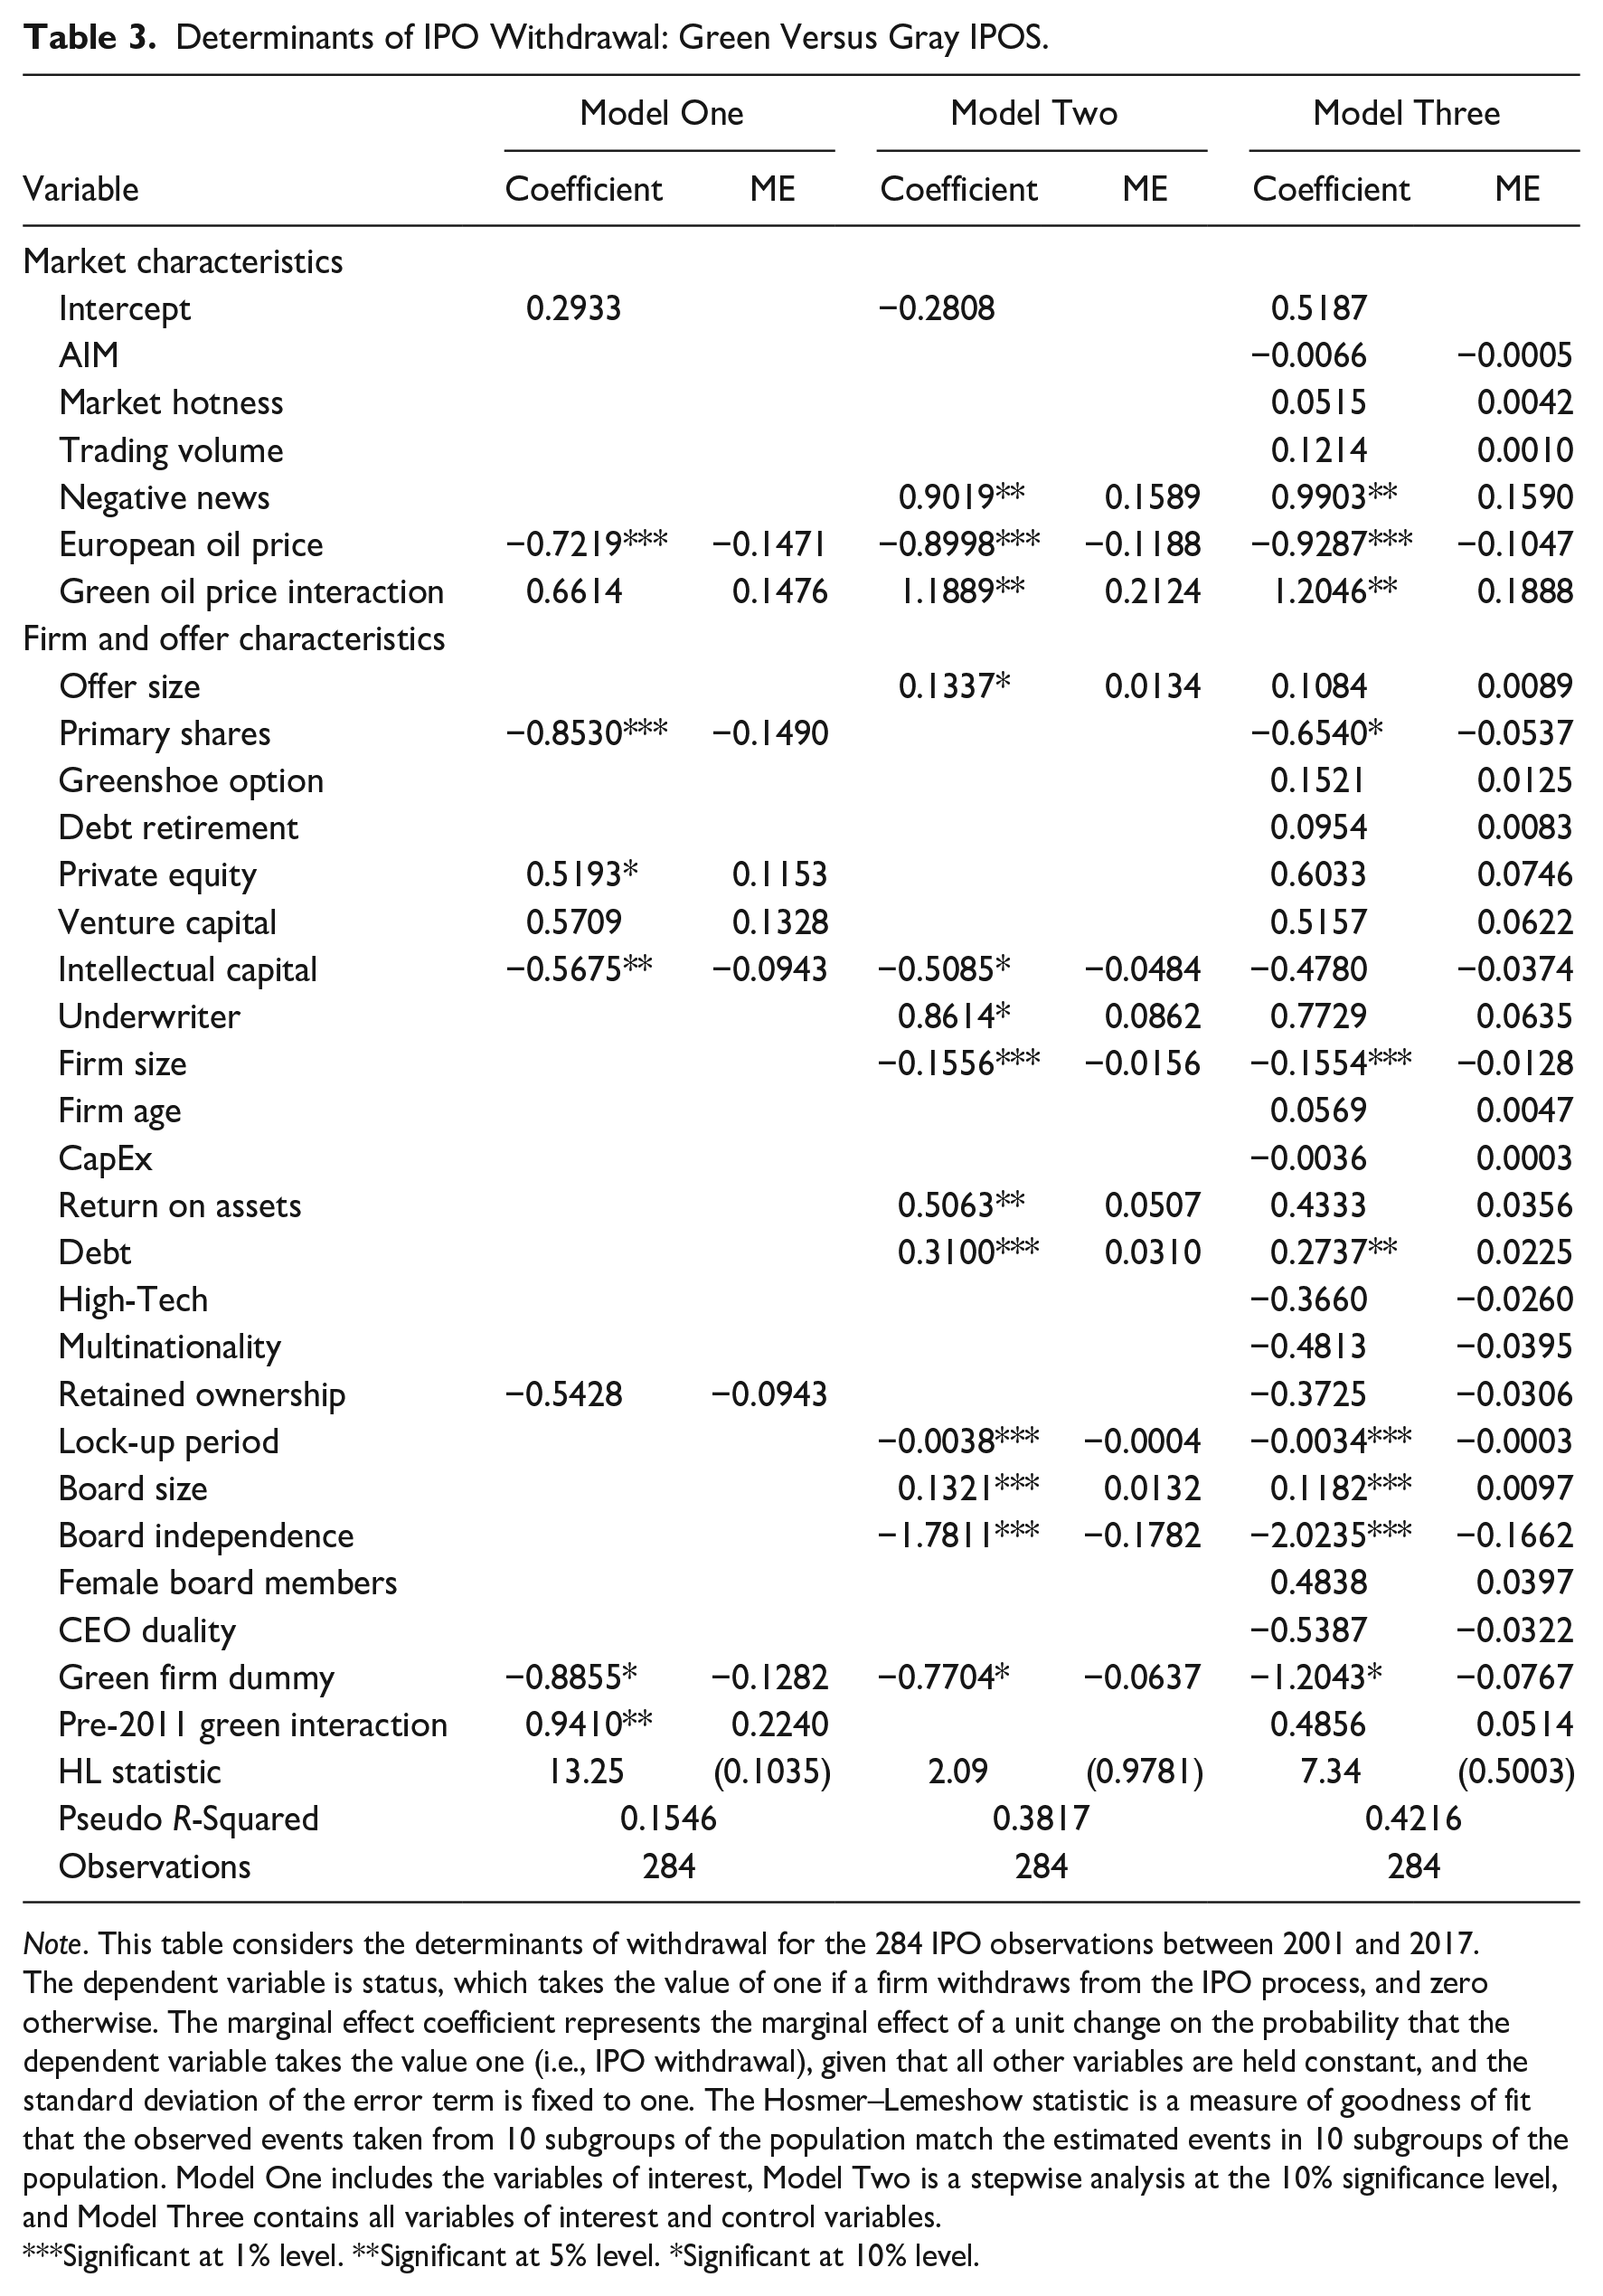
Note. This table considers the determinants of withdrawal for the 284 IPO observations between 2001 and 2017. The dependent variable is status, which takes the value of one if a firm withdraws from the IPO process, and zero otherwise. The marginal effect coefficient represents the marginal effect of a unit change on the probability that the dependent variable takes the value one (i.e., IPO withdrawal), given that all other variables are held constant, and the standard deviation of the error term is fixed to one. The Hosmer–Lemeshow statistic is a measure of goodness of fit that the observed events taken from 10 subgroups of the population match the estimated events in 10 subgroups of the population. Model One includes the variables of interest, Model Two is a stepwise analysis at the 10% significance level, and Model Three contains all variables of interest and control variables.
Significant at 1% level. **Significant at 5% level. *Significant at 10% level.
Of further interest is the European Oil Price Dummy, which shows that higher oil prices decrease the probability of withdrawal by about 10% to 15% across all settings. This may be driven by the greater proportion of gray firms in the sample, who are likely to succeed in times of high oil prices given more attractive cash inflows, revenue forecasts and correspondingly more productive assets. The use of the Green Oil Price Interaction variable, representing green IPO firms during high oil prices, provides support for this idea, as green firms are 14.76% to 21.24% more likely to withdraw in times of high oil prices. We attribute this to green firms holding a competitive disadvantage in terms of financial attractiveness during periods of high oil prices.
The Negative News Dummy, which shows the association of the company’s name with negative news in the year prior to the IPO, leads to increased probability of withdrawal of 15.90%. In contrast, the percentage of primary shares in our sample reduces the chance of withdrawal significantly by over 5%, while showing no significant effect in the broad market. Other variables such as firm size (around 1%) and board independence (over 16%) reduce the probability of IPO withdrawal while higher leverage (debt) significantly increases the probability of IPO withdrawal. Compared to the general results in Helbing, Lucey, and Vigne (2019), there appears some overlap in the drivers of IPO withdrawal, though the magnitude of the effect in our sample appears to be amplified. In summary, we identify that overall green firms are less likely to withdraw from the IPO process across the sample, which contradicts hypothesis 3; leading us to believe that a sentiment shift has already occurred to favor green firms in an IPO setting. Furthermore, results remain consistent when we specify the probit settings with year random effects. 5
4.3. Survival Analysis of Post-IPO Withdrawal Outcomes
In the green and gray sample, 38 IPO withdrawals out of 284 IPO filings are documented, constituting a withdrawal rate of about 13%. Table 4 shows the distribution and average time in months of post-IPO withdrawal outcomes according to classification. Companies that withdraw from the IPO predominantly (39.47%) are merged or acquired (M&A) or remain private (34.21%). One in almost five companies that withdraws from the IPO is terminated (inactive, 18.42%) and only 7.89% are trading after a second-time IPO. Again, contrary to hypothesis 3, on average, gray IPO withdrawals become inactive much faster (63 months) than green firms (91 months)—a difference of almost 3 years. This timing difference suggests that green firms are of better quality compared to gray ones. While gray firms are more frequently filing for a second-time IPO (14.29%), green firms more often remain private or are merged and acquired (both 41.18%). Consistent with findings from the probit analysis, these results indicate that green IPOs simply stay private and the existing shareholders retain their ownership. Overall, the subsample of green and gray IPO withdrawals is more frequently engaged in M&A compared to the total European sample, while being less likely to end up inactive. Within the first 2 years after an IPO withdrawal, almost all of the gray IPO withdrawals are likely to be merged or acquired (see Figure 3). Complementing the probit analysis in Section 4, it appears that the owners of the gray withdrawn IPO companies are exiting quickly. By way of contrast, insiders of green IPOs do not seem to be in a rush to exit. This would seem to be broadly consistent with hypothesis 2 and the notion that green and gray insiders have different motivations, with the latter interested in “exit.”
Post-IPO Withdrawal Outcome Distribution.
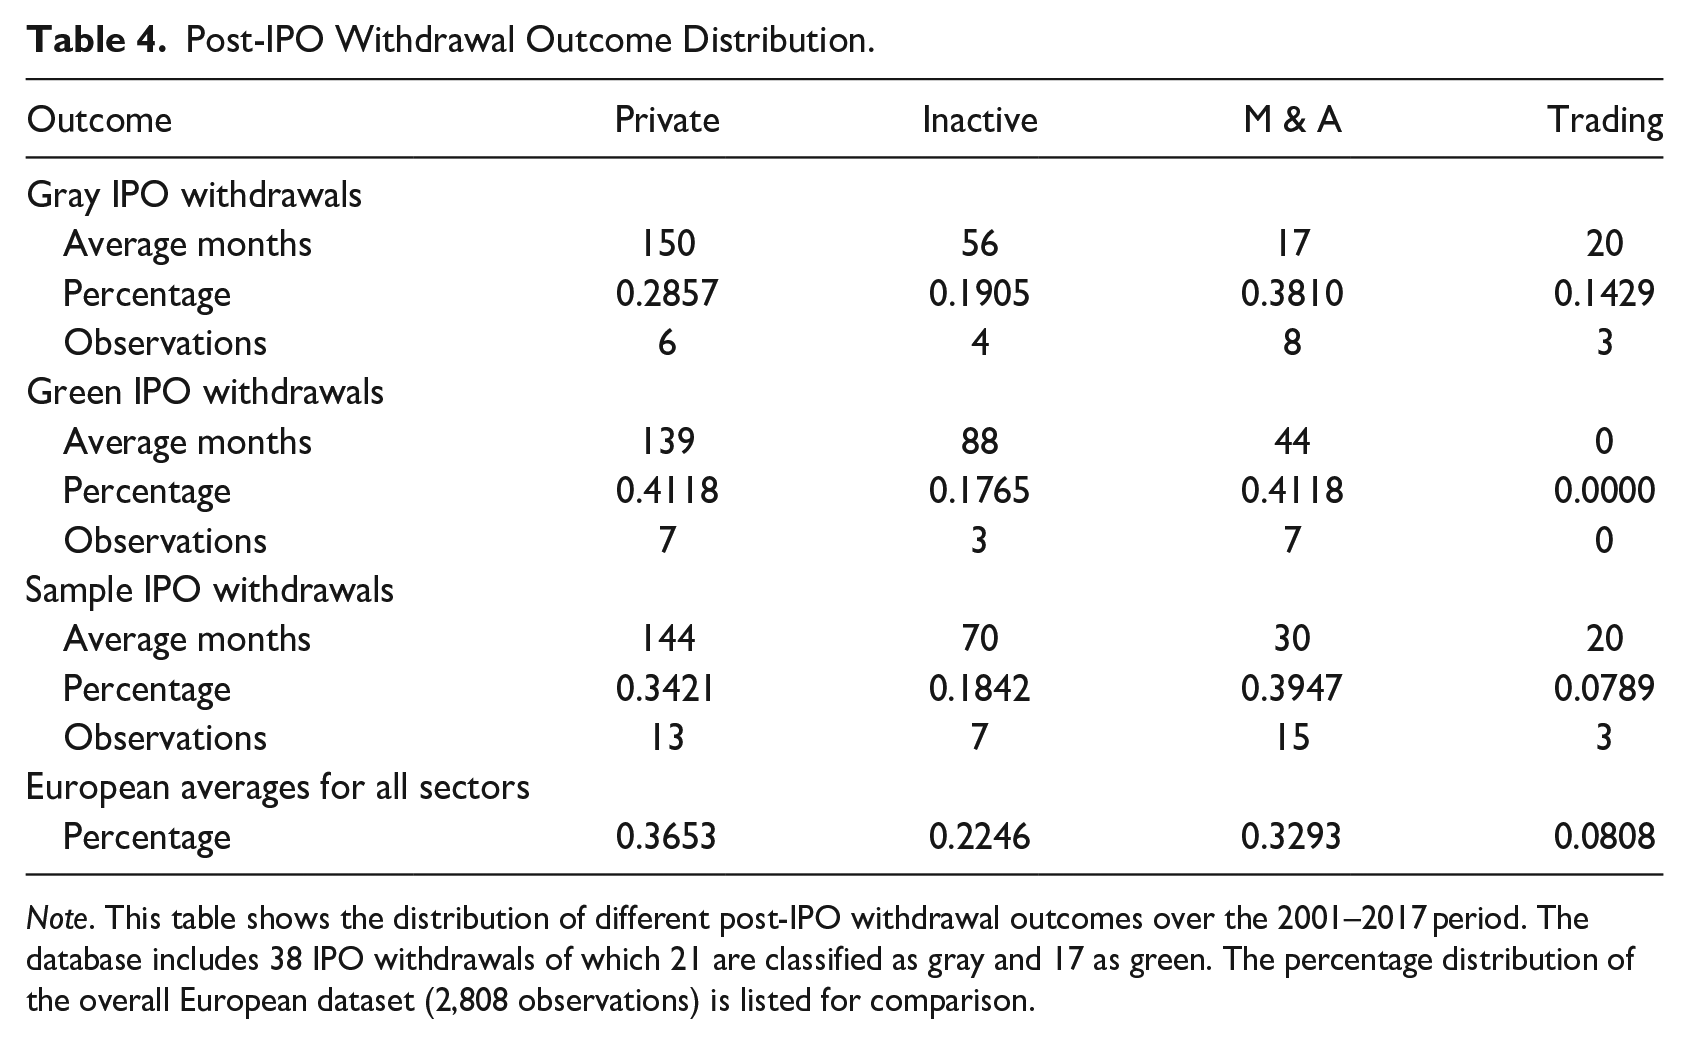
Note. This table shows the distribution of different post-IPO withdrawal outcomes over the 2001–2017 period. The database includes 38 IPO withdrawals of which 21 are classified as gray and 17 as green. The percentage distribution of the overall European dataset (2,808 observations) is listed for comparison.
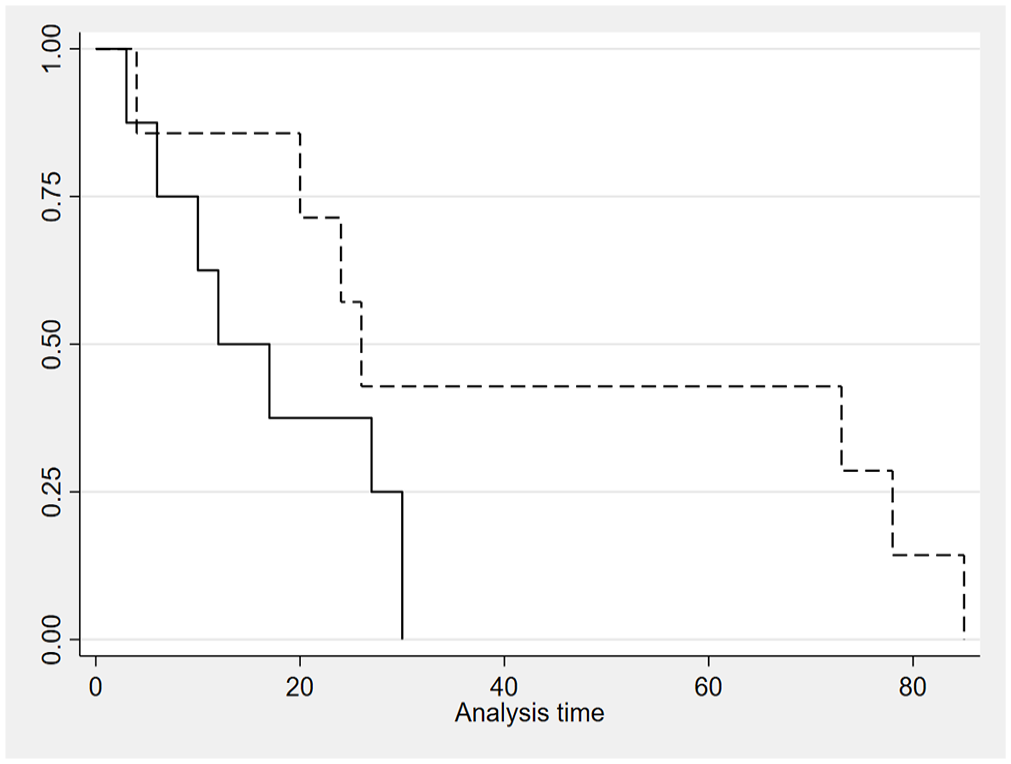
POST-IPO withdrawal M & A engagement: green versus gray.
4.4. Post-IPO Performance
In Table 5, we report the BHARs for three samples; all relevant IPO firms, all gray IPO firms, and all green IPO firms, in panels A, B, and C, respectively. In panel D, we report the difference in BHARs between green and gray firms. Consistent with Ritter (1991) and Loughran and Ritter (1995), we can identify underperformance of IPOs relative to the market indices consistent across all groups and all BHAR periods. The underperformance relative to all indices becomes more pronounced (returns become more negative) as the BHAR period increases from 12 to 36 months, indicating that issuing firms experience continually negative stock returns across the 36 months post-IPO. These positive initial returns in the first day (underpricing), followed by subsequent underperformance in the following 1 to 3 years post-IPO aligns with existing literature (Aggarwal, Leal, and Hernandez 1993).
Long-Run Post-IPO Buy-and-Hold Abnormal Returns.
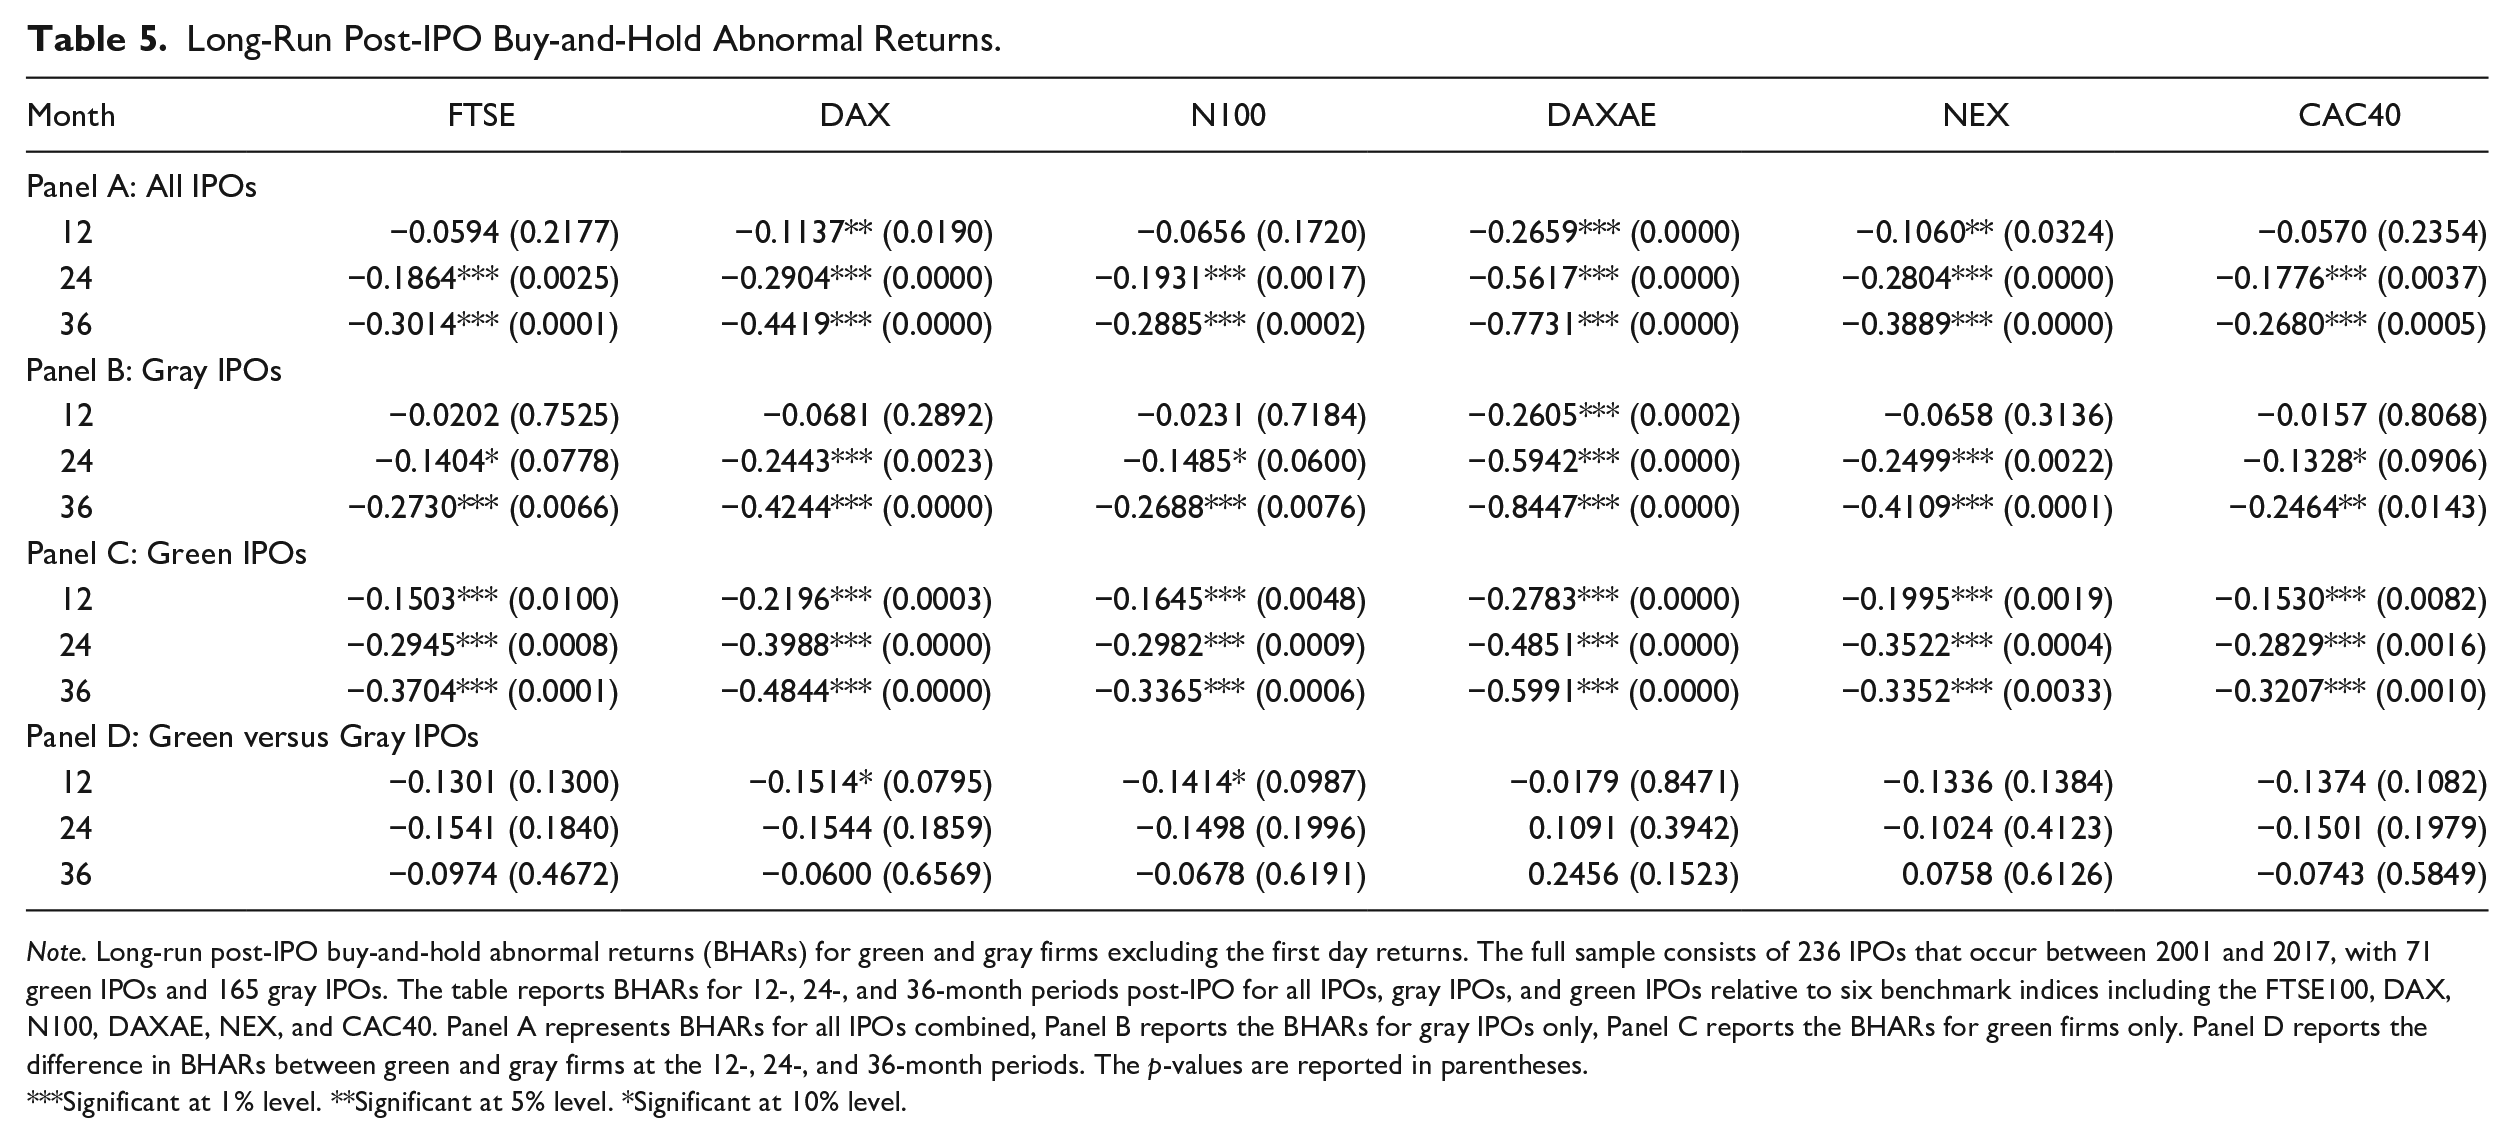
Note. Long-run post-IPO buy-and-hold abnormal returns (BHARs) for green and gray firms excluding the first day returns. The full sample consists of 236 IPOs that occur between 2001 and 2017, with 71 green IPOs and 165 gray IPOs. The table reports BHARs for 12-, 24-, and 36-month periods post-IPO for all IPOs, gray IPOs, and green IPOs relative to six benchmark indices including the FTSE100, DAX, N100, DAXAE, NEX, and CAC40. Panel A represents BHARs for all IPOs combined, Panel B reports the BHARs for gray IPOs only, Panel C reports the BHARs for green firms only. Panel D reports the difference in BHARs between green and gray firms at the 12-, 24-, and 36-month periods. The p-values are reported in parentheses.
Significant at 1% level. **Significant at 5% level. *Significant at 10% level.
In panels B and C both at the 12-month mark, there is no significant performance differential between gray firms and their respective benchmarks apart from the DAXAE index, whereas green firms significantly underperform all six benchmark indices. For both green and gray firms, this performance differential is amplified and becomes highly significant by the end of the second- and third-year post-IPO. Gray IPOs appear to experience a range of abnormal returns relative to their benchmarks between −24.64% and −84.47% by the end of the third year post-IPO. The greatest underperformance of gray firms is against the DAXAE index, which could partially be a function of the aforementioned bubble observed by Bohl, Kaufmann, and Stephan (2013) in German renewable energy stocks during the early to mid-2000s. The underperformance of green firms after 36 months post-IPO relative to the DAXAE is “only” −59.91%, providing evidence to support this notion.
Panel D provides a direct comparison of the BHARs between green and gray firms. The results indicate only marginally significant difference at the 12-month mark using DAX or N100 as a benchmark, and no statistical significance at 24 and 36 months post-IPO. Still, the performance differential is negative, indicating that green IPOs are underperforming compared to their gray counterparts. Consistent with Anderloni and Tanda (2017), green firms appear to underperform to a similar or greater extent at the end of the second year post-IPO than gray firms do by the end of their third year post-IPO. After 36 months, green firms experience BHARs that are all worse than those experienced by gray firms, except for the performance relative to the two green indices—DAXAE, as mentioned above, and NEX. In the case of the FTSE100, green firms underperform by almost 10% as much as gray firms.
In general, and in line with hypothesis 4, green firms experience significantly lower returns relative to the majority of indices in Europe in comparison to gray firms. This may be a result of the failure of markets in pricing non-pecuniary ESG factors and climate risk (Eccles, Krzus, and Ribot 2015; Hong, Li, and Xu 2019; Pástor, Stambaugh, and Taylor 2021). The decreased performance differential after 3 years might be evidence showing a long-run positive adjustment effect of environmental performance as suggested by Rassier and Earnhart (2011).
Figure 4 displays the performance differential, showing significantly more negative returns to green firms as well as increased volatility (movement) of green firm returns post-IPO. Green IPOs seem to be subject to larger fluctuations and more consistent negative returns of greater magnitude than gray firms. Overall, the results of the BHAR analysis provide evidence to support hypothesis 4, showing that green IPOs do in fact perform worse on average in comparison to both their benchmarks and gray firms, although we can identify statistical significance only for the 12-month horizon for specific benchmarks.
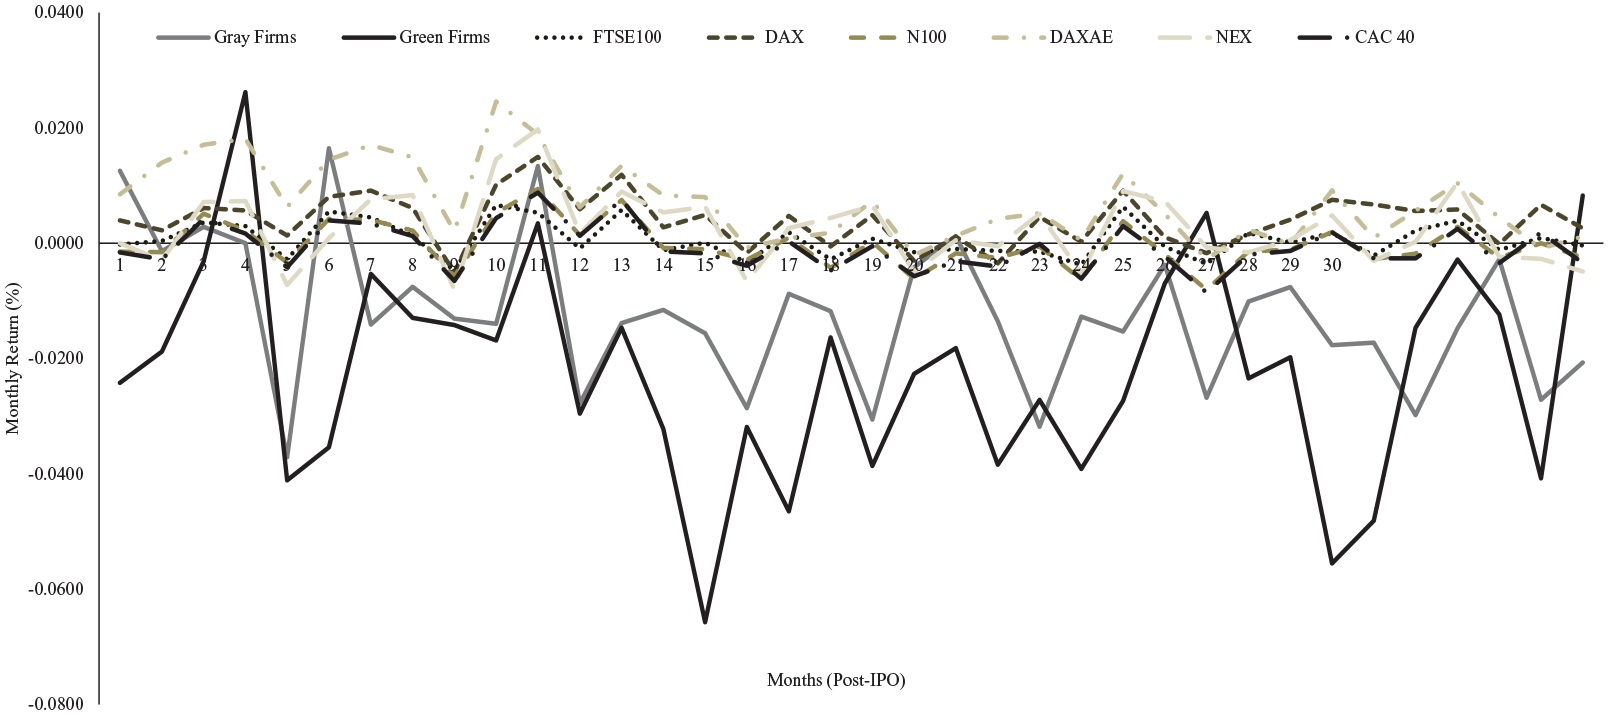
36-month post-IPO—monthly returns with price returns measure.
In Table 6, we report the results of the Carhart (1997) four-factor model and its variants, including the oil and carbon price series. The results are reported for the whole sample, as well as for two separate subsamples for only green and only gray firms, respectively. Across all regressions, the dependent variable is taken as the monthly excess return of each firm above the risk-free rate
Four-Factor Model.
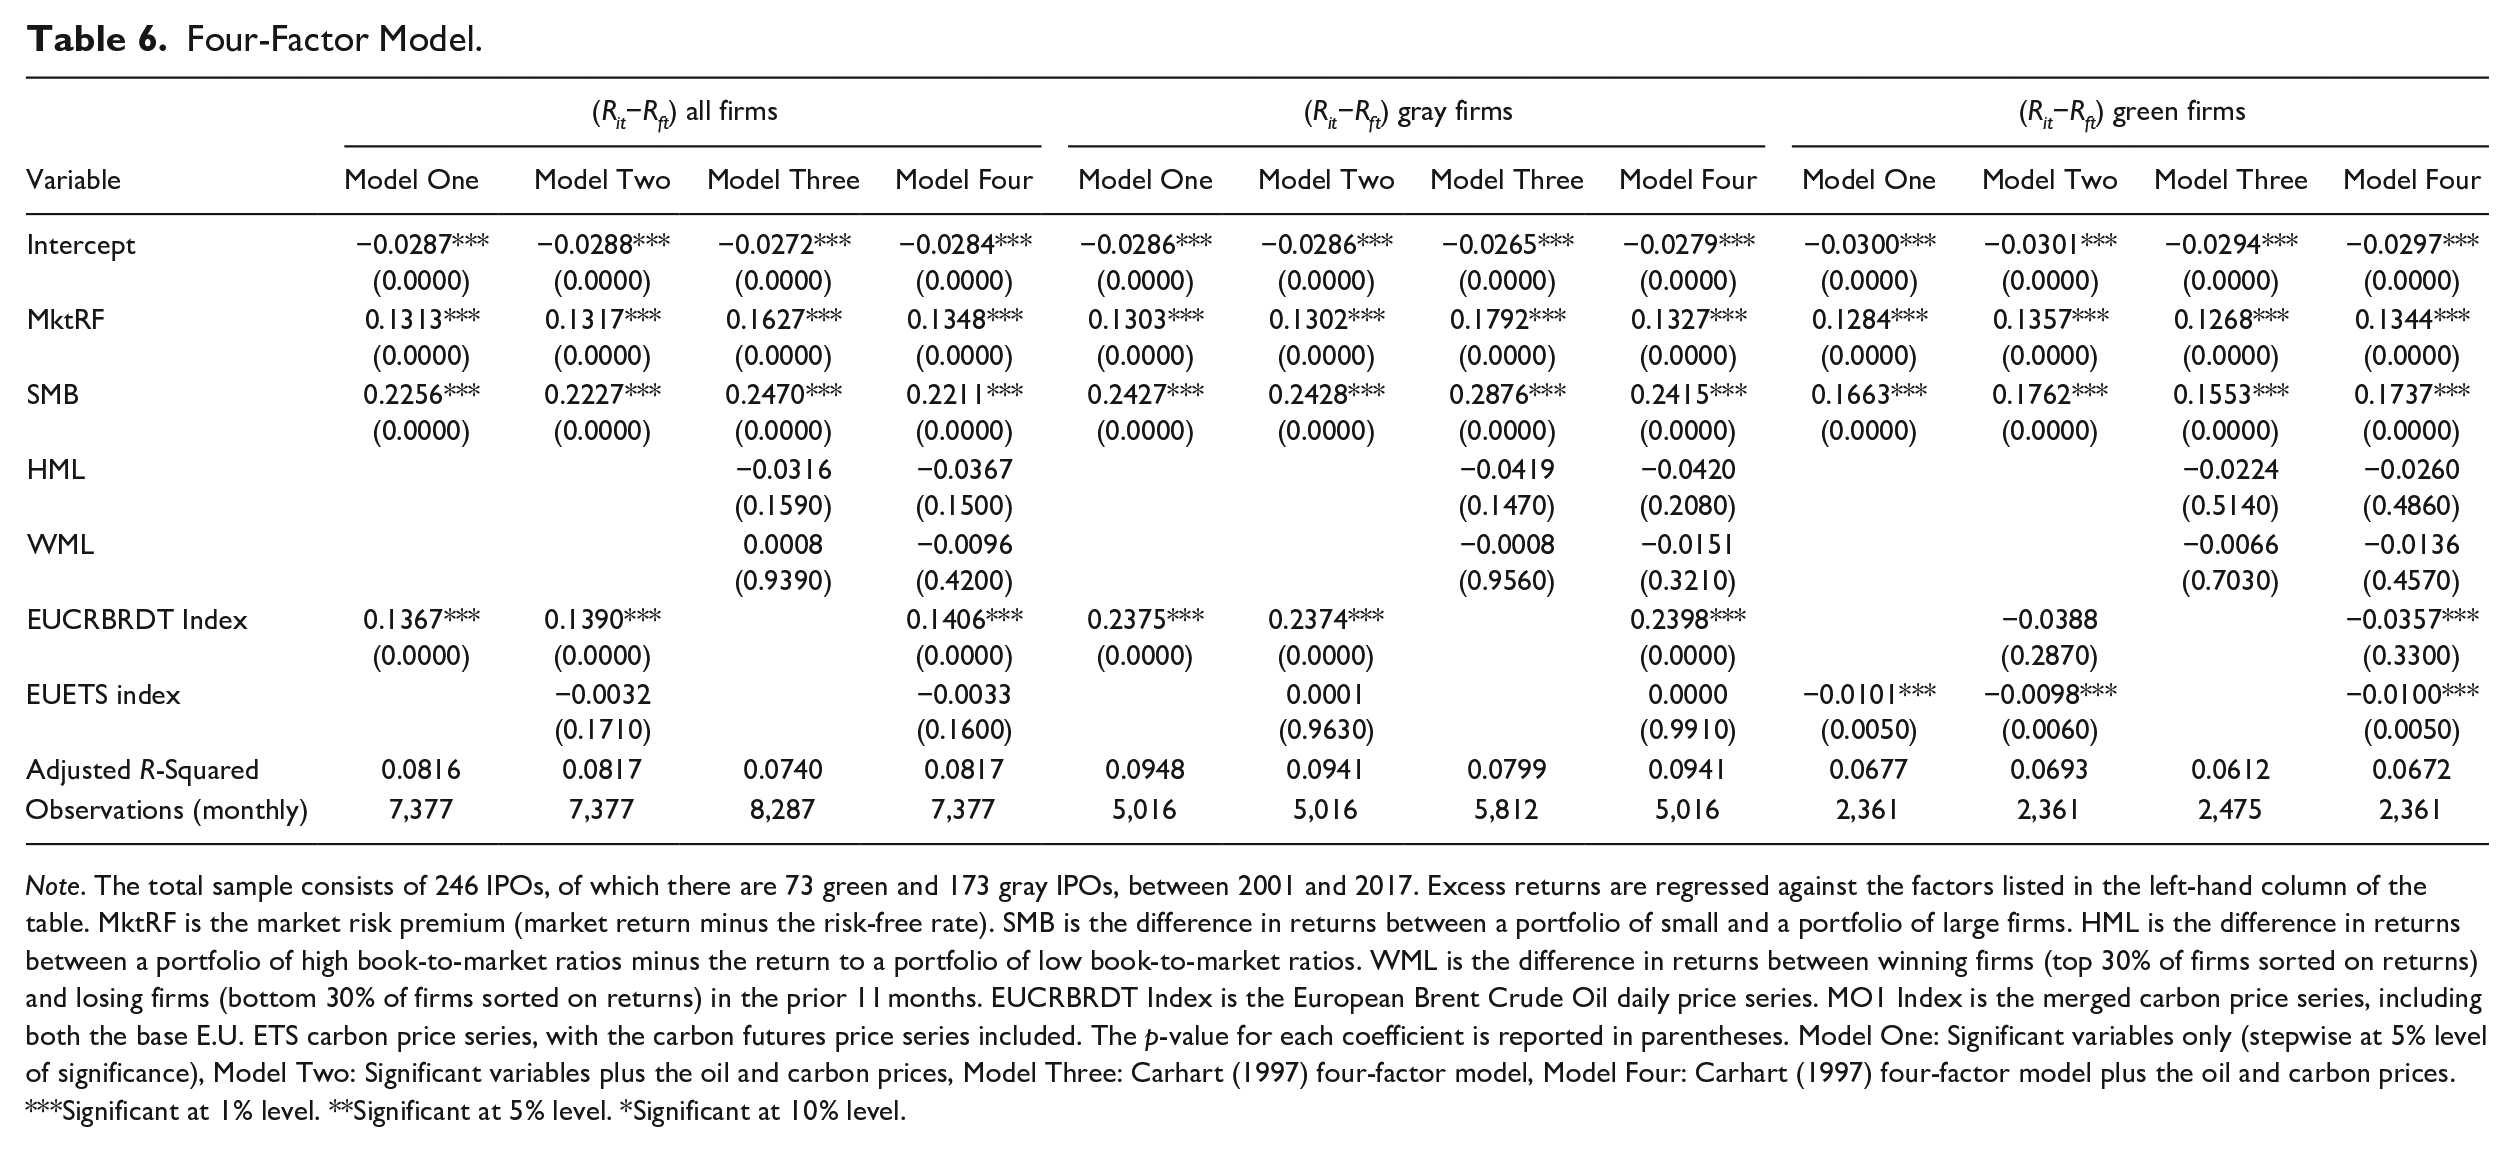
Note. The total sample consists of 246 IPOs, of which there are 73 green and 173 gray IPOs, between 2001 and 2017. Excess returns are regressed against the factors listed in the left-hand column of the table. MktRF is the market risk premium (market return minus the risk-free rate). SMB is the difference in returns between a portfolio of small and a portfolio of large firms. HML is the difference in returns between a portfolio of high book-to-market ratios minus the return to a portfolio of low book-to-market ratios. WML is the difference in returns between winning firms (top 30% of firms sorted on returns) and losing firms (bottom 30% of firms sorted on returns) in the prior 11 months. EUCRBRDT Index is the European Brent Crude Oil daily price series. MO1 Index is the merged carbon price series, including both the base E.U. ETS carbon price series, with the carbon futures price series included. The p-value for each coefficient is reported in parentheses. Model One: Significant variables only (stepwise at 5% level of significance), Model Two: Significant variables plus the oil and carbon prices, Model Three: Carhart (1997) four-factor model, Model Four: Carhart (1997) four-factor model plus the oil and carbon prices.
Significant at 1% level. **Significant at 5% level. *Significant at 10% level.
Of further importance are the highly significant beta (MktRF) and size (SMB) factors for gray firms. The beta values are clustered and indicate that returns to gray firms fluctuate less than the market. The size of gray firms also significantly explains the excess returns to a firm, indicated by the highly significant SMB coefficients across all regressions in line with previous research (Anderloni and Tanda 2017). Consistent with theory, smaller firms are seen to earn a significant return premium over larger firms (Brav and Gompers 1997), shown through the positive coefficients of approximately 24% to 29% across all models. When considering the oil and carbon price series, we find that, surprisingly only the oil price is significantly influencing the return for gray firms across the models (about 24%). This finding suggests that higher oil prices significantly increase returns for gray IPOs.
For green firms, the alpha values in the models show underperformance each month by approximately 3%. The results suggest that green firms are subject to greater underperformance than gray firms, evidencing a performance differential between green and gray firms. As shown in the descriptive statistics, green firms are significantly smaller, which usually indicates a return premium. However, after controlling for firm size, green firms are still identified to underperform gray firms. The beta coefficients are significant and smaller in magnitude compared with the gray firm sample (Models 1 and 3). Similar to their gray counterparts, the beta coefficients indicate that green firms are subject to less return fluctuation relative to the market. When considering the oil and carbon price series, we find that, only the carbon price is statistically but not economically significantly decreasing the return for green firms across the models (about 1%). Overall, we can see that after controlling for the Carhart (1997) four-factors, as well as oil and carbon prices, the underperformance of green firms relative to gray firms persists.
4.5. Evolution of Post-IPO Performance Over Time
To test our conjecture of changing investor sentiment toward green companies (see hypothesis 4), we create subsamples to analyze the performance differential of green and gray IPOs over time. Table 7 reports the evolution of the BHAR differentials for green and gray IPOs across different time subsamples. Panel A reports the baseline results of the main analysis (i.e., from Table 4), panel B reports the BHAR differential of the subsample of green and gray IPO companies for the post-Kyoto agreement period from 2005. Finally, panels C and D show the results for the two subsamples: IPOs from 2001 to 2008 as well as IPOs from 2010 to 2017. 6 We disregard the year 2009 to have an even split of time and due to the low number of green and gray IPOs that year (two IPO listings), a legacy of the GFC.
Evolution of Long-Run Buy-and-Hold Abnormal Returns of Green and Gray IPOS.
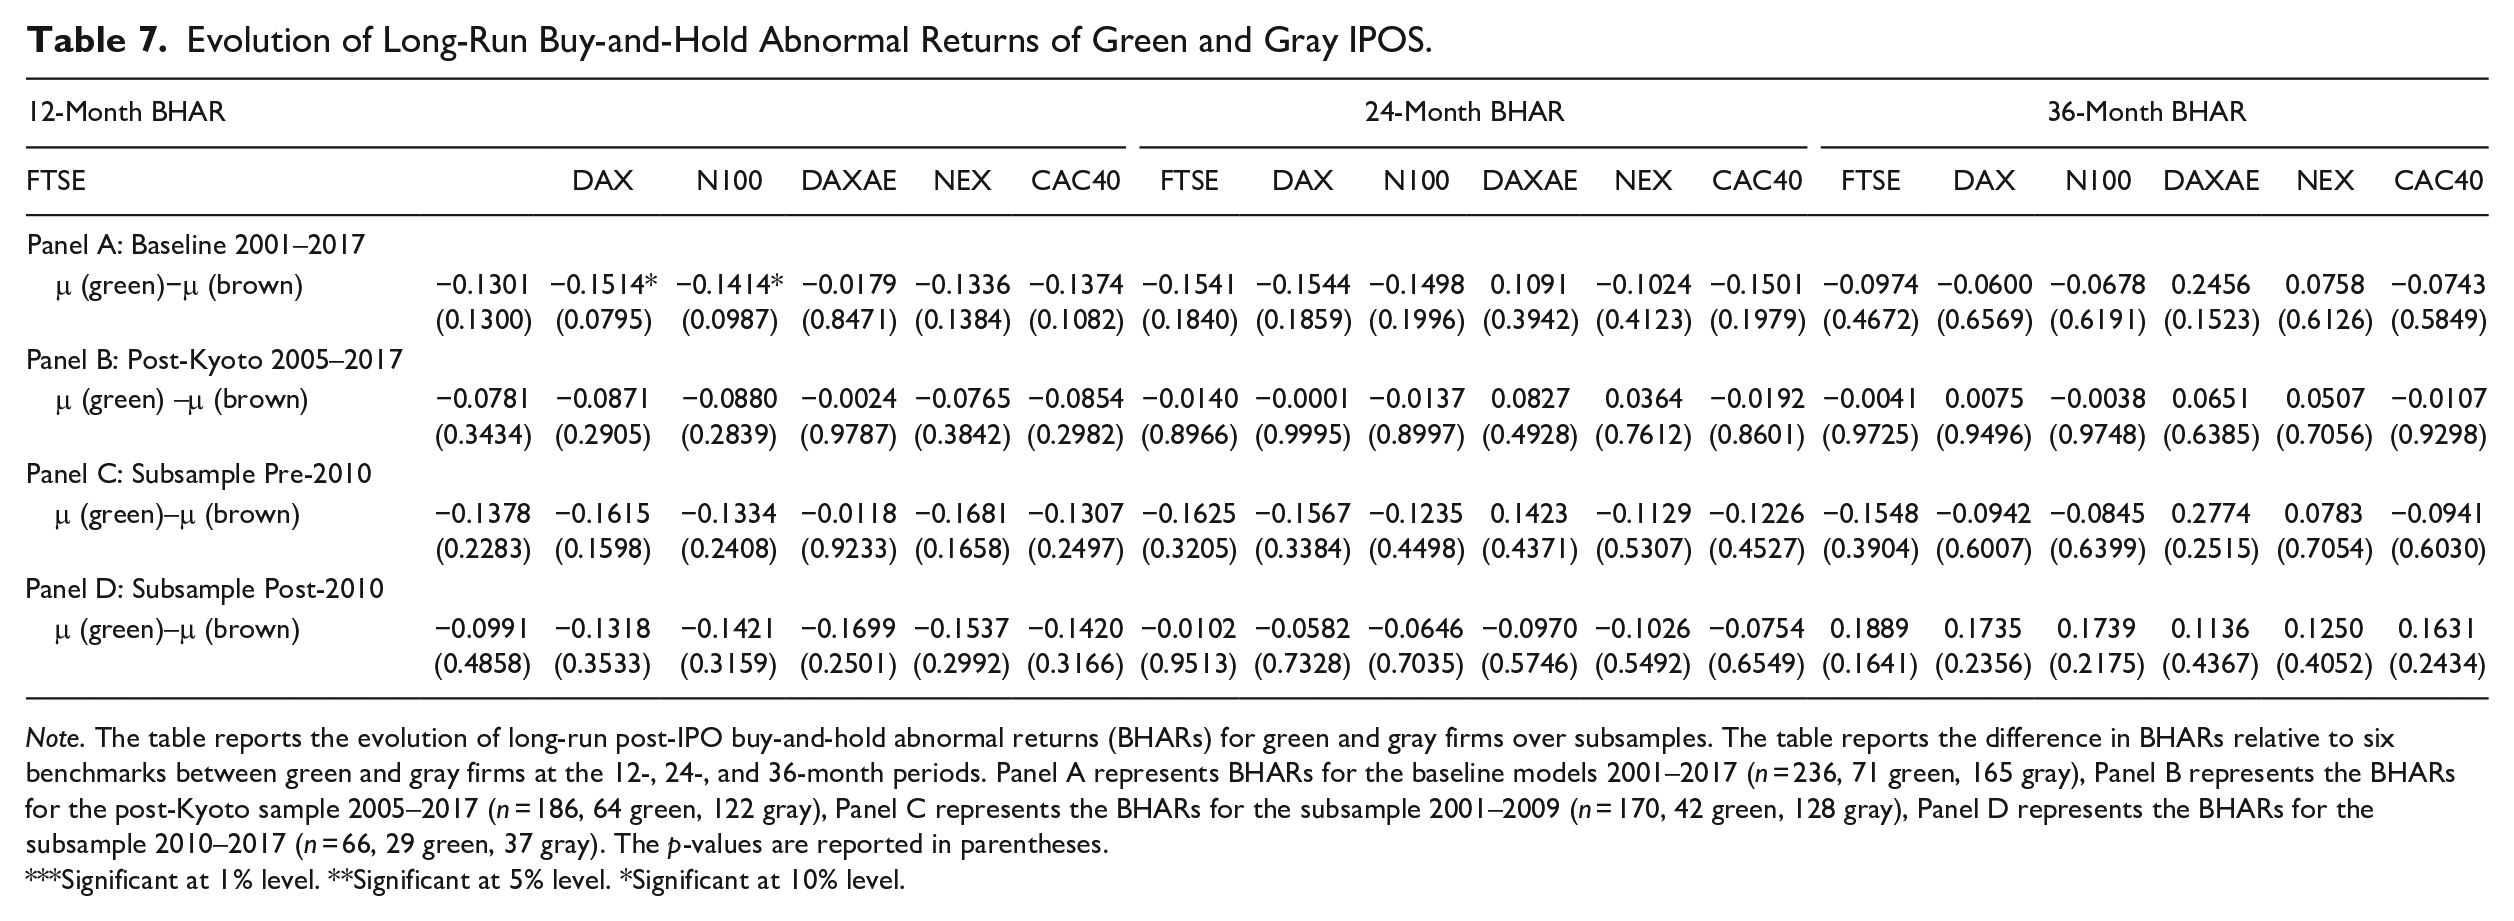
Note. The table reports the evolution of long-run post-IPO buy-and-hold abnormal returns (BHARs) for green and gray firms over subsamples. The table reports the difference in BHARs relative to six benchmarks between green and gray firms at the 12-, 24-, and 36-month periods. Panel A represents BHARs for the baseline models 2001–2017 (n = 236, 71 green, 165 gray), Panel B represents the BHARs for the post-Kyoto sample 2005–2017 (n = 186, 64 green, 122 gray), Panel C represents the BHARs for the subsample 2001–2009 (n = 170, 42 green, 128 gray), Panel D represents the BHARs for the subsample 2010–2017 (n = 66, 29 green, 37 gray). The p-values are reported in parentheses.
Significant at 1% level. **Significant at 5% level. *Significant at 10% level.
The results of the Kyoto subsample setting indicate a changing, more positive market sentiment toward green IPOs showing a consistently smaller BHAR differential between green and gray firms for the 12-, 24-, and 36-month period (Table 7, panel B). Still, green firms appear to perform worse than gray firms, but this differential becomes smaller and insignificant for the 12-month mark. Similar results (not reported) are obtained for the four-factor analysis of the post-Kyoto 2005 subsample, which highlight the dependence of gray IPOs on external factors such as the oil price.
By way of contrast and consistent with hypothesis 4, the results for the 2010 to 2017 subsample (Table 7, panel D) show a consistently smaller BHAR differential between green and gray firms across time periods. We even witness a sign switch, though not significant, in favor of green IPOs for the BHAR differential at the 36-month period. This improving relative sentiment toward green IPOs and away from gray IPOs is also apparent in unreported four-factor analysis of the 2010 to 2017 subsample. Overall, our results provide partial support for hypothesis 4.
5. Channel Testing
What might explain the improved relative performance of green IPOs over time? In this section, we explore whether institutional ownership and risk have provided the channels through which this performance has improved.
As noted in Section 2.2, previous research has identified the proportion of institutional ownership post-IPO to be an important signal of the quality and future success of the company undertaking the IPO (see for instance Lo, Wu and Kweh 2017; Lu and Samdani 2019; Nofsinger, Sulaeman and Varma 2019). We examine the proportion of institutional ownership in Figure A1, immediately following the IPO for both, green and gray, companies across time. We are able to retrieve values for 60 green and 148 gray IPO companies and are facing low numbers of IPOs for green firms in some years (i.e., 2009, 2012, 2015, 2017). While facing a noisy and low observation data environment, an analysis into institutional ownership may prove insightful, uncovering potential channels of underperformance for green versus gray IPOs. Despite the low number of observations for green firms, the data post-2009 indicates a clear upward trend of institutional ownership, which is also exceeding the gray holdings. Gray IPO firms have higher institutional ownership immediately after the IPO in earlier years. The landmarks of the increase in UNPRI signatories as well as the 2015 Paris Agreement seem to coincide with an increase in institutional ownership of green firms, and a decrease of institutional ownership in gray firms.
The above is suggestive that the proportion of institutional investing may be an important channel of performance. To formally test this channel on green/gray post-IPO performance, we regress firm 12-month BHARs on the green dummy, institutional ownership, and the interaction term between the green dummy and institutional ownership. Results are presented in Table A3. While the interaction term between the green dummy and institutional ownership is not statistically significant for the baseline results (i.e., 2001–2017), higher institutional ownership has a positive signaling effect for green firms in the first half of our sample period and significantly contributes to higher short-run post-IPO performance (panel B). The signaling effect diminishes with more institutional participation post-2010 (panel C). This suggests that institutional investors investing in green companies in the earlier years were rewarded with greater returns, and that this greater return has declined over time—presumably as a greater influx of institutional investors has led to higher valuations (lower IPO discounts) and perhaps reflects the lower risks of more mature green firms over time. This is a highly intuitive greater reward for additional risk taken and is consistent with our findings on the evolution of returns (see Table 7) and hypothesis 4.
We subsequently approximate the fundamental (business) risk in order to analyze long-run performance. In Figure A2, we examine the evolution of volatility across time to identify changes of the risk for green and gray IPO firms. Generally, the higher the volatility, the higher the potential for under- and overperformance. We measure risk using the firms’ standard deviation of 3-year Return on Assets (ROA) at and after the IPO filings. To test the channel through which green/gray affects long-run post-IPO performance, we regress 36-month BHARs on the green dummy, firm long-run risk, and the interaction between the green dummy and firm risk. Results are presented in Table A4 across multiple time periods. Overall, IPO firms with higher fundamental risk as approximated by volatility in return on assets show lower returns (BHARs). However, critically we find that green firms with higher long-term risks tend to have significantly higher long-term post-IPO performance. While higher fundamental risk suppresses returns, if this risk is associated with green IPO firms, there is great potential for returns. This might be explained by the different stages of life cycle green versus gray IPO firms are in (see descriptive results in Table 1). As outlined above, green IPO firms are younger, smaller and in need of new equity finance; while possibly entailing greater risk due to untested technologies (Masini and Menichetti 2012). Results are robust using different sample periods (2001–2017, pre-2010, and post-2010) and different benchmark indices (including FTSE100, DAX, N100, DAXAE, NEX, and CAC40). The effect is lower for later time periods as represented with smaller coefficients, which is indicative of a changing landscape of risk and return for green IPO firms and consistent with hypothesis 4 as green firms mature in the life cycle.
6. Robustness
We specify the BHAR and four-factor model using total returns inclusive of dividends and share repurchases instead of share price data (see Tables A5 and A6 and Figure A3). The underperformance of green IPOs at 12-, 24-, and 36-months remains apparent, but are not as economically pronounced anymore (lower performance differential). This may indicate that dividends and share repurchases are an important component for green firms’ returns. Using the alternative measure for the BHAR and four-factor model yield similar results to the main analysis. Furthermore, results remain constant when we specify the four-factor model with IPO year, industry and country fixed effects. 7
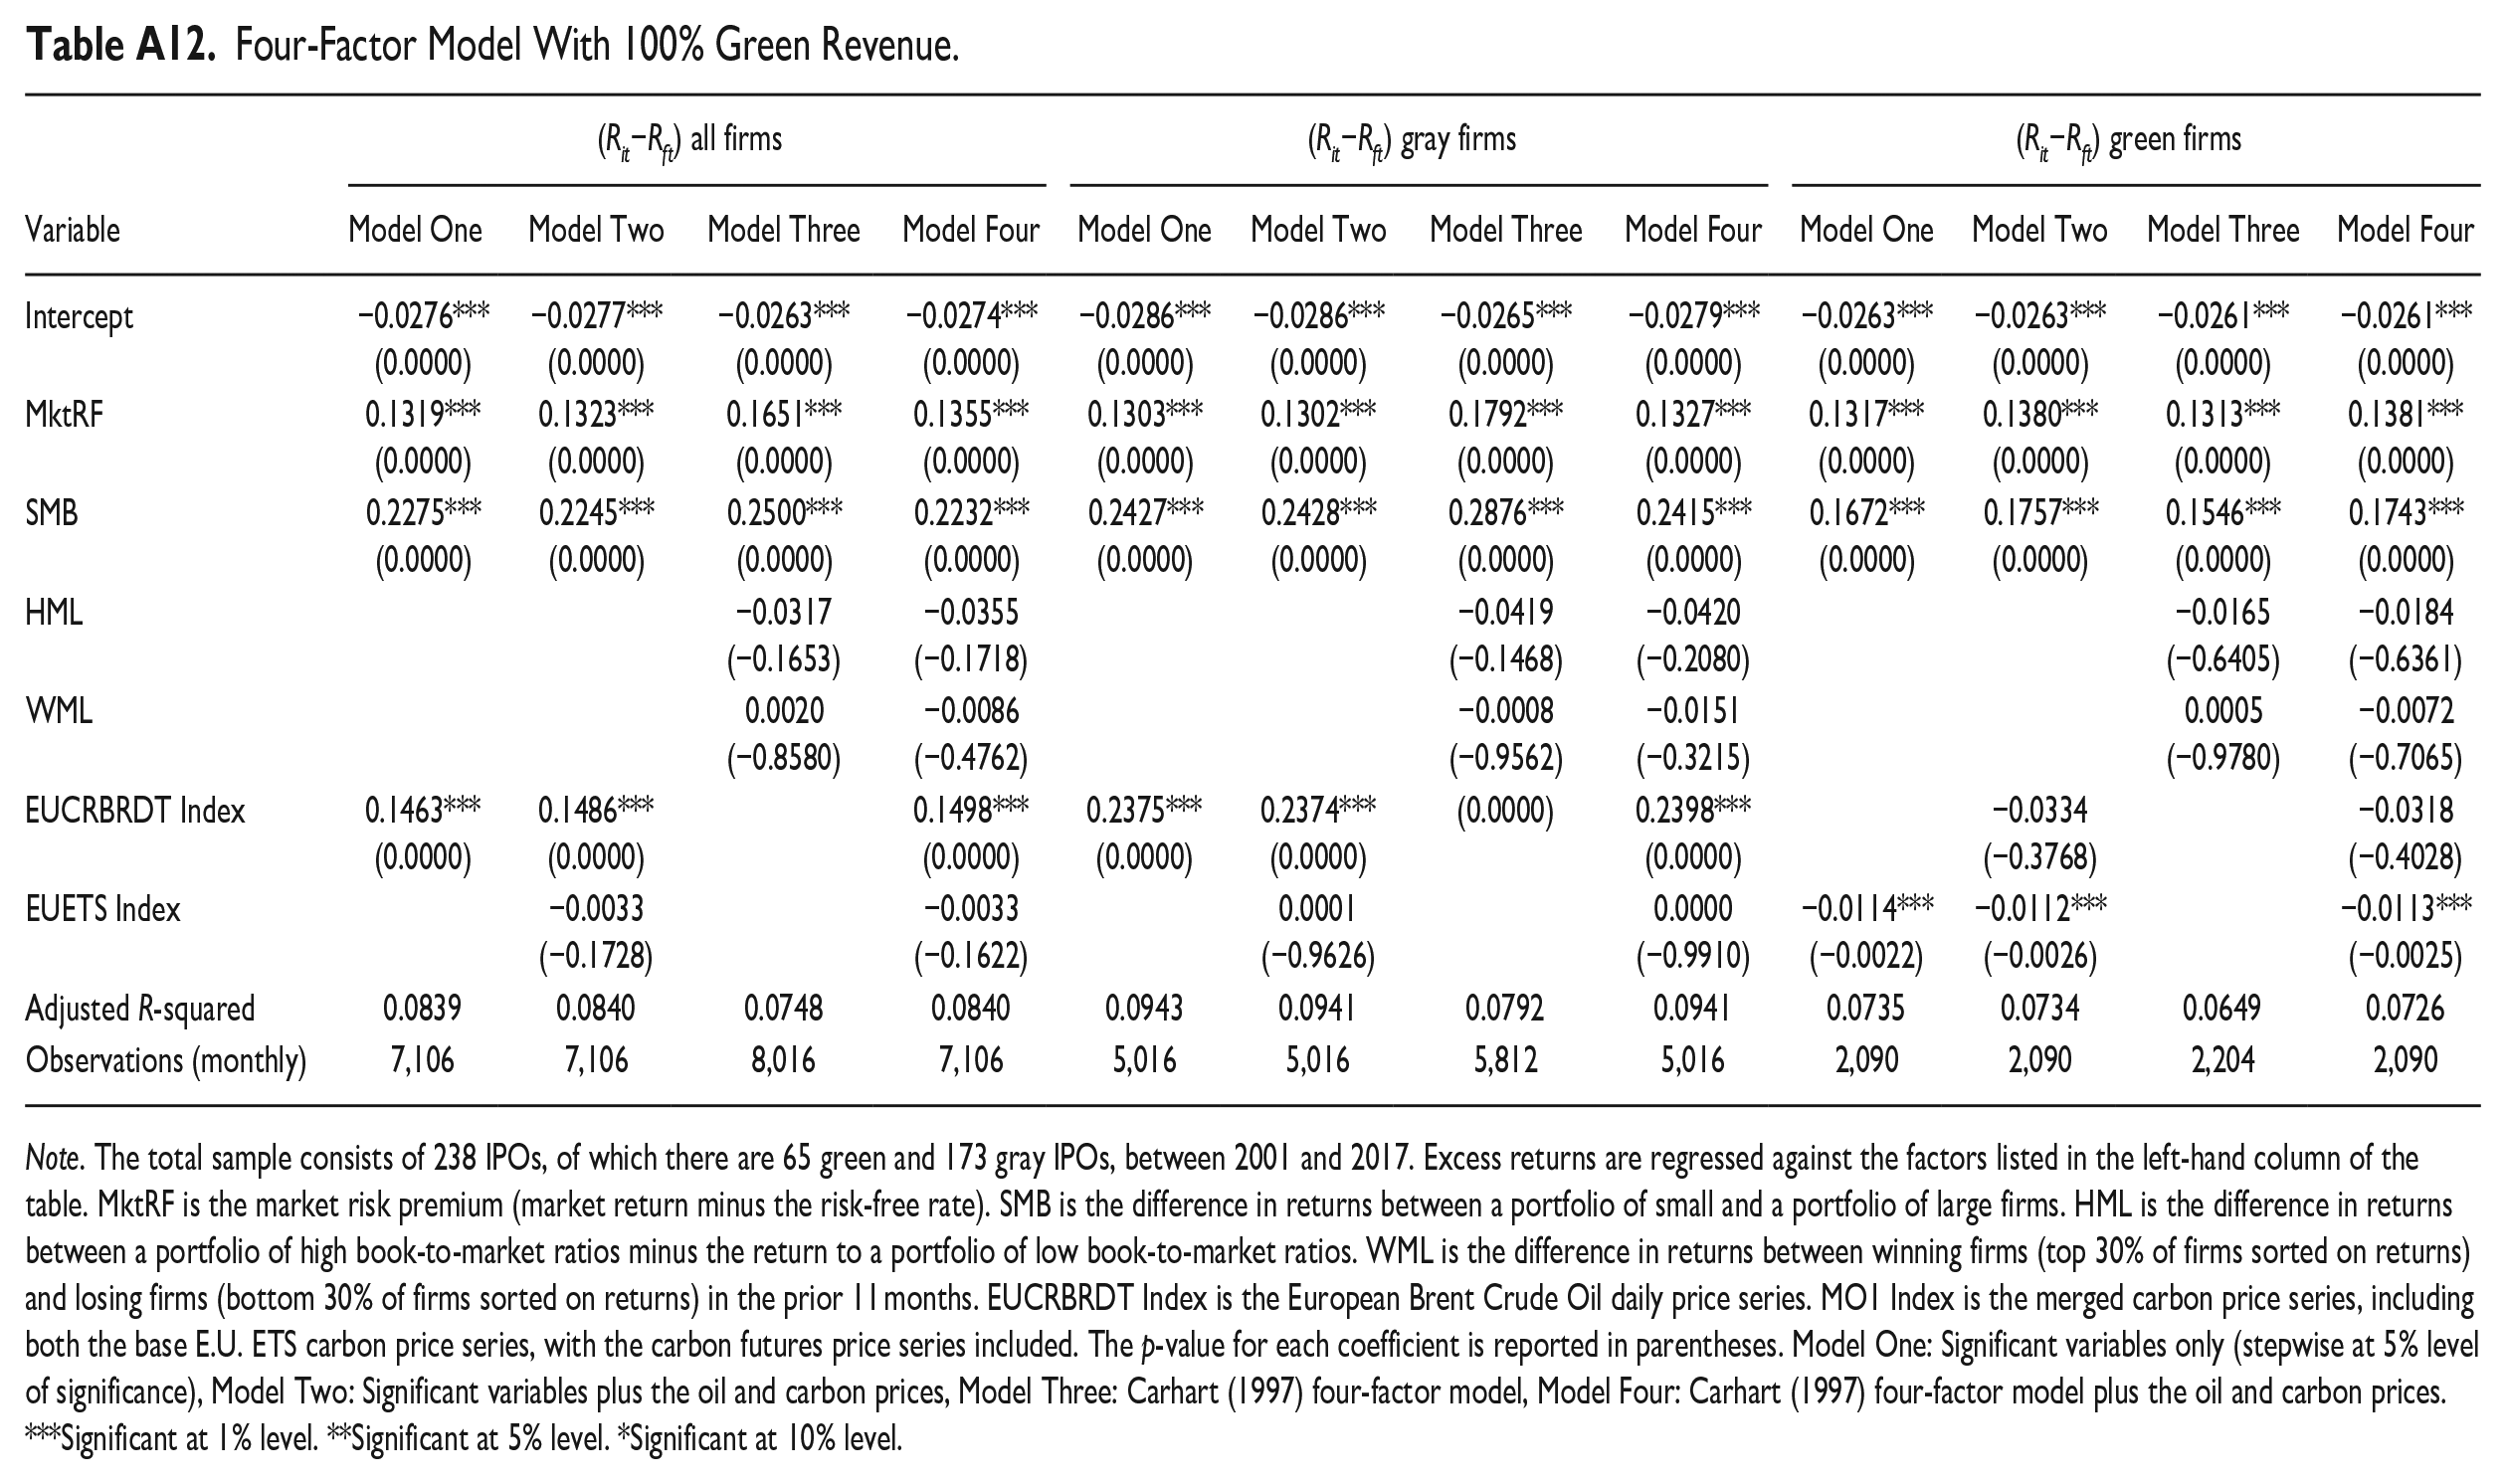
As a further robustness check, we employ a more conservative classification of the category “green” as an alternative specification. We now re-classify our sample of 310 IPOs into green when 100% of revenue stems from green operations as specified in our definition. This alternative specification results in 81 green (from 90), 194 gray, and 35 ambiguous that we exclude from the analysis. Tables A7 to A9 report the descriptive analysis, the green probit, and the IPO withdrawal setting, respectively. The results are similar in quality and quantity. As with the main results, there are pronounced differences between green and gray IPO filings in the offer characteristics such as PE/VC backing, intellectual capital disclosure, and stock exchange (i.e., AIM). Likewise, the performance analysis using the alternative specifications yields similar results to the baseline findings in quality and quantity (see Tables A10–A12). While the BHAR performance differential is showing a persistent underperformance of green IPOs using the 100% revenue-based identification, the four-factor model shows a lower underperformance for green IPOs. Based on results of different time subsamples presented in Table A11, we find no significant performance difference between green and gray IPOs. However, using the 100% green revenue alternative specification, results in panel D show that despite overall underperformance for the IPO firms, green IPO firms seem to perform significantly better than gray IPOs between 2010 and 2017 for the 36-month marks benchmarking against conventional stock indices (i.e., FTSE, DAX, N100, CAC40). 8
7. Conclusion
Using a dataset of 284 European IPOs between 2001 and 2017, we analyze the ownership characteristics, probability of withdrawal, post-withdrawal survival, and post-IPO performance differential between green energy (renewable) and gray energy (non-renewable) firms. We hypothesize that green IPOs show higher levels of VC backing and retained ownership, while gray ones exhibit greater PE backing. Further, we expect that green IPOs are more likely to be withdrawn and underperform more severely than their gray counterparts, though we expect this relative underperformance to attenuate as more investors embrace sustainable investing. We employ four main analyses to test our hypotheses: a series of probit regressions, a Kaplan–Meier survival analysis, a BHAR analysis, and time-series (factor) regressions.
From our descriptive analysis, we find that the number of gray IPO filings peaked in 2005 before starting to decline, save for an uptick in 2011 associated with high oil prices. From our formal analyses, we find that a green IPO company is more likely to be backed by VC and PE. Although the positive involvement of PE with green firms contradicts hypothesis 1, we attribute this to a shift in investor sentiment toward more ESG-conscious investment. Private equity is grasping an opportunity. We observe a significantly higher proportion of retained ownership for green firms, thus insiders in green firms keep more ownership compared to insiders in gray firms, as expected in hypothesis 2. We attribute this to a signal of investment quality by “investing in their own projects”; whereas the impression forms that insiders of gray IPOs are eager to exit what they think may be a “sunset” industry impacted by climate policy.
With respect to withdrawal rates, our findings partially contradict hypothesis 3 showing that the classification of a firm as green has a negative effect on the probability of withdrawal from the IPO process. Green IPOs are less likely to withdraw while green IPOs pre-2011 are more likely to withdraw. Taking withdrawal to be a lack of market interest, this would align with the idea that the market sentiment toward green firms is turnings positive when considering the sample as a whole; likely to be impacted by policy changes such as the Kyoto Protocol 2005 and the Paris Agreement 2015. Gray IPOs are filed more frequently at the AIM, which shows that they intend to take advantage of looser regulation.
Having withdrawn, gray firms are more likely to become inactive and take substantially less time to merge or be acquired compared to green IPO withdrawals, suggesting that insiders want to exit. We furthermore find evidence consistent with an underperformance of both green and gray firms relative to market indices, and more significantly, underperformance of green firms, though this lacks statistical significance in most cases, relative to gray firms across different robustness settings. However, once we examine the 2010 to 2017 subsample, the performance differential of green and gray IPOs turns from negative to positive at the 36-month period. This suggests that the outlook for green IPOs is changing for the better. Testing the channels via which these changes in relative performance occur, we find some limited evidence that institutional ownership and risk may moderate the relative post-IPO performance of green versus gray IPOs. Finally, we find robust results employing an alternative 100% specification as well as using total return measures.
So, what can investors and policy makers learn from these results? It is clear that insiders at prospective IPO firms understand that the long-term prospects for green and gray firms differ markedly in the context of climate change and energy transition. VC and PE investors would also seem to understand the different prospects of the two types of firms. There is a reassuring acknowledgment of the inevitable changes that are coming. For investors in public equity markets, our results suggest that they should be cautious about buying gray IPOs as insiders “exit.” Gray IPOs may be heavily discounted to give a first month return hit, but their long-term prospects may ultimately cancel out these sweeteners. It is indeed a significant caveat emptor for long-term investors. Further, as more investors embrace ESG and sustainable investing, as articulated through initiatives such as the UNPRI, the differential in valuation in favor of green over gray firms should materialize and grow, making it respectively easier for green firms and harder for gray firms to go to the market.
However, Figure 2 shows that gray IPOs have been in decline since 2005 but it is surprising that there has not been a more pronounced uptick in green IPOs. This is puzzling and it is important to understand why this is the case. Whether this is to do with continued concerns that green firms are still very risky or that indeed green firms choose to stay private or be acquired might be an interesting topic for further research.
Finally, London has sought to become the leading “green” financial center. However, our evidence casts a dark shadow on London’s green credentials given that London has been the host of more than two thirds of gray IPOs in Europe over the 2001 to 2017 period and our probit analysis showed that green firms are a lot less likely to list in this market. The laissez faire ethos of markets such as the AIM should be a good fit for higher risk green IPOs. London and the AIM may need to reflect on approaches that may help to encourage green and discourage gray IPOs, if London’s green claims are to have substance.
Supplemental Material
sj-docx-1-enj-10.1177_01956574241281585 – Supplemental material for Green Versus Gray Initial Public Offerings: Ownership, Withdrawal, and Post-IPO Performance
Supplemental material, sj-docx-1-enj-10.1177_01956574241281585 for Green Versus Gray Initial Public Offerings: Ownership, Withdrawal, and Post-IPO Performance by Freddie Cleverley, Ivan Diaz-Rainey, Pia Helbing and Renzhu Zhang in The Energy Journal
Footnotes
Appendix
Four-Factor Model With 100% Green Revenue.
| Variable | (Rit−Rft) all firms | (Rit−Rft) gray firms | (Rit−Rft) green firms | |||||||||
|---|---|---|---|---|---|---|---|---|---|---|---|---|
| Model One | Model Two | Model Three | Model Four | Model One | Model Two | Model Three | Model Four | Model One | Model Two | Model Three | Model Four | |
| Intercept | −0.0276*** (0.0000) | −0.0277*** (0.0000) | −0.0263*** (0.0000) | −0.0274*** (0.0000) | −0.0286*** (0.0000) | −0.0286*** (0.0000) | −0.0265*** (0.0000) | −0.0279*** (0.0000) | −0.0263*** (0.0000) | −0.0263*** (0.0000) | −0.0261*** (0.0000) | −0.0261*** (0.0000) |
| MktRF | 0.1319*** (0.0000) | 0.1323*** (0.0000) | 0.1651*** (0.0000) | 0.1355*** (0.0000) | 0.1303*** (0.0000) | 0.1302*** (0.0000) | 0.1792*** (0.0000) | 0.1327*** (0.0000) | 0.1317*** (0.0000) | 0.1380*** (0.0000) | 0.1313*** (0.0000) | 0.1381*** (0.0000) |
| SMB | 0.2275*** (0.0000) | 0.2245*** (0.0000) | 0.2500*** (0.0000) | 0.2232*** (0.0000) | 0.2427*** (0.0000) | 0.2428*** (0.0000) | 0.2876*** (0.0000) | 0.2415*** (0.0000) | 0.1672*** (0.0000) | 0.1757*** (0.0000) | 0.1546*** (0.0000) | 0.1743*** (0.0000) |
| HML | −0.0317 (−0.1653) | −0.0355 (−0.1718) | −0.0419 (−0.1468) | −0.0420 (−0.2080) | −0.0165 (−0.6405) | −0.0184 (−0.6361) | ||||||
| WML | 0.0020 (−0.8580) | −0.0086 (−0.4762) | −0.0008 (−0.9562) | −0.0151 (−0.3215) | 0.0005 (−0.9780) | −0.0072 (−0.7065) | ||||||
| EUCRBRDT Index | 0.1463*** (0.0000) | 0.1486*** (0.0000) | 0.1498*** (0.0000) | 0.2375*** (0.0000) | 0.2374*** (0.0000) | (0.0000) | 0.2398*** (0.0000) | −0.0334 (−0.3768) | −0.0318 (−0.4028) | |||
| EUETS Index | −0.0033 (−0.1728) | −0.0033 (−0.1622) | 0.0001 (−0.9626) | 0.0000 (−0.9910) | −0.0114*** (−0.0022) | −0.0112*** (−0.0026) | −0.0113*** (−0.0025) | |||||
| Adjusted R-squared | 0.0839 | 0.0840 | 0.0748 | 0.0840 | 0.0943 | 0.0941 | 0.0792 | 0.0941 | 0.0735 | 0.0734 | 0.0649 | 0.0726 |
| Observations (monthly) | 7,106 | 7,106 | 8,016 | 7,106 | 5,016 | 5,016 | 5,812 | 5,016 | 2,090 | 2,090 | 2,204 | 2,090 |
Note. The total sample consists of 238 IPOs, of which there are 65 green and 173 gray IPOs, between 2001 and 2017. Excess returns are regressed against the factors listed in the left-hand column of the table. MktRF is the market risk premium (market return minus the risk-free rate). SMB is the difference in returns between a portfolio of small and a portfolio of large firms. HML is the difference in returns between a portfolio of high book-to-market ratios minus the return to a portfolio of low book-to-market ratios. WML is the difference in returns between winning firms (top 30% of firms sorted on returns) and losing firms (bottom 30% of firms sorted on returns) in the prior 11 months. EUCRBRDT Index is the European Brent Crude Oil daily price series. MO1 Index is the merged carbon price series, including both the base E.U. ETS carbon price series, with the carbon futures price series included. The p-value for each coefficient is reported in parentheses. Model One: Significant variables only (stepwise at 5% level of significance), Model Two: Significant variables plus the oil and carbon prices, Model Three: Carhart (1997) four-factor model, Model Four: Carhart (1997) four-factor model plus the oil and carbon prices.
Significant at 1% level. **Significant at 5% level. *Significant at 10% level.
Acknowledgements
The paper has benefitted from comments received from presentations to the IAEE Webinar Series 2020, 3rd GRASFI Conference (Columbia University 2020), SFCG Conference (University of Bath 2022) and Griffith Business School 2022. A synthesis of paper was presented to OPSWF Research Forum (Élysée Palace, Paris, January 2020) and the University of Edinburgh 2022. The comments received from Simon Glossner are gratefully acknowledged. The authors wish to thank Beam Aschakulporn and René Brenner for the research assistance. We would like to thank two anonymous reviewers and the editors for the valuable input. The usual disclaimer applies.
Authors’ Notes
The paper has benefitted from comments received from presentations to the IAEE Webinar Series 2020, 3rd GRASFI Conference (Columbia University 2020), SFCG Conference (University of Bath 2022), and Griffith Business School 2022. A synthesis of paper was presented to OPSWF Research Forum (Élysée Palace, Paris, January 2020) and the University of Edinburgh 2022.
Declaration of Conflicting Interests
The author(s) declared no potential conflicts of interest with respect to the research, authorship, and/or publication of this article.
Funding
The author(s) received no financial support for the research, authorship, and/or publication of this article.
Supplemental Material
Supplemental material for this article is available online.
1
We exclude nuclear-based firms from the analysis as our focus is on “new” renewables.
2
These are mostly utility companies with an ambiguous mix of green and gray operations.
3
Due to the collapse of carbon allowance (spot EUA) prices around 2008, we merge the original price series with a carbon futures price series when the two price series begin to diverge significantly on 12/04/2006, and continue it up until expiration on 15/12/2008. Not performing this adjustment would artificially deflate the true value of spot carbon allowances, which saw prices drop as low as $0.015 due to the no banking rule (![]() ).
).
4
We ran the full regression (Model Three) without the carbon price dummy, as the variable has no significant effect when included. Also, this variable reduces the sample size by 98 observations as a result of an incomplete carbon price series.
5
Results are available on request and not reported here.
6
We also specify the four-factor regressions for these subsamples, which provide consistent results. These are available on request.
7
Results are available on request and not reported here.
8
See Section 4.5 for a discussion on the evolution of post-IPO performance over time.
References
Supplementary Material
Please find the following supplemental material available below.
For Open Access articles published under a Creative Commons License, all supplemental material carries the same license as the article it is associated with.
For non-Open Access articles published, all supplemental material carries a non-exclusive license, and permission requests for re-use of supplemental material or any part of supplemental material shall be sent directly to the copyright owner as specified in the copyright notice associated with the article.