
Abstract
How does oil price uncertainty affect consumer sentiment in advanced economies? Is the response of consumer sentiment to exogenous positive and negative oil price shocks symmetric or asymmetric? Motivated to answer these questions, this paper provides a comprehensive examination of the effects of real oil price shocks on consumer sentiment in the G7 economies in the context of two classes of empirical models. With the application of a bivariate structural GARCH-in-Mean VAR model we find that (in general) oil price uncertainty has a negative and statistically significant effect on consumer sentiment in the G7 countries. Moreover, using a test of symmetry, we find that the relationship between oil prices and consumer sentiment is in general asymmetric.
1. Introduction
During the global financial crisis, the world economy was hit by a contractionary oil price shock. It was hit by an even larger shock due to the Covid-19 outbreak in 2020 that led to lockdowns and unprecedented cuts in production and aggregate spending. In both cases, because conventional fiscal policy was not sufficient to deal with the crises, governments around the world enacted massive fiscal policy support in the trillions of dollars. Moreover, central banks took aggressive monetary policy actions, reducing their policy rates to the zero lower bound and broadening their provision of liquidity well beyond their traditional lending to financial institutions. As a result of these policies, as well as the war between Russia and Ukraine and supply chain problems, the world economy is experiencing elevated levels of inflation, raising questions about the credibility of central banks and the role of monetary and fiscal policies.
The war between Russia and Ukraine and sanctions on Russian exports (such as e.g., the imposition of a price ceiling on Russian crude oil exports) might be why we are currently facing high energy prices. This motivates us to look at how uncertainty associated with the real price of oil impacts the consumption sentiment or behavior in large economies. With the negative effects of the Russia-Ukraine war spilling over to the global economy, understanding how fluctuations in the real price of oil affect consumer behavior is of growing importance. In advanced economies, consumption spending is a significant component of aggregate output, with more than fifty percent of GDP explained by consumer spending in economies such as Canada, the United Kingdom, and the United States. In this regard, Souleles (2004) shows that consumer sentiment helps to forecast consumption spending growth. Understanding how consumer sentiment responds to unanticipated changes in the real price of oil is a key macroeconomic question, as it will help us understand how consumer spending is affected.
The effects of oil price shocks on the macroeconomy have been studied extensively in the literature. Kilian (2009), Kilian and Park (2009), and Kilian and Zhou (2018) structurally decompose oil price fluctuations into demand and supply shocks in the global crude oil market and study their impact on macroeconomic variables such as inflation, global commodity prices, real output growth, and financial market variables such as stock returns. Although there has been empirical work that looks at shocks originating from fluctuations in oil prices and their impact on macroeconomic aggregates, little has been known about the impact on consumer sentiment. Also, expectations of higher oil prices or uncertainty associated with the future direction of oil prices can have significant consequences for the economy as a whole. When households are more uncertain about essential commodity prices such as crude oil, they tend to hold back their spending and increase their savings. Elder and Serletis (2009), Elder and Serletis (2010), Bredin, Elder and Fountas (2011), Serletis and Xu (2019), Elder (2021), and Elder and Payne (2023, 2024) find that uncertainty regarding the price of oil has a negative effect on macroeconomic aggregates such as real gross domestic product, durable goods, components of fixed investment, industrial production, and unemployment.
Gao et al. (2022) compute a measure of economic uncertainty associated with the volatility of oil prices. They find that an increase in option-implied oil price volatility leads to a fall in key macroeconomic fundamentals such as both current and future output, consumption, investment, and employment. The paper also introduces a macro-finance model with an oil sector and a general macro sector. Oil is used in the general macro sector as a key resource in the production of final goods. In the model, during periods of high oil-related uncertainty, firms raise their oil inventories to absorb any potential large negative oil supply shocks. Due to this precautionary savings effect, the quantity of oil utilized for production purposes in the macro sector declines, which in turn lowers output, consumption, investment, and employment.
Although existing empirical work looks at the effects of oil price uncertainty on different macroeconomic aggregates, little work has been on the effects on consumer sentiment. Moreover, most of the empirical evidence has been limited to the United States. In this paper, we investigate two research questions. First, how uncertainty associated with the future path taken by real crude oil prices affects consumer confidence in seven of the largest advanced economies in the world—the Group of Seven or the G7 henceforth. Second, using a formal statistical test, we investigate whether consumer confidence in these large advanced economies responds symmetrically or asymmetrically to positive and negative real oil price shocks of different magnitude. Consumer sentiment is a measure of consumers’ beliefs or perception about the current and future state of the economy. Heightened uncertainty about the real price of a key commodity like crude oil affects consumers’ mood and makes them more pessimistic about their current and future economic conditions. This in turn can have an adverse effect on consumer spending and hence on the aggregate economy.
We find that oil price uncertainty has a negative effect on consumer sentiment in six out of the seven member countries of the G7. Uncertainty about the future path taken by the real price of oil might cause households to delay their purchases of consumer durable goods—see Bernanke (1983) and Pindyck (1991). Less expenditure on oil-intensive durables such as automobiles might cause factors of production such as labor and capital to be moved away from the car industry. Edelstein and Kilian (2009) state that this uncertainty effect and the reallocation effect helps to generate asymmetric responses of macroeconomic variables to unanticipated energy price increases and decreases. We also find that in general the relationship between the real oil price and consumer sentiment in the G7 countries is asymmetric in nature. Adjustment costs as a response to changing oil prices (see Hamilton 1988), financial stress (see Ferderer 1996), and monetary policy (see Bohi 1991) may be possible explanations for the asymmetric response of consumer optimism to real oil price shocks.
The remainder of the paper is organized as follows. In Section 2, we discuss the data used in our empirical analysis and their time series properties. In Section 3, we discuss the bivariate GARCH-in-Mean VAR model, a model based on a structural vector autoregression (VAR) that is modified to accommodate GARCH-in-mean errors as in Elder (2004) and Elder and Serletis (2010), and present the empirical results regarding the impact of oil price uncertainty on consumer confidence. In section 4, we discuss the Kilian and Vigfusson (2011) test of the null hypothesis of symmetric impulse responses and investigate whether the relationship between consumer confidence and the real crude oil price is nonlinear and asymmetric. The final section concludes the paper.
2. The Data
We retrieve data for the consumer confidence index from multiple sources. For Canada, France, Germany, and the United Kingdom we use the monthly data published by the Organization for Economic Cooperation and Development (OECD). This survey-based indicator, constructed from answers from households, helps to capture households’ outlook for consumption spending and saving decisions. The indicator captures the mood of optimism/pessimism of households regarding several variables such as their expected financial situation, the general economic situation, unemployment, and ability to save. When the indicator is above one hundred units, it signals a gain in the consumer confidence toward the future economic situation. Due to this optimism, households’ propensity to save will fall, and they will have higher propensity to undertake consumption spending on major purchases in the next twelve months. When the indicator is below one hundred units, it indicates pessimism from the perspective of households toward future developments in the economy, possibly leading to an increase in the propensity to save and a decrease in the propensity to consume.
For Japan, we retrieve the (seasonally adjusted) Consumer Confidence Index from the Economic and Social Research website of the Cabinet Office, an agency of the Cabinet of Japan. The purpose of the survey is to gain an understanding about changes in consumer perception, inflation expectations, purchase decisions of consumer durables, and also to evaluate economic trends. For Italy, we retrieve data from the Italian National Institute of Statistics, Istat. More specifically, we retrieve the consumer economic climate index series, computed as a simple arithmetic mean of weighted balances using the assessments and expectations of consumers on the economic situation in Italy and the future expectations on unemployment. Due to missing data, in the original consumer confidence index series we use the consumer economic climate index series. For the United States, we use the more popular Consumer Sentiment series, published by the University of Michigan, retrieved from the Federal Reserve Economic Data (FRED) database. This monthly survey-based index helps to capture the optimism of the consumers regarding the economy, their own financial situation, business conditions, and purchasing decisions/conditions.
In our structural VAR analyses, we use the real price of oil as in Kilian (2009), Kilian and Park (2009), Elder and Serletis (2010), and Azad and Serletis (2022). We download the data for the variable, Crude Oil (petroleum), Dated Brent, light blend 38 API, fob U.K., US$ per barrel, from the International Monetary Fund’s primary commodity prices data set. Since the original data is in US$ per barrel, we first obtain the nominal data in local currency by multiplying the series with the exchange rate (domestic currency per US dollar) and then deflating the nominal data by the domestic consumer price index for all items to obtain the real price of oil in domestic currency. The data for the exchange rate and the domestic consumer price index has been retrieved from FRED. The data sources are comprehensively described in Appendix Table A1. The sample period varies from country to country due to differences in the availability of comprehensive data for consumer sentiment, CPI, and the exchange rate for each country. The sample period used in our seven country specific models is displayed in column 2 of Table 1.
Unit Root and Stationarity Tests on the Logged Differenced Series.
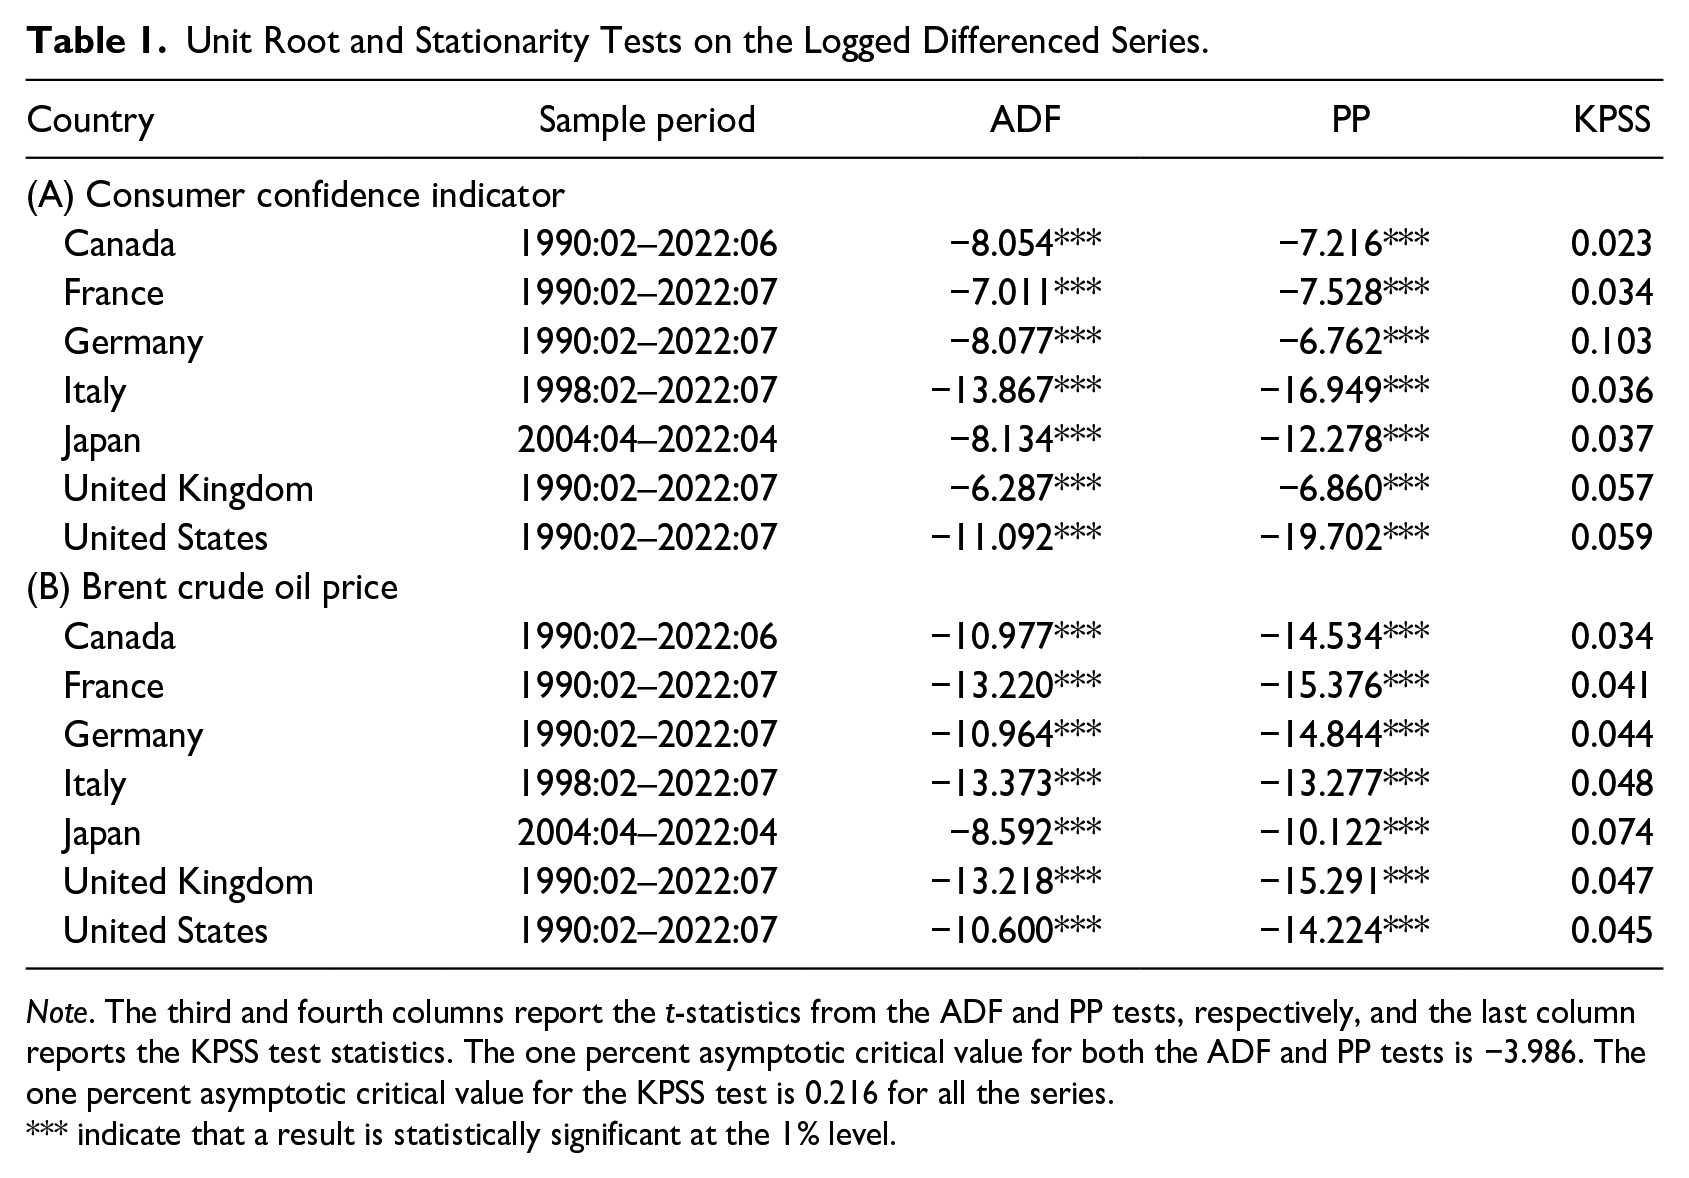
Note. The third and fourth columns report the t-statistics from the ADF and PP tests, respectively, and the last column reports the KPSS test statistics. The one percent asymptotic critical value for both the ADF and PP tests is −3.986. The one percent asymptotic critical value for the KPSS test is 0.216 for all the series.
indicate that a result is statistically significant at the 1% level.
Next, we conduct a series of unit root tests in the growth rates of the consumer sentiment series and the real price of crude oil. The monthly growth rates are obtained by taking first differences of the natural logarithms of the original series and multiplying by 100. The data transformations are displayed in Appendix Table A2. We conduct three tests to test for the presence of unit roots in our time series, namely the Augmented Dickey-Fuller (ADF) test (Dickey and Fuller 1981), the Phillips-Perron unit root test (see Phillips and Perron 1988), and the KPSS test (see Kwiatkowski et al. 1992). We estimate a regression including a constant and autoregressive term and test the null hypothesis that the process generating the respective series has a unit autoregressive root against the alternative that the process is trend stationary. The null hypothesis for the ADF and PP tests is that the data is non-stationary, while the null hypothesis for the KPSS test is that the data is stationary. We report the t-statistics for the ADF and PP tests in the third and fourth columns of Table 1 and the KPSS test statistic in the fifth column of Table 1. Panel A displays the results for the growth rate of the consumer sentiment series while panel B presents the results for the growth rate of the real price of crude oil. As can be seen, the null hypothesis of the presence of a unit root is rejected at the one percent significance level by both the ADF and PP tests, while the null hypothesis of stationarity cannot be rejected at the one percent significance level by the KPSS test.
Thus, we conclude that the growth rates of the consumer sentiment index in each of the G7 countries and the growth rate of the real price of crude oil are stationary. In Figure 1 we plot the natural logarithm of the consumer sentiment indices and its growth rate for each country—Canada, France, Germany, Italy, Japan, the United Kingdom, and the United States. In Figure 2, we plot the logged real oil price (in terms of domestic currency) and its growth rate for each of the G7 countries. In what follows, for our structural VAR analysis, we only use the stationary series.
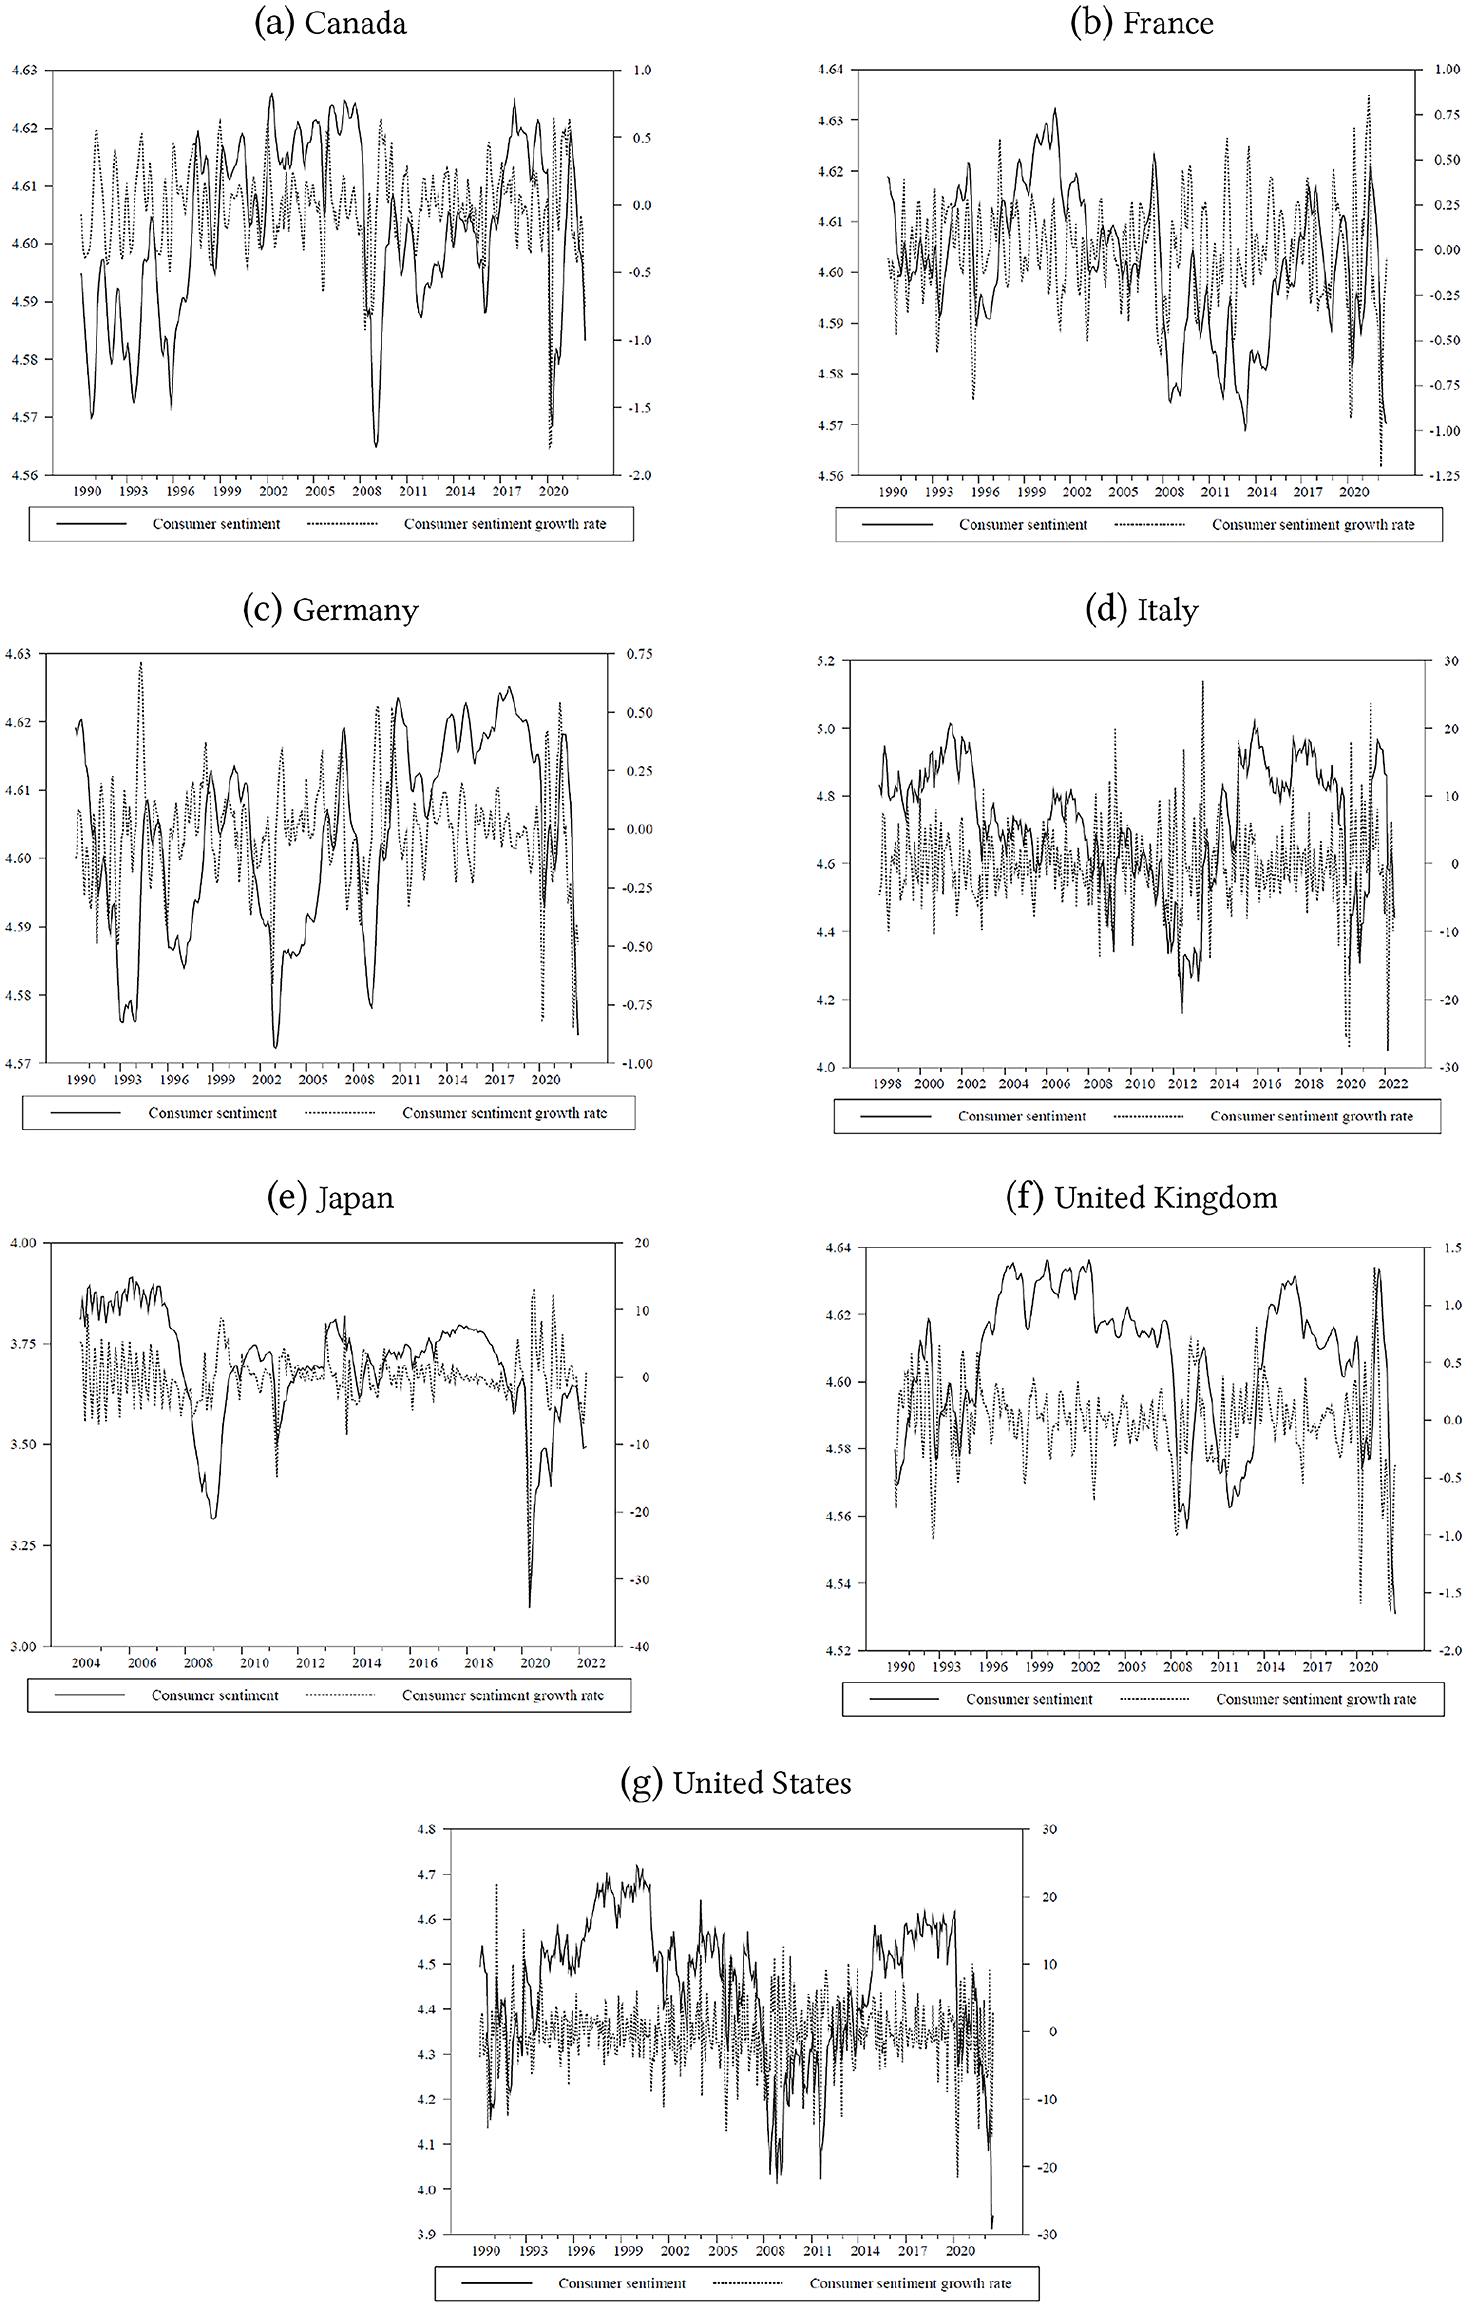
Consumer sentiment and its growth rate in the G7 countries: (a) Canada, (b) France, (c) Germany, (d) Italy, (e) Japan, (f) United Kingdom, and (g) United States.
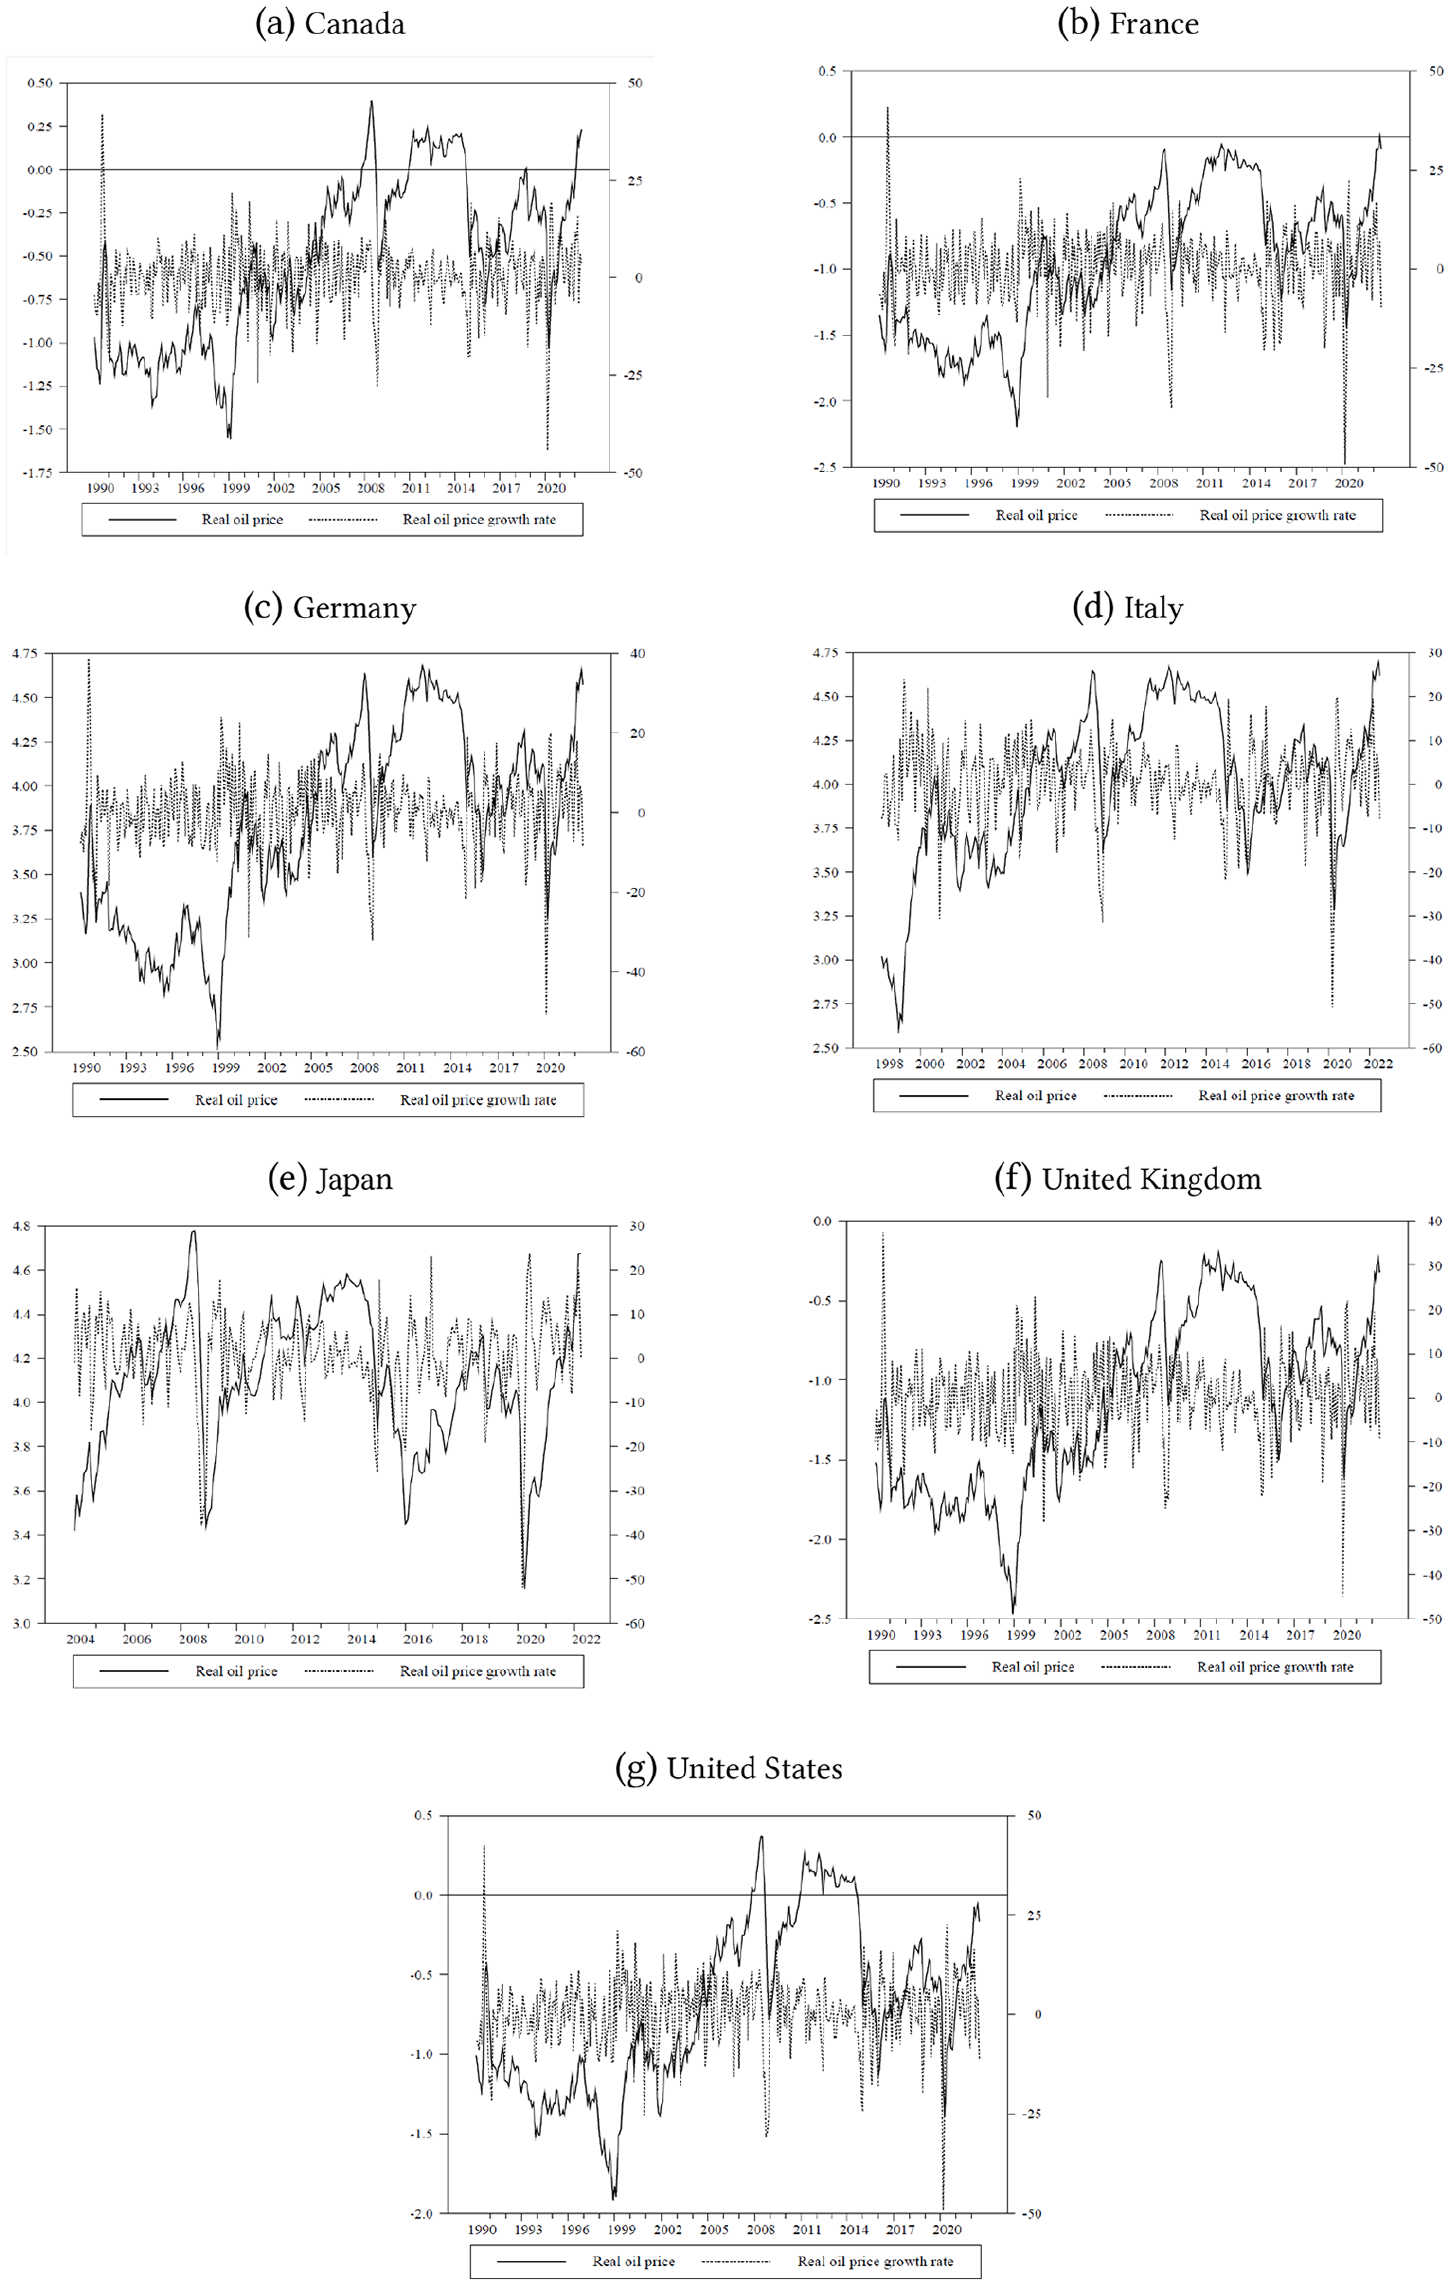
Real oil price and its growth rate in the G7 countries: (a) Canada, (b) France, (c) Germany, (d) Italy, (e) Japan, (f) United Kingdom, and (g) United States.
3. Oil Price Uncertainty
3.1. Empirical Methodology
Based on the model documented in Elder and Serletis (2010), we implement a bivariate monthly structural vector autoregression in the growth rates of the consumer sentiment index and the real price of crude oil. We measure the uncertainty originating from real crude oil prices as the standard deviation of the one-step-ahead forecast error, conditional on the contemporaneous information set. The standard deviation of this one-step-ahead forecast error is a measure of the dispersion from the mean, and hence is a proxy for uncertainty about the future realization of the real price of crude oil. The operational assumption of the structural system is that the dynamics can be summarized by a linear function of the lagged values of the variables of interest and a term related to the conditional variance.
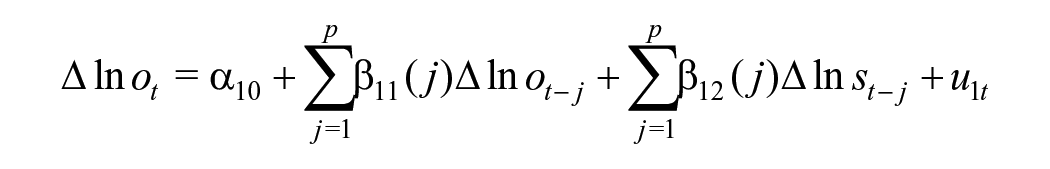
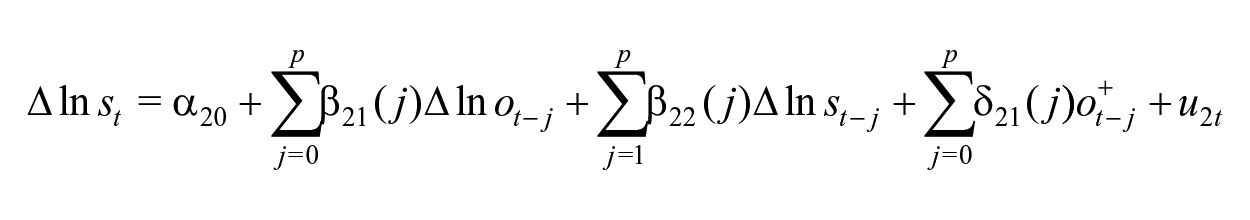
Our model is based on Elder and Serletis (2010), and is a bivariate (identified) structural GARCH-in-Mean, as follows
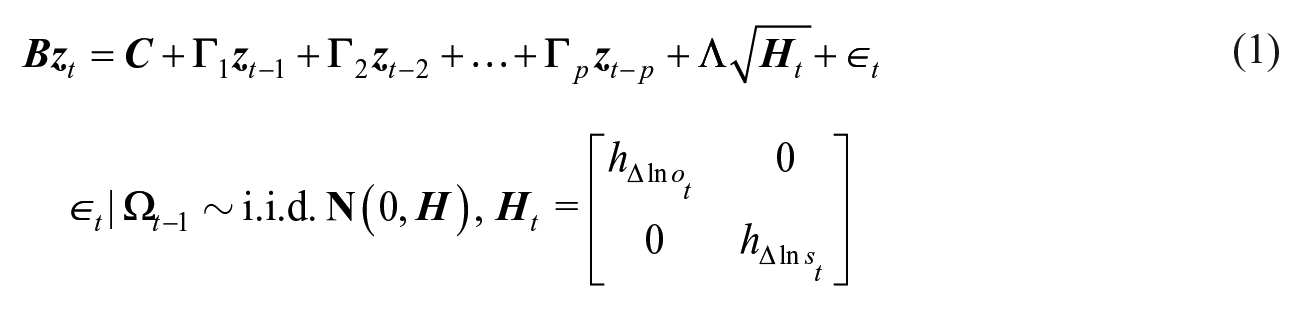
where
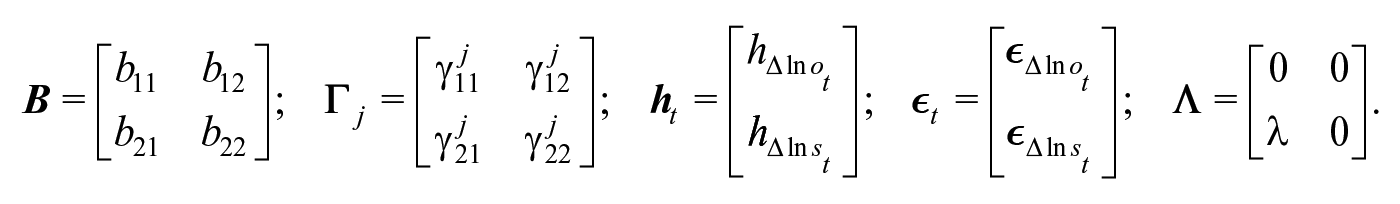
We choose the lag length, p, to be equal to 6 as is the standard for monthly data. We impose the common identifying assumption in structural VARs, which allows us to estimate N(N–1)/2 free parameters in the

Kilian (2009), Kilian and Park (2009), Elder and Serletis (2010), and Azad and Serletis (2022) assume that the real price of crude oil is independent of macroeconomic variables such as real GDP, industrial production, the consumer price index, and stock returns. Elder, Miao and Ramchander (2013) find that jumps in oil prices, measured as relatively large movements in the conditional mean of (log) oil prices over arbitrarily short intervals, are closely linked with substantive new economic information relevant to the global oil market. The authors hypothesize that oil prices react rapidly and rationally to relevant economic information. These responses have a significant effect on the variation in oil prices due to speculative forces that are isolated from economic fundamentals. However, in consensus with the majority of the empirical literature, we adopt the common identifying assumption that there is no feedback from macroeconomic aggregates to the real price of oil. We follow Güntner and Linsbauer (2018) and do not allow for reverse causality from consumer sentiment to the real price of oil within the same month. This specification of the
Following Elder (2004), we also make the assumption that structural disturbances are contemporaneously uncorrelated, which substantially reduces the number of variance function parameters that need to be estimated. The conditional variance system is modeled as
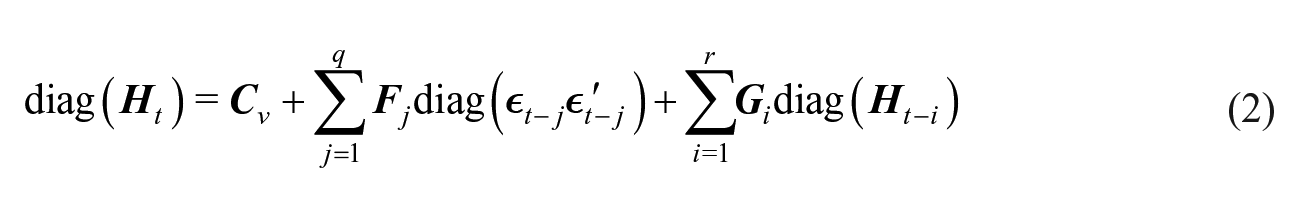
where diag is the operator that extracts the diagonal elements from a square matrix. We impose the additional restriction that the conditional variance of
The bivariate GARCH-in-Mean VAR, consisting of equations (1) and (2), is estimated with full information maximum likelihood, which helps to avoid Pagan’s (1984) generated regressor problems. These problems arise when estimating the variance function parameters separately from the conditional mean parameters. In the process, the log likelihood function,
3.2. Evidence
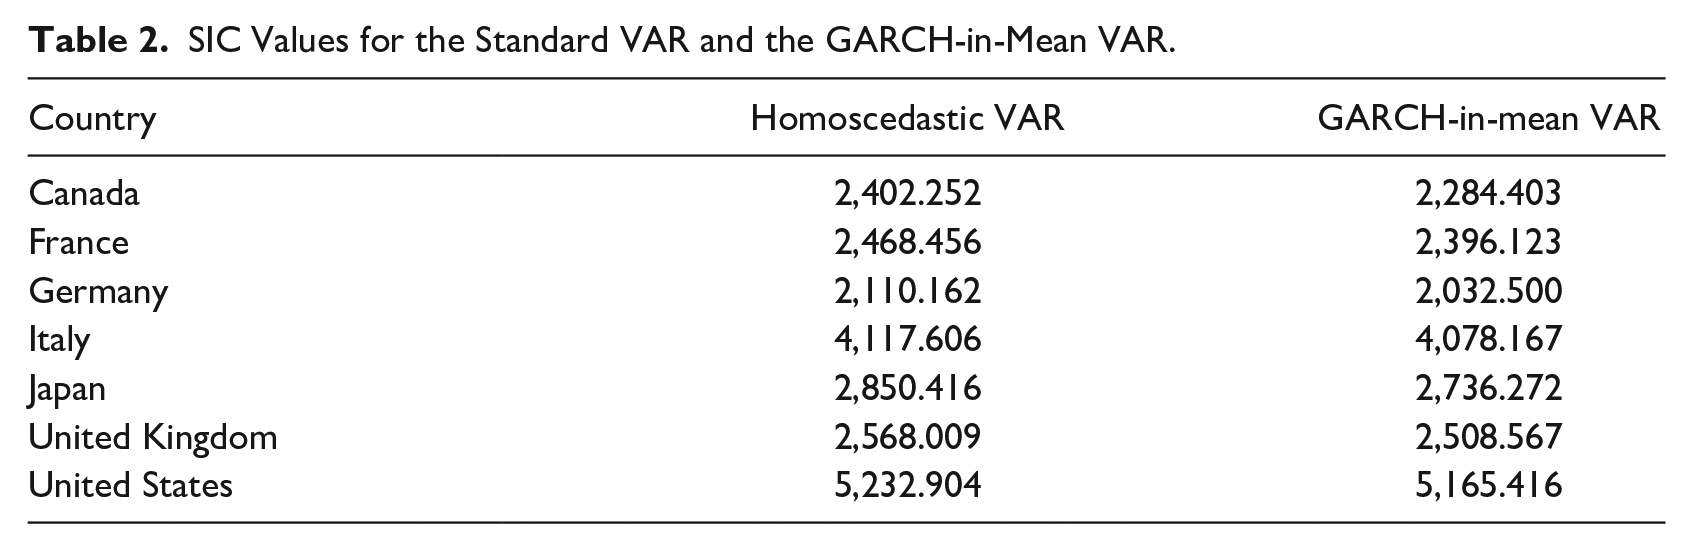
To ensure that our model specification is consistent with the data, we compute the Schwarz Information Criterion (SIC) for both a conventional homoscedastic VAR as well as the bivariate structural GARCH-in-Mean VAR. The criterion deals a substantial penalty for extra parameters added to a GARCH model, so a lower SIC value means a better model. The values of the SIC are reported in Table 2 for all seven bivariate structural GARCH-in-Mean VAR models. As can be seen from the table, the bivariate GARCH-in-Mean VAR has a considerably lower SIC than the corresponding conventional homoscedastic VAR, thus capturing more important features of the data than the latter.
SIC Values for the Standard VAR and the GARCH-in-Mean VAR.
For each of the seven bivariate country-specific models, we report the maximum likelihood estimates of the primary coefficient of interest,
Coefficient of Interest,
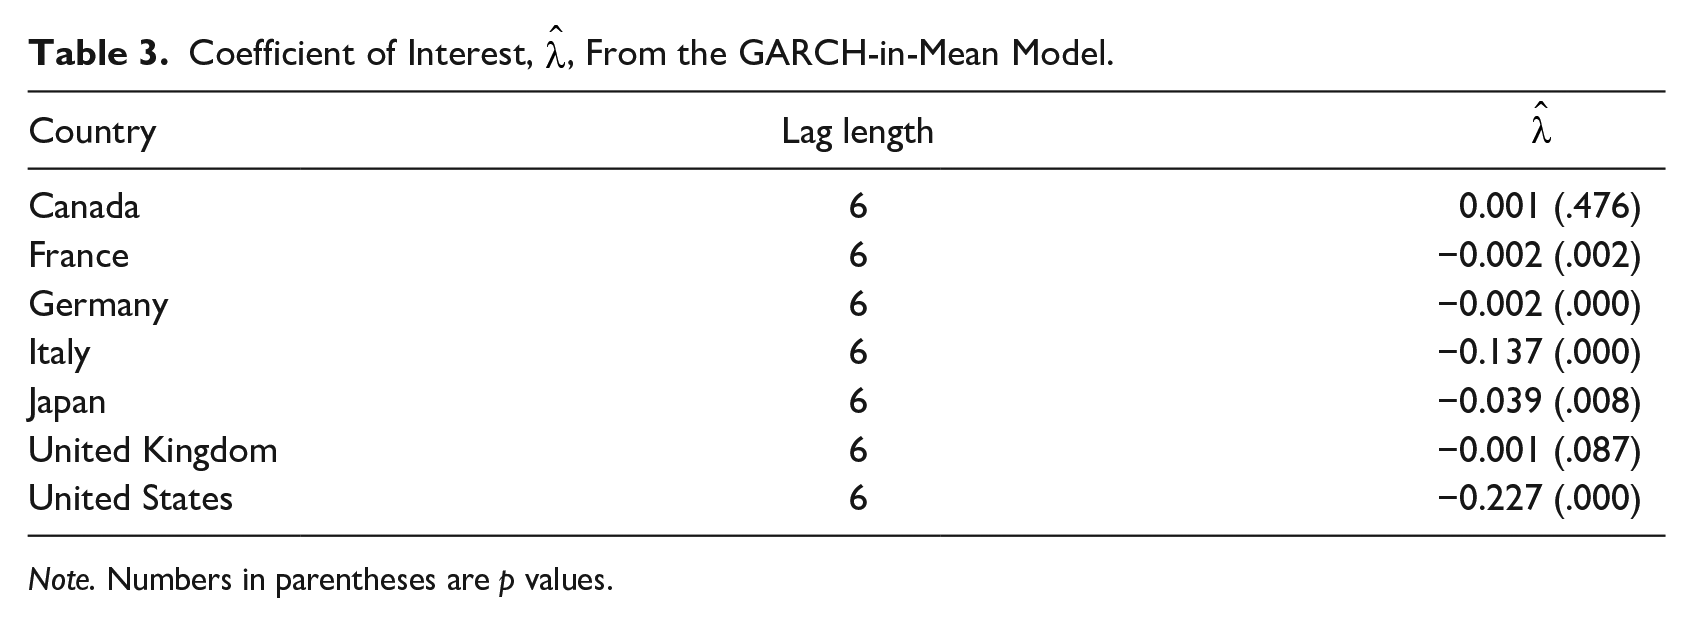
Note. Numbers in parentheses are p values.
As can be seen in Table 3,
Güntner and Linsbauer (2018) state that shocks originating from unanticipated changes in the price of oil might affect the real macroeconomy through the demand side channel. They discuss how oil price shocks might lead households to undergo actual or perceived changes in their purchasing power and have increased uncertainty about future economic conditions. Oil price uncertainty might have an adverse effect on both consumer and investor sentiment and might cause consumer and investors to reduce consumption spending and investment. Edelstein and Kilian (2009) discuss a few possible channels through which energy price changes might affect consumer spending. For example, oil price uncertainty and higher energy prices might have adverse effects on household disposable income. Also, heightened uncertainty about energy prices might lead households to postpone irreversible purchases of consumer durable goods—see Bernanke (1983) and Pindyck (1991). Another channel might be through consumption smoothing decisions by households, where heightened uncertainty might cause households to increase precautionary savings fearing unemployment in the future and subsequent loss of income.
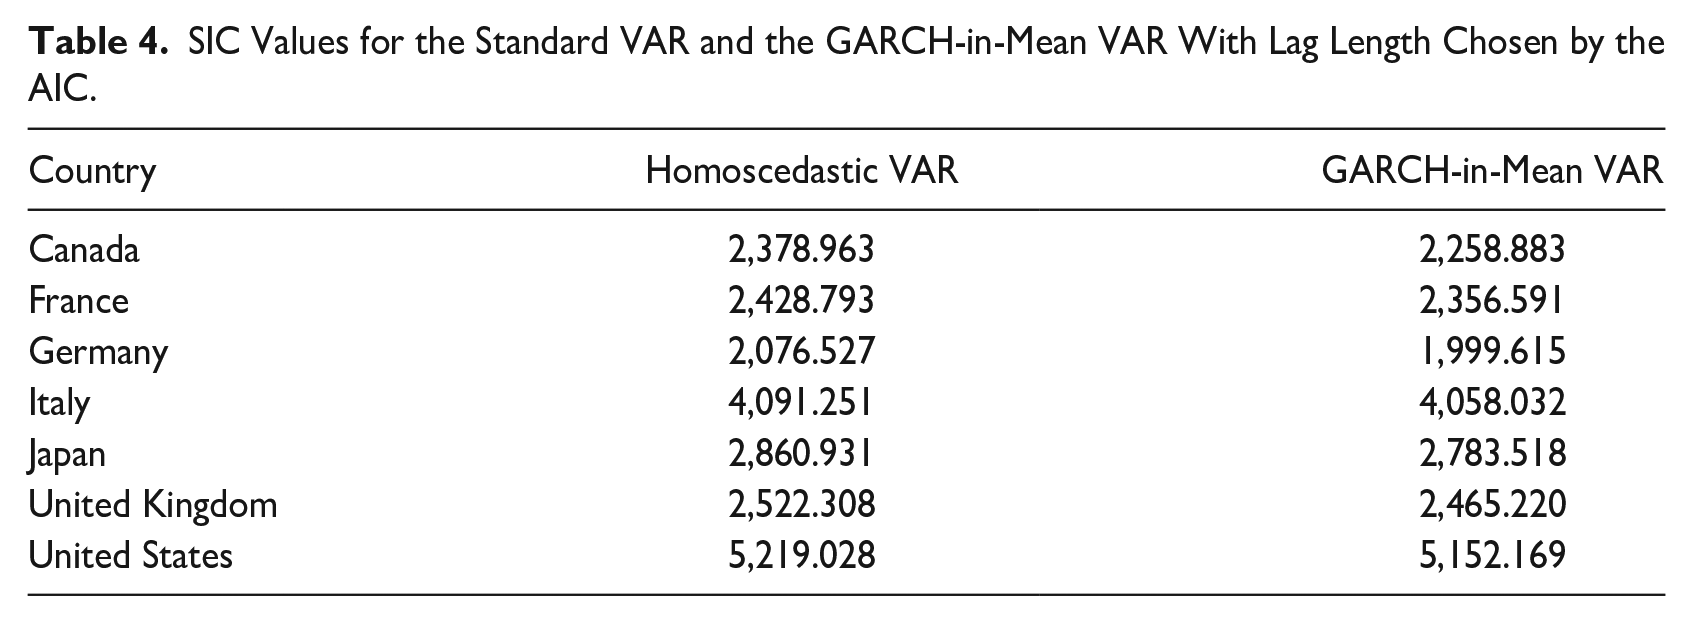
Next, as a robustness check we run the seven bivariate monthly GARCH-in-Mean VAR models with the optimal lag length chosen by the AIC criterion. As before, we start by reporting the AIC values for a conditional homoscedastic VAR and our bivariate GARCH-in-Mean VAR. As can be seen in Table 4, the bivariate GARCH-in-Mean VAR captures more important features of the data than its homoscedastic counterpart, with the AIC values being smaller than the respective values for the conventional homoscedastic VAR. We report the optimal lag length chosen by the AIC criterion on the second column of Table 5 and the maximum likelihood estimates of the primary coefficient of interest,
SIC Values for the Standard VAR and the GARCH-in-Mean VAR With Lag Length Chosen by the AIC.
Coefficient of Interest,
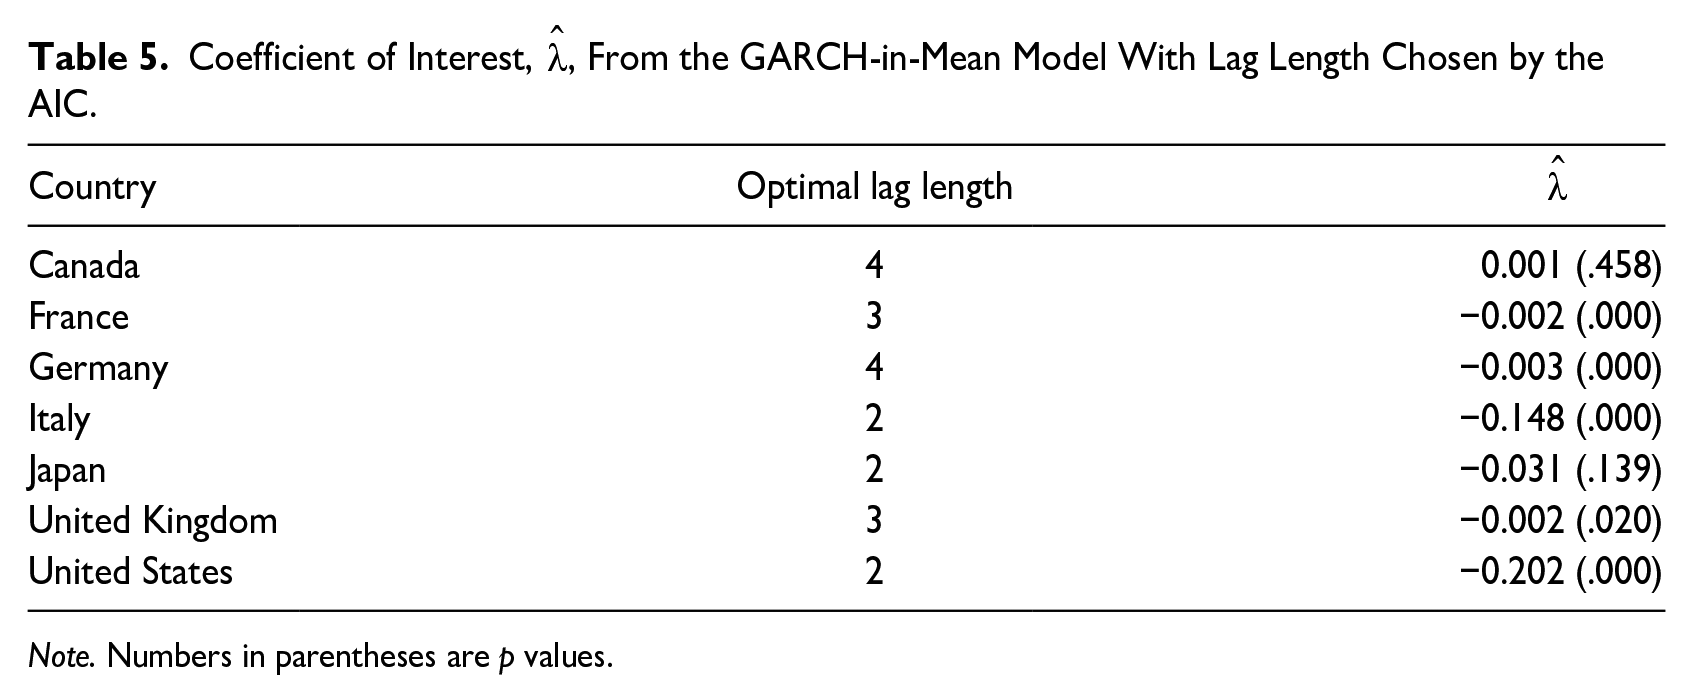
Note. Numbers in parentheses are p values.
4. On the (A)symmetric Relationship
4.1. The Symmetry Test
In this section, we investigate how consumer sentiment in each of the G7 countries responds to unanticipated positive and negative real crude oil price shocks. We adopt a formal statistical test to investigate whether the responses of the growth rates of the consumer sentiment indicators to positive and negative oil price shocks are symmetric or asymmetric in nature. More specifically, we implement the Kilian and Vigfusson (2011) symmetry test to check for symmetry in the responses of consumer sentiment to positive and negative oil price shocks. The symmetry test, based on impulse response functions, estimates the following non-linear structural VAR
where

and ot denotes a monthly measure of the real crude oil price. ∆
The null hypothesis of symmetric impulse responses of the growth rate of consumer sentiment,

The statistical test investigates whether the response of the growth rate of consumer sentiment to a positive shock of size δ in the real oil price growth rate is equal to its response when hit by a negative shock of the same magnitude, –δ, for horizons,
4.2. Evidence
As the Kilian and Vigfusson (2011) symmetry test depends on the size of the shock, δ, in Table 6 we report p-values of the null hypothesis of symmetry for one
p-Values for H0:Ic (h, δ) = −Ic (h,−δ), h = 0,1,. . .,11 With Lag Order = 6.
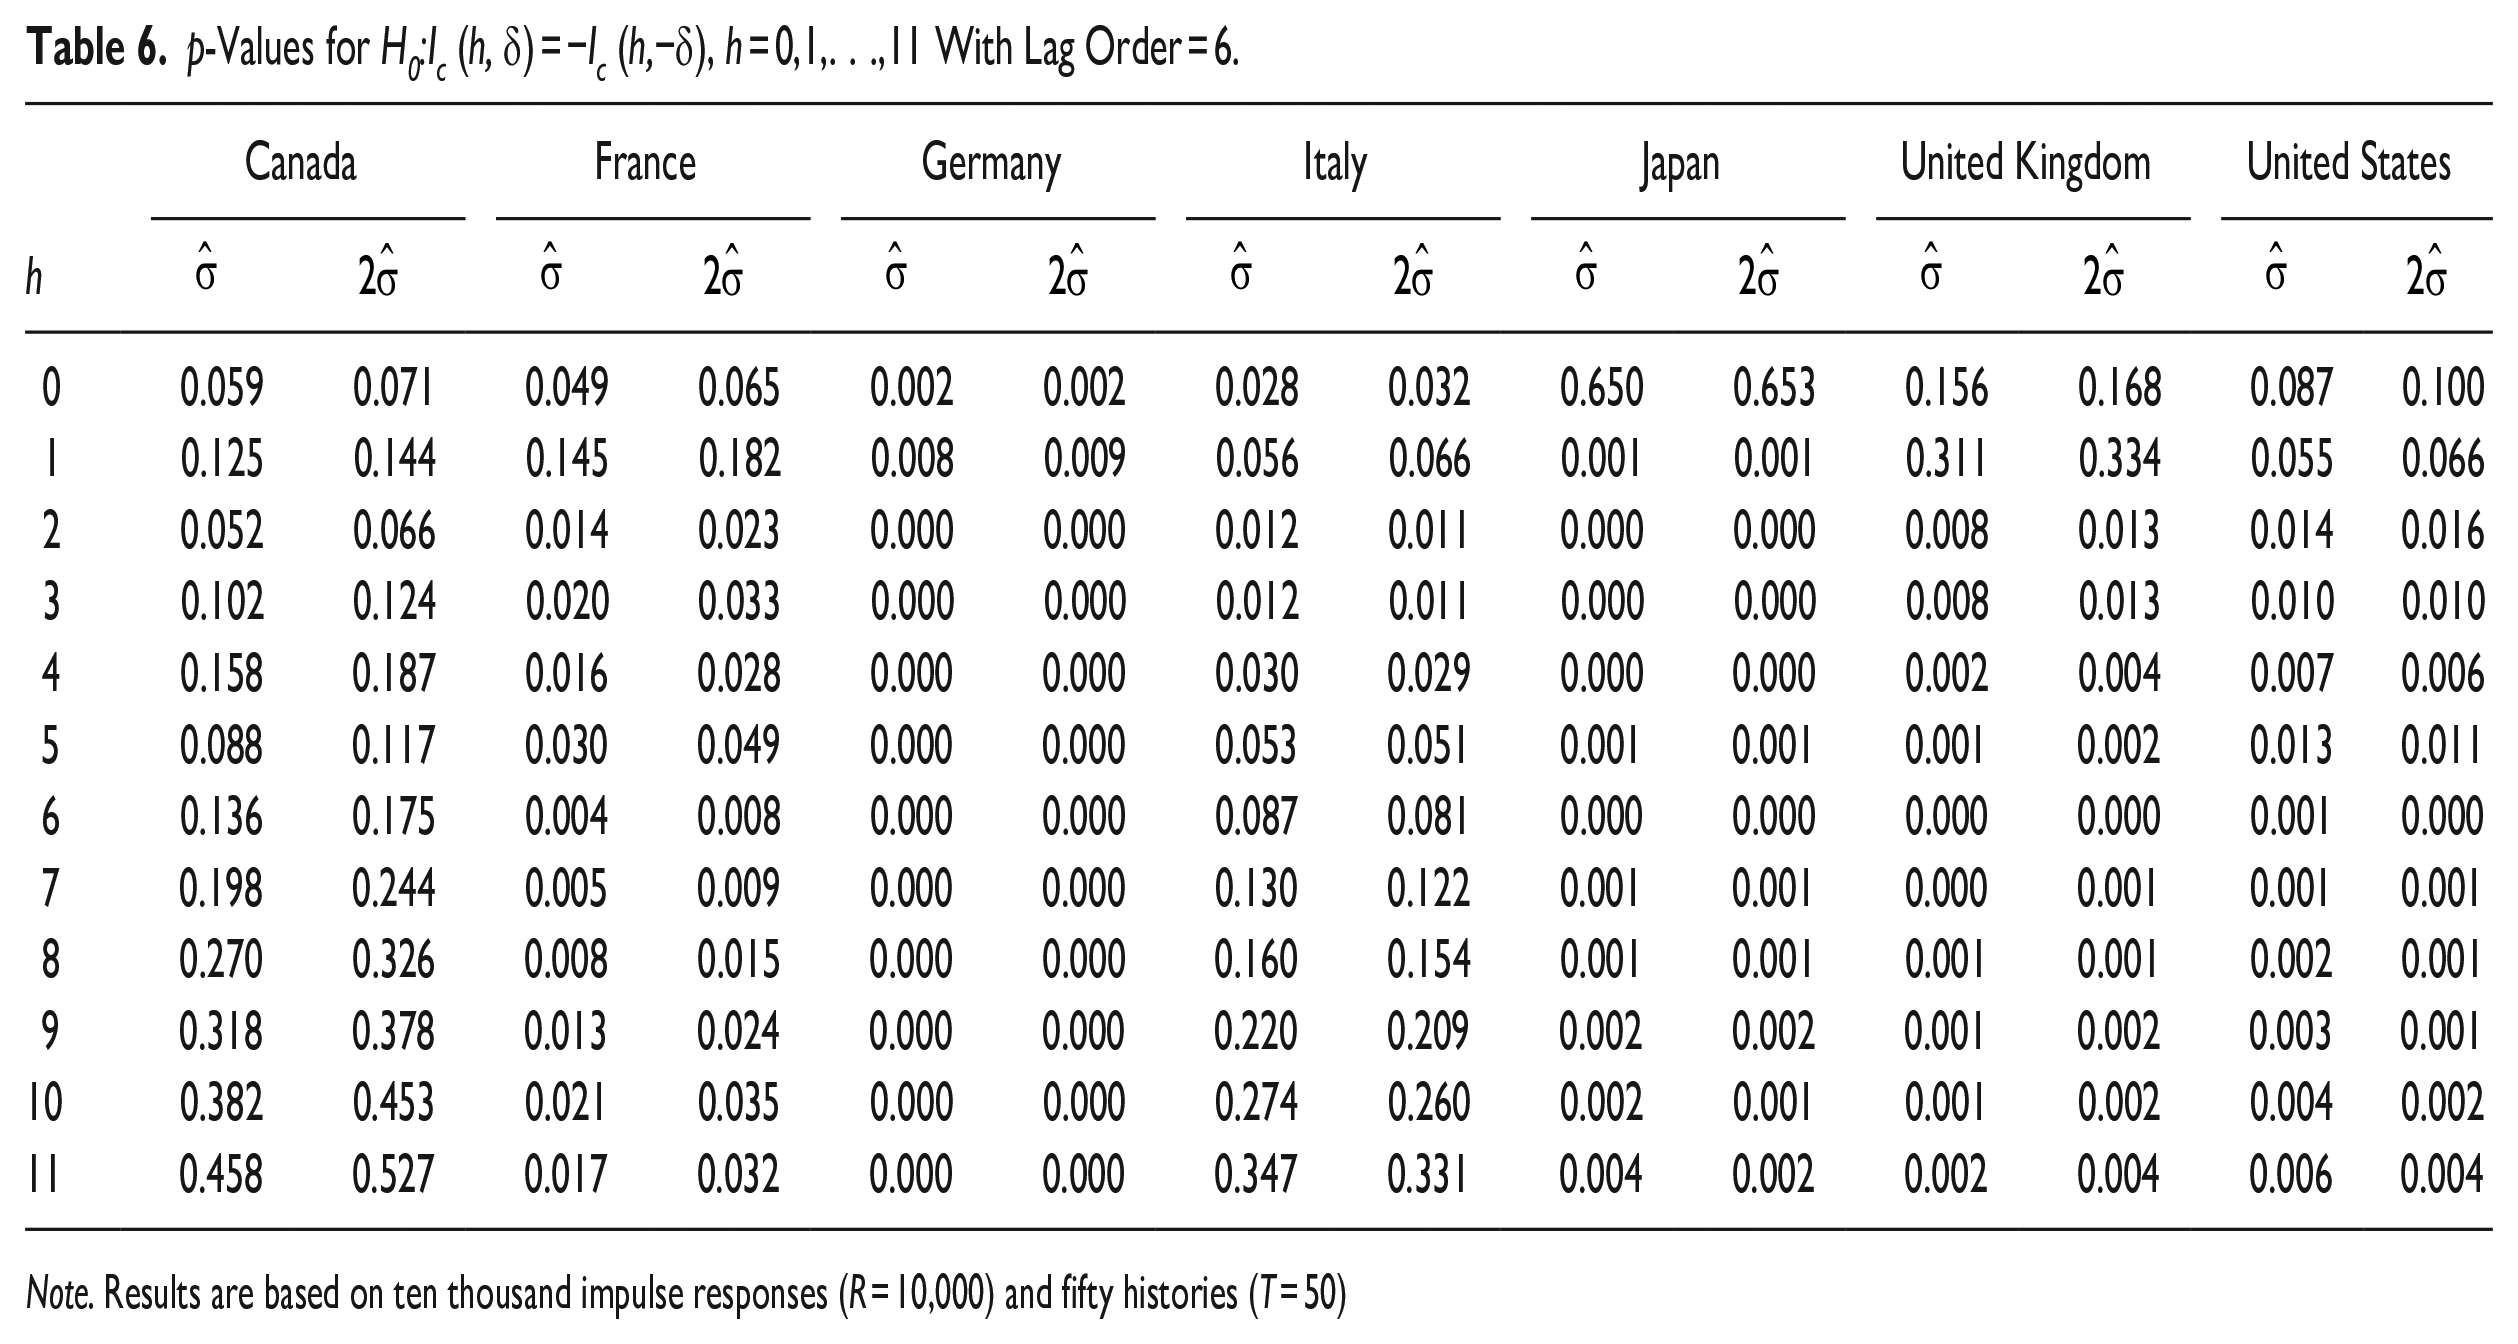
Note. Results are based on ten thousand impulse responses (R = 10,000) and fifty histories (T = 50)
As a robustness check, for each of the seven VAR models (one for each country), we implement the symmetry test by setting the optimal lag length to be equal to 12, considering the twelve-month net oil price increase. Looking at the results in Table 7, we find that the null hypothesis of symmetry can be rejected for all of the member economies of the G7. Thus, we can conclude that in general the response of consumer sentiment to positive and negative oil price shocks in the G7 countries is asymmetric in nature. Our results are consistent with the findings of a number of studies such as Mork (1989), Mory (1993), Hamilton (1996), and Davis and Haltiwanger (2001) which provide evidence of an asymmetric relationship between oil prices and aggregate economic activity.
p-Values for H0:Ic (h, δ) = −Ic (h,−δ), h = 0,1,. . .,11 With Lag Order = 12.
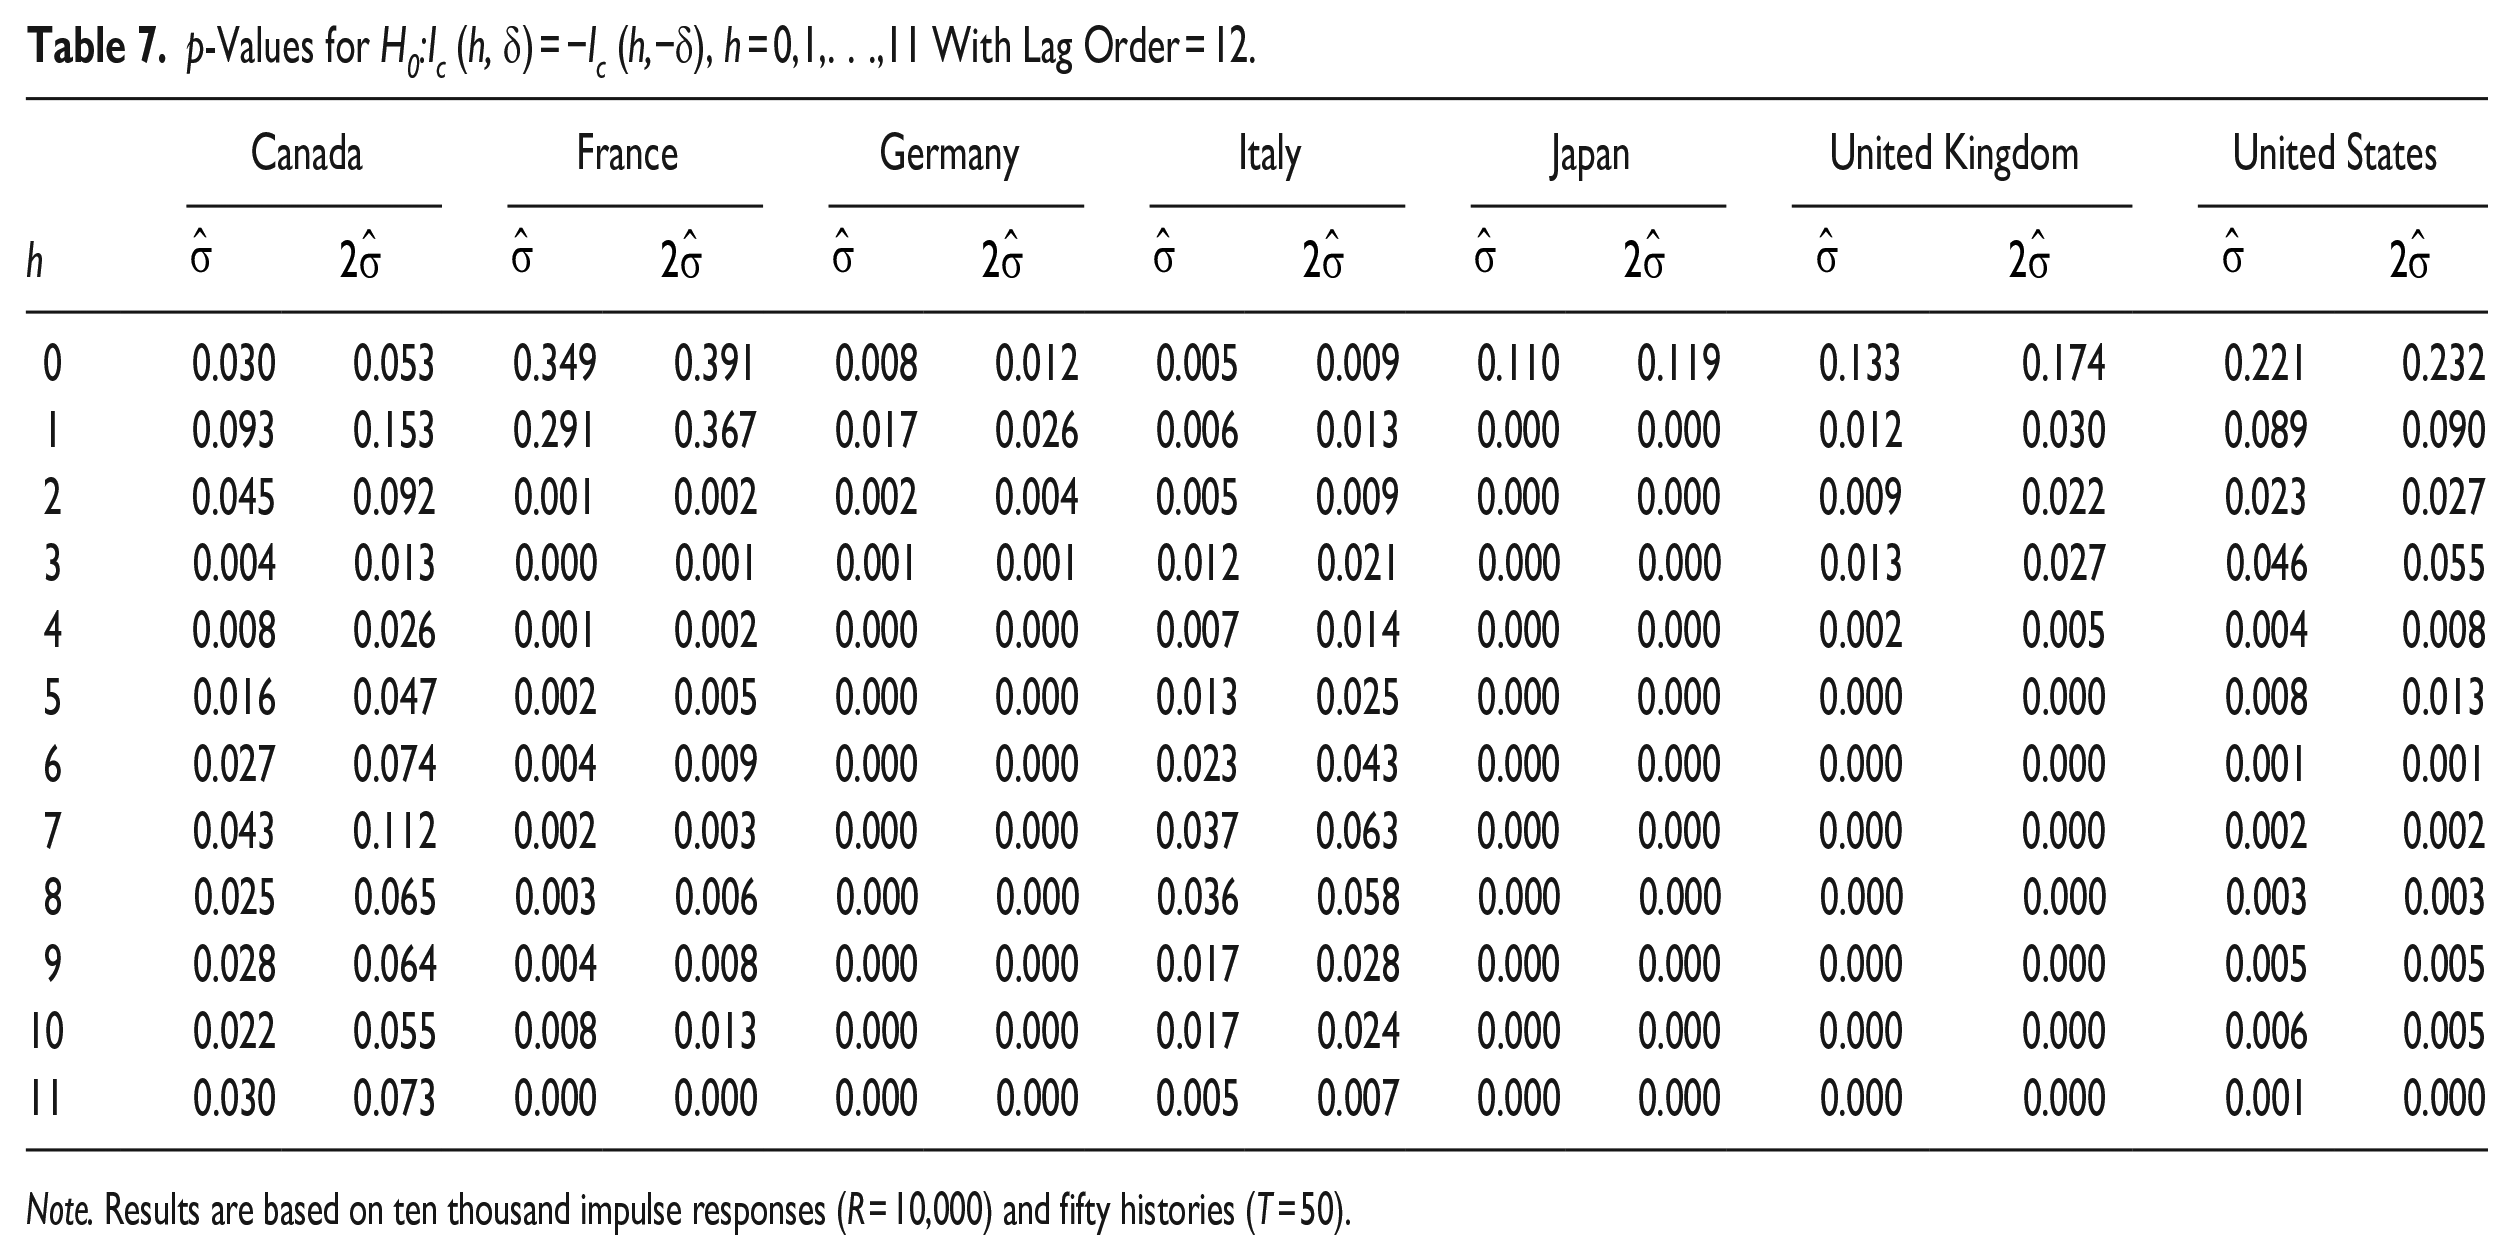
Note. Results are based on ten thousand impulse responses (R = 10,000) and fifty histories (T = 50).
Lee, Ni and Ratti (1995) also find asymmetry between the effects of positive and negative normalized oil price shocks, where positive shocks to real oil prices are associated with negative output growth and negative normalized shocks are found to be not statistically significant. They offer an explanation that asymmetry might be a result of a higher degree of uncertainty associated with higher volatility in the real price of oil which leads to investment being postponed. They conclude that the positive effect on the macroeconomy of an oil price decline might be dampened due to rise in uncertainty. In the previous section, we provided evidence that higher uncertainty regarding the future path of the real price of oil has in general a negative effect on consumer sentiment in the G7 countries. Higher uncertainty regarding real oil prices not only dampens investment spending but also consumption spending as well.
In this regard, Kilian (2014) argues that positive and negative oil price oil shocks lead to asymmetric responses of output and provides an economic rationale as to why positive oil price shocks generate large recessions whereas negative oil price shock have negligible effects on the economy. One of the explanations is that oil price shocks are allocative disturbances that generate sectoral shifts across the entire economy. Slight changes in the relative price of oil can have a potentially significant impact on demand. Bernanke et al. (1997) also state that the central bank responds to inflationary pressures generated from unexpected increases in real oil prices by raising interest rates leading to economic contraction but do not respond by the same proportion to unexpected declines in the real price of oil, thus leading to asymmetry.
5. Conclusion
In this paper, we investigate the impact of oil price uncertainty on consumer sentiment in the seven G7 advanced economies—Canada, France, Germany, Italy, Japan, the United Kingdom, and the United States. These economies are seven of the largest in the world in terms of GDP and consumer spending accounting for a significant portion of global economic activity. Work in the literature shows how lagged changes in consumer optimism affect consumer spending decisions.
With the recent Russia-Ukraine war and the subsequent G7 price cap on Russian crude oil exports, the world is plunged into fresh uncertainty about oil prices. Understanding how consumer optimism/pessimism in these large economies is affected by oil price uncertainty is an area of growing importance. Using a GARCH-in-Mean VAR model, we show that oil price uncertainty in general has a negative effect on consumer sentiment. Using a formal test of asymmetry we show that in general the relationship between real oil prices and consumer optimism is asymmetric in nature.
Future work can investigate the responses of domestic consumer sentiment to global oil price shocks in developing and emerging economies after controlling for region-specific factors.
Footnotes
Appendix
Data Description.
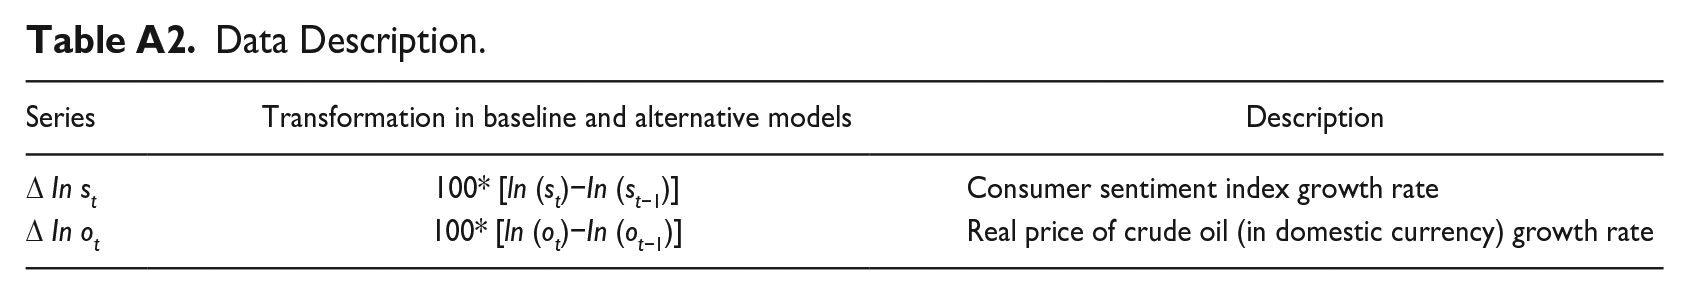
| Series | Transformation in baseline and alternative models | Description |
|---|---|---|
| Δ In st | 100* [ln (st)−In (st−1)] | Consumer sentiment index growth rate |
| Δ In ot | 100* [ln (ot)−In (ot−1)] | Real price of crude oil (in domestic currency) growth rate |
Acknowledgements
We would like to thank Adonis Yatchew and an anonymous referee for comments that greatly improved the paper.
Declaration of Conflicting Interests
The author(s) declared no potential conflicts of interest with respect to the research, authorship, and/or publication of this article.
Funding
The author(s) received no financial support for the research, authorship, and/or publication of this article.