
Abstract
Price incentives for reducing fossil fuel related carbon emissions are an important component of effective and efficient climate policy. Current incentives stem from a mixture of energy taxes and carbon pricing (incentivizing less emissions) and diverse support measures for fossil fuels (incentivizing more emissions). We develop a net carbon price indicator that complements existing subsidy and carbon pricing indicators. It can be calculated on different aggregation levels and compared across countries. We calculate the different components and our aggregate indicator for the year 2018 and for eight countries including the worlds’ six largest emitters. Our analysis reveals large differences in net carbon prices across countries and across sectors within countries. We argue that the sectoral differences can inform about adequate national policy reforms while the aggregate national indicator can be useful for international negotiations about comparable national efforts.
Keywords
1. Introduction
As e.g. the High-Level Commission on Carbon Prices (2017) and other high-level economists (Economists’ Statement on Carbon Dividends 2019) stress, pricing carbon is essential to efficiently and effectively reduce emissions that cause anthropogenic climate change. Yet, it is also common practice to subsidize fossil fuels as one of the main sources of carbon dioxide (CO2), which counteracts climate policy measures since the subsidies affect marginal incentives to use these CO2-intensive fuels. As the High-Level Commission of Carbon Prices (2017, p. 12) and the World Bank (2018, p. 31) point out, fossil fuel subsidies act like or are effectively a negative carbon price. While there is some literature (e.g. Burniaux and Chateau, 2014, Jewell et al., 2018) on the emission reductions potentially resulting from phasing out fossil fuel subsidies that is reviewed in more detail in the next section, the negative carbon price concept regularly mentioned in reports such as those cited above, is not yet formally defined and operationalized.
Given that reducing fossil fuel subsidies is an important focus of international climate policy, what does exist are various efforts to measure global fossil fuel subsidies, most notably by the Organization for Economic Co-operation and Development (OECD), the International Monetary Fund (IMF) and the International Energy Agency (IEA) (see OECD, 2021a, IMF, 2019 and IEA, 2021a). These measures of subsidies have their individual purposes they were constructed for and thus merits but - as we will argue below - give only limited information on how the subsidies relate to the overall incentives to use fossil fuels and thus to efficient climate policy especially in developed countries.
While there are other measures such as direct carbon prices and energy taxes per tonne of CO2, none of them captures all relevant incentives for carbon emissions related to fossil fuels. We thus develop a new comprehensive measure that we term
As an empirical example, we calculate national and sectoral average net carbon prices for the six largest emitters worldwide (China, United States—U.S., India, Russia, Japan, and Germany), as well as for Sweden and Poland—two European countries with a perceived opposing focus in energy and environmental policy.
The objective of this paper is thus twofold. First, from a methodological side, the aim is to develop a complementary new measure to inform about efficient climate policy and subsidy reforms. The second objective is to given an empirical example of how this measure can be calculated and to derive specific policy recommendations from our calculation of net carbon prices for major emitters. In this context, especially our sectoral analysis that becomes possible with our measure can provide new insights and adds to the literature.
The paper proceeds as follows. In section 2 we review the literature on fossil fuel subsidies and discuss the existing approaches to measure them. We then present our net carbon price approach in section 3 that also includes the method and data for our calculations. In section 4 we present and discuss quantitative estimates for net carbon prices. Section 5 concludes.
2. Literature Review
2.1 Fossil fuel subsidy reforms and their impact
There is a broad academic literature related to fossil fuel subsidies though it mostly focusses on issues of limited relevance for our study. The largest strand of literature that is reviewed in Couharde & Mouhoud (2020) assesses the impacts of fossil fuel subsidies and fossil fuel subsidy reforms in developing countries. Effects on emissions are partly assessed but mostly the focus is on impacts on inequality and poverty: In these countries fossil fuel subsidies frequently lead to below market prices and “distributional consequences often come at the expense of the poorest households” (Couharde & Mouhoud, 2020). Related literature such as Rentschler and Bazilian (2017) recognizes fossil fuel reforms also beyond developing countries. These authors stresses that fossil fuel subsidy reforms play “a critical role in climate policy.” Generally, this strand of literature is mostly qualitative or descriptive partly adding theoretical aspects of subsidy reforms as in Plante (2014). As a second strand of literature, applied empirical or modeling studies that quantify the economic and environmental effects of fossil fuel subsidy reforms are more closely related to the question of efficient climate policy that motivates our study. Several papers reviewed in Thube et al. (2021) find that globally phasing out fossil fuel subsidies slightly increases global welfare and reduces global CO2 emissions. Welfare effects on the country level can also be negative as e.g. for Russia. The most prominent study by Jewell et al. (2018) suggests that a global phase out of fossil fuel subsidies by 2030 would reduce global CO2 emissions by 1 to 4% relative to a business-as-usual scenario, which is in line with Chepeliev and van der Mensbrugghe (2020). Previous studies (Schwanitz et al., 2014, Burniaux and Chateau, 2014) find somehow higher impacts. Quantitative studies also exist for single countries such as China (e.g. Boqiang and Ouyan, 2014) or Ghana (Wesseh et al., 2016). Overall this literature supports the view that fossil fuel subsidy reforms should be part of an efficient global climate policy. It is focused on the emission or distributional effects of reforms and not on measuring or comparing the emission incentives.
Most relevant for our study, that focusses on the measurement of subsidies and an international sectoral comparison of different sectors is the literature on measuring fossil fuel subsidies. This is reviewed in the following section and mostly consists of reports from international organizations.
2.2 Existing subsidy measures and their relation to fossil fuel use incentives
Subsidies for fossil fuels are measured and quantified by the IEA, the IMF and the OECD. Their approaches differ and are compared by Bárány and Grigonytė (2015). A central approach used by the IEA is to estimate the price-gap between actual prices and benchmark prices. The IEA records a subsidy when actual prices for a fuel fall below international market prices (including value added tax (VAT)) and multiplies the measured price gap with consumption levels to arrive at total subsidy estimates (IEA, 2021a). Koplow (2018) emphasizes the simplicity of the method, as the IEA does not need government cooperation to collect the data. Results are also well suited for comparisons between different countries. The measure was not created as an indicator of emission incentives. However, by applying emission coefficients to the estimates for each fuel, an aggregate value per tCO2 can be produced. Also, world market prices as benchmark prices are sometimes criticized (Koplow, 2018) and influenced by producer subsidies. Generally, consumer subsidies shift the demand curve for fossil fuels to the right, leading to higher emissions, producer subsidies shift the supply curve to the right, also leading to higher emissions and providing equally perverse incentives. The strength of these effects depends in both cases on elasticities of substitution.
Due to the chosen benchmark price the IEA measure can be calculated only for countries with a low tax base and consumer prices below world market prices. These are typically developing and emerging countries and oil-exporting countries. For developed countries, in which fossil fuel prices are usually above world market level owing to some combination of excise and carbon taxes, this approach would yield negative values. The IEA database (IEA, 2021a) reports subsidies of around USD 180 bn that stem from 42 developing and emerging countries, including China, India and Russia.
The IMF also uses the price-gap approach but partly choses a different benchmark price. Its pre-tax subsidy calculation is similar to the IEA’s and focused on consumer subsidies (Coady et al., 2017). For the post-tax estimations, the price-gap is calculated relative to the international market price including distribution cost, but also a tax which internalizes the externalities caused by fossil fuel use (Clements et al., 2013). The included externalities are damages by global warming, local air pollution and vehicle externalities, while the consumption tax component reflects the average consumption taxation level of the examined country. The latest IMF study (Parry et al., 2021) reports global fossil fuel subsidies in 2020 adding up to about USD 5.9 trillion or 6.8 percent of GDP. Eight percent of these are explicit subsidies and the rest represents what the IMF now calls implicit subsidies related to undercharging for the environmental costs and forgone consumption taxes.
Finally, the OECD’s Inventory of Support Measures for Fossil Fuels (in the following abbreviated as “OECD Inventory”) was developed to measure fossil fuel subsidies in high-income countries, where fuel prices are generally above international market prices because of general (value added) and specific (fuel) taxes. It includes budgetary transfers and tax expenditures that provide a benefit or preference for fossil-fuel production or consumption. Each measure is quantified individually based on data from government budget documents and tax-expenditure reports and added up by country. Globally, their latest 2019 subsidy estimates sum up to of USD 178 bn (OECD, 2021a).
Related to the tax expenditures, which are the larger share of subsidies for developed countries, there is again the issue of choosing a benchmark rate that determines rebates, exemptions or other forms of reduced taxation. National fuel taxes are typically differentiated by fuel type, energy usage (mainly heating vs. propulsion) and usage sector (e.g. industry). In this context, for example, a higher fuel tax on gasoline than on natural gas, a higher fuel tax on diesel used for propulsion than on diesel used for heating, or a higher fuel tax on natural gas for residential use than for electricity generation is usually not considered a subsidy by national authorities. In general, only fuel tax differentiation within general sectors (transport, residential and commercial, industry and electricity generation) is considered a fuel-tax subsidy. For example, a lower fuel tax on diesel used for agricultural transport than on standard transport diesel is usually considered a subsidy, as are lower fuel tax rates for energy-intensive industry (compared with general industry fuel tax rates). In addition, fuels that are generally taxed at low rates, like coal, are not represented in the OECD Inventory. This is because same-fuel rates are generally chosen as the full rate.
To quantify the fuel tax subsidies the difference between the reduced tax rate and a case-specific (higher) full tax rate is multiplied with the consumption of the fuel. This is called revenue-forgone measurement and stems from governments’ budget documents and tax-expenditure reports (see for example BMF, 2017 or Swedish Ministry of Finance, 2019). This implies that an increase in a full rate for a fuel-tax subsidy measure will automatically lead to higher subsidy estimates. Also, higher full rates allow for more potential differentiation between full and reduced rates, therefore higher subsidies are often reported in higher taxed countries. Due to the country specific estimates—as also the OECD notes - results are not appropriate for country comparisons (OECD, 2021b) but can be especially useful for countries to improve their tax system.
In summary, the price gap-approach requires a benchmark price which is for the IEA estimations the world market price and for the IMF estimations the world market price plus externality costs. Other benchmark prices are in principle possible but not found in the literature. The IEA estimates can thus only be applied to economies whose domestic fuel prices persistently fall below the world refence price and at least partly misses producer subsidies that are potentially significant at least in fuel-exporting countries, as well as other budgetary transfers which can also provide perverse incentives. Where the price-gap approach includes estimates for externalities (as is the case for the IMF estimates), it becomes prescriptive in the sense of showing the gap to an “optimal” policy.
The inventory approach only records a small share of fuel tax differentiation, and recorded subsidies are measured in a way that does not reflect differences in carbon emissions across fuels. It also requires assumptions about benchmark prices (in this case for fossil fuel taxes). Because they were not constructed for this purpose, the existing estimates of fossil fuel subsidies are not indicators of incentives to emit carbon.
2.3 Approaches to measure carbon emission incentives
If one is interested to measure the incentives for carbon emissions, there are other approaches, that have explicitly this aim and partly link also to the fossil fuel subsidy discussions especially in developed countries where most fossil fuel subsidies are provided in the form of tax exemptions.
First, the World Bank carbon pricing dashboard (World Bank, 2021) reports national and regional direct carbon pricing measures including carbon taxes and emissions trading systems.
Second, the OECD publishes the Taxing Energy Use (TEU) report (OECD, 2019), which includes data on energy and carbon taxes in OECD and G20 countries and translates them into values per tonne CO2 using consumption values where necessary. These values indicate the direct or indirect national carbon price for different sectors and are related to the OECD Inventory data on tax exemptions. The data do not include carbon pricing through emissions trading systems, though there is a less detailed report which calculates a “Carbon Pricing Score” for each economy (OECD, 2021d) using TEU data and permit prices in emission trading systems.
Finally, there is the concept of regarding fossil fuel subsidies as negative carbon prices. In its Carbon Pricing report (World Bank, 2018), the World Bank states that “fossil fuel subsidies are effectively a negative carbon price and hinder decarbonization efforts.” The High-Level Commission on Carbon Prices (2017) describes fossil fuel subsidies as being “similar to a negative emissions price.” There are only two instances where a such a concept has been actually defined and calculated. Larsen and Shah (1992) estimated how high a carbon tax would be needed to achieve an equivalent reduction to subsidy removal by using the demand elasticity of fossil fuels. They only assessed the kinds of subsidies that the IEA measures—i.e., consumer price support. Parry et al. (2014) displayed subsidies per tonne CO2 by dividing subsidies (derived with the post-tax price-gap approach) and taxes per unit of fuel by the fuel’s emission factor.
3. Methods and Data
3.1 General approach to calculate net carbon prices
Our aim is to design an encompassing indicator of actual emission incentives that can be applied to all countries and is suited for cross-country comparisons. It should cover negative incentives as well as positive incentives and allow for an aggregation of both. One approach would be to use the price gap approach and to consider both negative as well as positive gaps of national gross fuel prices compared to world market price as a benchmark price. This is in principle possible and requires very differentiated domestic gross fuel prices. Producer subsidies would in this approach only be captured through their influence on world market prices. More generally, the extent to which government policies impacts consumer and producer prices resulting in a “price-gap” depends on the elasticities of supply and demand for different fuels and uses and partly whether the fuel is internationally traded. A link to specific measures is thus difficult. We chose another approach that is independent of benchmark prices and directly shows the impact of specific government policies or at least types of policies. It combines direct carbon pricing, indirect carbon pricing though energy taxes and the concept of indirect negative carbon prices stemming also from non-tax related fossil fuel subsidies. We term this measure of incentives to use fossil fuels “net carbon price.” This measure is meant to complement existing approaches and combines all relevant marginal price incentives and disincentives on carbon emissions. It can also be seen as country-specific and if needed sectorally differentiated net prices that could be compared to a world market price (denoted per tonne of CO2) with or without additional externalities to arrive at a price gap. Our net carbon price has three parts: (1) direct carbon pricing through carbon taxes and emissions trading schemes (ETS) which are already measured per tonne CO2; (2) the disincentivizing effect of fuel taxes measured per tonne CO2 taken from in the TEU report; and (3) incentives of the remaining fossil fuel subsidies that are not fuel tax exemptions, for comparability also measured per tonne of CO2.
While the first two components should be uncontroversial, the third category is more complex. Analyzing the fossil fuel subsidies captured in the OECD Inventory one can see that there are first a number of additional tax exemptions for consumers related e.g. to sales and income taxes that are not captured in the TEU report. It makes sense to use the same logic as in the TEU report and to calculate the value of these support measures per tonne of CO2 using the physical amounts of the exempt fuels and emission coefficients. The same approach makes also sense for budgetary transfers to consumers like e.g. subsidies for heating fuels, direct transfers for fuels, or support for distribution costs. Then, there are non-tax related support measures of which some like “Early Retirement Payments for Hard Coal Miners” in Germany, “Aid for Coal Mine Decommissioning” in Poland, the establishment of different commissions in India or “Payments for Fossil Fuel Energy Research and Development”, at most very indirectly affect the costs to use or produce fossil fuels. These measures should not be captured in a “net carbon price.” Since our aim is to create a simple, replicable indicator, potentially available for a large set of countries, we do not consider subsidies that are categorized in the OECD Inventory as “Knowledge” (covering examples like the different commissions and research and development programs) or “Labor” (that cover retirement benefits). The latter might be slightly problematic since these subsidies can be argued to reduce labor costs in some, very limited cases, but we believe that the simplification justifies this approach. Furthermore, we do not consider subsidies that are classified “electricity-based support” that cannot be related to a specific fuel. The remaining producer subsidies but also “General Service Supports” potentially affect the variable or fixed costs to produce fossil fuels which would shift the supply curve to the right, also leading to higher emissions and providing perverse incentives. In the first step it is necessary to assess whether this is indeed the case. Unfortunately, this is necessary on a case-by-case basis which is not really simple and prone to different judgements. To apply this approach on a broader basis than in this case study, some international agreements and potentially a further classification within the OECD inventory would be necessary. We decided to be rather too inclusive than exclusive and make our classification transparent in Table 8 in the Online Supplementary Material. In the second step, the subsidy has again to be transformed into a negative carbon price in the logic of a conventional direct and always positive carbon price through a carbon tax or an emissions trading system. In a standard model without market distortions it does not matter whether carbon prices are applied to consumers or producers of fossil fuels, the resulting market equilibrium and consumer prices are identical. In reality, upstream carbon prices are not completely passed-on to consumers. Furthermore, while domestic consumer support affects domestic demand and thus leads directly to higher (domestic) carbon emissions, domestic producer support affects world market supply and world emissions and the effect is less direct. Still, we take the equivalence of upstream and downstream carbon pricing as a justification to translate producer subsidies into negative carbon prices per tonne CO2. To stay comparable to the other components that focus on the domestic incentives we multiply the subsidies by the share of domestically used fuels and calculate the subsidy per domestic emissions. This is relevant for selected subsidies in the U.S., Russia and Poland. The other countries either do not have subsidies related to potential exports or if they do (Germany, China, India) their export share of the relevant fuel is basically zero. We are aware that this approach is a simplification and not completely theoretically correct and thus always separately display the carbon price component resulting from producer subsidies. Figure 1 illustrates the elements of the net carbon price and their relation to different reports. To calculate net carbon prices, we use data on net fuel taxation and carbon taxes from the OECD’s TEU report that is already calculated in €/tCO2. For direct CO2 prices, we match permit prices to covered emission quantities and sectors, based primarily on information provided by the World Banks’ Carbon Pricing Dashboard (World Bank, 2021). For marginal subsidies other than fuel-tax subsidies, we devise our own dataset based on subsidies recorded in the OECD Inventory following the described selection process. The resulting net carbon price is the sum of the first two bars minus the negative carbon price implied by the selected subsidies.
We term the fuel and carbon tax rates provided by the TEU report net tax rates and use the term negative carbon prices for the marginal subsidies included in net carbon prices. Note also, that in Figure 1, the sum of excluded and fuel-tax subsidies plus the negative carbon price equals the value of the OECD Inventory data not in terms of absolute monetary value but per tCO2.
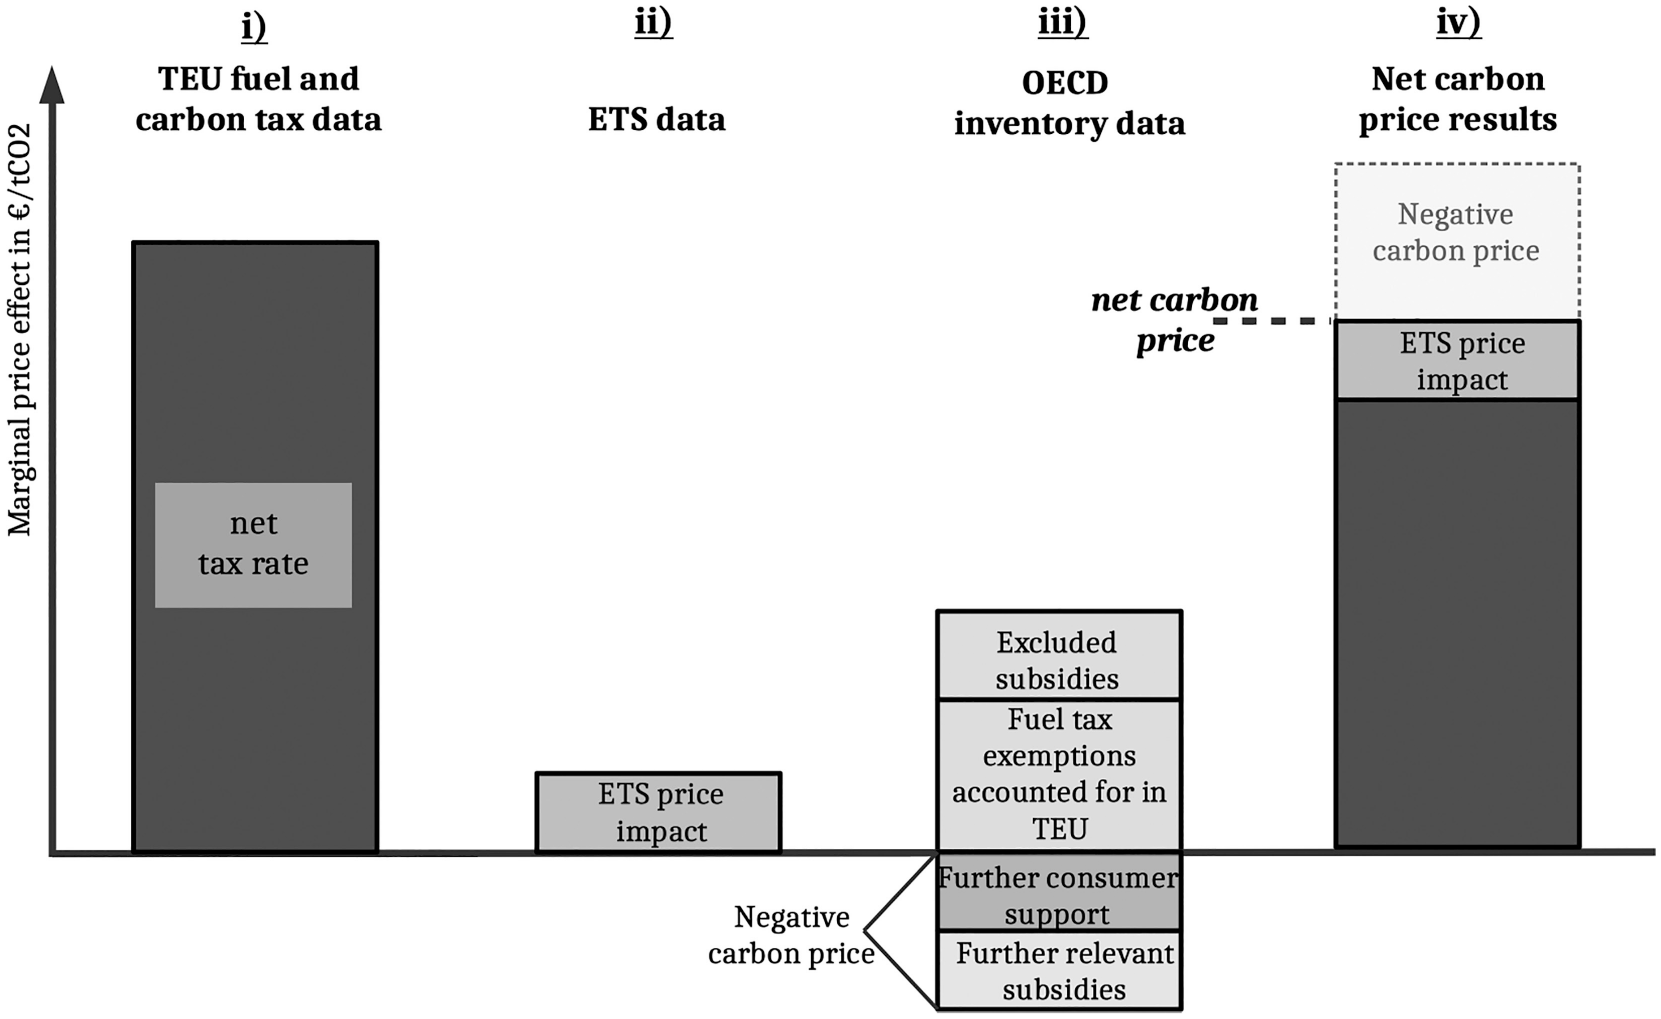
Net carbon price elements and relation to different existing measures
(Own illustration)
At its non-aggregated level, a net carbon price is particular to a fuel and its circumstances of usage. A narrow example would be a net carbon price for diesel fuel used for heating in a private home of a low-income household in the U.S. state of California. Diesel fuel is subject to different fuel tax rates depending on the sector and usage type—residential heating in our example. Low-income households often get direct or indirect energy assistance, therefore specific price incentives apply here because of subsidization. Most fossil fuel use in California is also covered by California’s ETS. All these price incentives for fossil fuel use combine to a net carbon price particular to these circumstances.
To calculate weighted national or sectoral data we use fuel consumption data. Figure 2 illustrates how individual net carbon prices are aggregated to a sector and then country average. The individual, non-aggregated net carbon prices in the transport sector are shown on the left, combined with the consumption per individual fuel. The second step is the consumption-weighted average net carbon price for the transport sector. The same principles apply on the right side, sector-average net carbon prices are aggregated to a country-average net carbon price. An aggregation per fuel is also possible, but not reported in this paper.
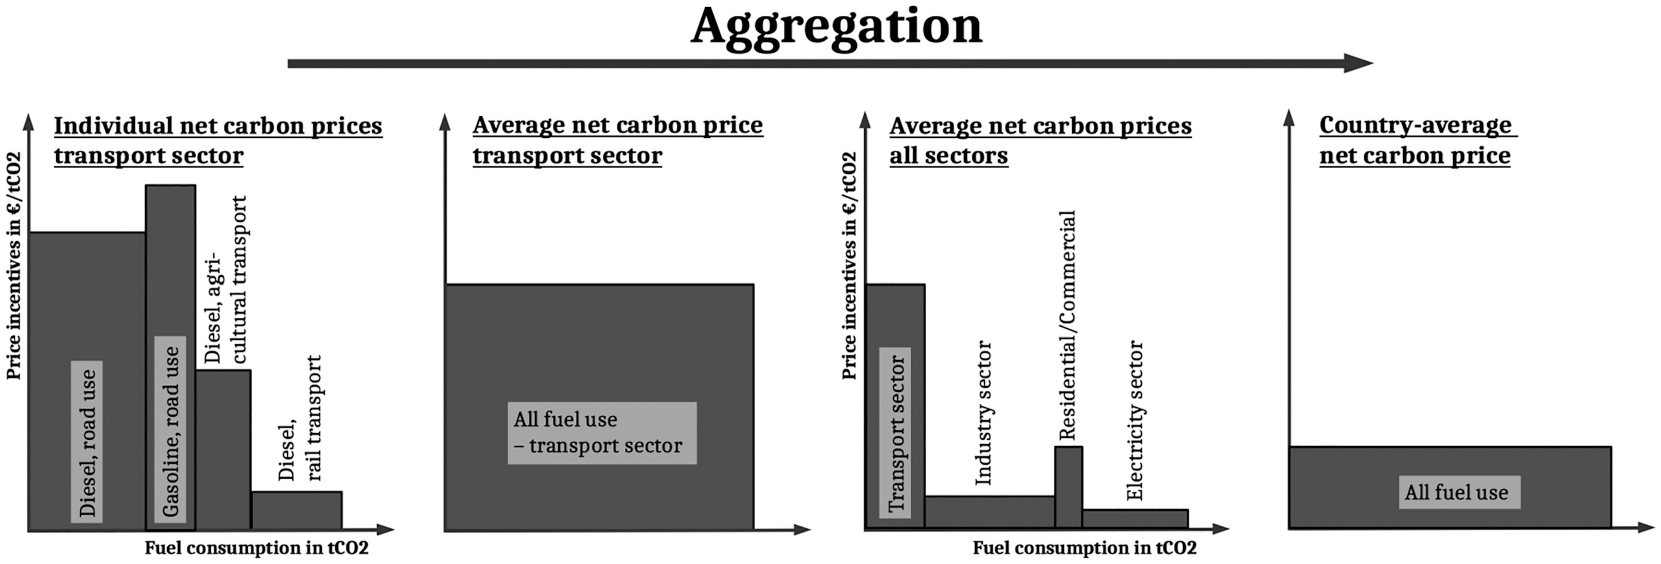
From individual net carbon prices to a country-average net carbon price
(Own illustration)
In the next sections, we describe our data sources in more detail and present our data for the top six emitters (China, U.S., India, Russia, Japan and Germany), as well as Sweden and Poland, two European countries with a perceived opposing focus in energy and environmental policy. Together these countries accounted for over 60% of worldwide emissions in 2019 (EDGAR, 2020). We report sectoral rates for four sectors: transport, industry, residential and commercial and industry.
3.2 Data sources
3.2.1 Fuel and carbon tax data from the OECD TEU report
We take fuel and carbon taxation as well as fuel consumption data from the OECD TEU report (OECD, 2019) which provides net tax rates for the year 2018. Data are reported for 44 countries, structured by fuel for six sectors: road, off-road, industry, agriculture and fisheries, residential and commercial and electricity. We use the data for tax rates per CO2-emissions and consolidate the six sectors into four. We aggregate road and off-road sectors with transport, and agriculture and fisheries with industry. Both the off-road sector and the agricultural and fisheries sector do not account for significant emissions and therefore add little additional information.
The matching of fuel tax rates to consumption quantities of the taxed fuels is an important part of the TEU data, as fossil fuel consumption statistics are often not differentiated by the same characteristics as fuel tax rates are. 1 The national tax agencies possess the fuel consumption data directly matched to individual tax rates, but usually report aggregated tax revenue from different rates for the same fuel. Its cooperation with the IEA, the publisher of the most comprehensive statistics on worldwide fossil fuel use, allows the OECD to match consumption to tax rates for a large set of countries. While there are other data, for example by the EU which publishes differentiated fuel tax rates of its member countries (EU COM, 2021), the matching of tax rates to consumption makes the TEU data best suited for a country comparison.
3.2.2 Carbon prices in emission trading systems
Price incentives of ETS act similar to carbon taxes, with the only difference being the volatility of permit prices. While the Effective Carbon Rates report (OECD, 2018 and 2021d) includes ETS prices in addition to the TEU carbon and fuel tax data, we compiled our own dataset mainly because the OECD reports only the difference between taxation levels and different benchmark CO2 prices. Prices above € 120/tCO2 are thus not captured (OECD, 2021d). We estimate ETS prices using data on emission caps and sector coverage from the World Bank (2020), data on auction prices from the International Carbon Action Partnership (ICAP, 2021), as well as EU (EEA, 2021) data on emissions covered by the EU ETS. We use 2018 permit quantities and 2018 average auction prices where available. In addition to the EU ETS, we include data from regional schemes in China and the U.S. Tokyo also has a regional ETS scheme, but we do not include ETS price data for Japan as its coverage is limited and the total value of permits is under €10 million (World Bank, 2021). Part three of the Online Supplementary Material gives details for the different ETS schemes. All prices are converted to €/tCO2 using reference exchange rates for 2018 from the European Central Bank (ECB, 2020). Note that our approach implies that we do not differentiate between freely allocated allowances and auctioned allowances, since at least in a simplified setting, the incentives for consumers of fossil fuels are the same.
3.2.3 Subsidy data
As described in section 3.1 we include two subsidy types: (1) additional consumer subsidies, both tax exemptions not related to the TEU data and other budgetary transfers and (2) producer subsidies that affect supply of fossil fuels. These two act like negative carbon prices.
We use data from the OECD Inventory as it is the most comprehensive and detailed over-view of fossil fuel subsidies for the countries we cover in this study. It collects data on all measures that fall under the OECD’s definition (see OECD, 2021b) for 50 countries, providing yearly estimates of the monetary value of each measure on a per fuel basis by attributing the subsidy to individual fuels by share of consumption. 2 It includes consumer and producer subsidies, as well as a general services category. As described in section 3.2 we evaluate each measure for our country sample and select additional consumer support and further subsidies measures which provide a price incentive for fossil fuel production and use. We also assess whether a selected subsidy affects also exported fuels and if it does multiply its value with the share of domestically used fuels based on IEA (2022) data. We provide a list of our categorization of all support measures in the OECD Inventory that do not form part of TEU in part one of the Online Supplementary Material.
To present net carbon prices by sector, we categorize subsidies by sector. If a subsidy cannot be categorized, it is allocated to sectors depending on fuel usage, using IEA sector fuel consumption data (IEA, 2021b). We combine total subsidization by sector with TEU sector consumption data to calculate negative carbon prices in €/tCO2.
To calculate country-average net carbon prices we again convert the subsidies numbers to subsidies per tCO2. We divide total selected subsidies per country for the year 2018 (the same year as for the TEU data) from the OECD’s Inventory by total CO2 emissions from fossil fuel combustion, using IEA/OECD emission data (OECD, 2021c).
3.2.4 IEA price gap data
For the countries in our sample that have fuel prices below world market prices (China, India and Russia), we show IEA subsidy estimates for 2018 (IEA, 2021a) in addition to our net carbon price measure and translate them into negative carbon prices using the same emission factors and fuel consumption data we use for the OECD Inventory data. IEA reports subsidy data only on a national and not on an industry level.
4. Results
This section describes the results of our analysis. The data underlying all figures can be found in the Online Supplementary Material, as well as additional information about subsidy data and sectoral emissions.
4.1 Country-average results
Figure 3 presents country-average net carbon prices. We show the four components of our measure namely net tax rates, ETS price, consumer subsidies and further subsidies, while Figure 4 compares our overall net carbon price with fossil fuel subsidies as recorded in the OECD’s Inventory (without any modification, counting all subsidies) and the IEA subsidy estimates, both transformed into €/tCO2.
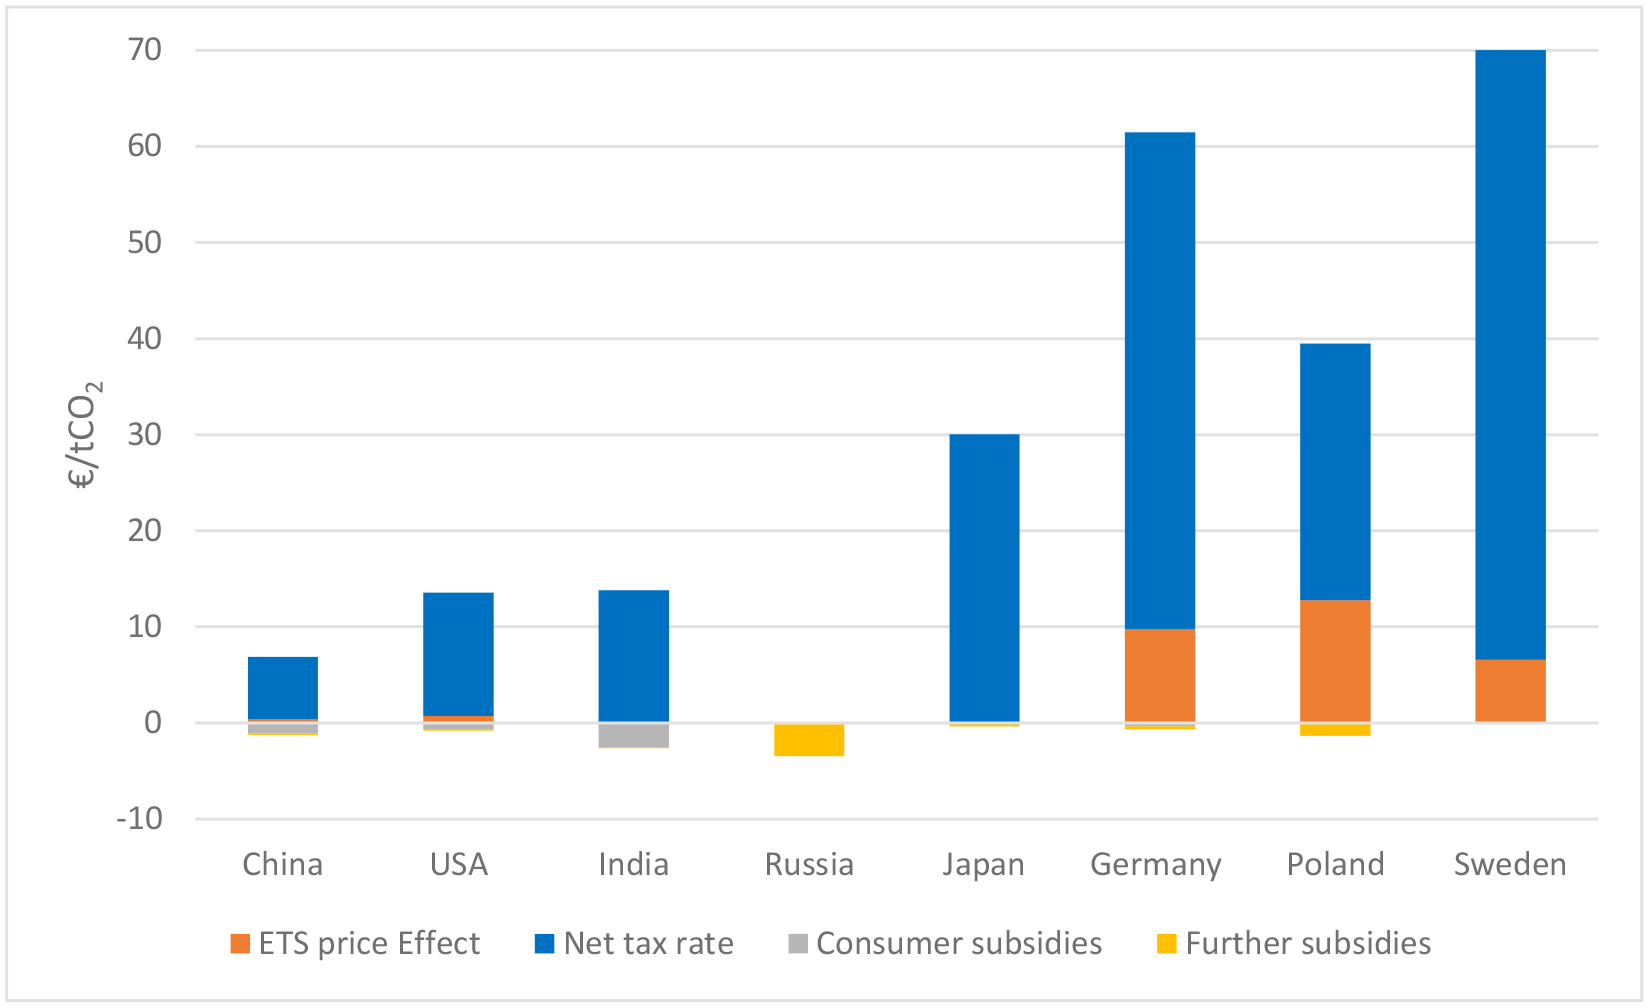
Country-average net carbon price and its components
(Own calculations)
We first examine Sweden. Sweden has both the highest net carbon price (see Figure 3) as well as the highest per tCO2 subsidies from the OECD Inventory (see Figure 4). The latter are, for example, 35 times higher than those of the U.S., while the net carbon price is almost 9 times higher. There is no negative carbon price component, because Sweden only reports fuel tax exemptions. These are quite high for two reasons. First, Sweden has by far the highest country average net fuel tax rate in our analysis, due to the combination of fuel and carbon taxes or ETS coverage on most fuels, and also the small amount of fossil fuels used in the less highly taxed non-transport sectors. Higher average tax rates lead to a larger difference between the full tax rate and the reduced tax rate. The second reason is Sweden’s broader definition of fuel tax subsidies. While most countries choose a different tax rate of the same fuel as the benchmark, Sweden uses the highest rate in the same sector (Swedish Ministry of Finance, 2019). This implies that more tax rate differentiation than usual is counted. 3
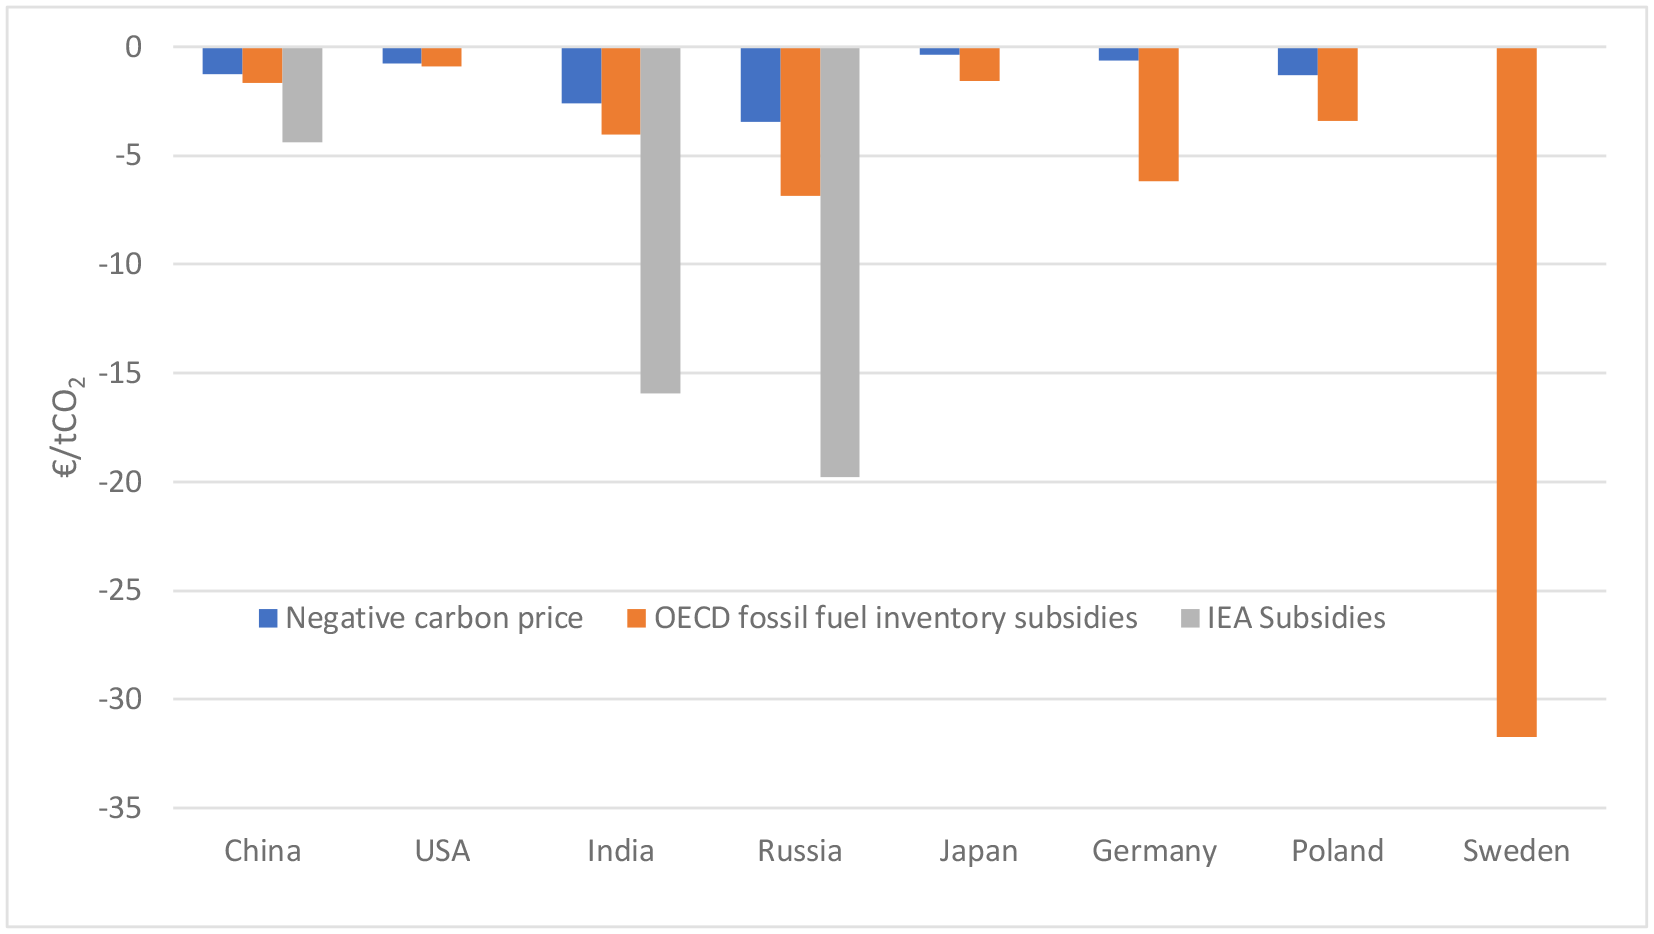
Comparison of net carbon price with fossil fuel subsidies as recorded by OECD and IEA
(Own calculations)
High CO2 taxation going hand in hand with high subsidies is present also in most other high-income countries in our study, namely Germany, Poland and the U.S. but to a lesser extent. The U.S., for example, has both the lowest net carbon price and the lowest subsidy figure per tCO2 derived from the OECD Inventory data in our country sample. The only outlier is Japan, which has relatively low Inventory subsidies despite a high taxation level. While Japan has differentiated fuel tax rates and regulated fuel prices for certain sectors (OECD, 2020), it does not consider tax rate reductions a subsidy.
The correlation of high tax rates and high subsidy figures is most pronounced in high-income countries because they tend to have a higher share of tax subsidies—at least 50% of recorded subsidies and significantly more for all high-income countries in our sample except Japan. 4
Lower-income countries like China and India have a lower share of only one-third tax subsidies in 2018 (OECD, 2021a). They report more relevant subsidies and further tax exemptions and reliefs in the OECD Inventory (see list Table 8 in the Online Supplementary Material) and thus have a higher negative carbon price. The total amount of tax expenditure is also relatively low for China and India, both subsidize certain fuels below international market prices (IEA, 2021a). The IEA data imply negative carbon price rates at much higher rates than calculated from the OECD Inventory, which makes sense since they include external environmental costs.
The subsidy figures for Russia are typical for fossil fuel producers. The majority of subsidies are production subsidies, as Russia is a major producer of oil and natural gas, as well as coal. We thus multiply the values with the share of domestic fuel use. The IEA also finds that natural gas prices in Russia are significantly below international market prices (IEA, 2021a). If we translate their subsidy estimates into a negative carbon price, the rate is again substantially higher than the value we calculate from the OECD Inventory data. Russia is also special since it does not raise any fuel taxes on fossil fuel consumption, and therefore also has no fuel-tax exemptions. This is why the OECD’s Inventory subsidy figure and our negative carbon price are very similar. The effect is that while Russia and Germany have similar per tCO2 OECD subsidy figures, we arrive at a negative country-average net carbon price of –€3.5 in Russia, while we report a national net carbon price of € 60.8/tCO2 for Germany.
Figure 3 also shows that the EU ETS is a major contributor to the effective carbon price incentives in the EU. The effect is especially notable for Poland, which otherwise has relatively low average fuel tax rates. Because Poland`s industry and electricity sector mainly use emission-intensive coal, the EU ETS increases average carbon prices by almost € 13/tCO2 across all sectors, making total net carbon prices for fossil fuel use in Poland higher than in Japan (€ 38 vs. € 30/tCO2). The average ETS effect is smaller in Germany and Sweden because the electricity and industrial sectors are responsible for a smaller share of national emissions. The regional ETS schemes also have a price impact in the US and China, but because of the relatively small share of U.S. countrywide emissions covered by ETS schemes and low permit prices in the Chinese regional schemes, the impact is much smaller.
In general, higher-income countries tend towards fuel tax subsidies while lower-income countries mostly use other types of subsidies which function like negative carbon prices. Furthermore, the effect of different subsidy definitions can be seen when comparing Sweden and Japan which have—as discussed above—very contrasting tax expenditure definitions. Finally, it is interesting to compare the share of consumer versus further subsidies in our negative carbon price. Further subsidies are most pronounced in Russia and Poland that both subsidize the production of fossil fuels. Germany, China, Japan, and the U.S. have small further subsidies of below €1/tCO2. Non-negligible consumer subsidies beyond tax exemptions covered through TEU data exist in China, the U.S., India and Germany. In the following, we focus on sectoral net carbon prices.
4.2 Sectoral results
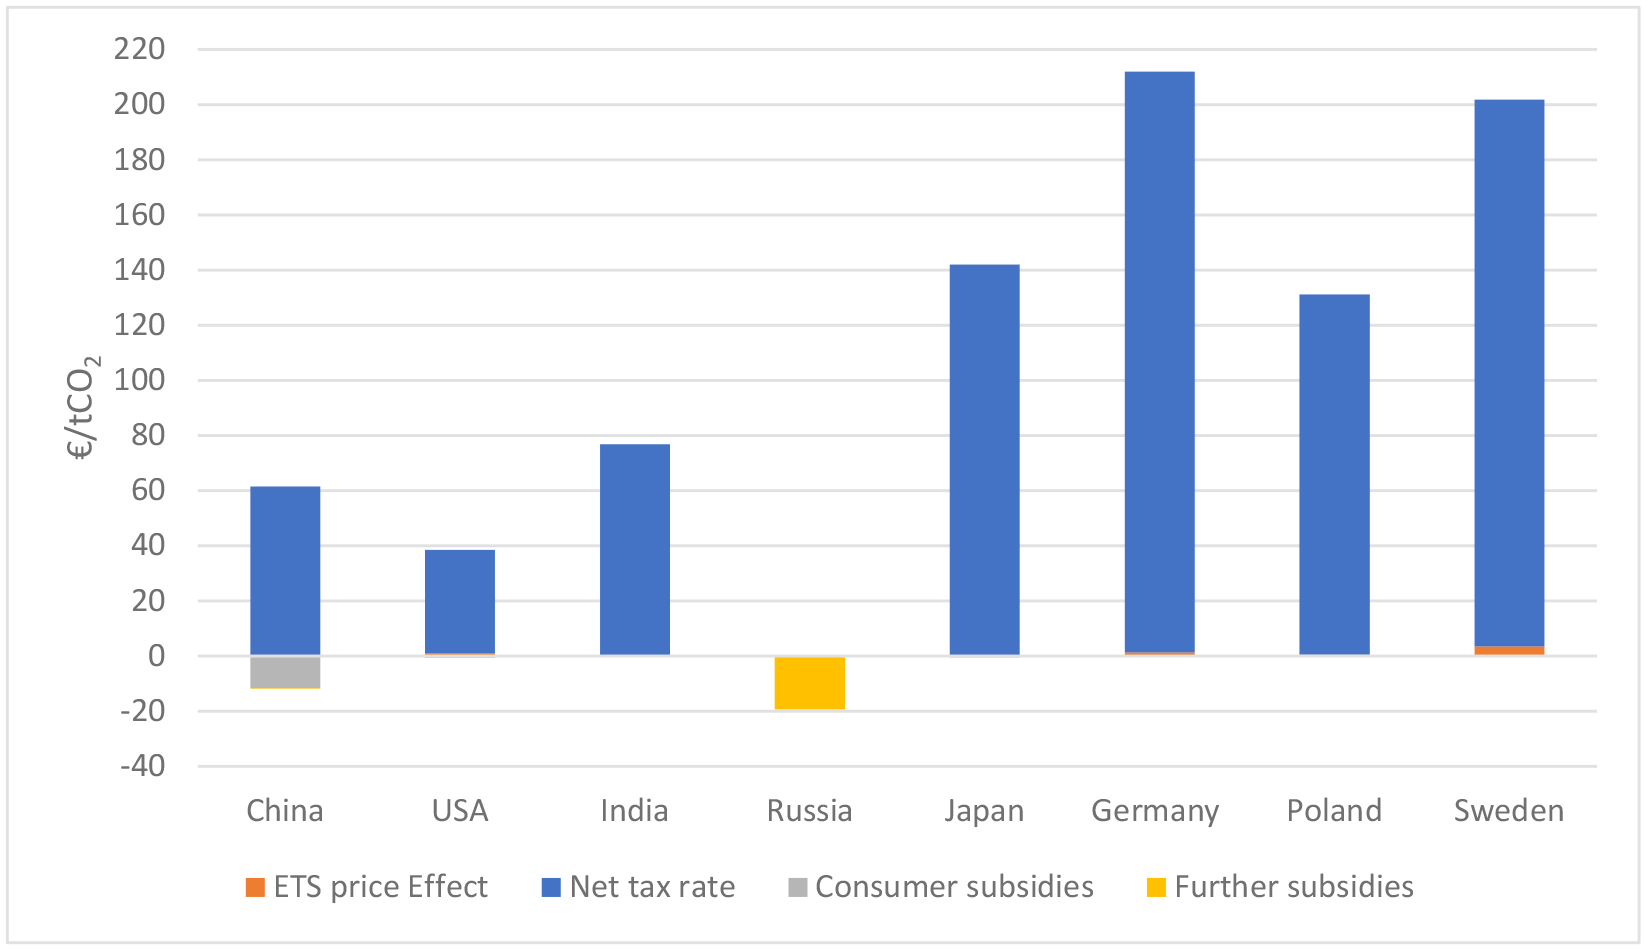
Net carbon prices for fossil fuels differ substantially between fuels and sectors. We present sector average net carbon prices for four sectors: transport, industry, residential and commercial, and electricity generation. Note again, that IEA data are not provided on a sectoral level.
In the transport sector (Figure 5), the net tax rates are even more dominating then on the country wide level and other net carbon price components almost become negligible compared to the net tax rate. Overall, the general trend of the countrywide overview carries over to the transport sector because fuel taxes are much higher than in other sectors and have a strong influence on the country-averages. This is the case even though transport emissions account for only 17% of total fossil fuel combustion related emissions for our country sample (see Table 6 in the Online Supplementary Material for an overview of sector emissions).
Notable outliers are the U.S. with a 34% share of combustion emissions in the transport sector and Sweden with 48%. The U.S. is an outlier because of high per-capita transport emissions, more than 2.5 times higher than the second highest per-capita transport emissions of Germany. Sweden has more typical per-capita emissions in the transport sector, but much lower emissions in other sectors owing to its substantial use of biomass and nuclear power. 5 The U.S. continues to be an outlier from the other higher-income countries in our analysis, with much lower taxation of fossil fuels used for transport of € 37/tCO2, lower than China and India with € 61/tCO2 and € 77/tCO2 respectively. Russia completely lacks fuel taxation. Combined with its production subsidies this leads to an overall negative net carbon price of € -19/tCO2. In the other high-income countries in our analysis, the transport sector average rate is significantly above € 100/tCO2, and around € 200/tCO2 for both Germany and Sweden. Poland, one of the only countries in the EU, sets both gasoline and diesel tax rates at the EU-mandated minimum rate (see EEA, 2019). Besides Russia, China is the only other country that has non-negligible further components besides the net tax rate, which are in this case further consumer subsidies mostly in the form of fuel price support programs, adding up to around € 12/tCO2.
Sector-average net carbon prices (2018)—Transport sector
(Own calculations)
A common feature that is not visible in Figure 5 is that diesel fuel is taxed at a lower rate than gasoline, usually at about two-thirds the tax rate per tCO2. The only exemptions in our analysis are the U.S.—where not all states tax gasoline higher then diesel (Federation of Tax Administrators 2022)– and obviously Russia.
The higher fuel tax rates for transport fuels compared with other sectors are partly justified to cover road infrastructure costs, although some countries like Germany have raised transport fuel taxes with explicitly environmental reasons (Steiner and Cludius, 2010). Also, Harding (2014) argues that diesel should be taxed higher than gasoline due to its higher carbon content and higher non-climate externalities like local air pollution. We do not account for any share of fuel taxes addressing non-CO2 externalities and attribute all fuel taxes to the climate externality by stating prices in terms of tCO2. Furthermore, any share of road fuel taxes addressing specific externalities is difficult to quantify. 6
Except for Russia and China, negative carbon prices are not present in the transport sector. For China, almost half of all OECD Inventory subsidies stem from a single consumption subsidy for diesel fuel, which compensates certain consumers—mostly taxi drivers and agricultural users—for a change from regulated prices to a more market-based approach that dates back to 2006 (although the new system still includes a price cap). For Russia, the large negative carbon price is due to an export duty on crude oil, which was particularly high in 2018 (Statista 2022). These negative prices are also captured in the IEA subsidy estimates for the whole country (see section 4.1).
ETS coverage in the transport sector is low, with California’s Cap and Trade (CaT) being the only scheme to cover most transport sector emissions. The EU ETS so far only covers the otherwise non-taxed aviation emissions, even though there is some discussion on extending the EU ETS to road and water transport.
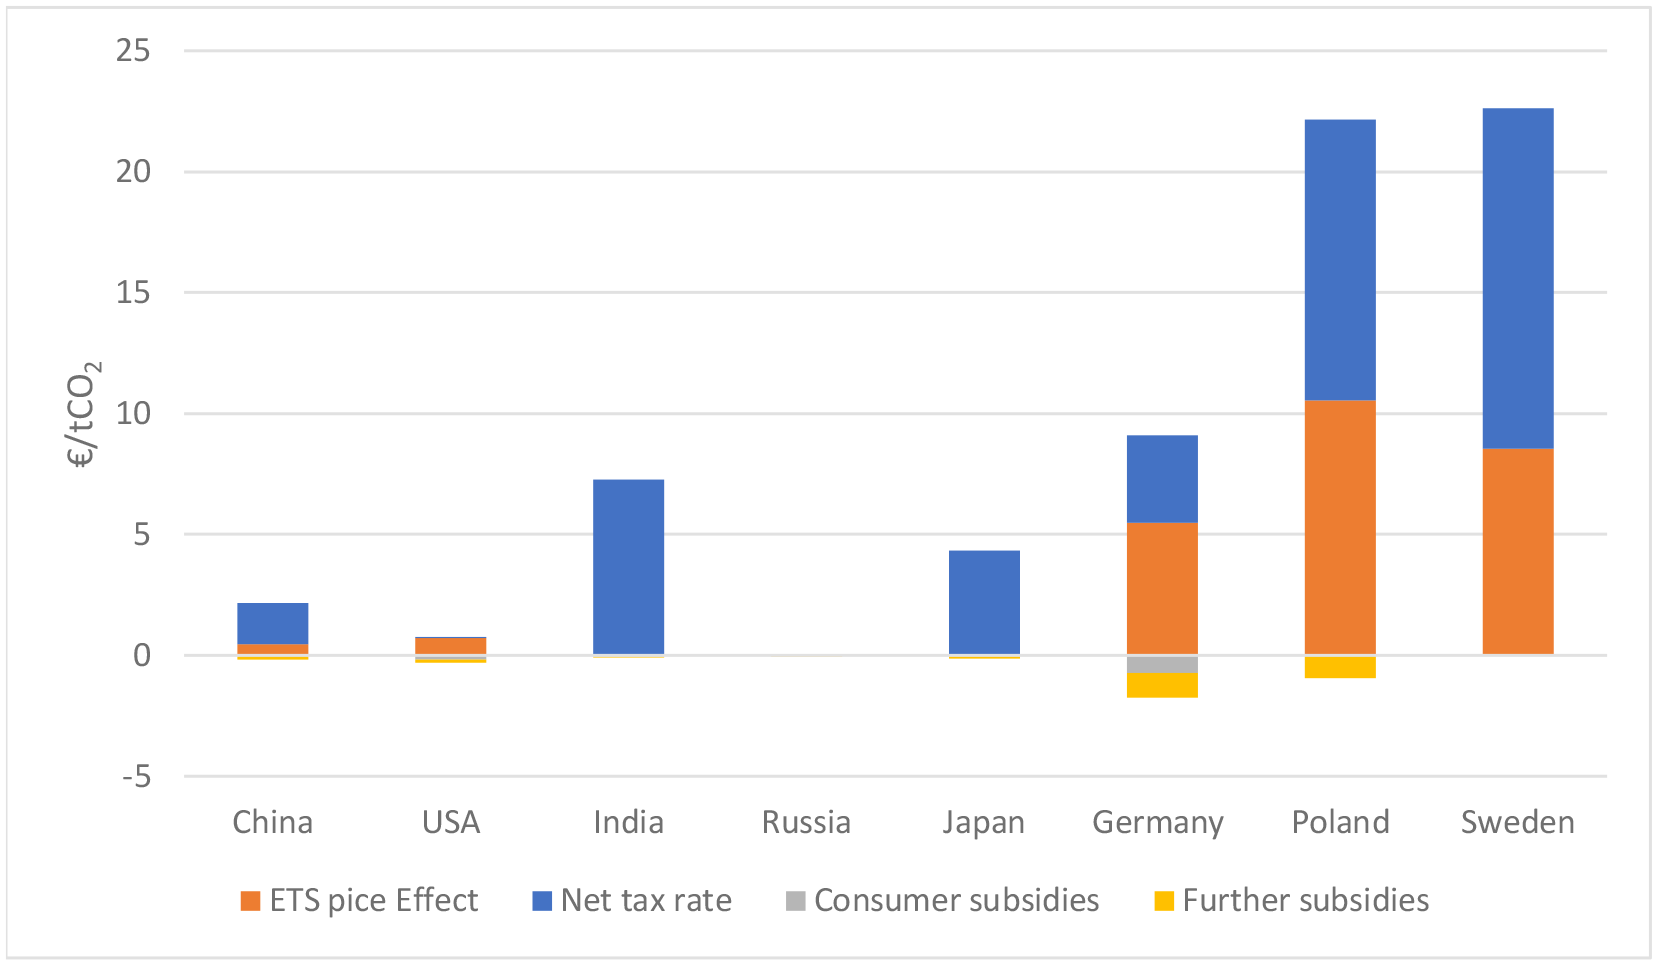
The industrial sector (Figure 6) is taxed much lower than transport in all countries in our analysis, while being responsible for the largest share of carbon emissions across our country sample (38% overall). One reason is most likely the fear of leakage effects and relocation of emission intensive industries to other countries which would reduce national value added and employment. The emissions in the industrial sector as a share of total emissions are highest in lower-income countries. Negative carbon prices stem mostly from further (production) subsidies and only to a minor degree from consumption subsidies.
While Sweden has the highest net carbon price, Sweden’s Industrial sector average rate of € 14/tCO2 is much lower than Sweden’s country average rate of € 106/tCO2. This rises to € 23/tCO2 when factoring in the EU ETS. Comparable sectoral differentials and low taxation in the industrial sector can also be observed for the other countries in our sample. Outside the transport sector, taxes on fossil fuels are mostly close to zero. Oil derivatives—mainly heating oil and Liquified Petroleum Gas (LPG)—tend to be taxed highest for industry use, while natural gas and especially coal are in countries other than Sweden most commonly not subject to a fuel tax at all and in some cases the fuels are subsidized.
Sector-average net carbon price (2018)—Industrial sector
(Own calculations)
Overall, more than half of all industrial-sector emissions from the combustion of fossil fuels derive from coal, followed by natural gas. At the same time, coal is the least taxed fuel across all sectors (in CO2 terms as well as per energy unit) but also the most carbon-intensive fuel per unit of energy, and generates larger amounts of pollutants, such as particulate matter, than other fossil fuels. The U.S. National Research Council (2010) estimates that for existing U.S. power plants, coal has non-climate negative externalities that are ca. 20 times higher than electricity production using natural gas.
Apart from heat generation, major uses of coal in the industrial sector include steel production and electricity generation. Electricity produced and consumed directly by industry is counted towards industrial sector consumption (see TEU 2019).
Most coal is mined domestically, and trade is mostly limited to higher quality hard coal used for example for coking. Negative carbon prices are mostly due to subsidies on domestically produced coal. In our country sample, only Japan and Sweden import all of their coal. Overall, fuel taxation is relatively low in the industrial sector and the EU ETS is the main driver of net carbon prices in the EU results, especially on coal. Since 2018 the EU ETS price has risen significantly reaching for some time even almost € 100/tCO2 and mostly staying above € 75/tCO2 since late 2021, which is 5 to 10 times higher than in the year of our analysis, and brings net carbon prices at least in Europe much closer to the prices in the transport sector.
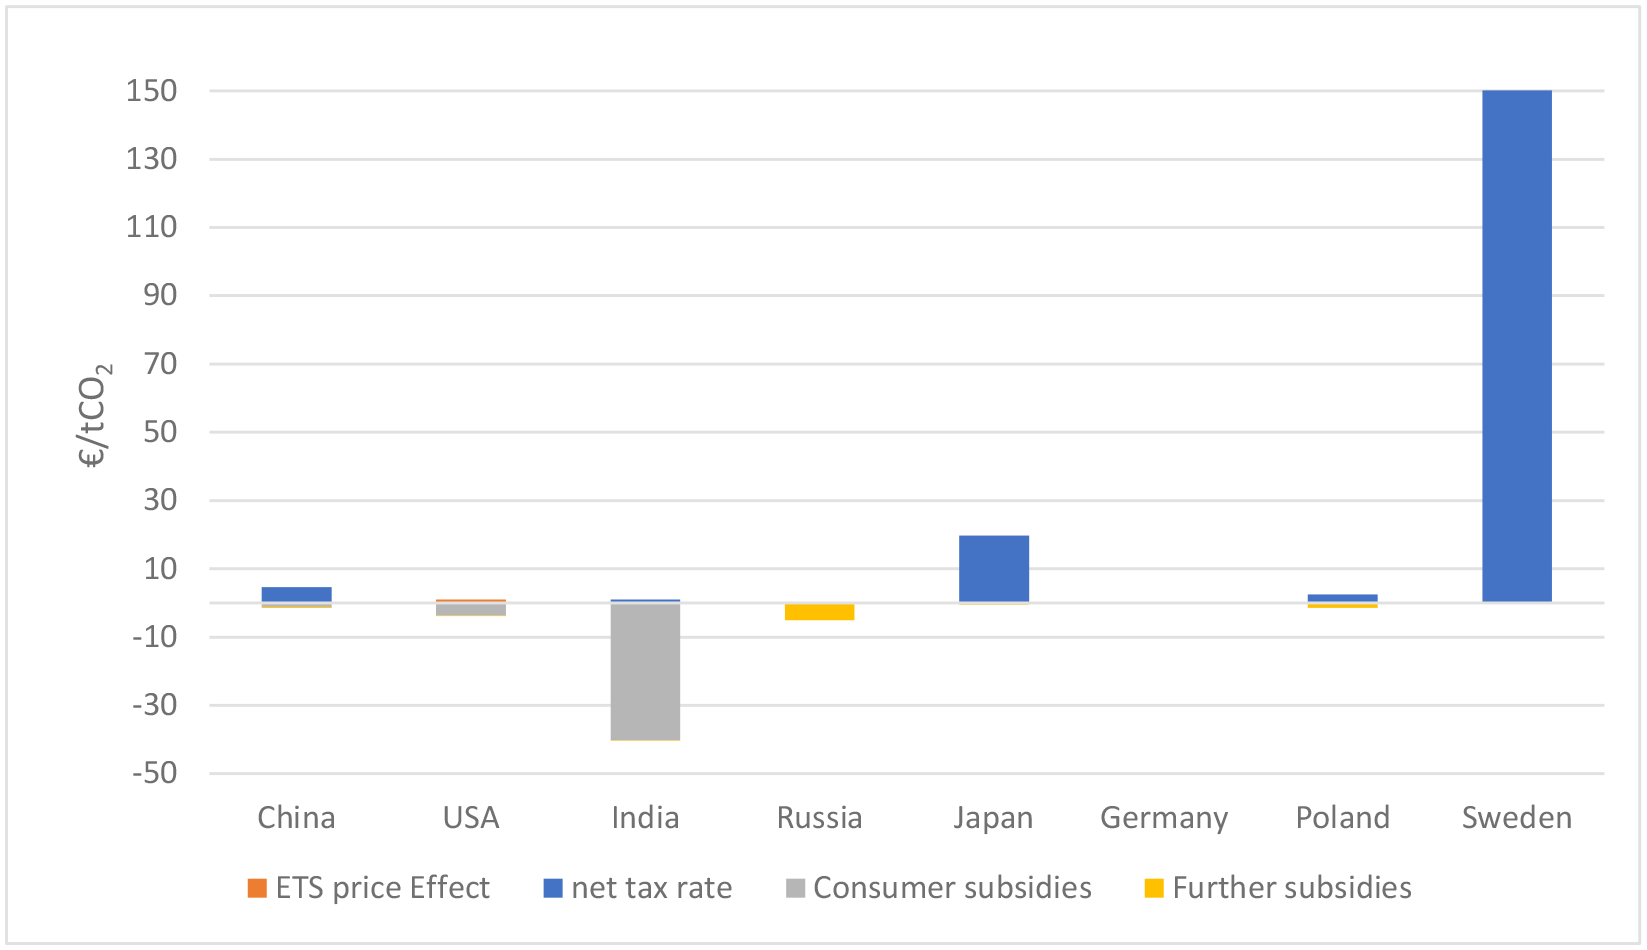
The residential and commercial sector (Figure 7) has the lowest emission share of the four sectors with 9% overall and a slightly higher share in higher-income countries. It is also responsible for significant electricity consumption, which is attributed to the electricity sector discussed below.
Sector average net carbon prices vary significantly among countries, with India and to some degree also Russia substantially subsidizing fossil fuels at € -40/tCO2 and € -5/tCO2 respectively, while Sweden is taxing them at an average of € 150/tCO2. California’s CaT scheme is the only ETS that covers household and commercial emissions, but the effect is outweighed by U.S. federal subsidies, resulting in a negative net carbon price of € -3.9 for the U.S. residential and commercial sector.
Sector-average net carbon price (2018)—Residential and commercial sector
(Own calculations)
The large negative net carbon price in India is due to the world’s largest direct transfer scheme, which benefits LPG used by low-income households and is administered by direct cash transfer (Mittal et al., 2017). The aim is to provide support to low-income households and to promote a shift from traditional biomass (wood, dung) to cleaner fuels, to reduce the negative health effects of indoor cooking (Sharma et al., 2019). As of 2018, biomass accounted for over 80% of energy use in the residential and commercial sector in India. India also subsidizes the price of Kerosene for the same reason.
In Russia, dual pricing leads to low domestic price for natural gas which are below world market prices (IEA, 2021a). In addition, the recorded OECD production subsidies partly benefit residential and commercial users of natural gas, which makes up the bulk of fossil fuel use in this sector. Russia is in this sector also again together with Poland the only country in our analysis where we see non-negligible further subsidies. In the U.S., the negative net carbon price results from a lack of federal excise taxes on fuels other than gasoline and diesel used for road transport, and fuels used in aviation, along with federal and state-level heating aid to help low-income households pay the costs of heating and air-conditioning in their homes, and the exemptions of heating fuels from sales taxes by many states. China also has small subsidies for home heating in colder regions, but low positive net tax rates on heating oil and LPG lead to an overall positive sector-average rate. Poland does not report subsidies for the residential and commercial sector, and as (untaxed) coal is the most common fuel used for home heating, the average sector rate is relatively low at below € 2/tCO2.
Germany and Japan tax residential and commercial fossil fuel use at a moderate rate, while Sweden’s taxation is comparatively very high. Sweden also has a large usage share of woody biomass in the sector (IRENA, 2019).
Sector-average net carbon price (2018)—Electricity sector
(Own calculations)
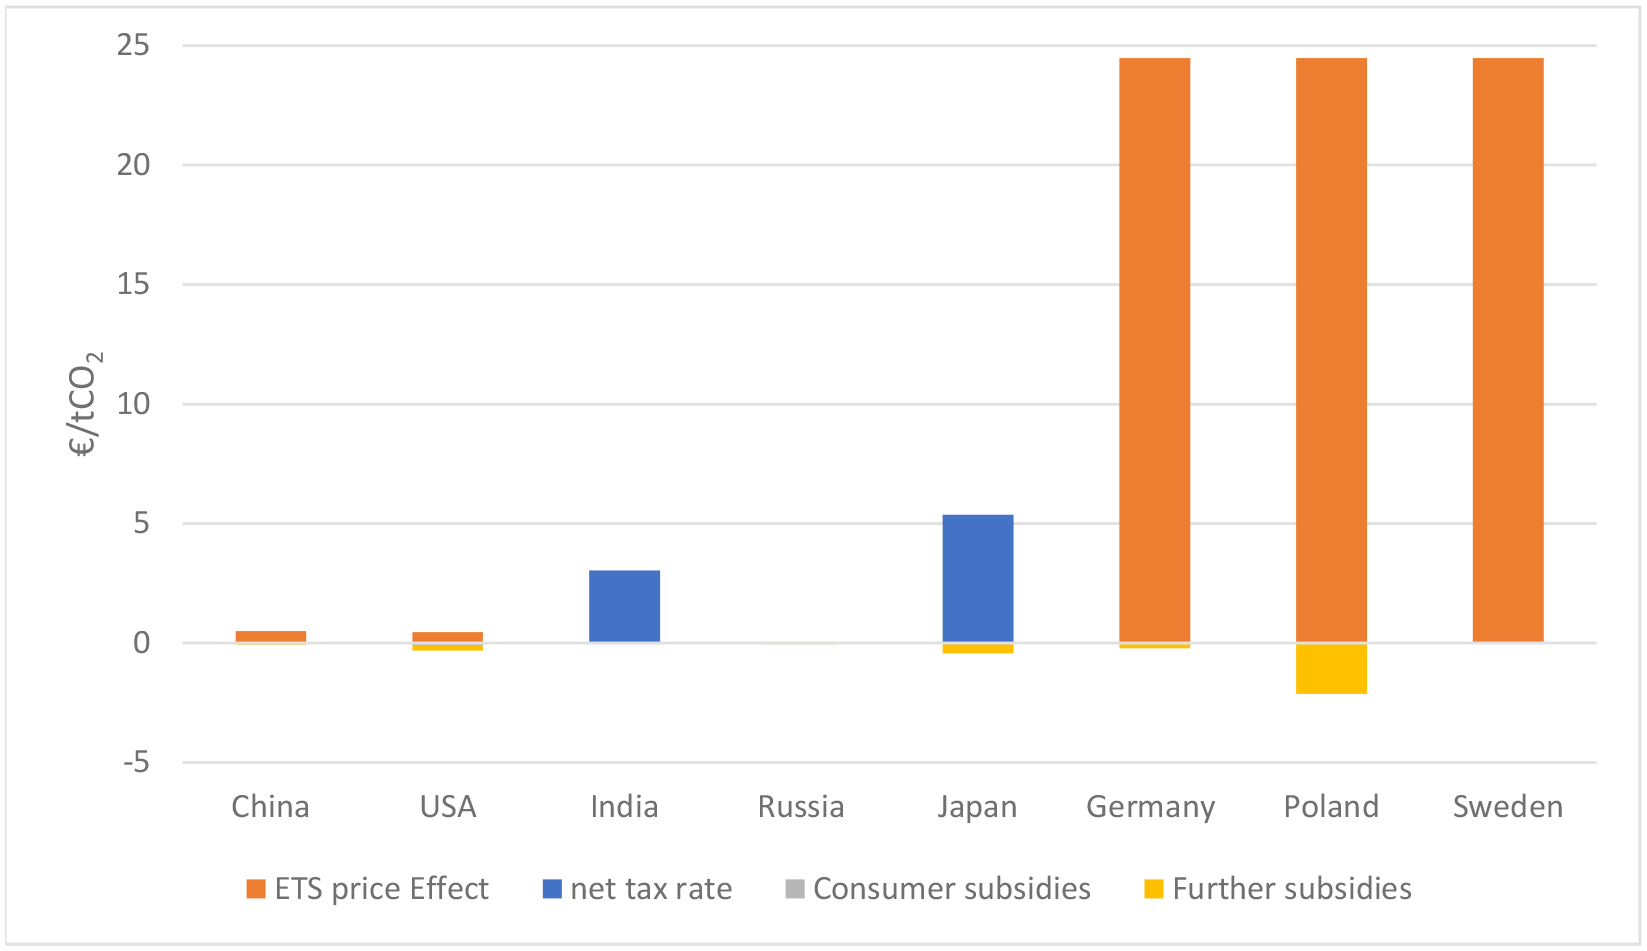
The electricity sector (Figure 8) has the second highest emissions share (37% overall and a very similar share in most countries). It also has the highest share of emissions from coal (84% of total sector emissions). This is notable, because the electricity sector is generally considered especially important for decarbonization efforts, by facilitating electrification in other sectors.
Fuel taxation in the electricity sector is uniformly low or zero. While there is almost no fuel tax levied on any fuel used for electricity production, the electricity produced is usually subject to an electricity tax. Any fuel taxes that would otherwise apply to the fossil fuel inputs are usually waived to avoid double taxation—with the output taxed instead. These high electricity taxes are often seen as a major impediment to the electricity-based decarbonization of e.g. heating and transport and it would make more sense to apply differentiated taxes on electricity fuel inputs rather than on electricity itself.
The only price effect of more than € 5/tCO2 in the electricity sector in our analysis comes from the EU ETS. As it covers virtually all electricity sector emissions, the ETS price effect is the same for the EU-countries at the 2018 permit price level of € 24/tCO2. The negative carbon tax rates displayed above are all due to subsidies on domestically mined coal.
5. Conclusions
Reducing fossil fuel subsidies is broadly seen as an important step towards more efficient climate policy. This is often justified by high numbers of reported subsidies. Yet, what is relevant are the resulting price incentives for the use of fossil fuels. Since existing approaches to measure fossil fuel subsidies were created for other purposes, we design a new indicator, net carbon prices, to measure carbon related fossil fuel price incentives. Net carbon prices summarize the net effect of different governmental price interventions and have five useful features:
They can be calculated not only for those with fossil fuel prices below world market levels and allow for cross-country comparisons.
They include all fuel tax differentiation, because the basis are the individual fuel tax rates and the consumption of the respective fuels.
Increases in fuel taxation lead to a corresponding increase in net carbon prices, because different fuel tax rates are measured individually without the need for benchmark rates
Countries with higher taxation level will always report higher net carbon prices—unless the fuel taxation is counteracted by other, non-fuel tax related subsidies
They can be calculated on different level of aggregation and in particular on a sectoral level, which is very helpful for policy reforms.
The IEA estimates are only available for countries where fossil fuels are priced below world market prices. The OECD’s Inventory uses data from national documents and reports, which were not created to measure climate policy incentives, but mainly to assess budget implications of specific policy and taxing decisions. Especially in high-income-countries, the largest share of subsidies are tax reductions which depend on full tax rates and therefore high subsidy figures correspond to high effective taxation. We illustrated this comparing Sweden to the U.S.: per tonne of CO2 subsidies for Sweden measured using the OECD Inventory are 35 times higher than those of the U.S., while the net carbon price in Sweden is more than seven times higher than in the U.S. The TEU data and more recently the OECD effective carbon tax rates already combine the first three features but do not capture all types of relevant subsidies or still use some benchmark prices.
The role of tax exemptions in fossil fuel subsidies (at least in high-income countries) which fail to put focus on the most underpriced fuel usage, also puts a new angle to the discussion about phasing out fossil fuel subsidies. In our view, the G20 should put a stronger focus on a joint minimum effective carbon price, instead of mainly focusing on phasing out inefficient fossil fuel subsidies. Such an effective carbon price could also play an important role in international climate negotiations. For example, Cramton et al. (2017) argue that the current pledge-and-review structure as part of the Paris Agreement inhibits cooperation. One proposed solution e.g. in the seminal papers on “climate clubs” by Nordhaus (2015) and Weitzmann (2017) is a common minimum carbon-price commitment. Such a simpler “single focal point” might help address the externality problem of climate negotiations by introducing a common commitment instead of many individual commitments. A net carbon price as proposed in this paper could be a helpful step to track such commitments. For efficient minimum carbon pricing, existing energy taxation should be accounted for, as well as subsidization. Net carbon prices would for example highlight if a country introduces an agreed carbon tax on fossil fuel use of € 100/tCO2, but then reimburses users through another measure.
Another implication of our analysis is that subsidy data should not be used as the only source to argue for specific fuel price reforms. Reforms that consider only fuel-tax exemptions would likely be inefficient, as low taxed fuels would not be considered. These should instead be a focus of price reform to facilitate efficient abatement. Also, phasing out tax exemptions from excise taxes or VAT on fuels, while raising the average carbon price in a country, could still leave in place inefficient differences in taxation rules between fuels.
Our illustrative analysis shows again large differences in net carbon prices across sectors. There is thus a large potential for efficiency gains through harmonized taxation and carbon pricing. We can e.g. see that in many countries in our analysis there is especially scope for higher carbon prices in the residential and commercial sector and surprisingly also in the electricity sector. Our findings thus reiterate the need for an accompanying energy price reform especially in high-income countries which has been stressed for example by Agora Energiewende (2017) for Germany. In the EU a revision of the Energy Taxing Directive is part of the policy reforms to deliver on the targets of the European Green Deal. According to the EU Commission (2020) this includes realigning the taxation of energy products and rationalizing the use of optional tax exemptions and reductions. Our sectorally differentiated analysis that can be generated on a fuel level as well can be helpful in this respect and inform countries about where effective carbon prices could be harmonized.
In summary, there are two main contributions of the paper. The first is to develop a new “net carbon price” indicator that complements existing subsidy and carbon pricing indicators such as the IEA and IMF price gap data and the OECD’s Inventory of Support Measures for Fossil Fuels (all three related to fossil fuels subsidies) as well as the OECD net and effective carbon tax rates and the World Banks’ carbon pricing dashboard all related to carbon pricing. This indicator can be calculated on different aggregation levels (sectoral level, fuel level, country level) and compared across countries. The second contribution is our illustrative analysis for eight selected countries, among them the top six global emitters. It shows the different components of effective carbon pricing (carbon and fuel taxation, subsidies, emission allowances) and how resulting net carbon prices differ both across countries and across sectors within countries. This delivers important information both for national reforms of energy taxation, energy subsidization and carbon pricing as well as for international climate negotiations on comparable efforts.
There are also some limitations related to our proposed indicator and our analysis and scope for future research. First, it needs to be noted that while the indicator is on purpose independent of benchmark prices, this also implies that it does not give policy makers an indication how far the net carbon prices of their country are from an “appropriate” level, though e.g. the estimated carbon prices of the High-Level Commission of Carbon Prices (2017) can give an indication. Second, for an indicator to be widely acceptable, its needs to be simple, replicable, and readily available for a large set of countries and in a timely and regular manner. Though we tried to keep the classification of subsidies as simple as possible, relying as far as possible on existing classifications, our net carbon price measure involves making some judgments on including or excluding subsidies from the OECD Inventory. Further, its current applicability is limited to the around 50 countries for which OECD Inventory and TEU data are available. Related to this, a worthwhile endeavor that is beyond the scope of this study that only provides data for one year and six countries would be to calculate the different components of net carbon prices and resulting overall carbon price incentives for a broader set of years and countries and to analyze these data in more detail. Ideally such evolution of subsidy and tax measurement and also a more standardized classification of subsidies to be included in a net carbon price would take place at the OECD, as they already provide data on all major price factors for fossil fuels, although with differing formats, reporting standards and detail. Alternatively, if the OECD shared net fuel tax data at an individual fuel level it would make very detailed intra- as well as inter-country comparisons possible. In this context it might also be useful to differentiate in the net tax measure between direct CO2-taxes and general fuel taxes to get a full picture of direct and indirect carbon price incentives.
Furthermore, while our net carbon price adds some further carbon pricing equivalents to direct carbon prices and indirect carbon prices via energy taxes, one could go beyond this and try to calculate carbon price equivalents of further regulations that also impact the marginal incentive to consume or produce fossil fuels. This relates to the ongoing discussions e.g. in the G7 of creating “climate clubs” and there is related work e.g. by the OECD to assess the equivalency of different mitigation methods. A broad and encompassing calculation of effective carbon pricing would thus provide important information related to the measurement of national climate policy stringency and could potentially become a measure to define minimum carbon prices in the context of international climate negotiations.
Supplemental Material
sj-pdf-1-enj-10.5547_01956574241277304 – Supplemental material for Fossil Fuel Subsidy Inventories vs. Net Carbon Prices
Supplemental material, sj-pdf-1-enj-10.5547_01956574241277304 for Fossil Fuel Subsidy Inventories vs. Net Carbon Prices by Jens Böhm and Sonja Peterson in The Energy Journal
Supplemental Material
sj-pdf-2-enj-10.5547_01956574241277304 – Supplemental material for Fossil Fuel Subsidy Inventories vs. Net Carbon Prices
Supplemental material, sj-pdf-2-enj-10.5547_01956574241277304 for Fossil Fuel Subsidy Inventories vs. Net Carbon Prices by Jens Böhm and Sonja Peterson in The Energy Journal
Footnotes
1.
2.
While this approach is not stated explicitly in the companion guide to the OECD Inventory (OECD, 2018), this was evident when we replicated the results in our own calculation of German net fuel tax rates and negative carbon prices from primary sources. This is discussed in more detail in the ![]() .
.
3.
For example, all transport sector fuel tax rates are compared with the tax rate on gasoline, and subsidization is therefore reported on diesel fuel as well as other fuels. For fuels used for heating, this measuring approach actually led to a harmonization of tax rates, with all rates being raised to the per joule rate of heating oil (Swedish Ministry of Finance, 2019).
4.
Note that Germany provided significant payments to cover the losses of coal mines until the end of 2018. Yet, since this does not affect domestic incentive to use coal but only replaces otherwise imported coal with domestic coal this subsidy is not identified as relevant for our negative carbon price (see ![]() ).
).
5.
Sweden has one of the lowest per capita emissions of any high-income country with 4.47 tCO2/capita in 2018 (EDGAR database 2020). For our country sample, only India has lower per capita emissions of 1.94 tCO2/capita. This mostly affects the non-transport sectors in Sweden, see OECD TEU (2019) Annex 3.A for an overview of biofuel use per sector.
6.
An exceptional example where such a share is stated is the Federal Highway Trust fund in the US, which receives all revenues raised by the federal excise taxes on fuels used by motorized vehicles that are allowed to use the nation’s highways (FHWA, 2017). Also, see ![]() , p. 25) for an estimate of the share of road financing in fuel taxes for Germany.
, p. 25) for an estimate of the share of road financing in fuel taxes for Germany.
References
Supplementary Material
Please find the following supplemental material available below.
For Open Access articles published under a Creative Commons License, all supplemental material carries the same license as the article it is associated with.
For non-Open Access articles published, all supplemental material carries a non-exclusive license, and permission requests for re-use of supplemental material or any part of supplemental material shall be sent directly to the copyright owner as specified in the copyright notice associated with the article.