
Abstract
Introduction:
Midlife women in perimenopause and postmenopause experience a complex array of symptoms. However, there is conflicting evidence on how their symptom experiences differ by menopausal stage. Current studies have not examined the interconnected relationship among menopausal symptoms and understood how this relationship may differ based on the menopausal stage.
Methods:
This is a secondary data analysis using cross-sectional data (visit 5) from the Study of Women’s Health Across the Nation. Network analysis was used to visualize the network structure and to identify key symptoms. Then, a network comparison test was conducted to compare the symptom network properties. Propensity score matching was used to match participants in terms of their covariates.
Results:
In midlife women in perimenopause, frequent mood change was the key symptom with the highest strength (1.59), closeness (1.27), and expected influence (1.62). In midlife women in postmenopause, anxiety was the key symptom with the highest closeness (0.95) and expected influence (1.48). The symptom networks were not significantly different between the 2 groups in terms of global strength (global strength = 0.01, P = .974), network structure (network structure = 0.10, P = .461), and specific centrality measure (centrality = −0.10, P = .083). While the symptom networks were not invariant, the key symptoms were different between the 2 groups.
Conclusion:
Our study findings indicate a potential need for different symptom management approaches for midlife women in perimenopause and postmenopause. With this new knowledge, clinicians should offer targeted key symptom assessment and management.
With aging, midlife women enter into perimenopause and postmenopause. 1 Herein, the female reproductive life course is broadly classified into 3 main stages that include premenopause, perimenopause, and postmenopause. 1 Premenopause refers to a period of regular menstrual cycles with no change in cycle regularity or length. 2 Perimenopause is a period of time when a woman has irregular menstrual cycles or skips a menstrual cycle.2,3 Postmenopause is a period of time when a woman has not had a menstrual cycle for more than 12 months in a row.2,3 When comparing these 3 stages, midlife women in perimenopause and postmenopause typically experience more complex symptoms than those in premenopause. 4 This complex symptomatology is largely attributed to hormonal fluctuations, specifically an increase in follicle-stimulating hormone (FSH) and a decrease in estrogen and progesterone levels which start during premenopause and persist through postmenopause. 3 These hormonal changes can lead to a range of physical and psychological symptoms, significantly impacting the quality of life for women in these later stages. 3 For example, women may experience a wide spectrum of physical symptoms, including hot flashes, night sweats, and weight gain, in addition to psychological symptoms such as mood swings, anxiety, and depression.5,6 This combination presents a multifaceted challenge for women in perimenopause and postmenopause, particularly in contrast to those in premenopause, who do not experience the same degree of hormonal fluctuations.5,6 Despite the prevalence of midlife women experiencing perimenopause and postmenopause, there exists a substantial gap in our understanding of the specific symptomatology linked to these distinct stages. Most existing research tends to focus either exclusively on 1 stage or combines both stages, often overlooking the potential differences in symptoms that may arise during each phase.6,7 Understanding the differences in symptom profiles could be crucial for clinicians in developing effective management strategies that address the unique challenges faced by women in these distinct menopausal stages.
To date, much of the existing research has primarily focused on comparing the prevalence and intensity of symptoms across various menopausal stages.8,9 For instance, a recent cross-sectional study indicated that postmenopausal women experience more severe urinary symptoms than their perimenopausal counterparts, while perimenopausal women report a higher frequency of somatic and psychological symptoms. 9 A longitudinal study has focused on specific symptoms, such as depressive symptoms, and their variations throughout the menopausal transition without taking into account other symptoms. 10 As a result, there has been a notable lack of investigation into the specific differences in symptomatology between perimenopause and postmenopause. 11 This gap in the literature regarding the distinct variations in symptom experiences constrains our understanding of the unique challenges that women encounter during each phase. Thus, there is a compelling need for more targeted studies that thoroughly examine these differences, thereby enhancing our knowledge and informing better support and interventions for women navigating these transitional periods.
Traditional statistical methodologies such as regression models have been widely used to examine the relationship between symptoms and menopausal stage in midlife women.12,13 While they offer important findings, these methodologies may not suitable for examining the complex patterns of symptom interactions and understanding how this interconnected relationship may differ based on the menopausal stage. 12 To fill this gap, network analysis may address the shortcomings of more traditional methods. First, network analysis provides a strong methodological approach to investigate and understand the interconnected relationship among various menopausal symptoms.14,15 A recent study utilizing network analysis highlighted the interconnectedness of symptoms, revealing significant positive associations among psychological symptoms such as depression, anxiety, forgetfulness, and frequent mood changes, as well as a notable positive relationship between forgetfulness and sexual disturbances. 15 In other words, this approach facilitates the exploration of how different symptoms interact with one another, allowing for a deeper understanding of their collective impact on women’s health during the menopausal transition. By mapping these relationships visually, network analysis makes it possible to identify not only individual symptoms but also how they may influence each other, thereby revealing patterns that traditional statistical methods may overlook.12,16 Second, it provides an expected influence index that identifies core symptoms within each symptom network, which might be critical for understanding the symptom differences based on menopausal stage.12,14,17 Third, some properties of network models such as network structure can be further compared through the use of network comparison tests. Currently, there is only 1 study that used network analysis to compare the number and types of core symptoms and symptom clusters experienced by midlife menopausal women with and without metabolic syndrome. 15 However, this study examined midlife women in menopause transition together and assumed their symptom experience to be similar for both groups. 15
The purpose of this current exploratory study was to examine and compare the symptom network structure and core symptoms between midlife women in perimenopause and postmenopause through the use of network analysis. Then, a network comparison test was conducted to compare the network properties of perimenopause and postmenopause symptom networks. Previous research has shown that covariates such as age, current perception of health, and body mass index are associated with symptoms among midlife women.18,19
Methods
Design and Data Collection
This is a secondary data analysis using cross-sectional visit 5 data from the Study of Women’s Health Across the Nation (SWAN). Among all available annual visits from baseline (1996-1997) to visit 10 (2006-2008), visit 5 (2001-2003) was selected to obtain a greater number of midlife women in perimenopause and postmenopause.
Description of the Dataset
SWAN is a community-based study that examines the overall health of midlife women in multiple racial and ethnic groups across the United States. The aim of SWAN is to understand how the physical, biological, psychological, and social changes during midlife and menopausal transition affect the overall health in midlife women. At baseline, a total of 3302 participants met the SWAN study eligibility criteria and were enrolled into the study. The eligibility criteria at baseline were (1) women aged between 42 to 52 years, (2) having an intact uterus and at least 1 ovary, (3) have had a menstrual period in the past 3 months, (4) not taking any hormones, and (5) identify as one of each study site’s designated race/ethnic groups. These participants were followed-up annually, with the most recent visit in 2016. More details can be found elsewhere. 20
Participants
The inclusion criteria for the perimenopause group were (1) midlife women aged 40 to 65 years and (2) self-report to be in early or late perimenopause. A total of 1719 participants met the inclusion criteria for the perimenopause group. The inclusion criteria for the postmenopause group were (1) midlife women aged 40 to 65 years and (2) self-report to be in postmenopause. A total of 898 participants met the inclusion criteria for the postmenopause group. We excluded data with any missing values within variables of interest (eg, covariates for propensity score matching analysis), which was less than 5% of the total sample. In total, our study had 2617 participants who reported to be in either perimenopause or postmenopause.
Measures
Demographic and clinical characteristics
Demographic and clinical characteristics were obtained mostly from self-report using the SWAN-designed questionnaire. Demographic characteristics included age, race and ethnicity, marital status, level of education, annual household income, employment status, and social support. Herein, social support was measured on a 5-point Likert scale using 4 items from the Medical Outcome Study (MOS) Social Support Survey 21 with Cronbach’s alpha of >0.70, and the total score has been categorized into 0 (no social support) to 2 (frequent social support). 22 Clinical characteristics included overall perception of health and body mass index (BMI). Participants’ overall perception of health was measured using a single question from the MOS Short Form-36 that has a Cronbach’s alpha of 0.85 as a part of the Medical Outcome Study with 5 response categories.22,23 BMI was calculated using the height and weight that were measured during each visit using standardized study protocols. 24
Menopausal stage
Menopausal stage was collected based on participants’ self-reported menstrual bleeding patterns. Perimenopause was defined as having a menstrual period in the past 3 months with change in menstrual cycle regularity in the past 12 months or no menstrual period in the past 3 months with intermittent menstrual bleeding within the past 12 months. Postmenopause refers to having no menstrual period in the past 12 consecutive months.2,3
Symptoms
The severity of each symptom was measured as 0 (none), 1 (mild), 2 (moderate), or 3 (severe). First, symptoms with a prevalence less than 20%, such as cold sweat and urinary urgency, were excluded to increase the clinical significance of our study findings as recommended by previous researchers. 25 As a result, a total of 14 symptoms were selected based on the literature and symptoms studied in the SWAN study. The final set of included symptoms were frequent mood change, anxiety, depression, headache, forgetfulness, trouble sleeping, night sweats, hot flashes, decreased sexual desire, decreased sexual arousal, decreased sexual satisfaction, vaginal dryness, getting up from sleep to urinate, and stiffness.
Depression was measured using the Center for Epidemiological Studies of Depression (CES-D) scale, which has shown to be a reliable and valid tool among midlife US adults26,27 with a Cronbach’s alpha of 0.90. Anxiety was measured using the menopause symptom questionnaire that asked the frequency of 4 anxiety symptoms experienced in the past 2 weeks (irritability, nervousness, feeling fearful, and heart pounding). Each anxiety symptom was coded from 0 (none) to 4 (daily), and the sum score for all anxiety symptoms was derived. Then the average was used as a composite score as recommended in previous literature, which has shown a good convergent validity with the Generalized Anxiety Disorder scale.28,29 Other symptoms were measured from self-report using the SWAN-designed questionnaire that asked about the frequency of each symptom experienced in the past 2 weeks.
Data Analysis
Propensity score matching
Midlife perimenopausal women (n = 1719) were statistically matched with midlife postmenopausal women (n = 898) using propensity score matching in terms of their covariates with ratio of 1:1, which resulted in 898 women in each group. Propensity score matching was used to match participants with menopausal status as a dependent variable and covariates such as age, race/ethnicity, marital status, level of education, annual income, employment status, social support, overall perceived health, and BMI as independent variables. Using the R-package MatchIt, the propensity scores were calculated with logistic regression and matching was performed using the nearest neighbor matching algorithm. Then, the covariate balance was assessed before and after propensity score matching using χ2 tests for categorical variables and independent t-tests for continuous variables to ensure that the propensity score matching had worked.
Network analysis
The symptom networks were constructed using the propensity score matched midlife perimenopausal and postmenopausal women. The following steps for network analysis were followed: (1) network assessment, (2) network accuracy and stability, and (3) network comparison. R statistical software version 3.6.2 (R Foundation for Statistical Computing, Vienna, Austria) was used to conduct the network analysis.
Network assessment
The q-graph in R-package was used to create partial correlations for both groups. To estimate the network, the graphical least absolute shrinkage and selection operator (LASSO) algorithm with extended Bayesian information criteria (EBIC) was used with a recommended gamma (γ) value of 0.25. This method was selected to minimize the number of spurious edges and potential issues of over-fitting and unstable estimates. 12 LASSO has been recommended for its flexibility in terms of noncontinuous data and low likelihood of false positive edges and the selected EBIC helps enhance the accuracy and interpretability of the constructed networks. 12
Within the constructed network, nodes represent symptoms and edges represent the relationship between the symptoms independent of other nodes. 14 A blue edge represents a positive relationship and a red edge represents a negative relationship between the 2 nodes. 14 In addition, the strength of the relationship is indicated by the width of each edge. 14 A thick edge indicates a strong relationship and a thin edge indicates a weak relationship between the 2 nodes. 14 To estimate the importance of each node within the network, 3 centrality measures of strength, betweenness, and closeness were estimated. 12 Strength measures how strongly a node is connected to other nodes based on the sum of weighted number and strength of all connections of this specific node in relation to other nodes. 12 Betweenness indicates the number of times that a node is in the shortest pathway between other nodes. 12 Closeness measures the average distance of a specific node to other nodes in the network. 12 Typically, nodes with high centrality values are considered to be core symptoms within each network, but only when there are positive relationships among the nodes. 12 When there is a combination of positive and negative relationships, these centrality indices do not adequately assess the nature and strength of a node within the network. In this case, expected influence index is often used to consider the presence of negative relationships among the nodes. 17
Network accuracy and stability
After the network assessment, network accuracy and stability were examined using the R-package bootnet. We calculated a 95% confidence interval to estimate the accuracy of edge weights. As confidence interval requires prior knowledge on the sampling estimation, which is often difficult to have, we conducted the nonparametric bootstrapping method (1500 bootstrap iterations) to repeatedly estimate the model to obtain the required statistics. Then, we conducted a case-drop bootstrapping method to estimate the correlation stability coefficient (Cs-coefficient) to quantify the stability of centrality indices. While there is no specific cut-off value for Cs-coefficient, researchers recommend a minimum value of 0.25 and preferably over 0.50. Finally, we conducted bootstrapped difference test with α = .05 based on 1500 bootstrap iterations to test for statistical significance between 2 node strengths or edge weights.
Network comparison
The R-package NetworkComparisonTest (NCT) was used to compare the symptom network properties between midlife women in perimenopause and postmenopause. The NCT is a permutation-based hypothesis test that allows for a direct comparison of 2 symptom networks through testing for differences in their network structure 1000 times repeatedly. It tests on 4 invariance hypotheses that include (1) global strength (S), (2) network structure, (3) one-to-one edge strength, and (4) specific centrality measure. The global strength invariance hypothesis assumes the overall connectivity to be identical across subpopulations. The network structure invariance hypothesis assumes the structure to be completely identical across subpopulations. The one-to-one edge strength invariance hypothesis assumes a specific edge to be identical across subpopulations. Last, the specific centrality measure assumes that the 2 networks are not different in strength centrality measure. 30
Results
Sample Characteristics
The mean (±SD) age of midlife women in perimenopause was 51.7 ± 2.1 years, while the mean age of midlife women in postmenopause was 52.7 ± 2.5 years. The difference between the mean age between midlife women in perimenopause and postmenopause was still found to be significant (P < .001). However, the differences in other demographic and clinical characteristics were no longer statistically significant after propensity score matching. Refer to Table 1 for further details.
Demographic Characteristics Before and After PSM.

Abbreviations: PSM: propensity score matching; SD: standard deviation.
Network Assessment
Figure 1 visualizes the symptom network structure for midlife women in perimenopause and postmenopause, respectively. In both networks, a strong relationship was found between anxiety-frequent mood change, night sweat-hot flash, depression-anxiety, decreased sexual satisfaction-decreased sexual arousal, and decreased sexual desire-decreased sexual arousal. In addition, a negative relationship was noted in both groups between vaginal dryness-forgetfulness and stiffness-night sweat. The strength of the relationship was stronger for most of the symptoms for midlife women in perimenopause. In the symptom network for midlife women in perimenopause, a negative relationship was found between stiffness-night sweat, vaginal dryness-forgetfulness, and hot flash-forgetfulness. On the other hand, for midlife women in postmenopause, a negative relationship was found between vaginal dryness-decreased sexual desire, frequent mood change-decreased sexual arousal, and decreased sexual desire-forgetfulness.
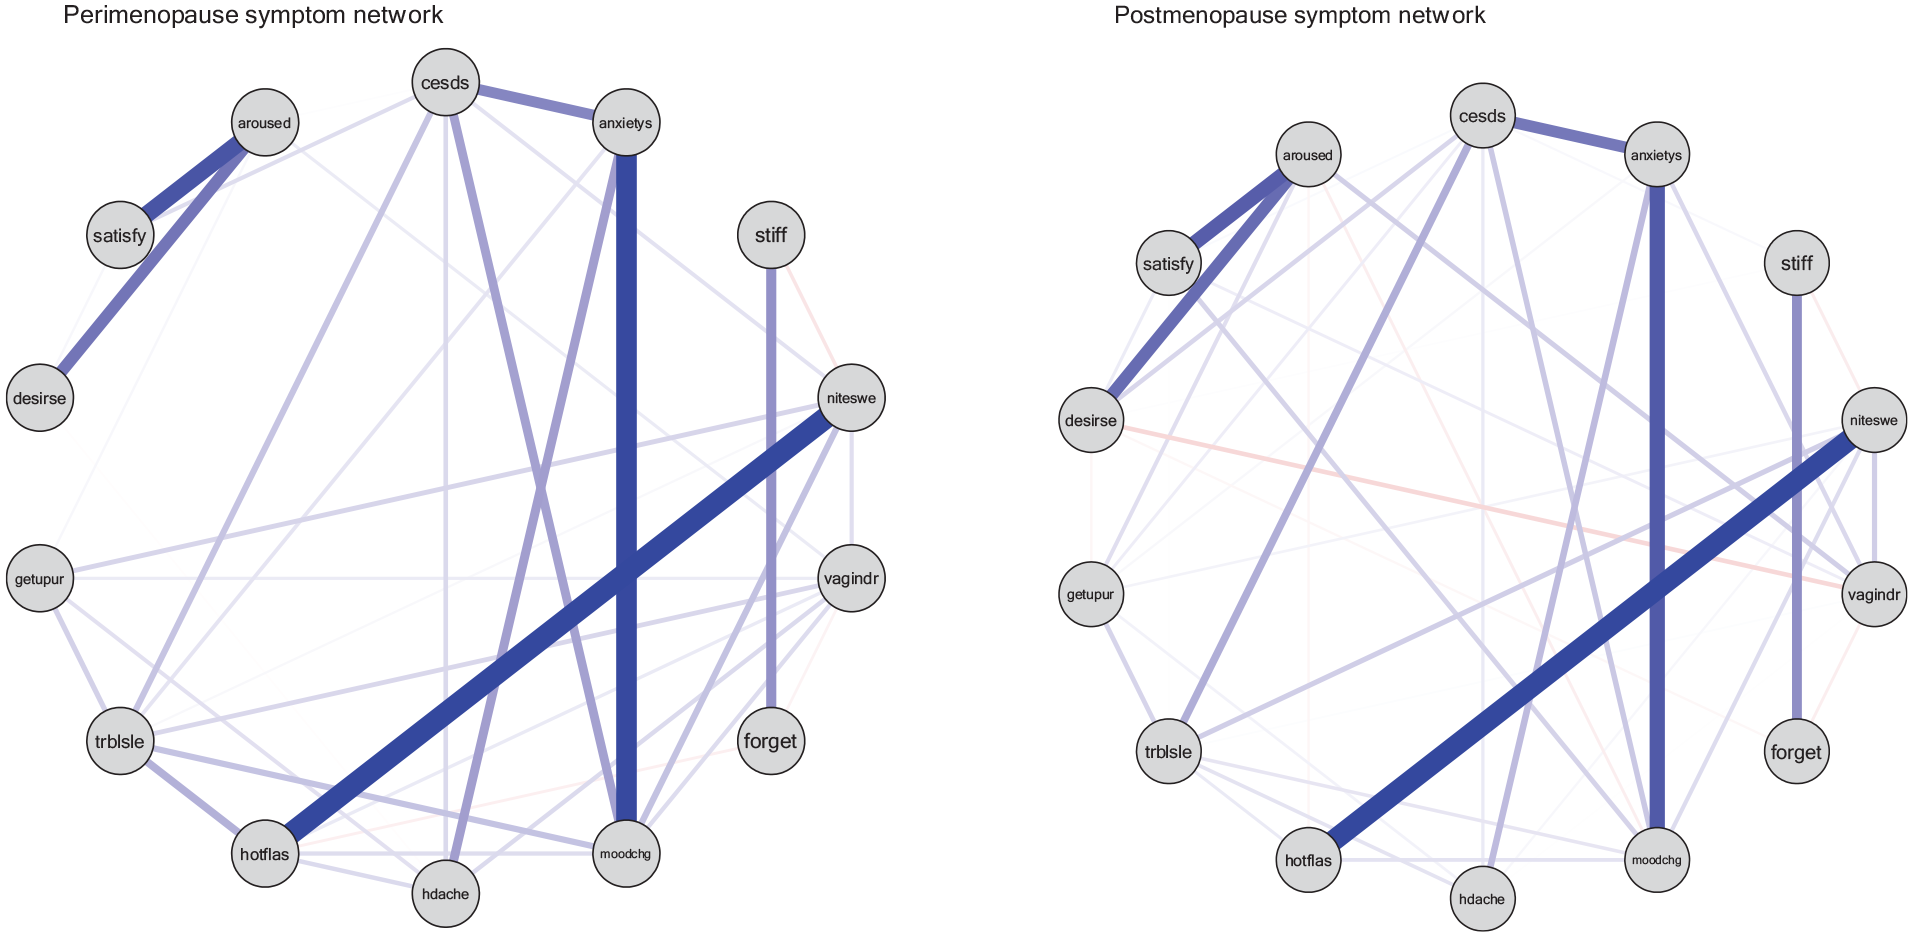
Network visualization for perimenopause (left) and postmenopause (right); desires: decreased sexual desire, satisfy: decreased sexual satisfaction, aroused: decreased sexual arousal, cesds: depression, anxietys: anxiety, stiff: body stiffness, niteswe: night sweat, vagindr: vaginal dryness, forget: forgetfulness, moodchg: frequent mood change, hdache: headache, hotflas: hot flash, trblsle: trouble sleeping, getupur: get up to urinate. Blue line: positive relationship; red line: negative relationship; thick line: strong relationship; thin line: weak relationship.
Table 2 shows the values for 3 centrality indices (strength, betweenness, and closeness) and expected influence index. In midlife women in perimenopause (n = 898), frequent mood change was the core symptom with the highest expected influence (1.62). In midlife women in postmenopause (n = 898), anxiety was the core symptom with the highest expected influence (1.48). Refer to Figure 2 for the plotting of centrality indices.
Symptom Centrality Indices.

Listed in terms of key symptoms (with the most central key symptom at the top and the least central at the bottom).
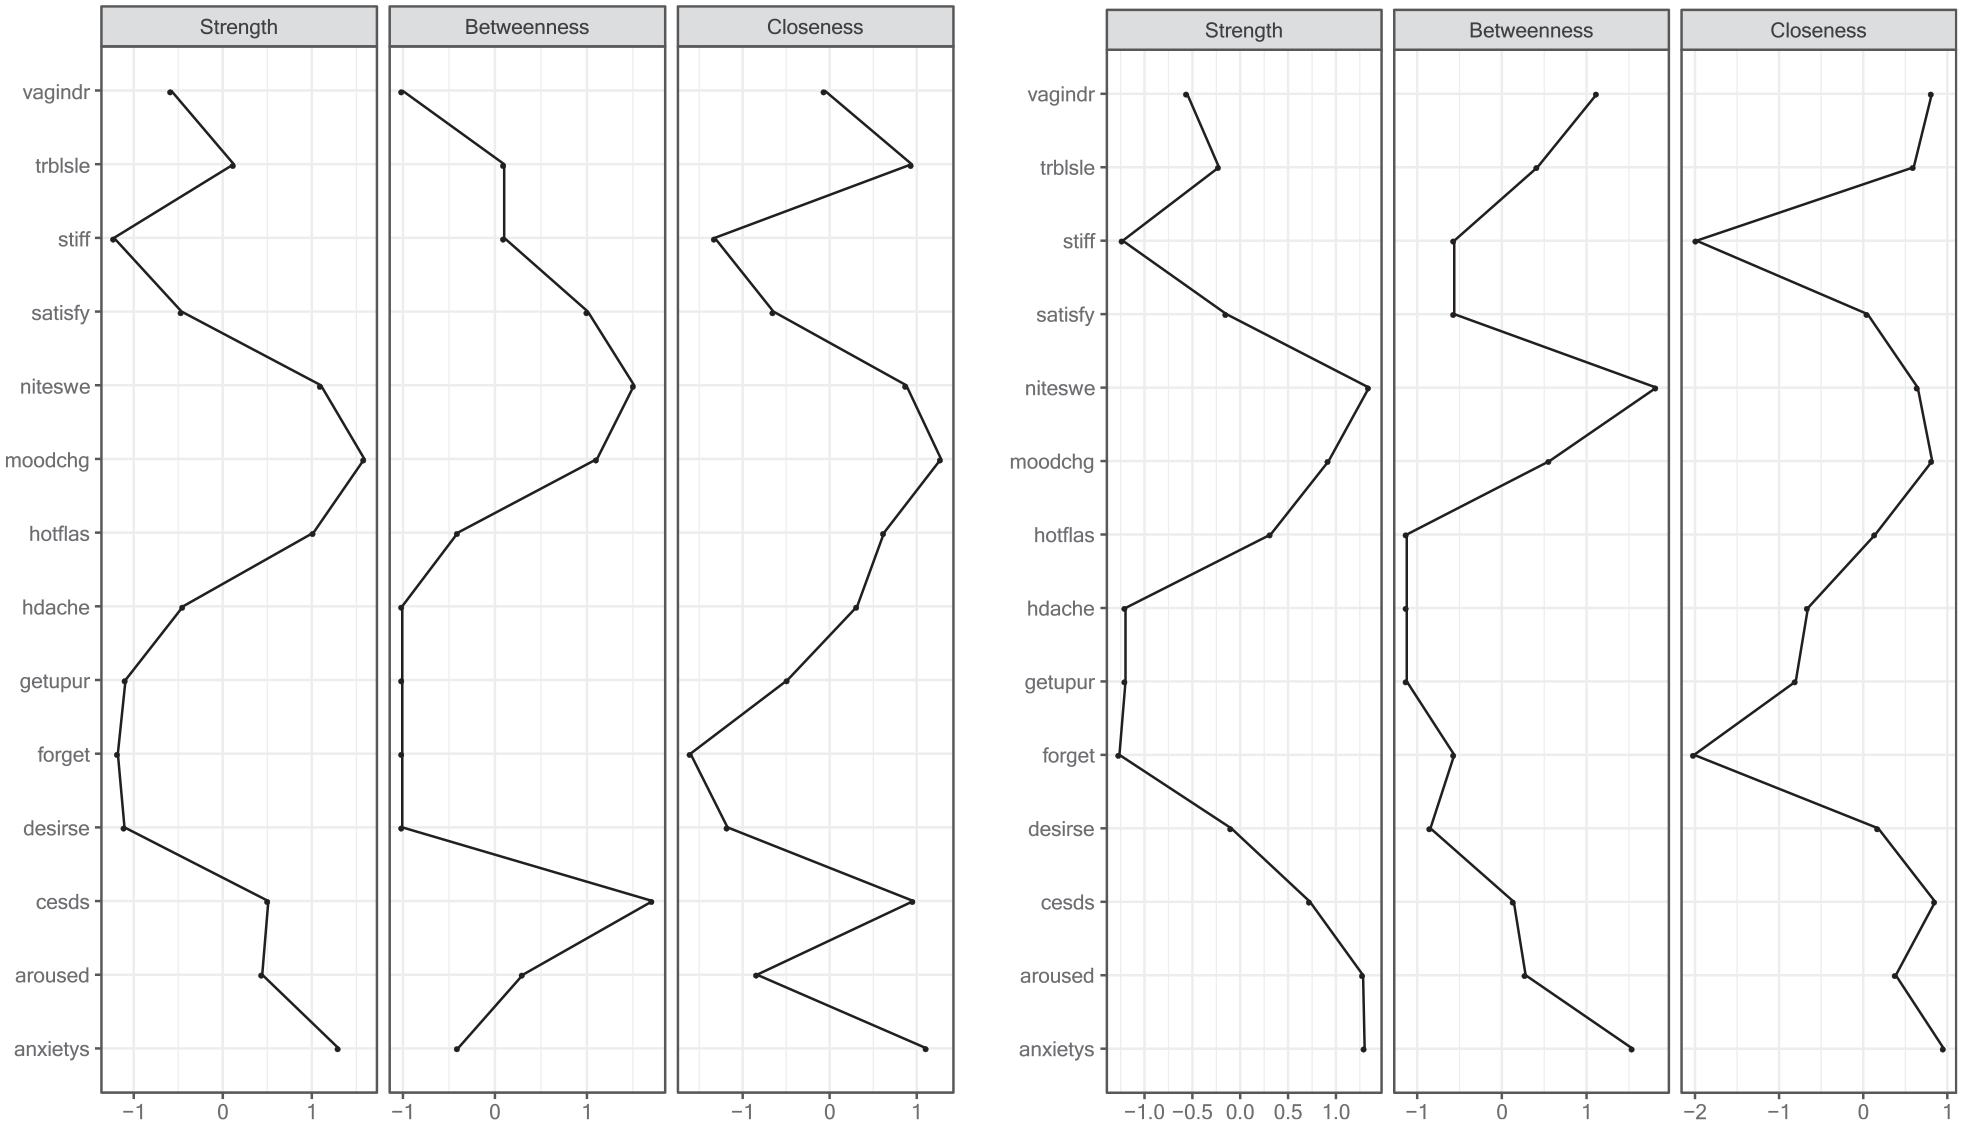
Symptom centrality indices for perimenopause (left) and postmenopause (right).
Network Accuracy and Stability
For both symptom networks for midlife women in perimenopause and postmenopause, strength showed a higher stability than betweenness and closeness with a Cs-coefficient of 0.751. For midlife women in perimenopause, the Cs-coefficient for betweenness was 0 and closeness was 0.283. For midlife women in postmenopause, the Cs-coefficient for betweenness was 0.128 and closeness was 0.439. However, given the low Cs-coefficient for betweenness in midlife women in perimenopause, the betweenness may not be a reliable centrality index.
Network Comparison
The 2 networks were similar in terms of the global strength, network structure, one-to-one edge, and specific centrality measure. The global strength (S = 0.01, P = .974) for midlife women in perimenopause was 3.73 and midlife women in postmenopause was 3.75. The difference in the network structure was 0.10 (P = .461) and the specific centrality measure was −0.10 (P = .083) between the 2 groups, both of which were not significant. As the global strength, network structure invariance, and specific centrality measure were similar between midlife women in perimenopause and postmenopause, the edge invariance test was not further conducted (Figure 3).
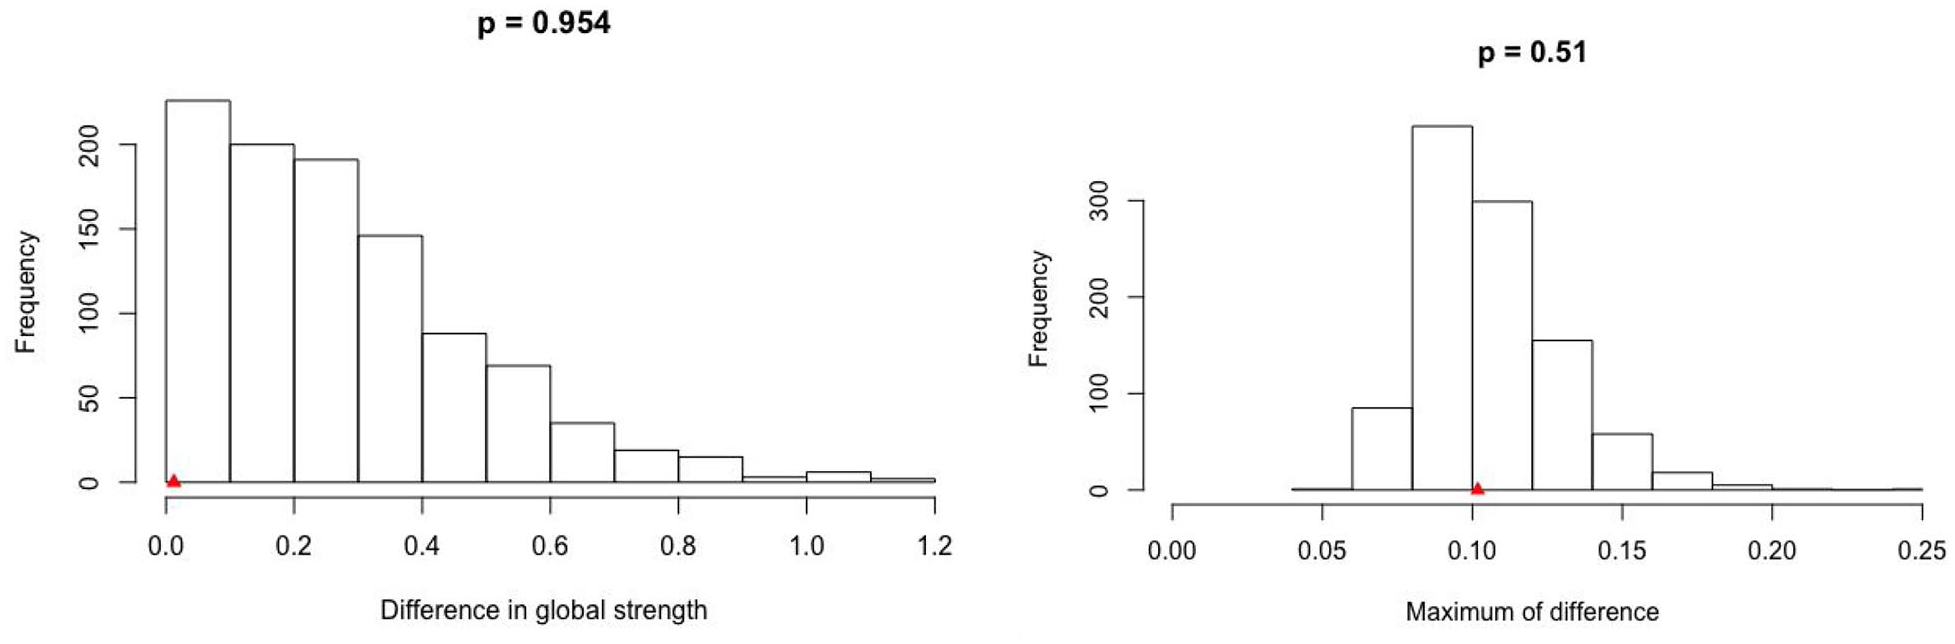
Difference in global strength and maximum difference in edge strength.
Discussion
To the best of our knowledge, this is one of the few studies to use network analysis to identify and compare the symptom networks and core symptoms between midlife women in perimenopause and postmenopause. Although a recent study employed a similar approach, it focused on examining the differences in the depression network between the 2 stages without comparing overall or core symptoms. 31 In our study, the symptom networks were similar in terms of the global strength, network structure, one-to-one edge, and specific centrality measure. However, the core symptoms within each symptom network were different between the 2 groups.
Upon examining the symptom network, there was a strong relationship between certain symptoms (eg, depression-anxiety) in both groups, though the strength of these relationships was stronger in midlife women in perimenopause. Depression and anxiety are common mental health symptoms among menopausal women,15,29,32 which may explain the strong relationship found in both groups. For example, midlife women frequently receive diagnoses of anxiety, which is significantly associated with the onset of major depressive disorder in the subsequent year, thereby potentially contributing to the co-occurrence of depression and anxiety within this population. 33 In consequence, depression is likely to co-occur with anxiety, and research indicates that the diagnosis of depression-combined anxiety has the most significant negative impact on health-related quality of life for midlife women over time. 34 Considering the strong relationship between the 2 symptoms and their negative impact on health-related quality of life, it is imperative for clinicians to provide pharmacological and nonpharmacological interventions to alleviate symptoms of both depression and anxiety. Furthermore, researchers should prioritize the identification of factors that contribute to the co-occurrence of these disorders among midlife women, enabling the implementation of early and targeted interventions.
We found a negative relationship between vaginal dryness-forgetfulness and stiffness-night sweat in both groups. There is a strong evidence in the literature that midlife women in perimenopause and postmenopause experience vaginal dryness, forgetfulness, stiffness, and night sweat.35-38 Few studies have examined the relationships among the 4 symptoms of vaginal dryness, forgetfulness, stiffness, and night sweat.35-38 For example, a recent study found that women experiencing night sweats are more vulnerable to prefrontal cortex deficits that may lead to poor attention, executive function, and forgetfulness.35-38 Yet, no studies have examined the relationship between vaginal dryness-forgetfulness and stiffness-night sweat. Our study findings add to the body of evidence about the potential negative relationships among these symptoms, which warrants further research.
With the presence of both positive and negative relationships among the symptoms, we used the expected influence index to identify core symptoms in each network. Frequent mood change was the core symptom in midlife women in perimenopause, and anxiety was the core symptom in midlife women in postmenopause. When midlife women enter into early perimenopause, they often experience conflicting attitudes toward aging accompanied by changes in social roles and responsibilities, career changes, and children leaving home, characterized by both positive and negative feelings, alongside heightened sensitivity to hormonal fluctuations typical of the luteal phase of their menstrual cycles.39-43 Perimenopause is a period of time of significant hormonal instability. 44 The first hormone to change during early-perimenopause is decreased anti-Mullerian hormone, followed by increased FSH and decreased inhibin B.45,46 As these women experience hormonal and biological changes for the first time during the perimenopause, the first symptom experienced tends to evolve around their mood, which may support the finding of frequent mood change as the core symptom among perimenopausal women.39,40
In contrast, midlife women in postmenopause experience markedly raised FSH and decreased level of estradiol, while inhibin B and anti-Mullerian hormonal levels are undetectable. 44 These midlife women experience a peak in their anxiety and even panic attacks especially during their postmenopausal period. 47 The different time and rate of hormonal changes during perimenopause and postmenopause may explain the different core symptoms for both groups. As midlife women experience multiple symptoms concurrently, clinicians are often faced with challenges to assess and manage their symptoms. Core symptoms are critical study findings that may serve as targets for future symptom management interventions. 15 With this new knowledge, clinicians need to prioritize symptom assessment and management for the identified core symptoms in clinical settings.
We further compared the 2 symptom networks between midlife women in perimenopause and postmenopause using the network comparison test. While the 2 symptom networks were similar, the global strength was higher in midlife women in postmenopause. The global strength invariance hypothesis assumes the overall connectivity to be identical across subpopulations. 30 However, the higher global strength in midlife women in postmenopause may indicate a more strongly connected and dense network of symptoms. This contrasts with previous research indicating that perimenopausal women are more prone to frequent and severe symptoms from hormonal fluctuations compared to postmenopausal women, who have typically adapted to these changes.7,28,48 However, postmenopausal women face a higher risk of medical comorbidities, such as osteoporosis and metabolic syndrome, compared to perimenopausal women, which can lead to increased level of distress.49,50 As postmenopausal women navigate this complex landscape of health challenges, they may require more targeted support and interventions to effectively manage their symptoms and improve their quality of life. Recognizing these differences in symptom networks in important for developing targeted interventions that address the specific needs of midlife women in perimenopause and postmenopause.
Limitations
Our study has several limitations to consider. First, network comparison testing has been used mainly for Gaussian and binary data. All the ordinal symptom variables used for the current data analysis were treated as Gaussian, which has been used by previous researchers. However, the results should be interpreted with caution as it may include some bias in the estimation of group differences in symptoms during the permutation process. Second, this is an exploratory study that focuses on a network structure based on symptom severity. As symptom is conceptualized as multidimensional, future studies should identify and compare the symptom networks using other symptom dimensions such as occurrence and frequency. Third, all the symptoms were obtained retrospectively via self-report using the SWAN-designed questionnaire, which may be prone to recall bias. Fourth, different symptom measures were used to measure symptoms such as the CES-D, a composite score of 4 anxiety symptoms, and SWAN-designed questionnaires. There may be numerous associated symptoms within their corresponding symptom constructions, which can overlap with other symptoms. Fifth, the sample size for midlife women in perimenopause was reduced during propensity score matching (PSM) from 1719 to 898. While a comparable group was created through the use of PSM, the validity of our study findings may be affected. Sixth, our study did not consider those women with endocrine disorders such as polycystic ovary syndrome which can obscure the signs of perimenopause and thus our findings need to be interpreted with caution. Last, the covariates selected for PSM were based on data availability. As a result, important covariates that can influence menopausal symptoms in midlife women may not have been considered.
Conclusion
The current study used network analysis to find that there were some similar overlapping positive and negative relationships between symptoms in midlife women in perimenopause and postmenopause, with differences in strength. The core symptoms were different for both groups, which indicate a potential need for different symptom management approaches. However, the symptom networks were invariant in terms of global strength, network structure, specific centrality measure, and one-to-one edge invariance. With this new knowledge, clinicians should offer targeted key symptom assessment and management, as well as monitor any changes in symptoms for midlife women undergoing perimenopause and postmenopause.
Footnotes
Acknowledgements
Not applicable.
Author Contributions
The named authors confirm contribution to the study as follows: study conceptualization (SHM, QY, SD, CL), data curation (SHM), formal analysis (SHM), methodology (SHM, CL), investigation (SHM, CL), original manuscript development (SHM), and revision and approval of the final manuscript (SHM, QY, SD, CL).
Data Availability
Not applicable.
Data Deposition
Not applicable.
Declaration of Conflicting Interests
The author(s) declared no potential conflicts of interest with respect to the research, authorship, and/or publication of this article.
Funding
The author(s) received no financial support for the research, authorship, and/or publication of this article.
Ethics Approval
This article was a secondary analysis of a de-identified data set. Primary data collection from human participants was not performed by any of the authors.