
Abstract
This systematic review details symptom clusters, their compositions, and associated factors and appraises the methodologies of studies that reported symptom clusters in patients with chronic obstructive pulmonary disease (COPD). Ten studies were eligible for inclusion in this study. Four common symptom clusters were identified. Two theoretical frameworks, four statistical methods, and various symptom assessment tools were used to identify symptom clusters. Factors associated with symptom clusters included demographic, clinical, and biological factors. No studies examined the subjective experiences of symptom clusters. Overall, inconsistencies were identified in the composition of symptom clusters across studies. This may be due to variations in study design, assessment tools, and statistical methods. Future studies should attempt to arrive at a common definition, especially that is theoretically derived, for symptom clusters, standardize the criteria for symptoms for inclusion in the clusters, and focus on patients’ subjective experience to inform which clusters are clinically relevant.
Keywords
Chronic obstructive pulmonary disease (COPD) is a chronic disabling lung condition characterized by airflow limitation (COPD Working Group, 2012). It is anticipated to become the third leading cause of death by 2030 (Quaderi & Hurst, 2018). COPD principally occurs as a result of tobacco smoking and long-term exposure to harmful fumes or dust, or, more rarely, a consequence of a rare genetic problem, resulting in severe lung damage (Moore et al., 2016). Patients with COPD experience multiple distressing somatic and psychological symptoms, including breathlessness, fatigue, anorexia, pain, depression, anxiety, cough, daytime sleepiness and insomnia, dry mouth, and sexual dysfunction (Maddocks et al., 2017). Moreover, patients with COPD experience recurrent exacerbations associated with a decline in exercise capacity, quality of life, and self-efficacy (Greulich et al., 2014). The final years for patients with advanced COPD are characterized by frequent exacerbations, progressive functional decline, and increased dependency on informal caregivers and the health care system (Yohannes & Alexopoulos, 2014).
Strategies for symptom management in people with COPD involve pharmacological and non-pharmacological methods (Khakban et al., 2017). An increasing number of studies have investigated the effectiveness of different strategies for treating different symptoms. A key management strategy for breathlessness is pulmonary rehabilitation, which represents a multidisciplinary program of care, involving self-management educational training and exercise training (McCarthy et al., 2015). Strategies for fatigue management involve activity pacing, good sleep hygiene, self-management education programs, and pulmonary rehabilitation (Baltzan et al., 2011; Lewko et al., 2012). Strategies for managing psychological symptoms, including depression and anxiety, involve exercise, cognitive behavioral techniques, dignity therapy, and spiritual support (Chochinov et al., 2011; Kunik et al., 2008). It appears that single strategies may be used to alleviate more than one symptom. For example, pulmonary rehabilitation may be used to manage breathlessness and fatigue (Corhay et al., 2014).
While some people with COPD may experience only a single symptom, a large proportion of people experience multiple concurrent symptoms. This is more common in individuals with advanced disease who present up to seven symptoms per day as reported in a study (Eckerblad et al., 2014). Previous studies concerning symptoms among patients with COPD have mainly focused on isolated or single symptoms and their associated factors (Knorst et al., 2019; Lim et al., 2019; Sharma & Sharma, 2019). Although this method has created a specific perception of each symptom, its main limitation is that many people with COPD experience multiple and concurrent symptoms. In addition, Lenz pointed out that interventions considering diverse concurrent symptoms are more effective than independent interventions focusing on single symptoms (Lenz, 2018).
The concept of the symptom cluster first appeared in the fields of psychiatry and psychology before it was incorporated into general medicine (Aktas et al., 2010). The term symptom cluster was first proposed by Dodd et al., who defined it as three or more concurrent symptoms that are related to each other but are not required to have the same aetiology (Dodd et al., 2001b). In 2005, Kim et al. revised the definition of symptom clusters as “two or more concurrent symptoms as constituting a symptom cluster that are related to one another and are relatively independent of other symptom clusters” (Kim et al., 2005). Therefore, the science of symptom management has emphasized the conversion from a focus of targeting single symptom to exploring symptom clusters that may improve symptom management by focusing on multiple symptoms at the same time (Miaskowski et al., 2004). Comprehensive understanding of the phenomenon of symptom clusters in people with COPD allows for more thorough symptom assessment and conduct strategies for targeted symptom management to improve patient-centered outcomes and satisfied experiences of care (Kwekkeboom, 2016; Morjaria & Polosa, 2010). A growing number of robust studies have identified, investigated, evaluated, and explored symptom clusters among patients with cancer (Aktas, 2013), and these clusters have expanded to other chronic conditions such as cardiovascular disease (DeVon et al., 2017), chronic kidney disease (Lockwood et al., 2019), and human immunodeficiency virus (Zhu et al., 2019).
In the clinical setting, nurses play a prominent role in the assessment of symptoms. If nurses possess knowledge of symptoms that typically occur concurrently, then they will be able to anticipate and investigate further into other potentially related symptoms (Lacasse & Beck, 2007). This may result in more efficient use of limited patient–provider time and potentially uncover symptoms that might, otherwise, have been overlooked (Kwekkeboom, 2016). Moreover, through a holistic approach, nurses may more easily be able to identify the presence of a cluster and then develop effective symptom management strategies or self-management intervention programs to improve the quality of life of COPD patients (Lim et al., 2017). The organizations of the National Institute of Nursing Research and Palliative Medicine and the American Academy of Hospice have proposed symptom management as a focus for research, thereby devoting financial resources and education in this area (Coyne et al., 2018). Therefore, it seems intuitively reasonable that nurses are able to recognize the co-occurrence of specific symptoms, which leads to the development of more efficient and effective symptom management strategies and the development of clinical guidelines (Dunn et al., 2018).
To date, there is little consensus on the definition of symptom clusters, either methodologically or conceptually, both in clinical practice and in research (Miaskowski et al., 2017). Validation of the concept of symptom clusters is complicated and difficult because evaluating symptom interrelationships involves many methodological challenges, specifically the study design, theoretical framework, measurement tools, symptom dimensions (severity vs. intensity vs. distress vs. prevalence), statistical methods to identify the cluster, statistical “cut-off” points to define clusters, and characteristics of study samples, which may contribute to these inconsistencies of symptom clusters (Xiao, 2010). To date, there has been only one literature review examining symptom clusters among COPD patients. This review therefore focuses on studies published in English between 2005 and 2018 (Jenkins et al., 2019). The review summarized the compositions of COPD symptom clusters and examined statistical techniques and instruments for symptom cluster formation. However, it did not critically report the presence of theoretical frameworks that guided research in symptom clusters, synthesize the approaches used to select symptoms, and the statistical methods adopted to identify symptom clusters and examine factors associated with symptom clusters in people with COPD. In addition, because of language limitation, the study by Jenkins et al. may have omitted some studies meeting the inclusion criteria, such as Chinese studies. Accordingly, the composition of symptom clusters summarized in the study may not be comprehensive enough. Therefore, it is vital to address these outstanding concerns by rigorous appraisement, including the composition of symptom clusters, the methodologies applied in previous studies to identify symptom clusters, and the factors associated with symptom clusters in people with COPD.
In this study, we aimed to identify, systematically appraise, and synthesize available evidence on symptom clusters in people with COPD, specifically focusing on the following objectives: (a) investigate the composition of common symptom clusters in COPD; (b) critically review the methodological elements of COPD symptom cluster papers, including theoretical frameworks, approach to symptom selection, common symptom assessment instruments, symptom dimensions, and statistical methods used to derive symptom clusters and (c) examine the factors associated with symptom clusters.
Methods
Design
We conducted a systematic review to identify published studies on symptom cluster among patients with COPD. We followed the guidelines of the Preferred Reporting Items for Systematic Reviews and Meta-Analyses (Moher et al., 2009).
Search Methods
We searched the databases MEDLINE (Ovid), EMBASE (Ovid), CINAHL(EBSCO), PsycInfo, Web of Science, and China National Knowledge Infrastructure. The search results were limited to articles published from database inception to the present day. The language of publication was limited to English and Chinese.
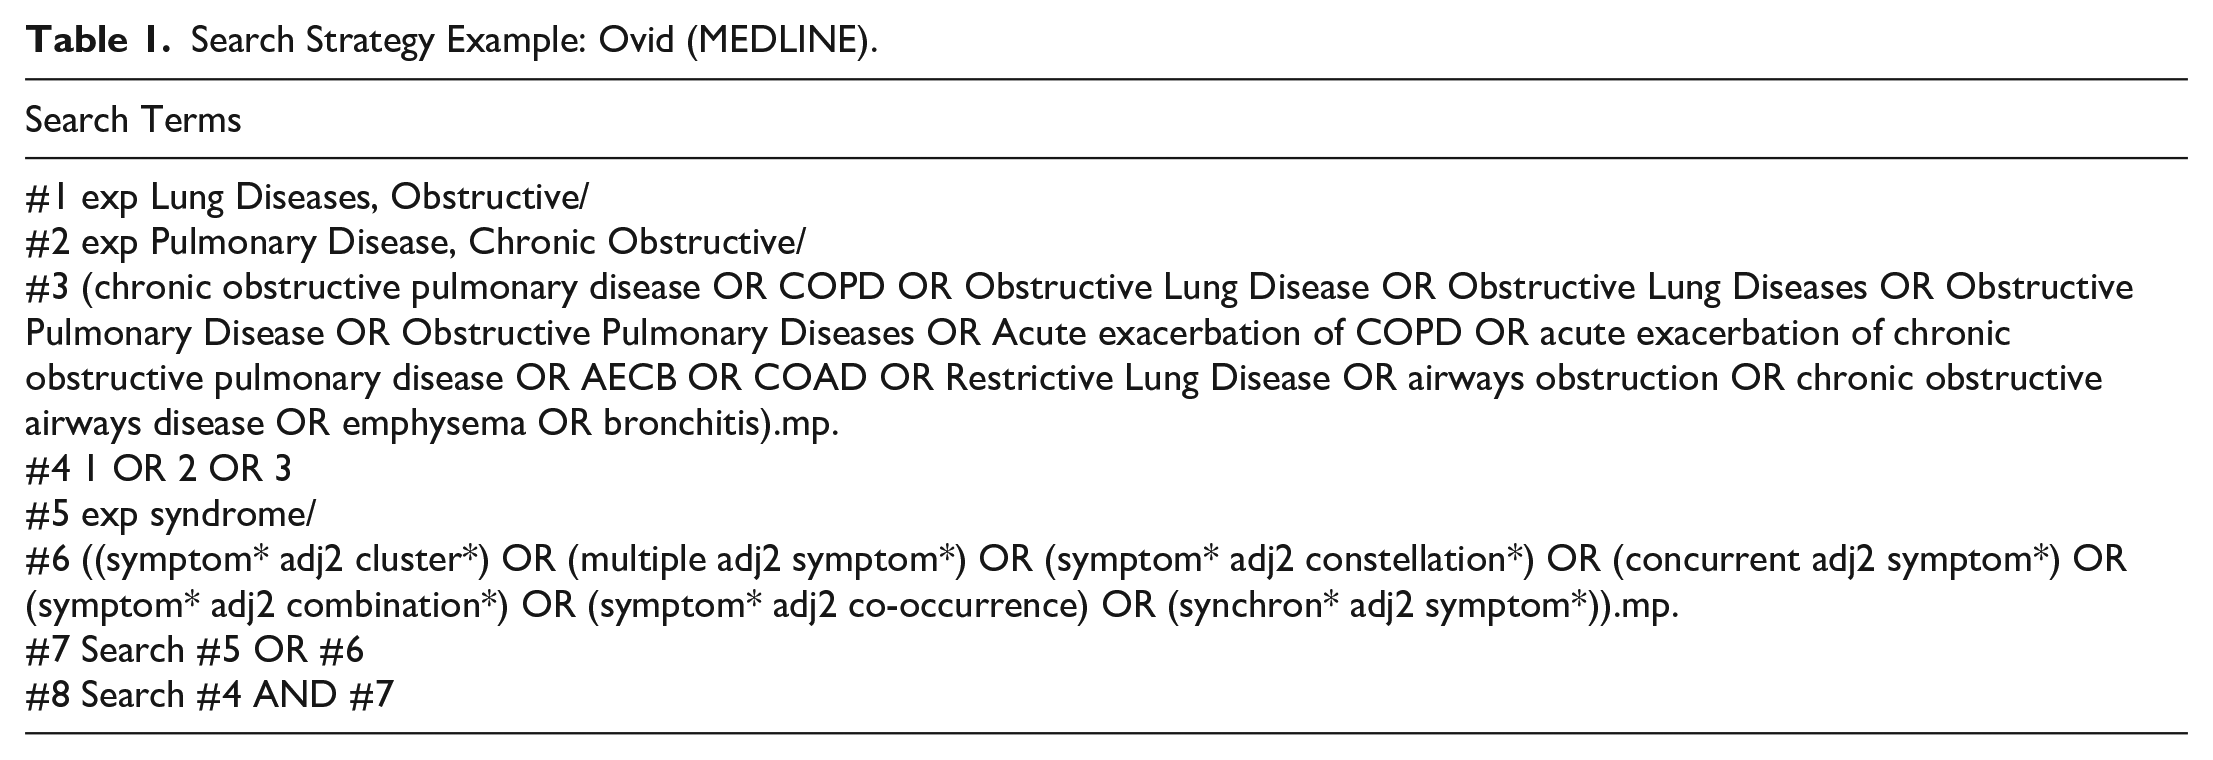
In MEDLINE, we searched articles using the following Mesh terms: ([“Pulmonary Disease, Chronic Obstructive” OR “Lung Diseases, Obstructive”] OR key words [chronic obstructive pulmonary disease OR COPD OR Obstructive Lung Disease OR Obstructive Lung Diseases OR Obstructive Pulmonary Disease OR Obstructive Pulmonary Diseases OR Acute exacerbation of COPD OR acute exacerbation of chronic obstructive pulmonary disease OR AECB OR COAD OR Restrictive Lung Disease OR airways obstruction OR chronic obstructive airways disease OR emphysema OR bronchitis]) AND (Mesh terms [Syndrome] OR keywords [(symptom* adj2 cluster*) OR (multiple adj2 symptom*) OR (symptom* adj2 constellation*) OR (concurrent adj2 symptom*) OR (symptom* adj2 combination*) OR (symptom* adj2 co-occurrence) OR (synchro* adj2 symptom*)). An example of the full search strategy used in the MEDLINE database is presented in Table 1.
Search Strategy Example: Ovid (MEDLINE).
Inclusion and Exclusion Criteria
The inclusion criteria were as follows: (a) quantitative studies (primary and secondary analyses of dataset) aimed at identifying symptom clusters or interrelations between two or more symptoms in people with COPD, or quantitative studies tested statistically for a symptom cluster within a set of symptoms, and (b) qualitative studies aimed at exploring symptom clusters or interrelations between two or more symptoms in people with COPD. Any type of medical setting was eligible for inclusion. Theoretical articles, editorials, commentary/discussion articles, review articles, methodology articles, abstracts, and articles focusing on one specific symptom were excluded.
Titles and abstracts were screened based on the inclusion and exclusion criteria. All identified citations were imported into EndNote X9, and duplicates were removed. Screening and selection were independently conducted by two reviewers. Discrepancies were resolved through discussion between the two reviewers until a consensus was reached.
Quality Appraisal
Study quality was assessed using the Appraisal tool for Cross-Sectional Studies (AXIS tool) (Downes et al., 2016). This scale is designed for nonexperimental research and includes 20 items that measure aspects of study quality. Each study was assigned a score from 0 to 20, with higher scores indicating a lower risk of bias (higher study quality). Two reviewers independently conducted the assessments. When there was a divergence in scoring, the reviewers discussed the item further until a consensus was reached; if necessary, a third reviewer was consulted.
Data Abstraction
The two reviewers independently extracted information from the included studies, including data on authors’ names, year, location, primary aims, design, theoretical foundation, sample, symptom assessment instrument, analytic technique, number of symptom clusters, specific symptoms within each cluster, additional findings, and limitations. Discrepancies were resolved through discussion between the two reviewers.
Synthesis
In this review, we were unable to synthesize outcomes in a meta-analysis because of the heterogeneity in sample characteristics, research designs, and outcomes. Therefore, this review represents a narrative synthesis, which refers to “an approach to the systematic review and synthesis of findings from multiple studies that relies primarily on the use of words and text to summarize and explain the findings of the synthesis” (Popay et al., 2006). We reviewed the matrix tables to synthesize the data from the included studies and to identify consistencies and inconsistencies across studies.
Results
Search Outcome
Figure 1 shows the PRISMA flowchart for the article retrieval process. The search was conducted in six databases, and additional sources yielded 8,329 articles. After removing duplicate articles, 7,248 remained and were entered into the screening process. We excluded 7,205 articles after reading the titles and abstracts and further excluded 33 articles based on a review of the full text. Consequently, 10 articles were included in this narrative review as summarized in Table 2. Overall, 9 of the 10 studies were cross-sectional (Breland et al., 2015; Li et al., 2013; Lim et al., 2017; Park & Larson, 2014; Park et al., 2012; 2013; Srirat et al., 2014; Wu et al., 2020; Yang et al., 2020), one of which used a longitudinal design (Srirat et al., 2015). No qualitative study explored patient experience of symptom clusters. Articles were published between 2012 and 2020; nine were written in English, and one was written in Chinese (Li et al., 2013).
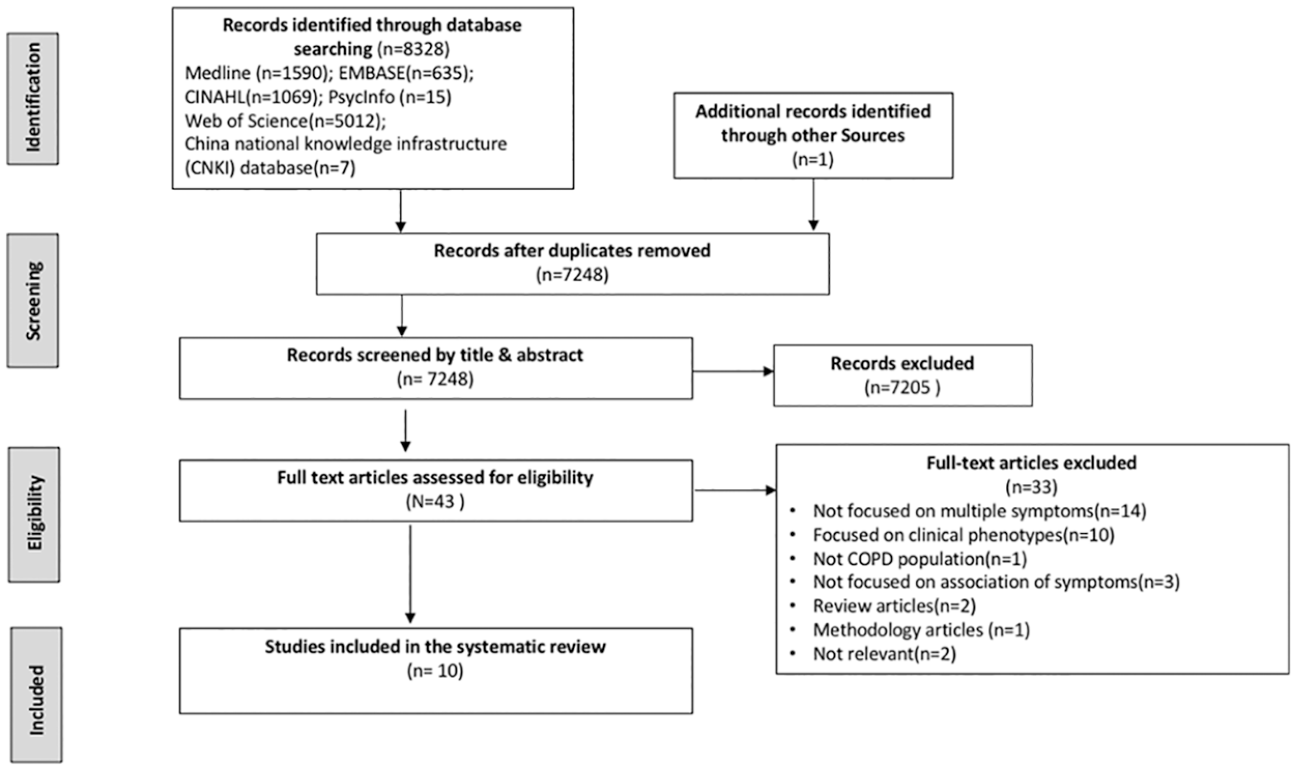
PRISMA flow diagram of potential studies through eligibility determinations.
Characteristics of the Included Studies.
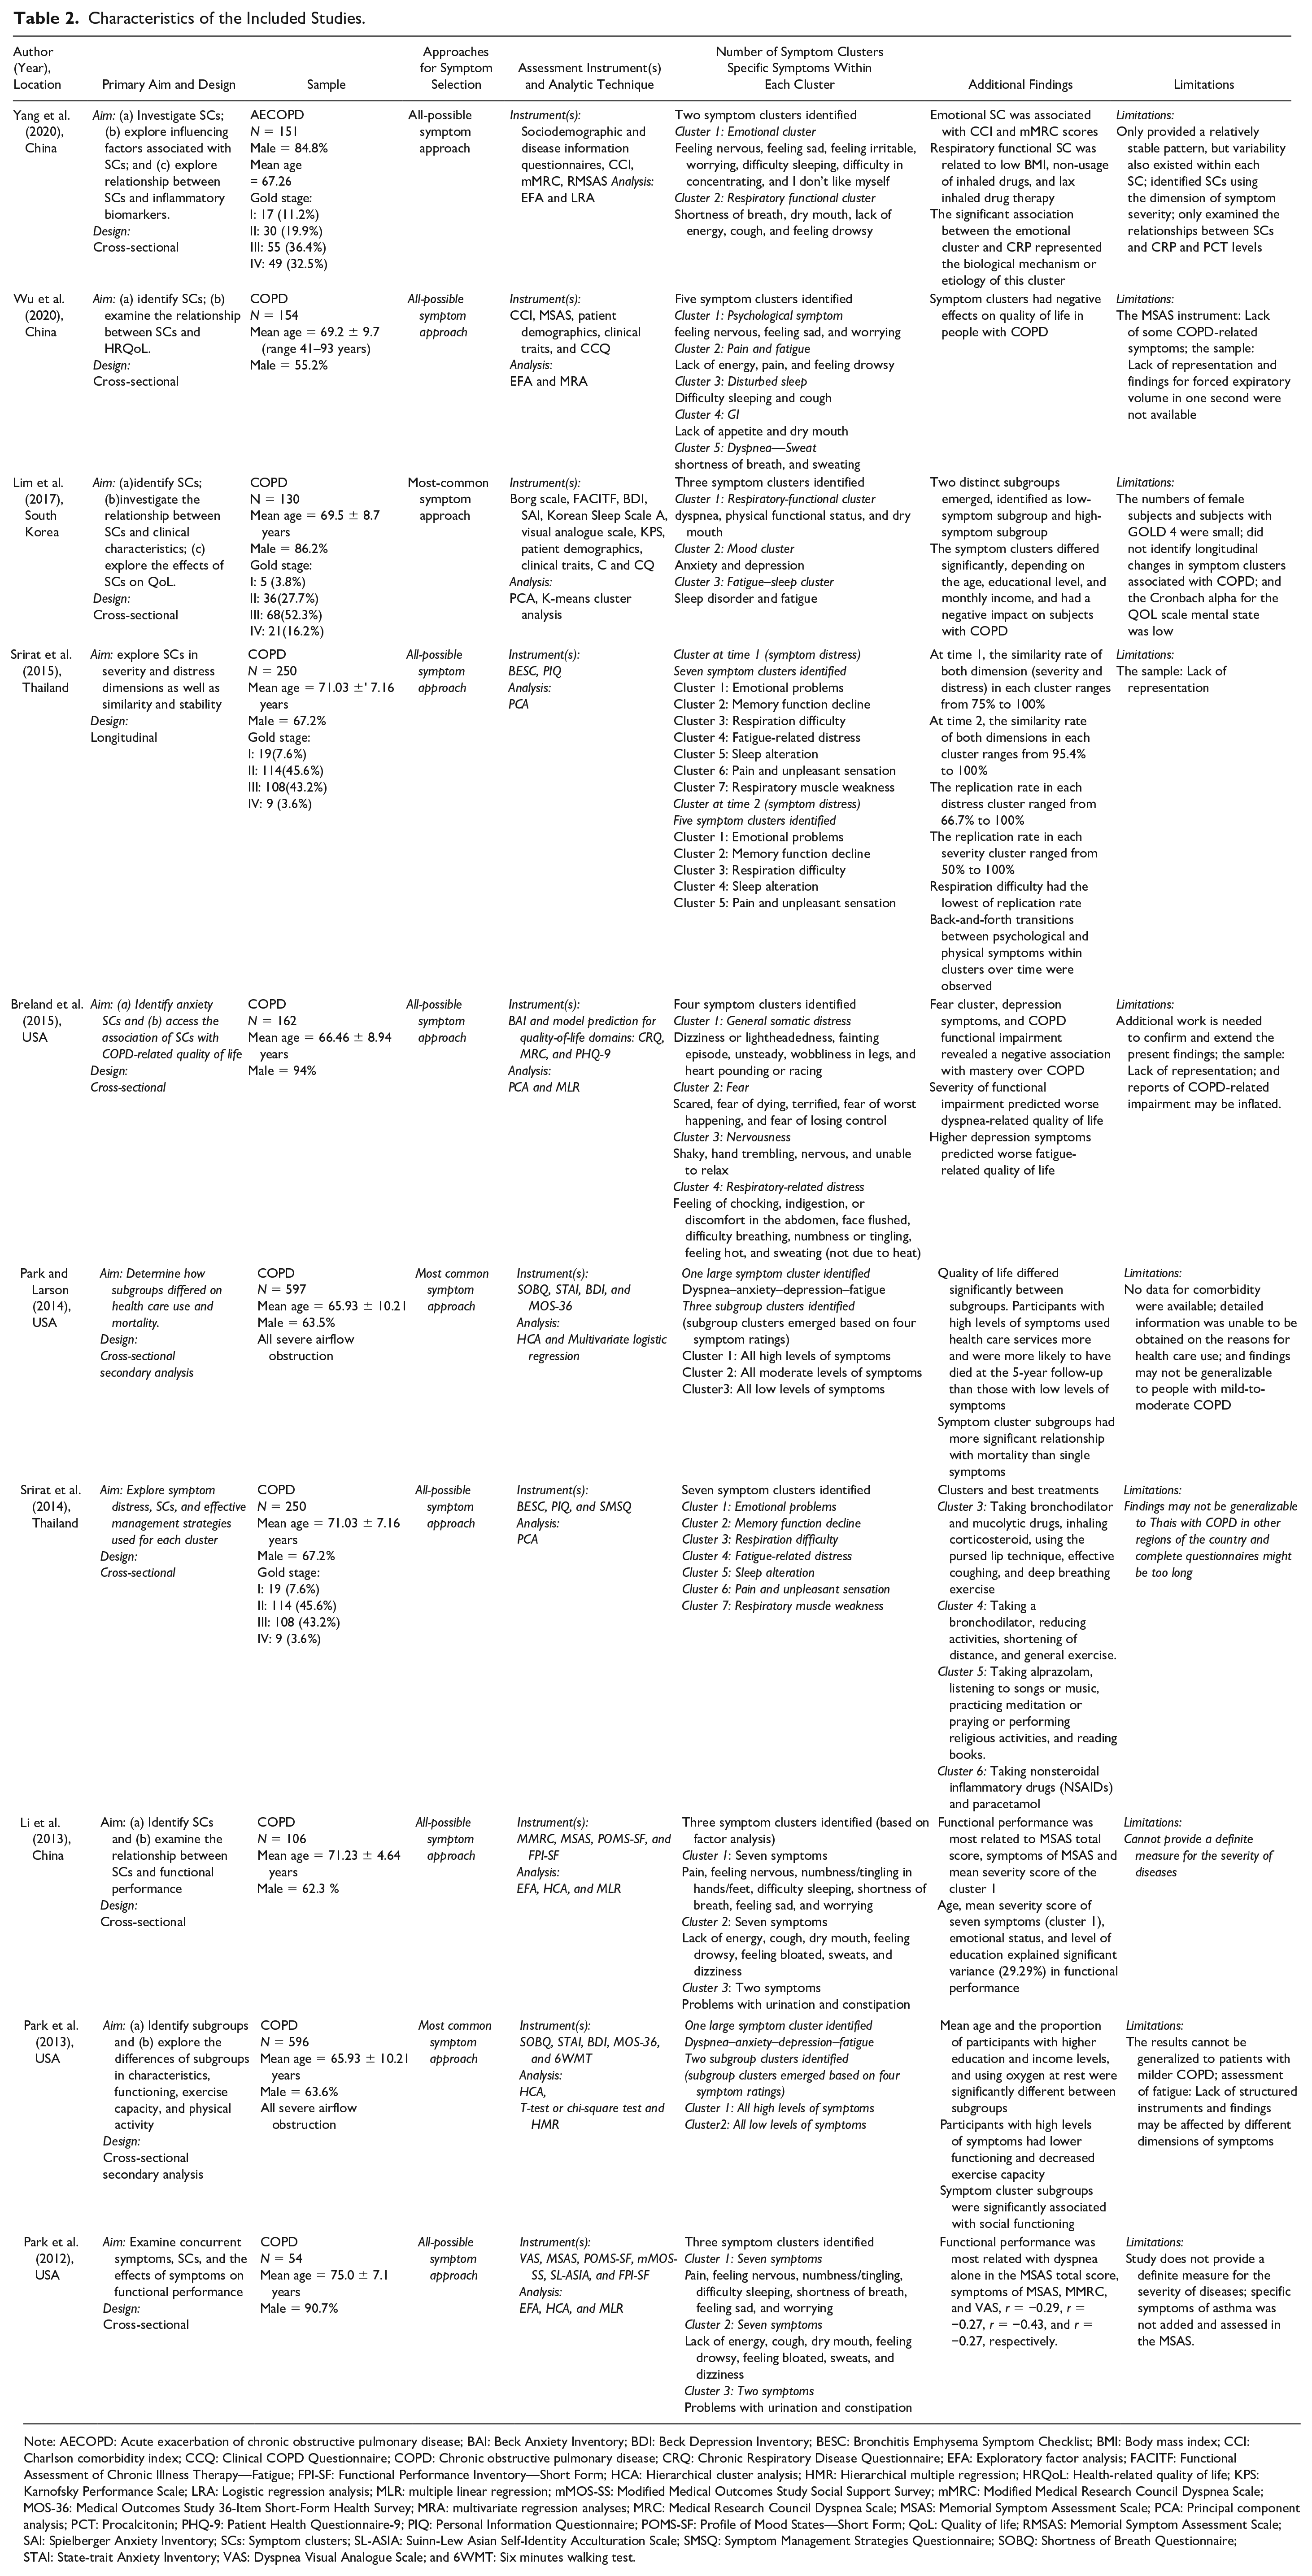
Note: AECOPD: Acute exacerbation of chronic obstructive pulmonary disease; BAI: Beck Anxiety Inventory; BDI: Beck Depression Inventory; BESC: Bronchitis Emphysema Symptom Checklist; BMI: Body mass index; CCI: Charlson comorbidity index; CCQ: Clinical COPD Questionnaire; COPD: Chronic obstructive pulmonary disease; CRQ: Chronic Respiratory Disease Questionnaire; EFA: Exploratory factor analysis; FACITF: Functional Assessment of Chronic Illness Therapy—Fatigue; FPI-SF: Functional Performance Inventory—Short Form; HCA: Hierarchical cluster analysis; HMR: Hierarchical multiple regression; HRQoL: Health-related quality of life; KPS: Karnofsky Performance Scale; LRA: Logistic regression analysis; MLR: multiple linear regression; mMOS-SS: Modified Medical Outcomes Study Social Support Survey; mMRC: Modified Medical Research Council Dyspnea Scale; MOS-36: Medical Outcomes Study 36-Item Short-Form Health Survey; MRA: multivariate regression analyses; MRC: Medical Research Council Dyspnea Scale; MSAS: Memorial Symptom Assessment Scale; PCA: Principal component analysis; PCT: Procalcitonin; PHQ-9: Patient Health Questionnaire-9; PIQ: Personal Information Questionnaire; POMS-SF: Profile of Mood States—Short Form; QoL: Quality of life; RMSAS: Memorial Symptom Assessment Scale; SAI: Spielberger Anxiety Inventory; SCs: Symptom clusters; SL-ASIA: Suinn-Lew Asian Self-Identity Acculturation Scale; SMSQ: Symptom Management Strategies Questionnaire; SOBQ: Shortness of Breath Questionnaire; STAI: State-trait Anxiety Inventory; VAS: Dyspnea Visual Analogue Scale; and 6WMT: Six minutes walking test.
Quality of Studies
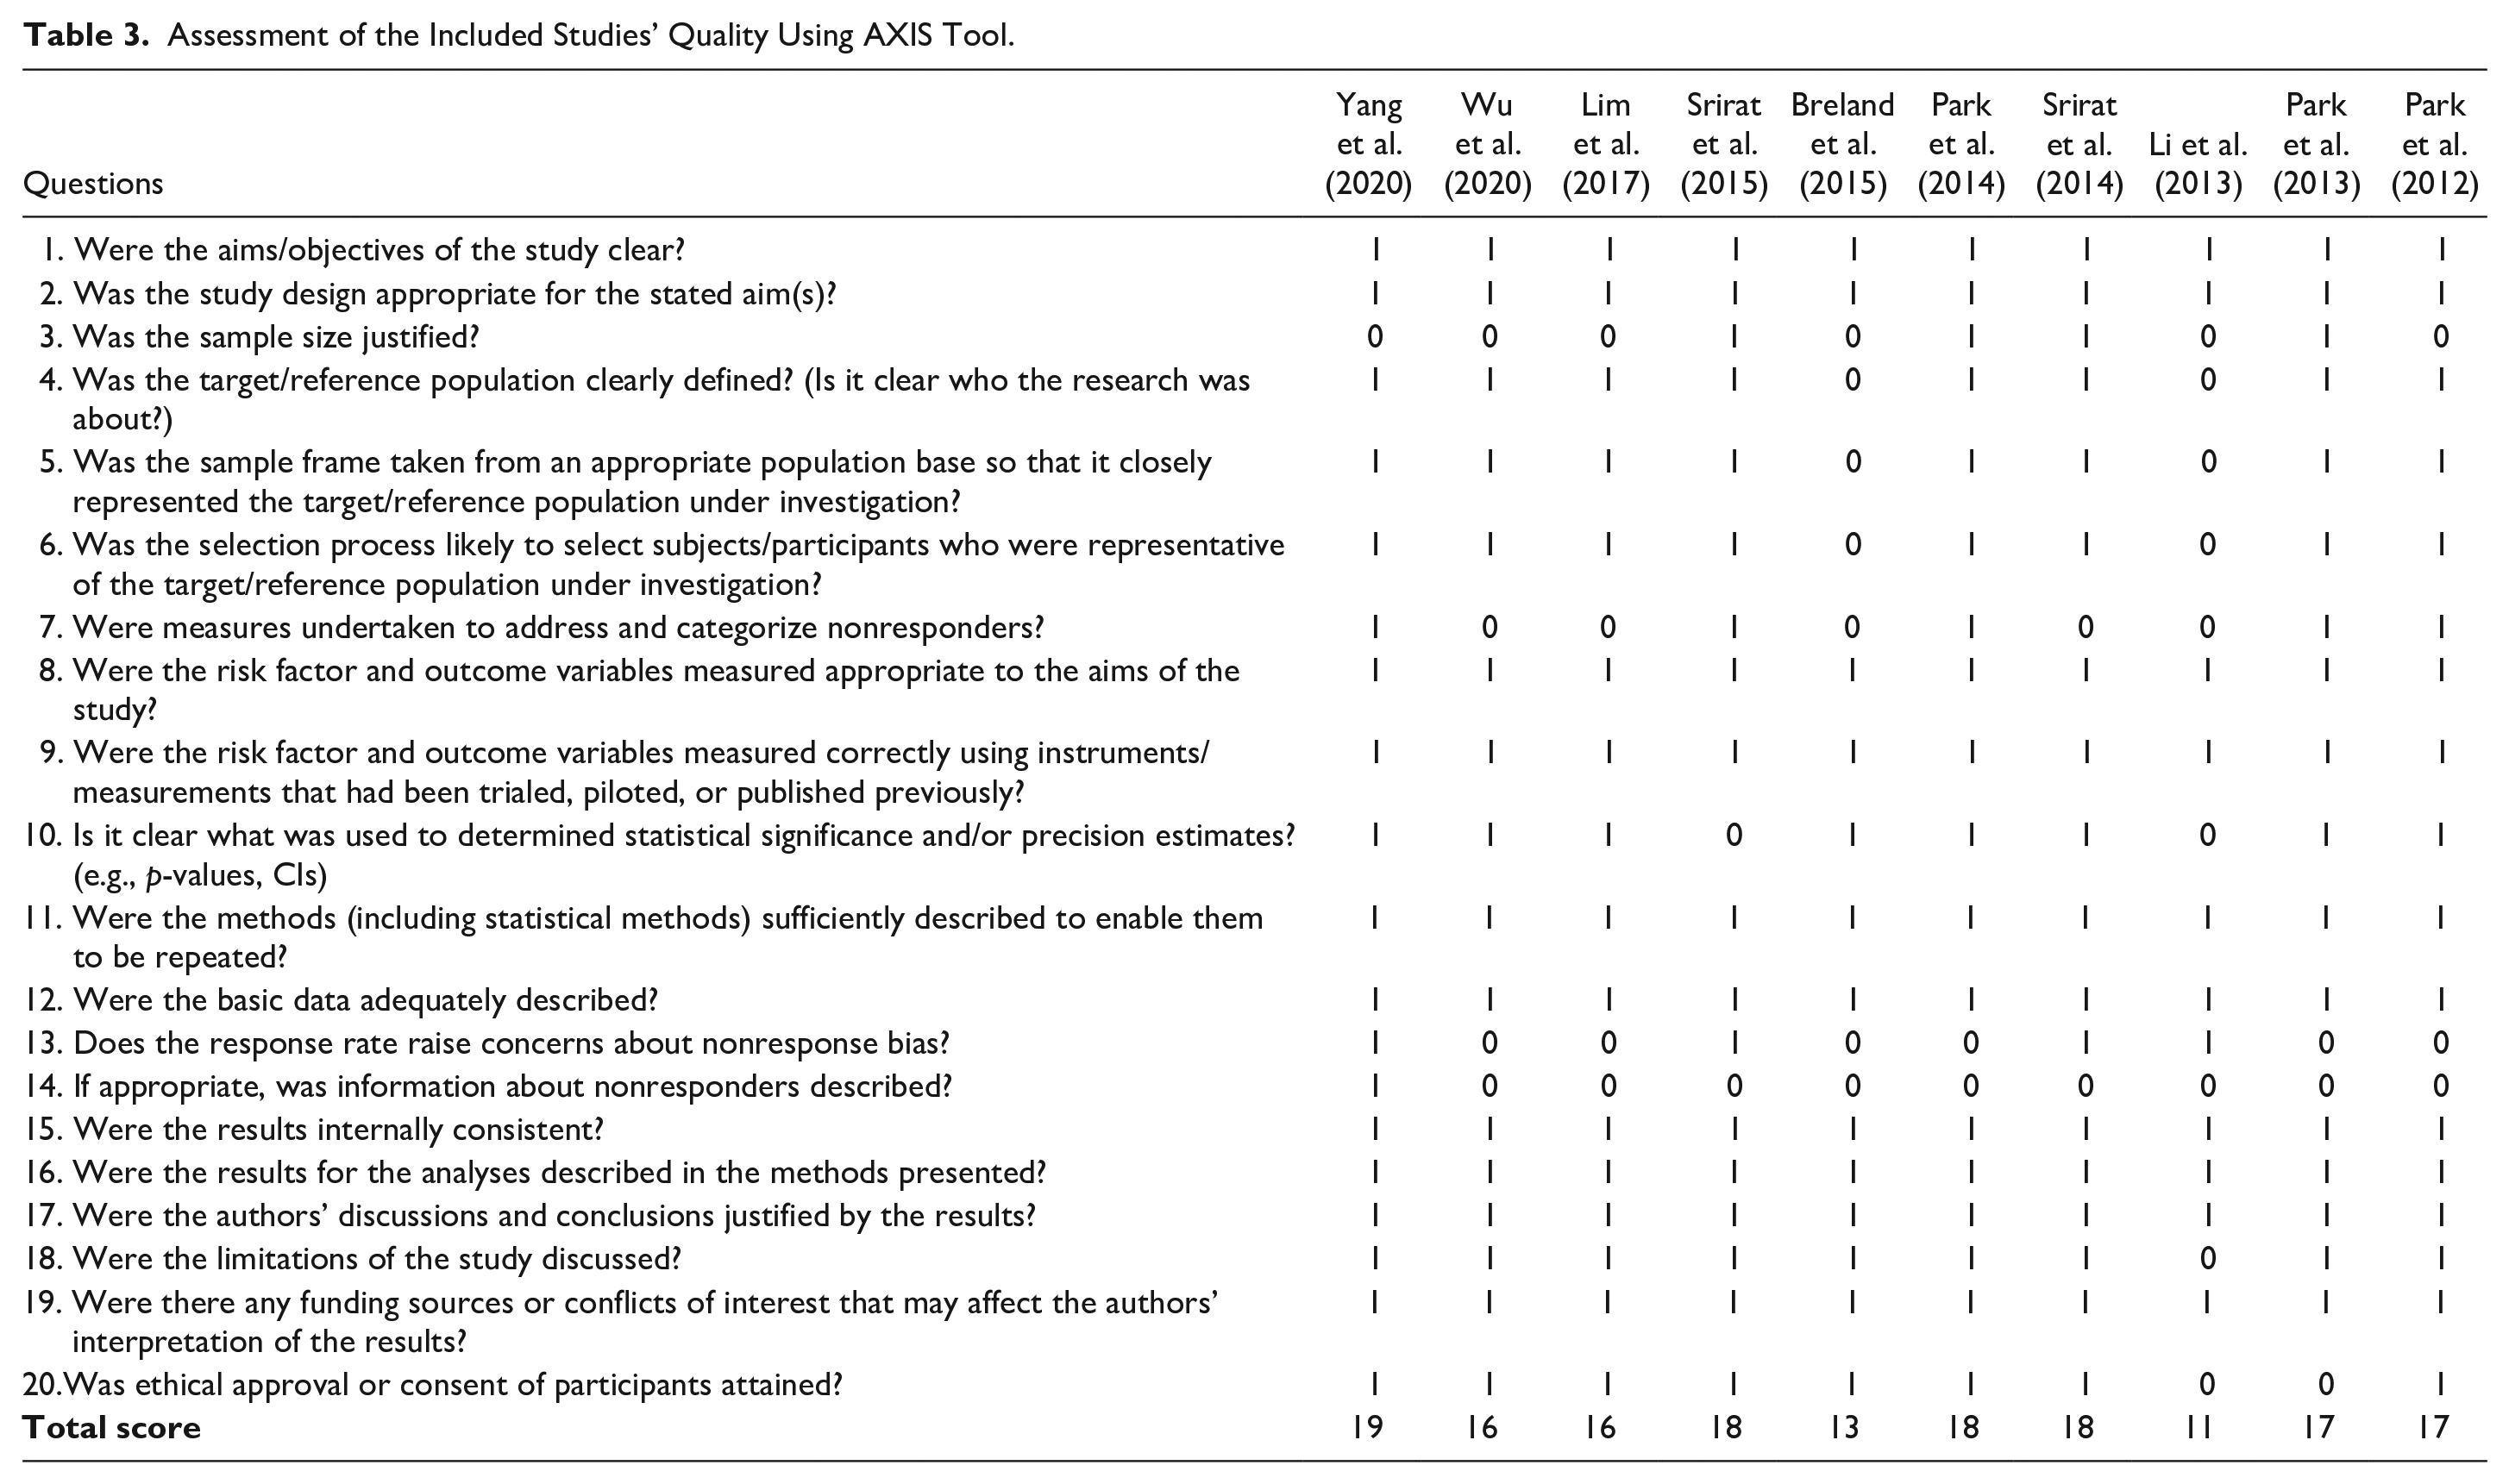
The results of the quality assessment of 10 eligible studies using the AXIS tool (Downes et al., 2016) are presented in Table 3. AXIS is used for assessing the quality of a study, but it is not an implicit measure of study bias (Downes et al., 2016). The mean total quality score was 16.3 (range 11–19). Our analysis revealed that all included studies had clear study objectives and employed an appropriate study design related to the objectives. Only four studies (Park & Larson, 2014; Park et al., 2013; Srirat et al., 2014, 2015) reported an estimated sample size using appropriate statistical methods. Eight studies (Lim et al., 2017; Park & Larson, 2014; Park et al., 2012, 2013; Srirat et al., 2014, 2015; Wu et al., 2020; Yang et al., 2020) clearly defined the target/reference population and had an appropriate sampling frame. Two studies (Breland et al., 2015; Li et al., 2013) had no selection process. Five studies (Park & Larson, 2014; Park et al., 2012, 2013; Srirat et al., 2015; Yang et al., 2020) addressed and categorized nonresponders. All the studies that included risk factors and measured outcomes were appropriate to the aims of their study. Two studies (Li et al., 2013; Srirat et al., 2015) did not present the statistical significance of the key variables. All studies sufficiently described the methodology so that it could be repeated. All studies presented adequate data of basic characteristics and described their results completely. However, only one study (Yang et al., 2020) categorized nonresponders and reported profiles of nonrespondents to the survey. Except for one study (Li et al., 2013), all others provided information about methodological limitations. Two studies (Li et al., 2013; Park et al., 2013) did not provide information on ethical approval.
Assessment of the Included Studies’ Quality Using AXIS Tool.
Sample Characteristics
Studies were usually conducted across four countries, namely China (Li et al., 2013; Wu et al., 2020; Yang et al., 2020), South Korea (Lim et al., 2017), Thailand (Srirat et al., 2014, 2015), and the United States (Breland et al., 2015; Park & Larson, 2014; Park et al., 2012, 2013). The recruited participants had a mean age, ranging from 65.9 years to 75.0 years. Males were predominant among the enrolled participants, ranging from 55.2% to 94.0%. Four studies examined symptom clusters in people with COPD stages 1–4, based on spirometry results, rated as being “mild” to “very severe” (Lim et al., 2017; Srirat et al., 2014, 2015; Yang et al., 2020); two articles included patients with severe airflow obstruction (Park & Larson, 2014; Park et al., 2013); four studies (Breland et al., 2015; Park et al., 2012; Wu et al., 2020; Li et al., 2013) did not report the data about forced expiratory volume in one second. Consequently, these studies could not provide a definite measure for the severity of COPD (Breland et al., 2015; Li et al., 2013; Park et al., 2012; Wu et al., 2020). We did not identify any studies that investigated the pediatric patient populations.
Theoretical Frameworks
Two studies used the Symptom Management Theory (SMT) as a theoretical framework (Srirat et al., 2014, 2015), and one study used the theory of unpleasant symptoms (TOUS) as a theoretical framework (Park et al., 2012). The remaining seven studies did not identify theoretical frameworks in their studies.
Approaches for Symptom Selection in Cluster Identification
Two approaches of symptom selection in cluster identification were first proposed by Xiao (2010): the “most common symptom approach” and the “all-possible symptom approach.” The “most common symptom approach” is known as “a priori” cluster identification, wherein researchers first selected several commonly experienced symptoms, assuming that these most common symptoms could be grouped as a cluster (Xiao, 2010). Generally, the number of symptoms in a cluster is small, with most having two–four symptoms (Given et al., 2001; Miaskowski & Lee, 1999; Reyes-Gibby et al., 2006; So et al., 2009). In this approach, the biggest limitation was whether it was sufficient to select only the most common symptoms in cluster identification (Xiao, 2010). In this systematic review, Lim et al. adopted this approach to select symptoms for cluster identification. Additionally, they selected the most common symptoms such as dyspnea, depression, anxiety, fatigue, sleep disturbance, dry mouth, and decreased physical function in the Korean COPD population, and these symptoms were categorized into symptom clusters (Lim et al., 2017). In addition, Park and Larson (2014) selected four main symptoms, namely dyspnea, anxiety, depression, and fatigue experienced by patients with COPD in their cluster identification. Park et al. (2013) similarly adopted this approach to select the most common symptoms, namely dyspnea, anxiety, depression, and fatigue, in determining symptom clusters in patients with severe COPD.
Compared with the “most common symptom approach,” the “all-possible symptom approach,” which was used in 7 (Breland et al., 2015; Li et al., 2013; Park et al., 2012; Srirat et al., 2014, 2015; Wu et al., 2020; Yang et al., 2020) of the 10 studies reviewed, targets all potential symptoms that patients with COPD might experience when identifying clusters. Rather than simply selecting the most common symptoms, it yields the results of symptom clusters after statistical analysis rather than assuming clusters before empirical methods (Xiao, 2010). The number of symptoms in a cluster and the number of symptom clusters were more than those in the “most common symptom approach,” wherein the number of symptom clusters exceeded more than three in several studies (Jarden et al., 2009; Kim et al., 2009; Molassiotis et al., 2010).
Symptom Measurement
Table 4 shows the symptom measures of the included studies. A total of four of the 10 studies used the Memorial Symptom Assessment Scale (MSAS) to assess symptoms (Li et al., 2013; Park et al., 2012; Wu et al., 2020; Yang et al., 2020); 2 of the 10 studies used the Bronchitis Emphysema Symptom Checklist (BESC) to assess symptoms (Srirat et al., 2014, 2015). Only one study used the Beck Anxiety Inventory to examine anxiety symptoms in the COPD population (Breland et al., 2015). Lim et al. used more than one instrument (seven) for symptom cluster analysis among the Borg scale, the Functional Assessment of Chronic Illness Therapy–Fatigue, the Beck Depression Inventory (BDI), the Spielberger Anxiety Inventory (SAI), the Sleep Scale A, the visual analogue scale for dry mouth, and the Karnofsky Performance Scale (KFS) (Lim et al., 2017).
Summary of Measures.
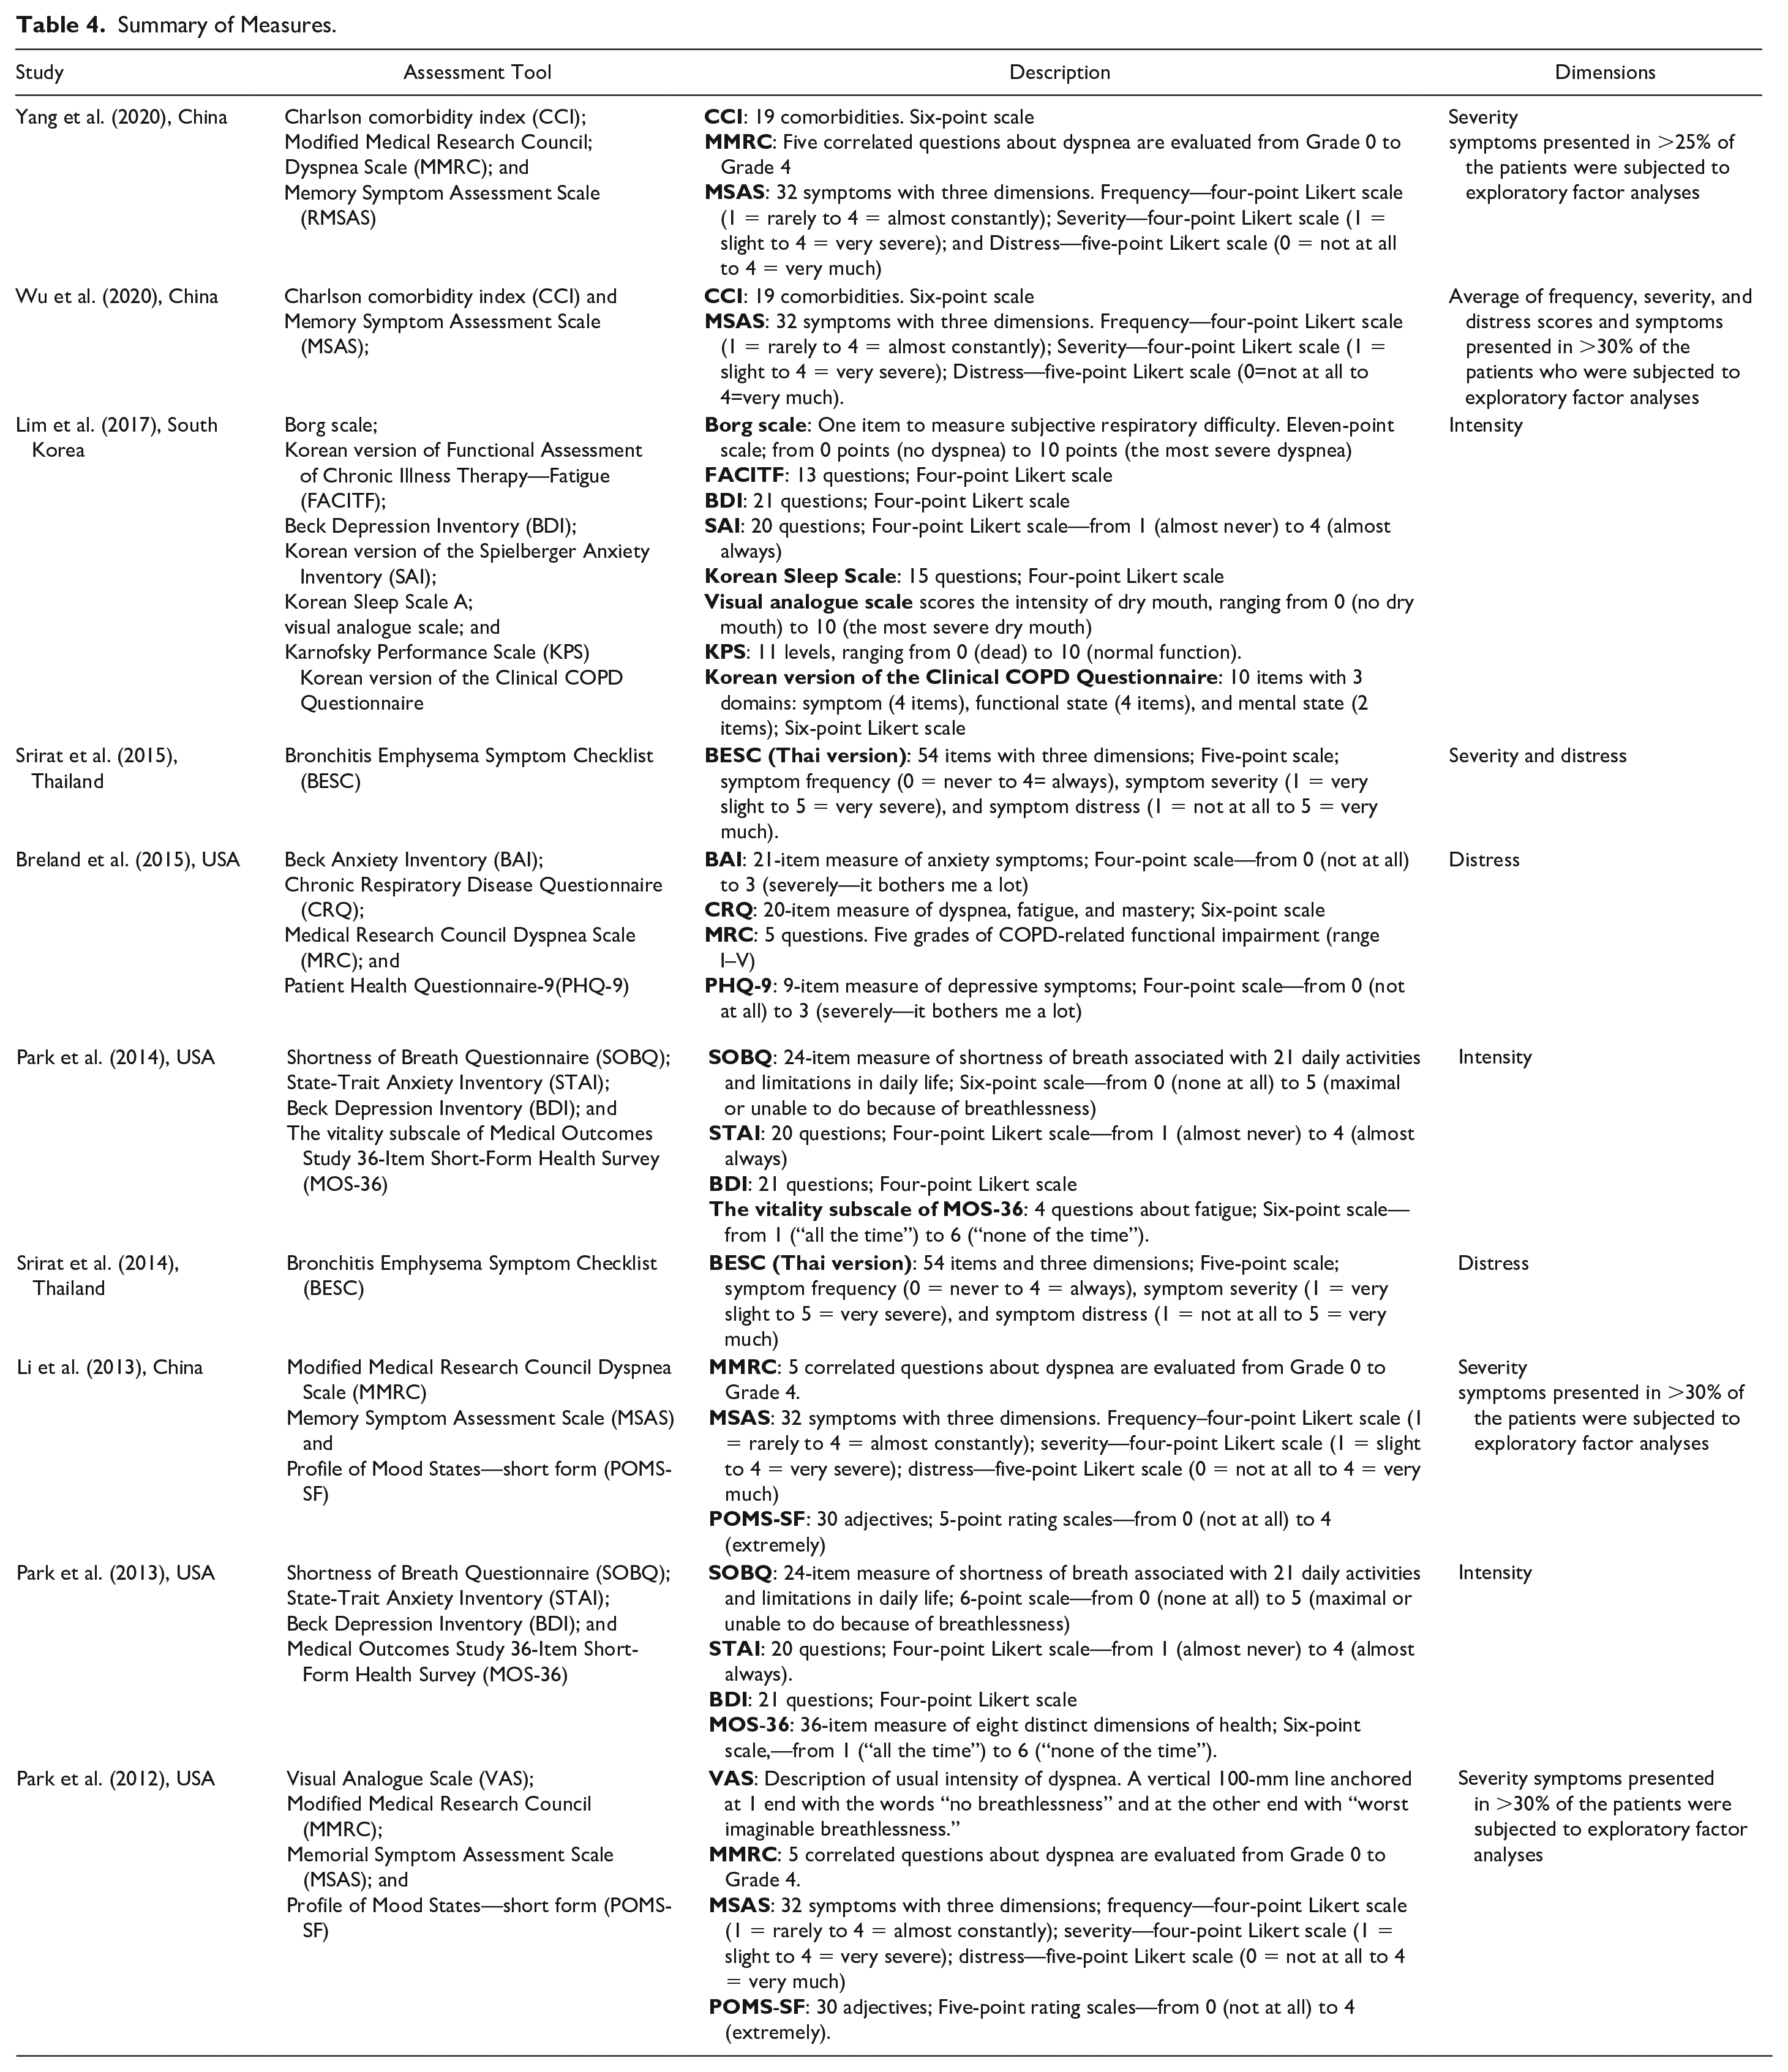
Two studies (Park & Larson, 2014; Park et al., 2013) used the same four instruments to measure symptoms. Specifically, the Shortness of Breath Questionnaire was used to measure dyspnea; the State-Trait Anxiety Inventory was used to assess anxiety; the BDI was used to evaluate depression; and the vitality subscale of the Medical Outcomes Study 36-Item Short-Form Health Survey (MOS-36) was used to assess fatigue.
Dimension
Detailed information on symptom dimensions is shown in Table 4. Four studies evaluated symptom-related severity (Li et al., 2013; Park et al., 2012; Srirat et al., 2015; Yang et al., 2020), three studies measured distress of symptoms (Breland et al., 2015; Srirat et al., 2014, 2015), and three studies evaluated symptom intensity (Lim et al., 2017; Park & Larson, 2014; Park et al., 2013). Symptom intensity is an evaluation of the perceived severity of symptoms (Armstrong, 2003); therefore, these studies measured the same symptom dimension. Two studies were multidimensional, one assessed two dimensions (severity and distress) (Srirat et al., 2015) and the other assessed three dimensions (severity, frequency, and distress) (Wu et al., 2020).
Statistical Methods for Identifying Symptom Clusters
In the previous section, “most common symptom approach” and “all-possible symptom approach” were proposed to select symptoms. The “most common symptom approach” and “all-possible symptom approach” adopted their own statistical methods for cluster identification.
The statistical method used most in the “most common symptom approach” was “clustering by a correlation between symptoms: (Chan et al., 2005; So et al., 2009). Lim et al. used this statistical approach to identify symptom clusters that examined the inter-item correlation between these symptoms, using the Spearman rank correlation (Lim et al., 2017). An alternative statistical method in the most common symptom approach involves identifying subgroups of people with similar symptom experiences based on a specific symptom cluster (Meeusen et al., 2018; Miaskowski et al., 2017; Xiao, 2010). Two studies used this statistical method to identify subgroups of people based on a specific symptom cluster (dyspnea–anxiety–depression–fatigue) (Park & Larson, 2014; Park et al., 2013). Specifically, Park et al. identified subgroups of patients with COPD, using hierarchical cluster analysis methods associated with four symptoms (dyspnea–anxiety–depression–fatigue) and examined their effect on mortality and health care use (Park & Larson, 2014). In addition, Park and colleagues identified two subgroups of people with COPD: High levels of symptoms and low levels of symptoms (Park et al., 2013).
The statistical methods used to identify symptom clusters in the “all-possible symptom approach” varied across the seven studies (Breland et al., 2015; Li et al., 2013; Park et al., 2012; Srirat et al., 2014, 2015; Wu et al., 2020; Yang et al., 2020). Three studies used principal component analysis (PCA) (Breland et al., 2015; Srirat et al., 2014, 2015), and four studies used exploratory factor analysis (EFA) (Li et al., 2013; Park et al., 2012; Wu et al., 2020; Yang et al., 2020). Furthermore, two studies used EFA in conjunction with hierarchical cluster analysis to identify symptom clusters (Li et al., 2013; Park et al., 2012).
Symptom Clusters
The four main symptom groupings reported in the 10 studies are as follows: (a) respiratory-related symptom cluster (short of breath/dyspnea/shallow breathing/difficulty breathing/feeling of chocking + lack of energy/feeling drowsy/fatigue + dry mouth + sweat); (b) emotional cluster (anxiety/feeling irritable/feeling nervous + depression/feeling worried/feeling sad/I don’t like myself/feel like a cripple); (c) disturbed sleep-related cluster (pain/numbness/pins and needles feelings/cough + difficulty sleeping/disturbed sleep); (d) urination–constipation cluster (problems with urination + constipation). Further details are shown in Table 5.
Most Commonly Occurring Symptom Combinations.
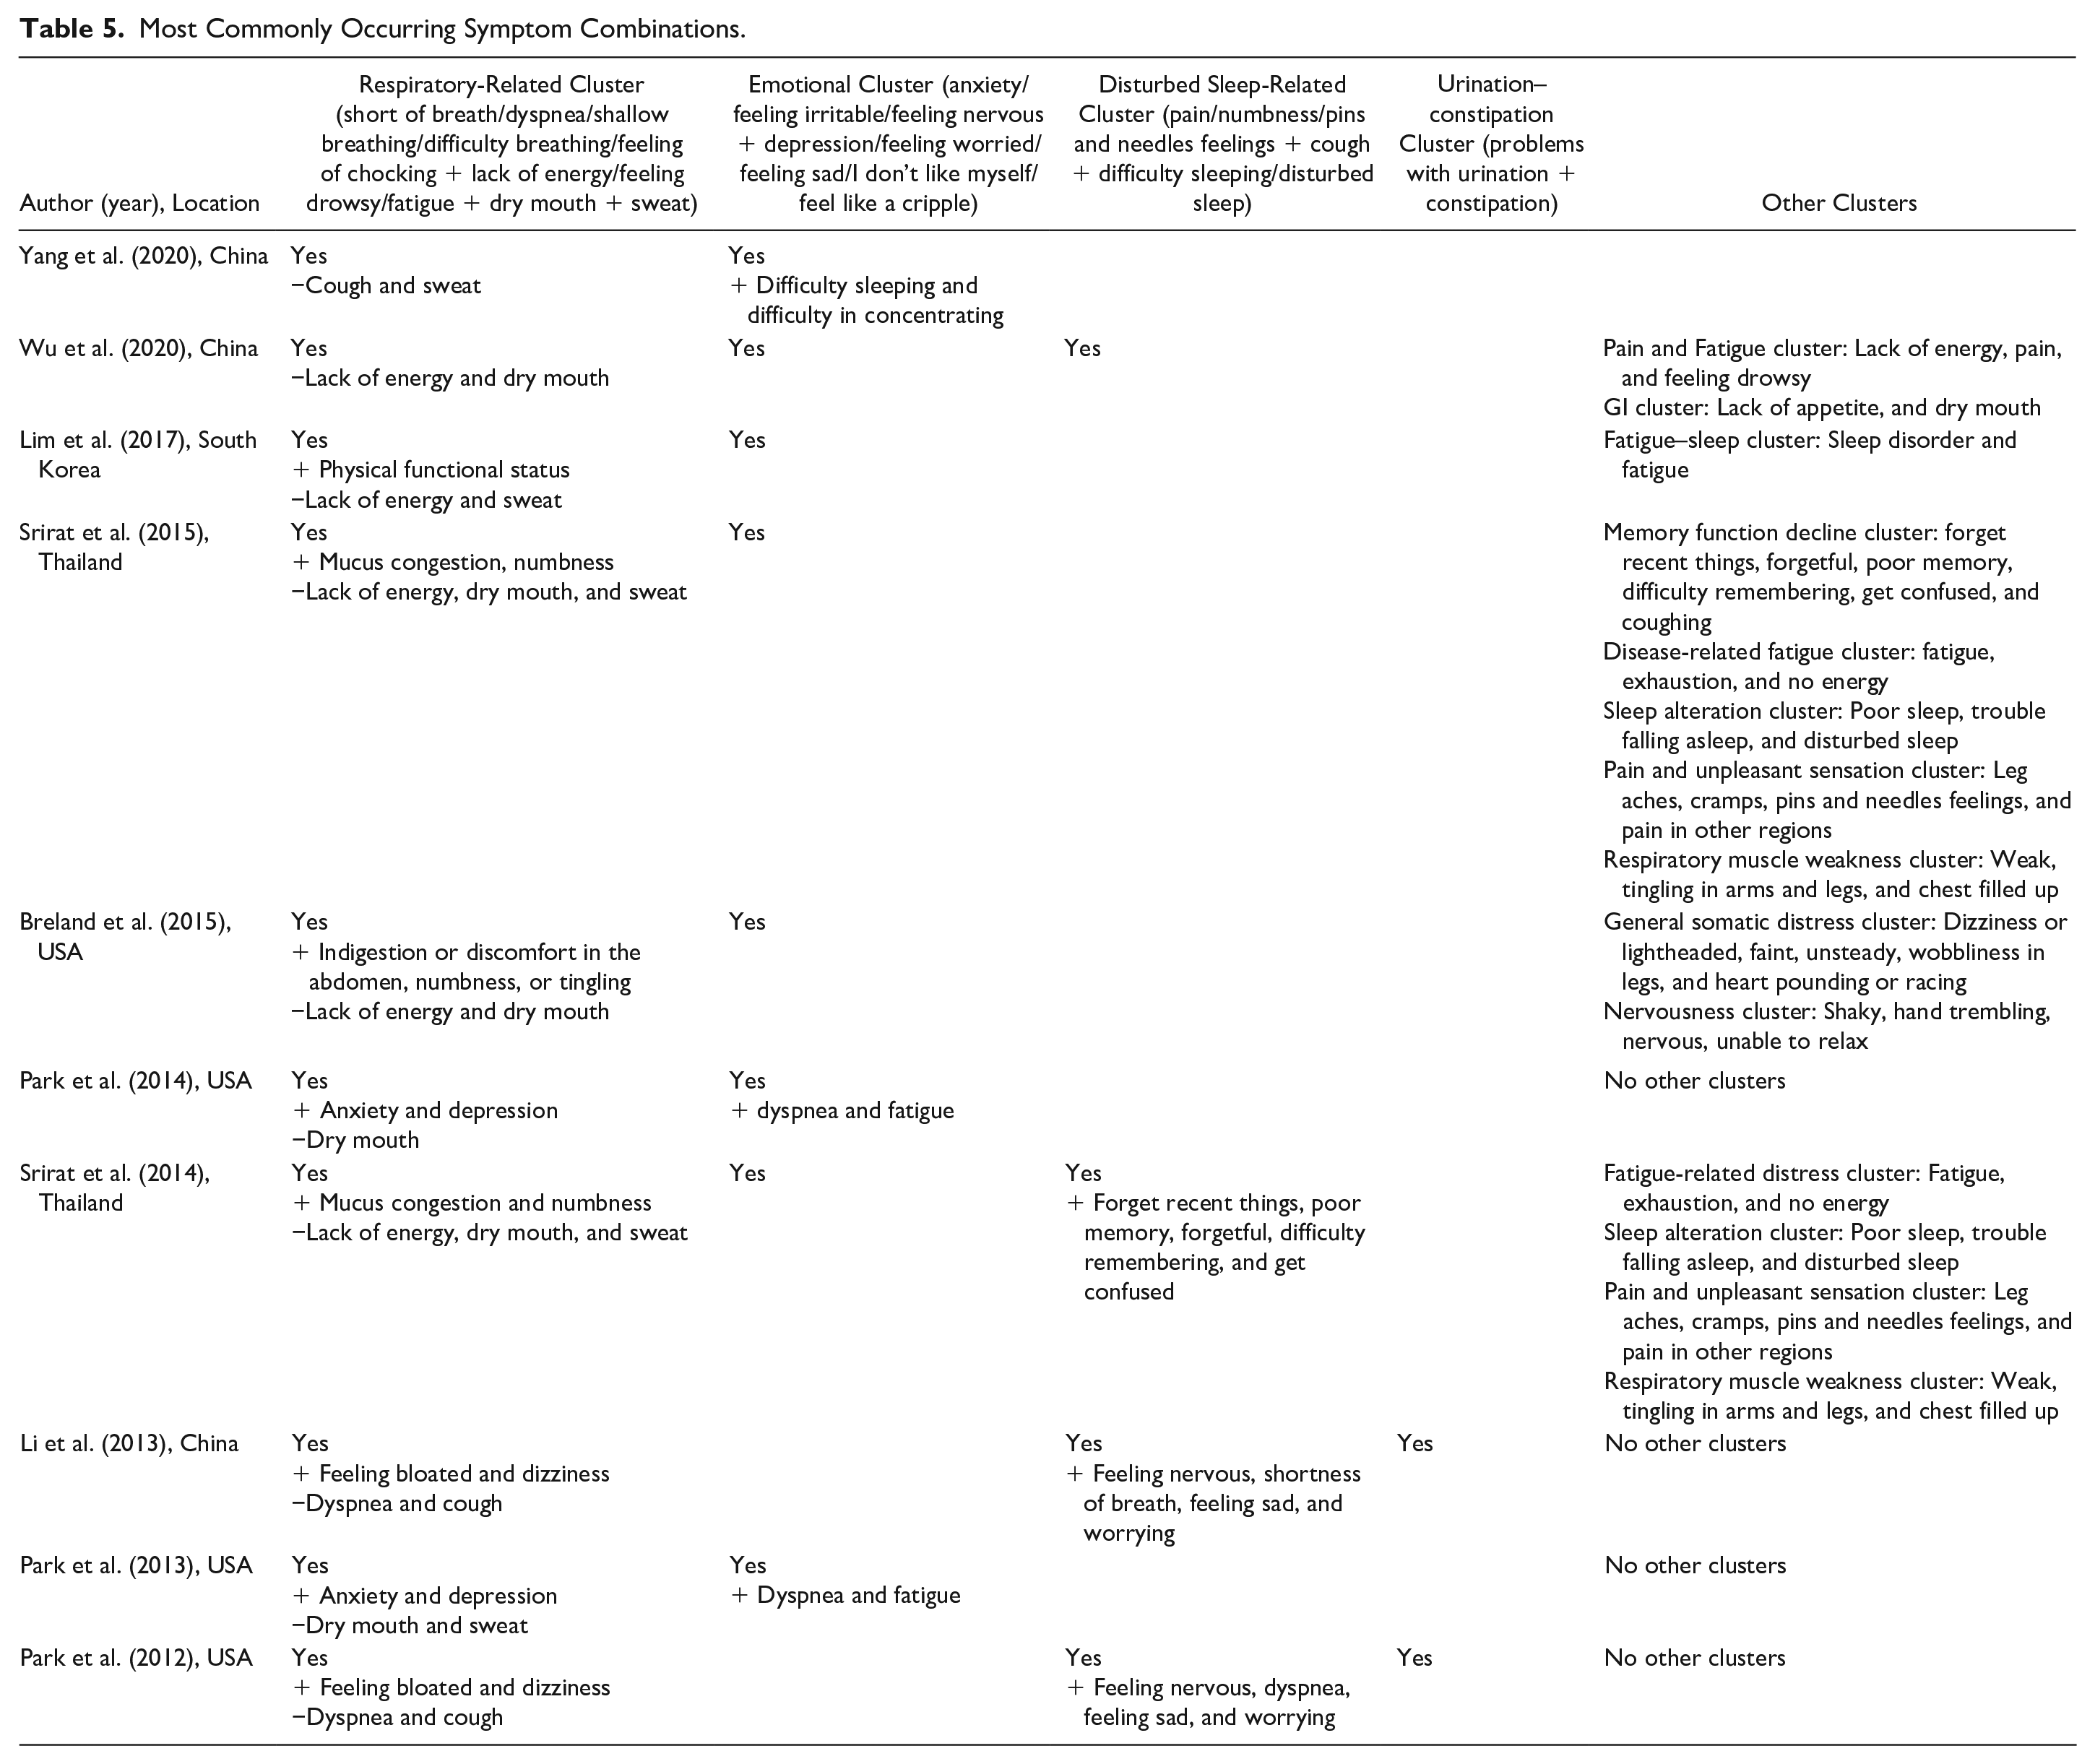
The general symptoms of respiratory-related symptom clusters have been reported in 10 studies (Breland et al., 2015; Li et al., 2013; Lim et al., 2017; Park & Larson, 2014; Park et al., 2012, 2013; Srirat et al., 2014, 2015; Wu et al., 2020; Yang et al., 2020). Eight studies reported that this cluster coexisted with additional symptoms of physical functional status, mucus congestion, numbness, indigestion or discomfort in the abdomen, anxiety, depression, feeling bloated, and dizziness (Breland et al., 2015; Li et al., 2013; Lim et al., 2017; Park & Larson, 2014; Park et al., 2012, 2013; Srirat et al., 2014, 2015). The emotional cluster was reported in eight studies (Breland et al., 2015; Lim et al., 2017; Park & Larson, 2014; Park et al., 2013; Srirat et al., 2014, 2015; Wu et al., 2020; Yang et al., 2020). Of these studies, five identified this cluster to occur independently (Breland et al., 2015; Lim et al., 2017; Srirat et al., 2014, 2015; Wu et al., 2020), and three identified the additional symptoms that were present within this cluster, including difficulty in sleeping, difficulty in concentrating, dyspnea, and fatigue (Park & Larson, 2014; Park et al., 2012, 2013). Disturbed sleep-related clusters were reported in four studies (Li et al., 2013; Park et al., 2012; Srirat et al., 2014; Wu et al., 2020), with only one study identifying that it occurred independently (Wu et al., 2020). Moreover, two studies reported a urination–constipation cluster experienced by COPD patients (Li et al., 2013; Park et al., 2012), which occurred independently of other studies (Li et al., 2013; Park et al., 2012).
Factors Associated with Symptom Clusters
Across 10 studies, articles investigated factors associated with symptom clusters, including demographic factors (e.g., age, gender, and marital status), clinical factors (e.g., COPD stage and comorbidities), and biological factors. Among the demographic factors, older age and low income were positively associated with the “respiratory–functional cluster” (Lim et al., 2017); older age, lower monthly income, and lower educational level were positively associated with the “fatigue–sleep cluster” (Lim et al., 2017). Low body mass index, nonuse of inhaled drugs, and lax inhaled drug therapy were significantly associated with the “respiratory functional cluster” (Yang et al., 2020). Among the clinical factors, mMRC scores (severity of dyspnea) and comorbidity index (CCI) were significantly associated with the “emotional cluster” (Yang et al., 2020). The inflammatory biomarker C-reactive protein (CRP) is a biological factor significantly associated with the “emotional cluster” (Yang et al., 2020).
Discussion
In this review, we systematically identified, summarized for the first time, and critically appraised the composition of symptom clusters among patients with COPD, the underlying theoretical frameworks associated with the approaches that have been used to explain and classify these clusters, assessment instruments to quantify symptoms, statistical methods to identify symptom clusters, and factors associated with symptom clusters. We reviewed 10 studies and identified that symptom clusters varied considerably, depending on their combination. Differences in methodology and symptom assessment tools were the main issues that limit the inferences that can be drawn from the findings we present.
In this review, TOUS and SMT were utilized as COPD symptom cluster theoretical frameworks. Specifically, TOUS has three major components: (a) influencing factors, (b) symptoms, and (c) performance. In the TOUS framework, symptoms can occur as separate entities or concurrently as a symptom cluster and include four dimensions: timing, intensity, quality, and distress (Lenz et al., 1997). The main aim of the TOUS model was to improve the understanding of the symptom experience as being in a multidimensional, contextual way and to assist in providing information for developing a means to manage or prevent unpleasant symptoms and reduce their negative effects (Corwin et al., 2014). Underpinning this theory, Park et al. (2012) specified the key variables of influencing factors associated with the COPD symptom cluster. However, there are controversies related to this theory. First, some investigators suggest that this theory does not include an intervention component within the model (Lenz, 2018). Instead, it is assumed that many of the components and relationships in the TOUS could be used for targeted interventions. Second, based on the linear presentation of influencing factors, symptoms, and outcomes, this theory does not demonstrate a time component because the symptoms associated with COPD may vary considerably over time, and the variability in one symptom may interact or influence others (Barsevick, 2016). Third, the ways of treating psychological factors have caused some conceptual confusion (Almutary et al., 2017). For example, some researchers considered symptoms such as depression and anxiety to be influencing factors (Tankumpuan et al., 2015), while others viewed anxiety and/or depression as a symptom itself (Herr et al., 2015).
The SMT includes three interactive components of symptom management: Symptom experience, symptom management strategies, and symptom outcomes. Dodd and his colleagues subsequently revised this model to focus on symptom management within the wider nursing context, which includes the following interrelated domains: Person–environment–health and illness (Dodd et al., 2001a). The SMT identifies explicit phenomena, proposes specific relationships between concepts, and provides a comprehensive framework for considering interventions and outcomes (Hockenberry, 2004). In this review, two studies adopted the SMT theory to guide the selection of symptom dimensions (Srirat et al., 2014, 2015). However, a growing number of researchers have recently introduced the concept of “symptom clusters” into the SMT model, in which the connections between these multiple symptoms in a cluster are not specifically illustrated. For example, which groups of symptoms should be categorized as symptom clusters, how to identify which of the multiple symptoms are part of a cluster, and which symptoms are considered to be more or less important (Dodd et al., 2010). Additionally, this model does not specifically consider other dimensions associated with symptom experience, such as the importance and meaning attributed to multiple symptoms. Moreover, the relationships between multiple symptom experiences and patient-centered outcomes have not been delineated. However, outcome variables within this model mirror the TOUS model, for example, quality of life. While these two models focus on symptom clusters, the relationships among these symptom clusters are not clearly illustrated. Therefore, limitations remain in relation to these frameworks, and there is a need to develop and test a more comprehensive theoretical model specific to COPD-related symptoms.
The most frequently used instrument was the MSAS, which was used in 40.0% of the reviewed studies. The original version of the MSAS was developed to measure 32 cancer-related symptoms (Portenoy et al., 1994a, 1994b). It evaluates multiple dimensions of the symptom experience, such as frequency, occurrence, severity, and distress (Portenoy et al., 1994b). Of the four studies that used the MSAS, one study identified five symptom clusters (Wu et al., 2020), two studies identified three symptom clusters (Li et al., 2013; Park et al., 2012), and one study identified two symptom clusters (Yang et al., 2020). The “respiratory-related cluster” was identified in four studies (Li et al., 2013; Park et al., 2012; Wu et al., 2020; Yang et al., 2020). The inconsistency in the number of symptom clusters and the composition within each cluster in these four studies may be due to the heterogeneity of patients recruited in these studies. BESC, BDI, SAI, Korean Sleep Scale A, and visual analogue scale were used to measure symptoms in other studies, which yielded inconsistent symptom clusters. Thus far, no “gold standard” assessment tool is available to evaluate symptom clusters in patients with chronic conditions (Miaskowski et al., 2017). In this review, half of the included studies measured symptom severity. However, a report from an expert panel called for comprehensive evaluation of symptom clusters and stated that there is currently no clear answer about which symptom dimension is most useful for advancing symptom cluster science (Miaskowski et al., 2017). Moreover, cutoffs used to determine whether symptoms had sufficient prevalence to be included in symptom clusters were also inconsistent.
This review examined two approaches to symptom selection for cluster identification in people with COPD. The “all-possible symptom approach” included any potential symptoms that people living with COPD experience. Most studies (Breland et al., 2015; Li et al., 2013; Park et al., 2012; Srirat et al., 2014, 2015; Wu et al., 2020; Yang et al., 2020) have used this approach. However, a limitation of this approach is that it lacks an explanation of the clinical meaning of symptom clusters identified by statistical methods (Ward Sullivan et al., 2018). While the “most common symptom approach” represents a way to identify symptom clusters, the main limitation is whether it is reasonable or reliable, or sufficient to select only the most common COPD symptoms present in the cluster identification (Xiao, 2010). Therefore, researchers must determine which approach should be adopted based on their study objectives.
The studies included in this review indicated that EFA and PCA, based on clustering symptoms by underlying factors and components, are the most common analytical methods. However, there were inconsistent symptom cluster results across the seven studies (Breland et al., 2015; Li et al., 2013; Park et al., 2012; Srirat et al., 2014, 2015; Wu et al., 2020; Yang et al., 2020) because of different patient populations, assessment instruments, and statistical methods. In addition, it is possible that the identified symptom clusters might not have a rational explanation because the reported clusters depend only on the components or factors from the statistical procedures. For example, only one study (Wu et al., 2020) identified the “GI” symptom cluster in this review, which was not defined in other studies that aimed to identify symptom clusters in people with COPD (Breland et al., 2015; Li et al., 2013; Lim et al., 2017; Park & Larson, 2014; Park et al., 2012, 2013; Srirat et al., 2014, 2015; Yang et al., 2020). The “GI” symptom cluster was the most common symptom cluster identified in cancer patients (Huang et al., 2016; Molassiotis et al., 2010; Yates et al., 2015). Specifically, the composition of “GI” symptom cluster in this review included lack of appetite, and dry mouth was the common symptom in people with COPD (Maddocks et al., 2017). Although this is an initiation in defining the “optimal” method, such as EFA and PCA, there is still a lack of consensus on which statistical method should be used to identify symptom clusters in this field (Miaskowski et al., 2017).
Cluster analysis was used to identify subgroups of people with similar experiences based on a specific symptom cluster. This method may be clinically intuitive because it translates these findings into clinical practice, and people with a similar symptom profile can be more easily identified and interpreted (Miaskowski et al., 2006). Park et al. (2013, 2014) used this statistical method to identify subgroups based on four symptom ratings. Recent research has focused on COPD phenotype, which refers to a single or a combination of disease attributes that describe differences between COPD patients based on clinically significant parameters such as symptoms, exacerbation, response to treatment, rate of disease progression, and mortality (Christensen et al., 2016). Based on our current knowledge, we believe that there is evidence for an overlap between COPD phenotypes and symptom cluster research. In our opinion, subgroup identification based on symptom ratings is equal to the COPD symptom phenotypes. Therefore, we assume that studies that use statistical methods to identify subgroups based on symptom ratings could be included in the field of symptom cluster research.
To date, no qualitative studies have been conducted to examine patients’ subjective experiences, meanings, and the impacts of symptom clusters among people living with COPD. Studies of this nature, which look beyond symptom associations, and explore in detail the perspectives of peoples’ lived experiences of their symptom clusters, may help in forming a stronger conceptual basis for existing symptom clusters (Bennion & Molassiotis, 2013). Meanwhile, the composition of symptom clusters may or may not be stable through the trajectory of the disease (Dodd et al., 2001a). Kirkova et al. highlighted the notion that the cross-sectional study design limited the accuracy of examining the variability in symptom interrelationships (Kirkova et al., 2010). Consequently, longitudinal study designs are required to explore the stability of symptom clusters over the disease course.
Surprisingly, only few demographic and clinical factors associated with symptom clusters were identified in this review, where only age and monthly income were observed as being as significantly associated with the “respiratory–functional cluster”; age, educational level, and monthly income were related to “fatigue–sleep cluster”; and mMRC scores and comorbidity index were significantly associated with the “emotional cluster.” This is consistent with the findings of oncology studies (Gwede et al., 2008; Miaskowski et al., 2006; Pud et al., 2008). The heterogeneity of patients recruited to studies and the inconsistent statistical methods used may contribute to the absence of more clinically meaningful factors. Only one study in this review used linear regression analysis to examine the relationship between the biological factors and symptom clusters in people with COPD, specifically identifying that the CRP level was significantly associated with the “emotional cluster” (Yang et al., 2020). Dodd and colleagues identified that the coexisting symptoms might share common biological underpinnings (Dodd et al., 2001a). Moreover, inflammatory pathways have been postulated to explain the biology of clustering of symptoms in clinical populations (Kelly et al., 2016). Understanding the biological mechanisms associated with symptom clusters may inform the future development and evaluation of targeted therapeutics and personalized interventions to mitigate COPD-related symptoms (Kim & Malone, 2019). Therefore, it is vital to explore the biological basis of clustering of COPD-related symptoms in more studies that are adequately powered. In addition, conducting more longitudinal studies would inform and validate the relationship between symptom clusters and specific biomarkers (Miaskowski & Aouizerat, 2007). The knowledge gained from these findings will critically inform relevant health care providers and improve the health-related quality of life of patients with COPD (Cazzola & Novelli, 2010).
Beyond the limitations already discussed, the items and dimensions of symptom assessment tools varied considerably across the 10 studies that may influence cluster composition. In addition, notably, only two studies (Wu et al., 2020; Yang et al., 2020) in this review reported data associated with comorbidities in people with COPD. The absence of this information is critical because it has the potential to influence a range of symptoms associated with these conditions and should therefore be viewed as a confounding factor in symptom experience (Fan et al., 2007).
In conclusion, this review identified inconsistencies in the composition of symptom clusters across studies due to variations in study design, assessment tools, and statistical methods. Future studies should attempt to arrive at a common definition of symptom clusters that are theoretically derived and standardize the criteria for symptoms to be included in the clusters. In addition, there is an urgent need to conduct qualitative studies in this research field that will provide a deeper patient-centered perspective into the living experience of multiple symptoms present in people with COPD. This review also provides information about the associated factors and biomarker CRP linked with COPD symptom clusters. The associated factors found in this review may help nurses identify at-risk patients and guide their patients for treatment-seeking and symptom self-management behaviors. Future investigations are warranted to identify and validate potential factors and plan optimal interventions to advance science.
Footnotes
Declaration of Conflicting Interests
The author(s) declared no potential conflicts of interest with respect to the research, authorship, and/or publication of this article.
Funding
The author(s) disclosed receipt of the following financial support for the research, authorship and/or publication of this article: This study has received funding from the China Scholarship Council (grant numbers 201806170005).