
Abstract
This study tested a ‘wise’ intervention (quick prompt of a specific psychological mec) in acute care hospital units to improve nurses’ hand hygiene compliance (HHC). A multiple baseline design in two medical-surgical teaching hospitals in the United States. Hand hygiene data was collected using an electronic compliance monitoring system with sensors placed in doorways and on corresponding soap and alcohol-based hand rub dispensers. The outcome measure was the proportion of opportunities in which HH was undertaken by staff per week in each unit. A quick-and-easy psychological prime to reinvigorate professional identity. Interrupted time series analysis using a quasi-Poisson regression model with statistical process control charts for each unit. A statistically significant increase in HHC rates that was sustained for months post-intervention. However, the patterns by unit were not statistically significant once temporal trends were considered. Other factors, such as the unit type and the use of incentives could have impacted the results. These analyses suggest that the aggregate impact should not be taken as evidence of intervention effectiveness. This study therefore cannot be considered to have provided a strong foundation for use of a ‘wise’ intervention, despite its relatively small financial, logistical and psychological cost.
Introduction
Healthcare-associated infections (HAIs) are a major threat globally to patient safety, often resulting in complications of care to millions of patients (Erasmus et al., 2010; Kamble, 2020). The causes of HAIs can be attributed to the health systems and processes of care provision as well as to behavioural practices (WHO, 2006). Hand hygiene (HH) is recognized as the single most important measure for preventing the spread of HAIs with substantial evidence supporting the association between increased hand hygiene compliance (HHC) and reduced HAI rates (Huis, 2013; Price et al., 2018; Seo et al., 2019; Whitby et al., 2007).
Although there have been many attempts to increase HHC amongst health care workers (HCWs), in the great majority of cases these efforts have led to initial increases in HHC rates but have not produced sustained behavioural changes without an ongoing intervention (Harne-Britner et al., 2011; Mayer et al., 2011; Naikoba & Hayward, 2001; Sands & Aunger, 2020), although more recent interventions seem to generally be more successful. (Clancy et al., 2021; Lambe et al., 2019) Further, more complex, multi-component interventions are typically seen as being more effective, although they can be more expensive and intensive to implement. (Alshehari et al., 2018; Lee et al., 2019; Nalule et al., 2022; Staines et al., 2018) There is thus a need for an effective but relatively simple and scalable intervention that can sustainably improve HHC in hospital settings.
The present study sought to fill this gap by testing an innovative, low-cost HH intervention to increase HCW’s—more specifically nurses’—HHC rates sustainably. The aim of this study—called the Mainspring study— was to test an intervention strategy in acute care hospital units to improve nurses’ HHC compliance and to compare the short-term and sustained effects of this novel strategy. The focus of this evaluation is on the assessment of the intervention’s impact on HHC and the intervention’s relevance to healthcare settings. Behaviour Centred Design (BCD) was used to uncover novel avenues to change behaviour, as well as to guide the intervention development process itself. (Aunger & Curtis, 2016) The intervention consisted of reading a form which involved answering several questions, designed to have several psychological effects which might stimulate increased compliance with hand hygiene expectations. It centred on the use of threat to professional identity to prompt change (i.e. that carers were not properly performing their roles). The intervention includes a health message which explained that, based on the scientific literature, nurses were less likely to perform HH at room entry than at room exit, and drew attention to the incongruity between the nurses’ current HH practice and their required practice (as determined by WHO standards for HH in hospital contexts). This message was intended to surprise the nurses. To decrease defensiveness in response to this threat to their professionalism and, in turn, increase openness to the need to improve their HH practice, a values affirmation exercise was included as the first part of the intervention. This exercise first asks which values the respondent believes can be associated with their professional role as a carer (e.g. friendship, honesty, courage), and then asks which of these values are personally important to them, and if they can remember a particular episode where this value was made manifest (such as particularly empathic prior treatment of a vulnerable but dangerously infective patient as evidence of bravery). This was followed by an implementation cue association exercise, which simply queries whether there is some object (e.g. door handle, poster) in their place of work which they believe could effectively trigger a desire to handwash. This should then be coupled with what psychologists call an ‘implementation intention’ such as telling yourself, ‘As soon as I see [insert name of object] I will tell myself “clean your hands!”’
Together, the features of explicit psychological manipulation in a quick and easy implementation make it an example of a ‘wise’ intervention, a brief intercession that seeks to disrupt a recursive psychological process (in this case the practice of HH), and thus facilitates a positive behavioural experience that leads to later positive outcomes (in this case higher rates of HH behaviour) (Yeager et al., 2014). A description of the intervention is provided in Supplement 1 and follows the Template for Intervention Description and Replication (TIDieR) Checklist to ensure complete description. (Hoffmann et al., 2014) The investigative research (Sands & Aunger, 2020) and creative processes (Sands & Aunger, 2021) undertaken to develop the intervention have been previously described. This paper presents an analysis of the outcomes from an implementation of that intervention. A related paper describes an evaluation of the underlying processes (categorized using the Behaviour Change Techniques of Michie and colleagues (Michie et al., 2015)) thought to underpin the outcomes described here. (Sands & Aunger, 2024) The primary contribution of this study is therefore to provide evidence of whether or not such a quick, easy and simple intervention can sustainably change professional carers’ hand hygiene compliance rates.
Methods
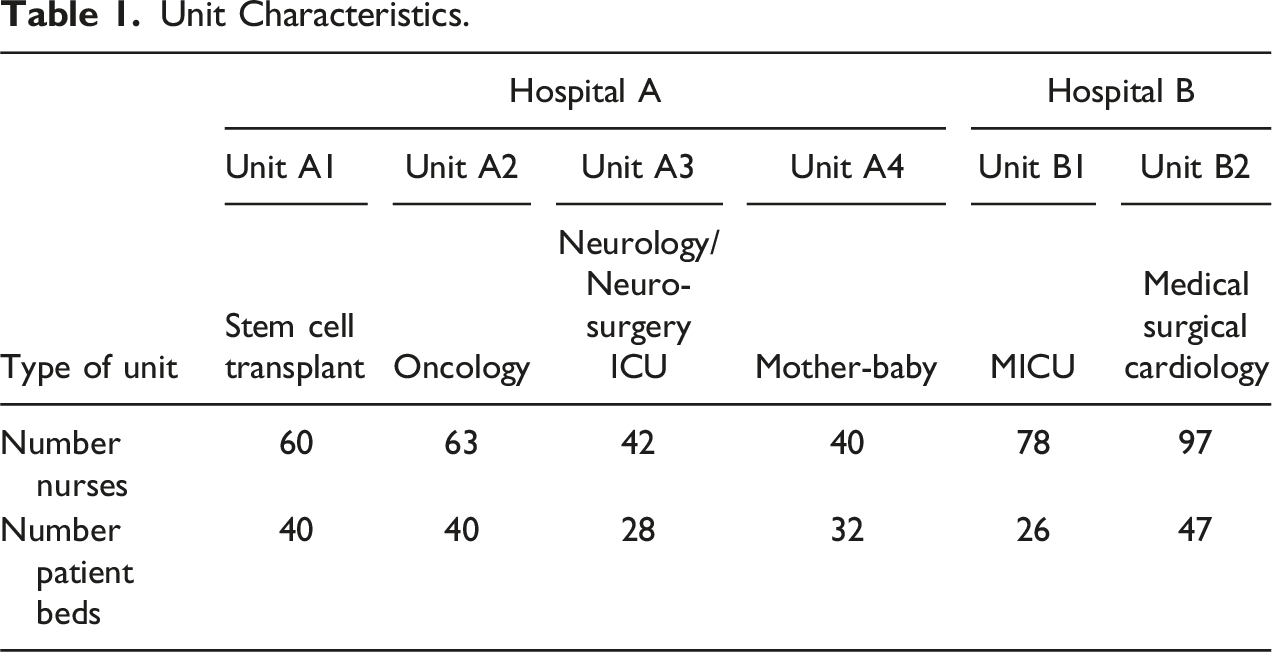
Unit Characteristics.
As described above, the intervention was a self-guided activity taking less than 30 minutes to complete. It was divided into several parts: a values affirmation exercise, HH messaging and choice of an implementation cue. Participants are also given a brief survey six-weeks later (as part of the process evaluation) testing their recall of the HH message, their use of the intention-cue association, and their feelings regarding the intervention. In Hospital A, nurses were directly handed questionnaires and consent forms during shift changeovers or staff meetings. In Hospital B, nurses were alerted to the questionnaire task via an email from the facilitator—with follow-up emails from the units’ nurse managers – which presented them with a link to the questionnaire itself, hosted on a Web site.
The study adopted a multiple baseline design, which has been recognized as a useful experimental design for studying behaviour change (Baer et al., 1968; Kazdin & Kopel, 1975; Watson & Workman, 1981). Each population unit deliberately received the intervention at a different point in time. With this form of time-series design, the same groups can be compared over time by repeatedly measuring and analysing data, with baseline measures acting as the control comparisons. This is the strongest type of design when subjects cannot be randomized across trial arms – in this case, given the small number of units, their varied nature, and hierarchical clustering within hospitals (Alsop et al., 2016).
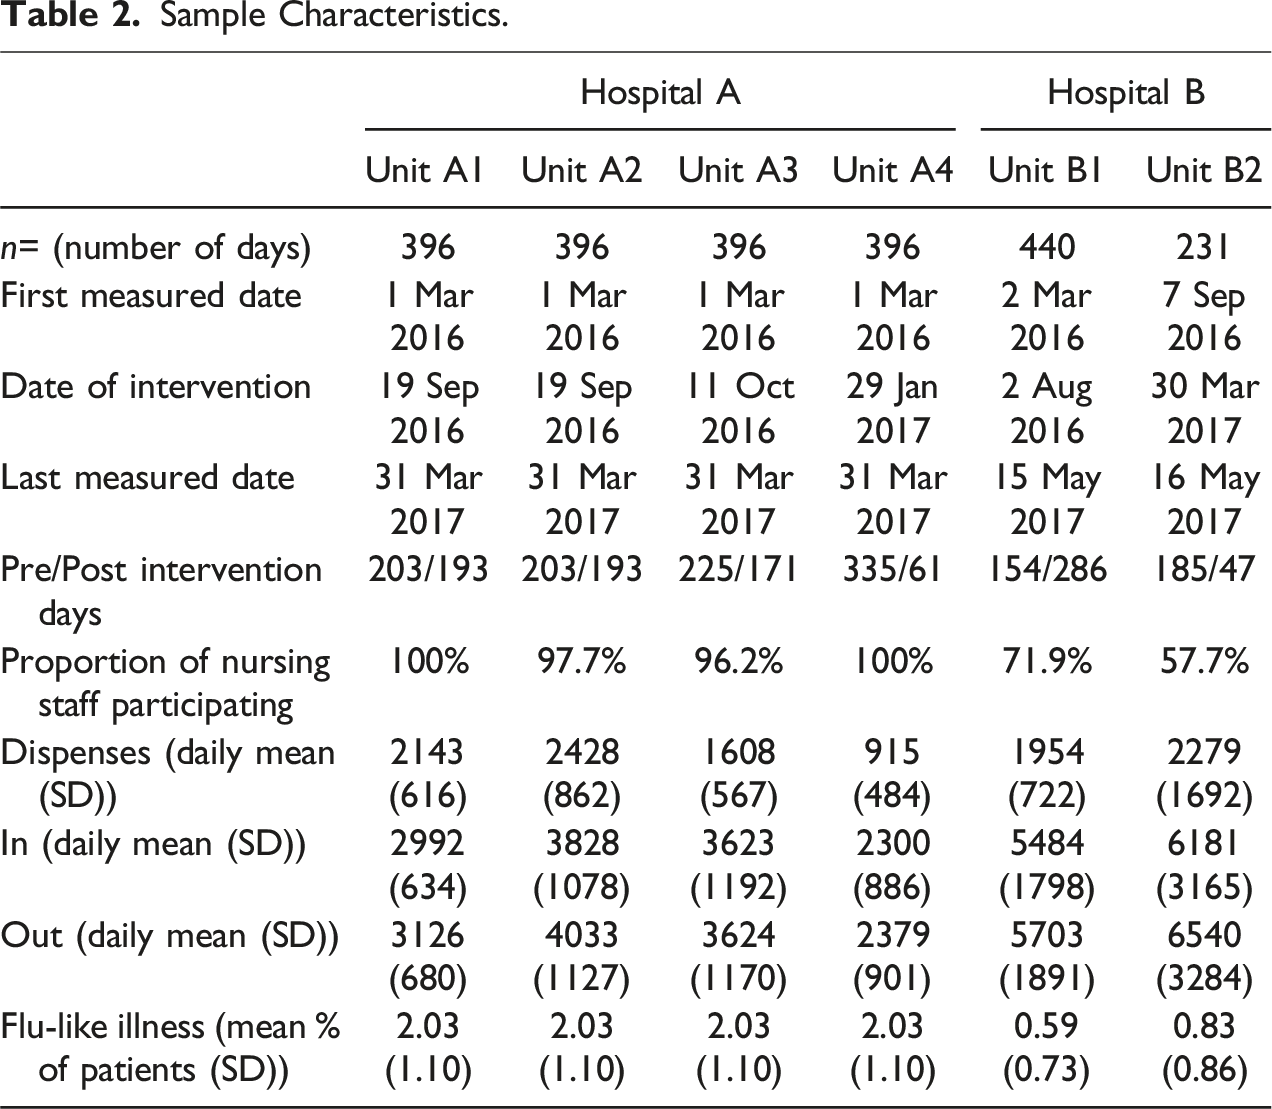
The delivery of the intervention was staggered across time and unit for each hospital, with at least a month in between each implementation session. The hospital units were randomly assigned start dates. The study ran for nine months, with the first hospital unit receiving the intervention in August 2016 and the last hospital unit receiving the intervention in April 2017. Data on influenza-like illness (ILI) over the period of the study was collected from the WHO Web site to act as a control for possible confounding.
The two hospitals were purposively selected as they had the same electronic compliance monitoring (ECM) technology, were in the same geographic area of the United States, were comparable in size and type of care provided, and had not completed or participated in a formal HH intervention in the six months before January 2016, which was necessary to ensure true baseline rates. Hand hygiene compliance was measured through soap and alcohol-based hand rub (ABHR) dispensers fitted with ECM technology. A module in the dispenser recognized, tracked, and transmitted near real-time HH activity data continuously throughout the day. A recent study has shown excellent consistency between ‘gold standard’ personal observation and electronic monitoring of hand hygiene compliance in hospitals. (Gould et al., 2020)
To control for the levels of reported influenza-like illness (ILI) during the study (which might influence HHC independently of the intervention), we obtained the weekly rates of ILI data from the CDC’s virologic surveillance database, which combines information from the U.S. World Health Organization (WHO) Collaborating Laboratories System and the National Respiratory and Enteric Virus Surveillance System (NREVSS). WHO/NREVSS ILI data were available at the State level and for all dates included in the study.
Outcome Measure
The outcome measure was the proportion of opportunities in which HH was undertaken over the course of a week in each unit – that is, rates of HH were calculated by dividing the number of dispenses of soap or sanitizer by the number of entries of a patient room plus the exit counts on each day. An opportunity thus occurred whenever an individual entered or exited a patient room. As the sensors were not able to discriminate between the individuals, all entries and exits into a patient room were counted. However, nurses typically have the most interactions with patients (Lucet et al., 2002) and thus constitute the bulk of entries and exits of a patient’s room due to their role in the hospital and the nature of care provided. The proportions of entries and exits by non-nursing staff and visitors is not expected to change over time. Readings from sensors in patient room doorways and from dispensers in rooms and the hallway were compiled for six months before and after the intervention (where available). Proportion of opportunities was calculated as the number of dispenser pushes divided by the number of entries and exits during a 24-hour period on a unit.
Data Cleaning
Entries for the same sensor and the same timestamp, which recorded to the second, were considered duplicates and removed. Unfortunately, several date ranges demonstrated drastic, discontinuous jumps in calculated rates of HHC, including for all Hospital A units—A1, A2, A3, and A4—from March 1, 2016 to March 31, 2017 and for Hospital B’s unit B2 from October 27 to November 15, 2016. The (likely technological or administrative) cause of these discrepancies could not be definitively ascertained, so data outside of the above ranges was excluded from the analysis for Hospital A’s units (as the intervention took place during this timeframe), while data from Hospital B’s Unit B2 was excluded from its relatively small (less than 3 week) discontinuity.
Statistical Analysis
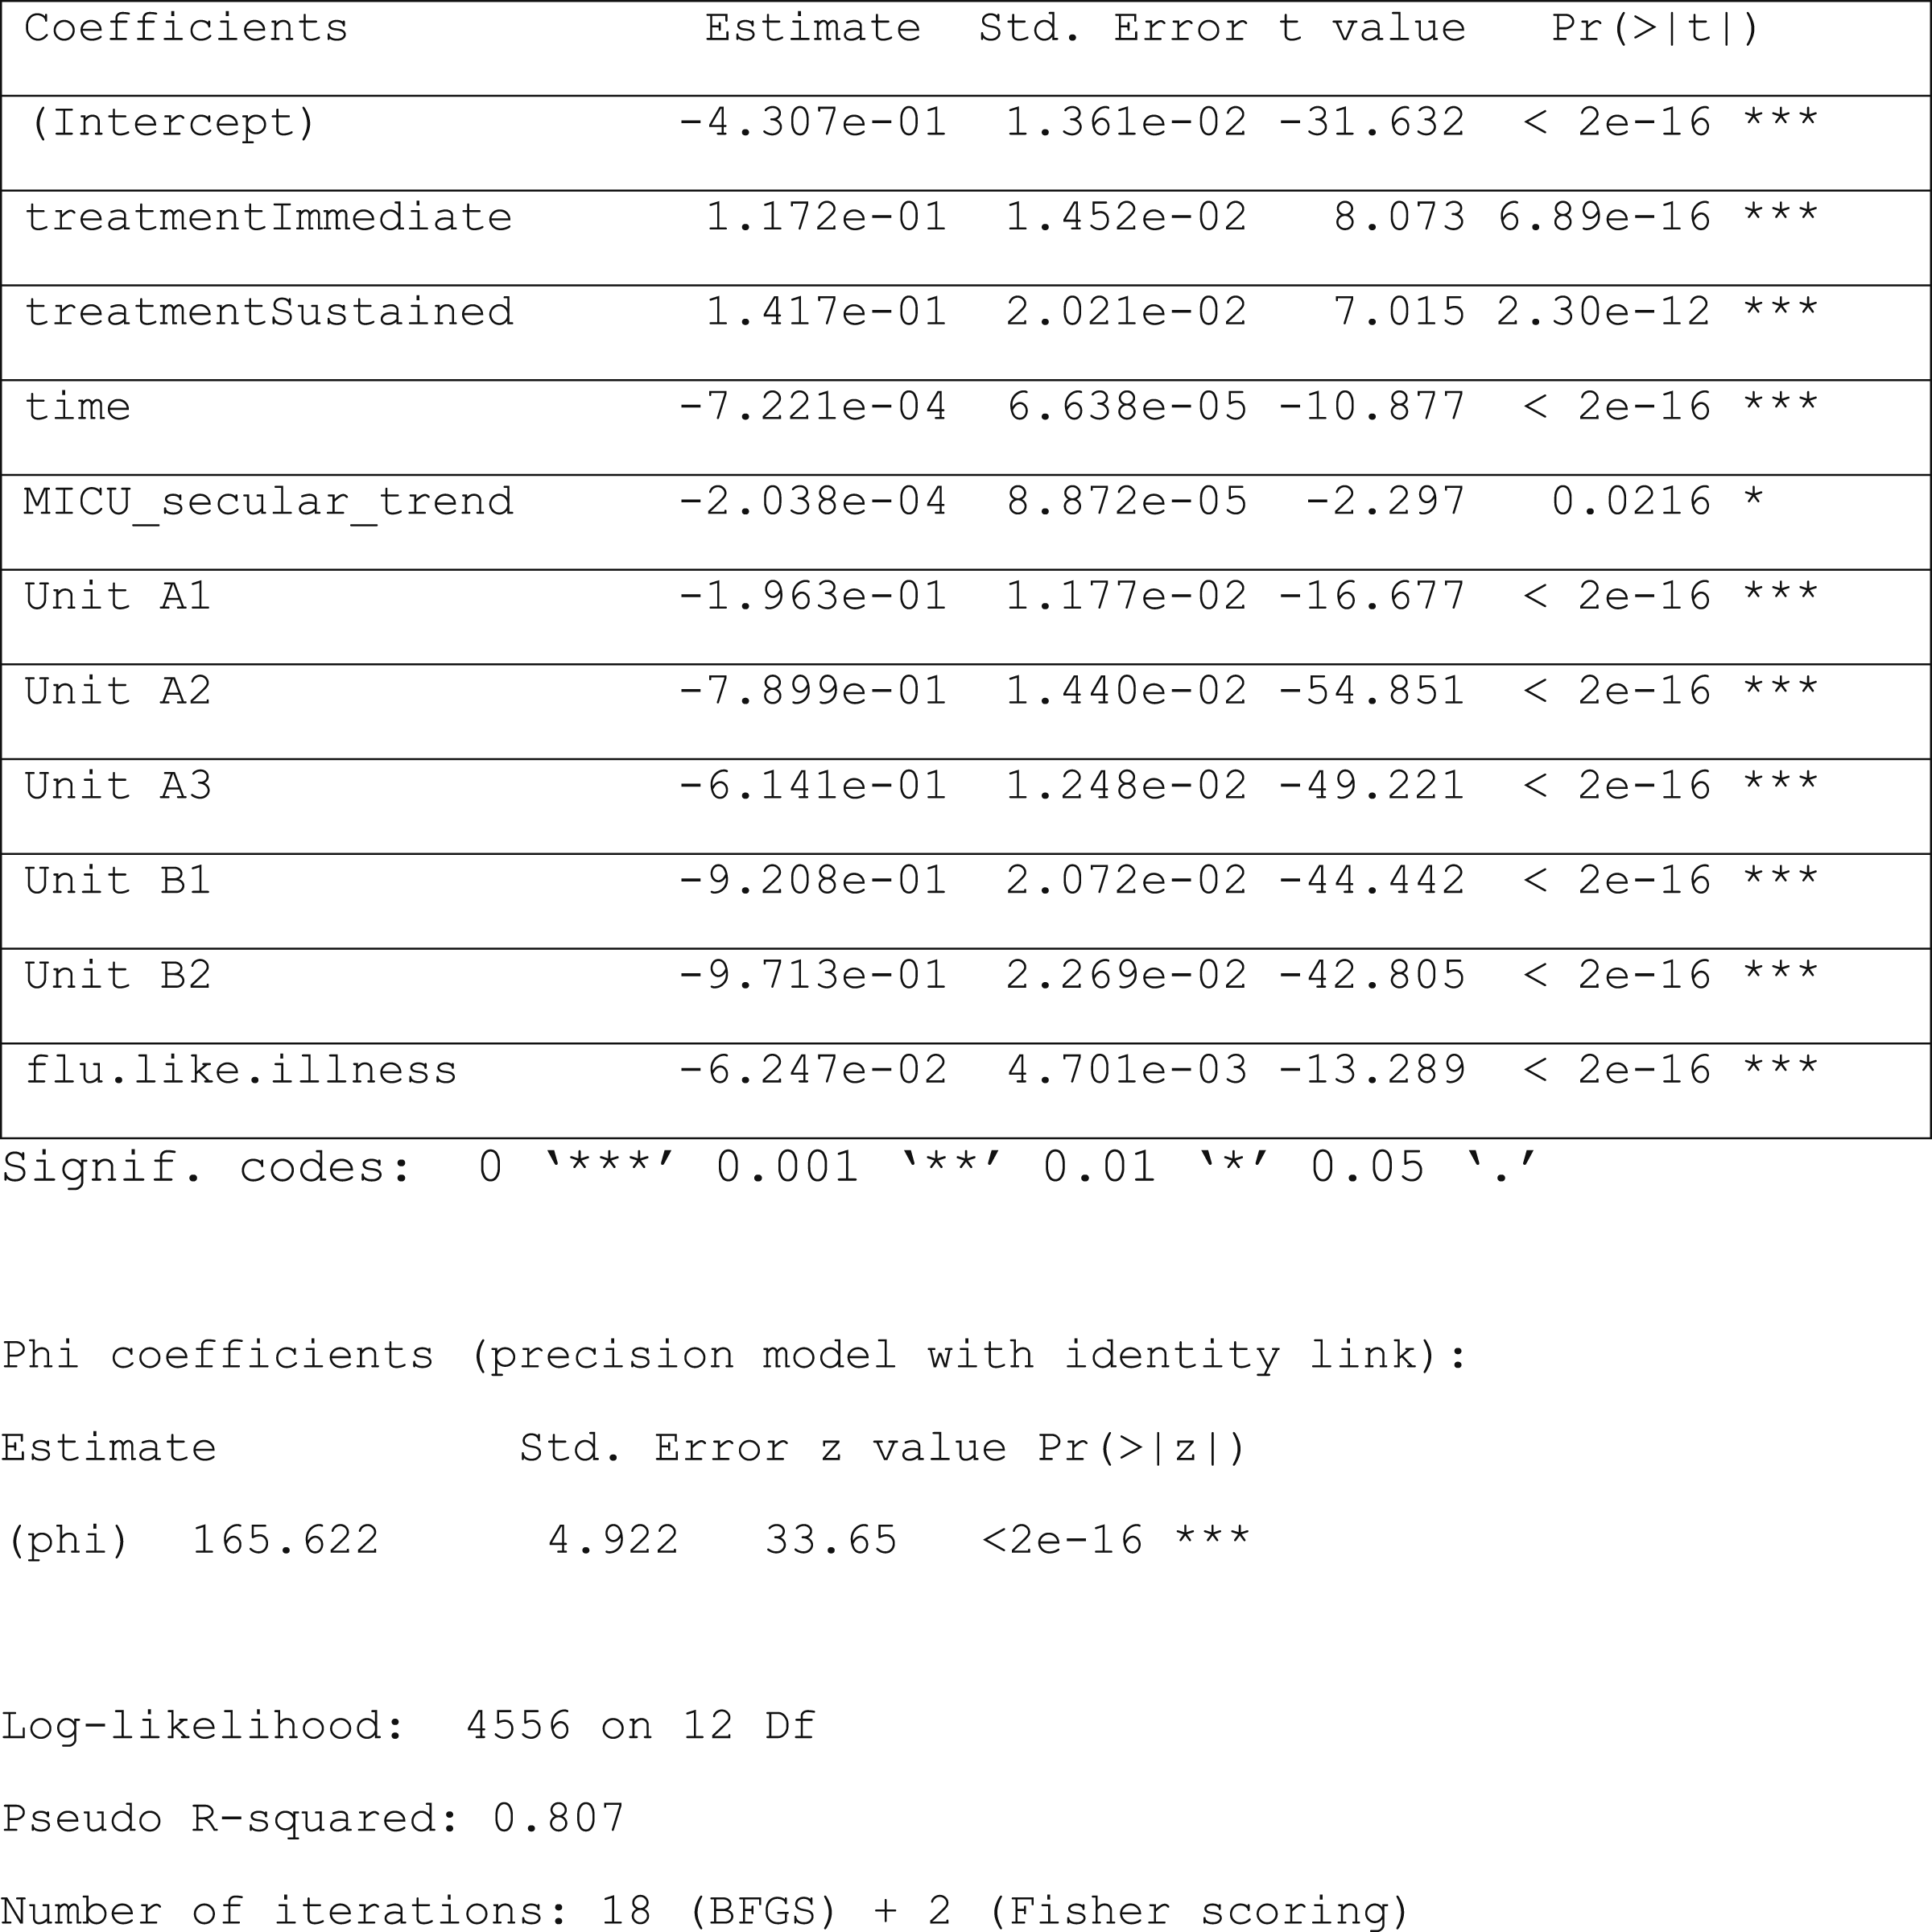
To identify the effect of the intervention— if any—on HHC rates, interrupted time series (ITS) analysis using a quasi-Poisson regression model was performed. Interrupted Time Series (ITS) analysis is a statistical method used to assess the impact of an intervention on a time series outcome variable, in this case while assessing the immediate and continuous effects of the intervention, controlling for time trends and seasonality, and mitigating selection bias concerns. Quasi-Poisson regression is a type of generalized linear model that is particularly useful when dealing with count data that exhibits overdispersion, meaning the variance is greater than the mean. (McDowall et al., 2019) The model included dummies to control for levels of reported ILI, linear secular trends (separately for the Unit B1 and all the other non-MICU units), unit-level baseline rates, and the differences in absolute numbers of HHC events across units. The linear secular trends were controlled for using separate dummy variables for MICU and non-MICO units; seasonal variation due to influenza prevalence was controlled for using a dummy reflecting state-specific ILI data. We expected an immediate effect from the HH intervention on HHC that would then be modified over time, and so we included a measure of the treatment effect for the two months immediately following the intervention in addition to time beyond the two months. The quasi-Poisson regression model was constructed for ITS analysis as follows:
Overall Treatment Effects Model
log (E (HHC Rate |x)) = β0 + β1 * treatmentImmediatex + β2 * treatmentSustainedx + β3 * timex + β4 * MICU_trend + β5 * unitx + β6 * flu_like_illnessx + ex
where:
β0 represents the model base-rate of hand hygiene compliance
treatmentImmediatex is a dummy variable represents treatment status in the given unit on the measured day, such that β1 represents the overall treatment effect of the intervention for the first two months post-intervention
treatmentSustainedx is a dummy variable represents treatment status in the given unit on the measured day, such that β2 represents the overall treatment effect of the intervention for the period more than two months post-intervention
timex is a dummy variable represents the date of the intervention, such that β3 represents the overall secular trend in rates of hand hygiene
MICU_trend represents the date of the intervention for the one MICU unit, such that β4 represents the difference between the overall secular trend in rates of hand hygiene and the trend for the MICU
unitx is a dummy variable representing each of the units in the program, such that β5 is a vector that represents the differing base rates of each unit
flu_like_illnessx represents a continuous variable capturing the percentage of cases in the unit’s state that were correlated with the number of flu-like illnesses in the State by week, so that β7 measures the additive change in hand hygiene rates that varies linearly with flu-like-illness rates
and
ex represents the error term for each unit.
Variables of chief concern (not controls) are in bold. SPC analysis was further conducted to determine whether the observed changes in HHC rates were a result of the intervention or were due in whole or part to naturally occurring variation. The basic tenet of SPC is that repeated measurements from a process will exhibit variation. Variation within a process occurs according to an underlying statistical distribution if the parameter remains constant over time; this variation is predictable within a range that can be described by one of the several statistical models of distribution (Benneyan et al., 2003) Measured values that deviate from the random distribution are considered unnatural variation, and are most likely due to events, changes, or circumstances that are not inherent in the regular process (Benneyan, 1998). SPC charts were created for each of the units to tease out the variability inherent within the process and to determine if the intervention had the desired impact and if it was sustained beyond the intervention time period. These are p charts using Laney’s correction for large sample sizes with an assumed mixed distribution (Carey & Lloyd, 1995). A robustness check was also conducted using fractional regression analysis.
Ethical Considerations
The Ethics Committee of the London School of Hygiene and Tropical Medicine granted permission for this research (reference number 14411) and the hospital review boards both exempted the study, considering it a quality improvement project. All nurse participants provided written consent before the intervention materials were given to them.
Results
Descriptive Analysis
Sample Characteristics.
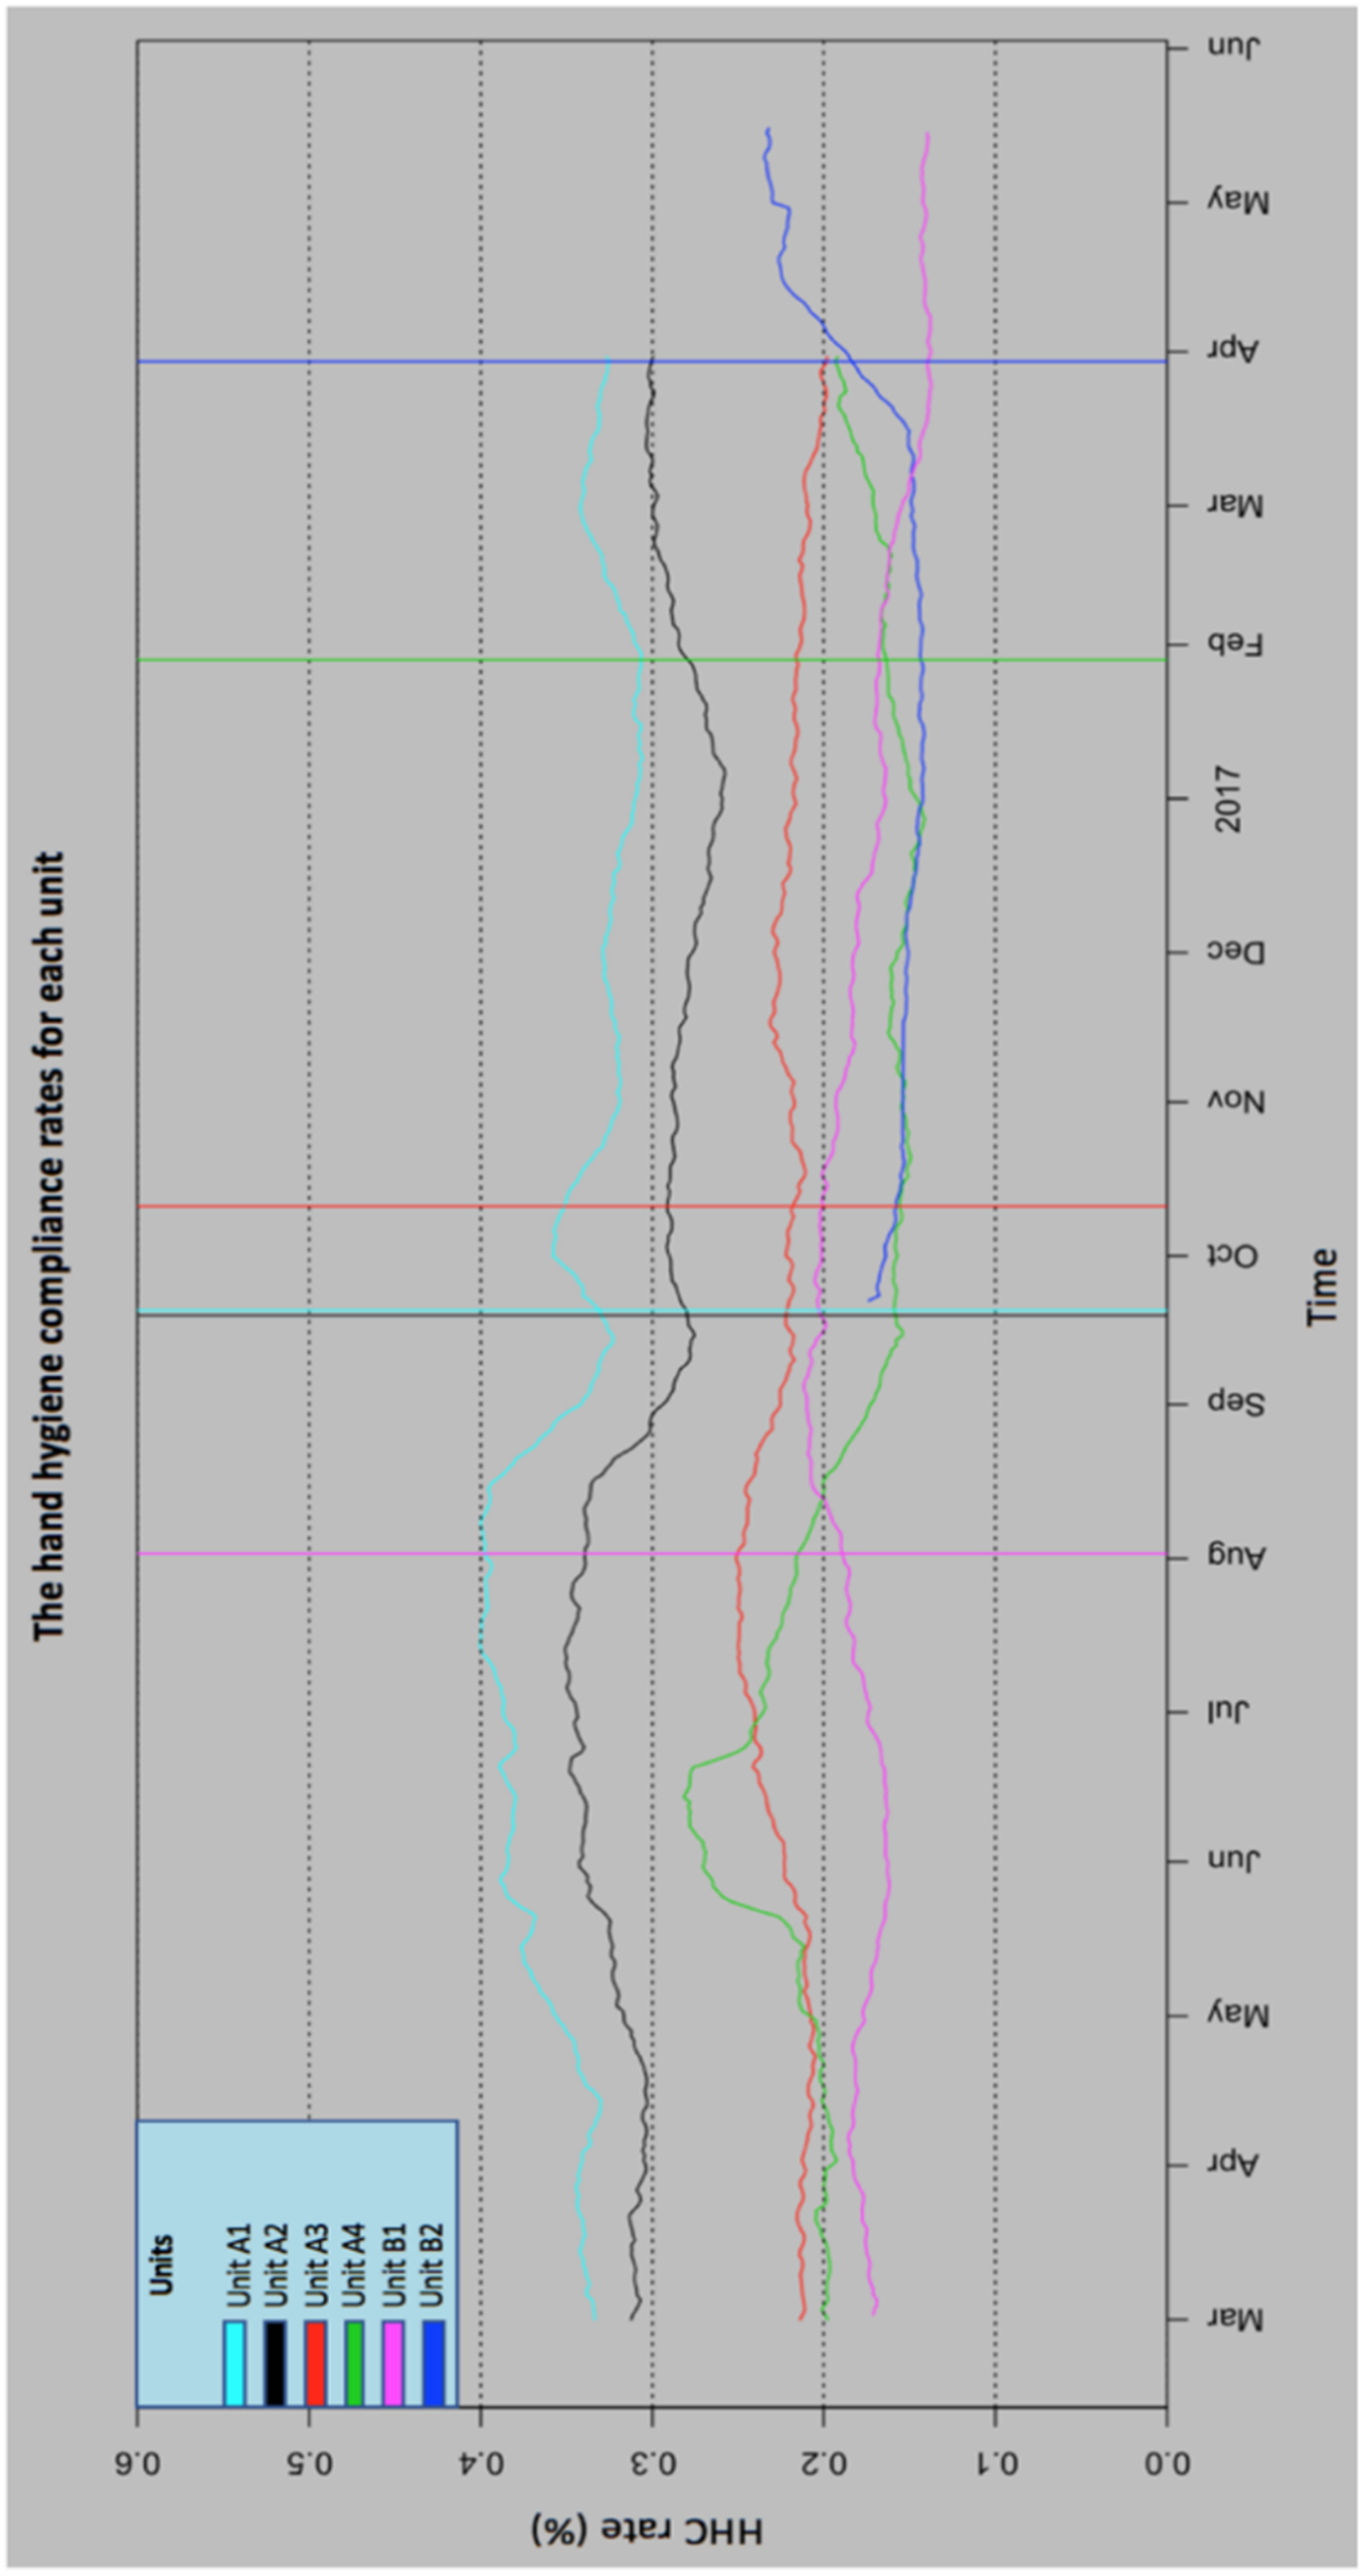
Calculated HHC rates by unit over time (weekly aggregates), with intervention bars.
ITS Analysis
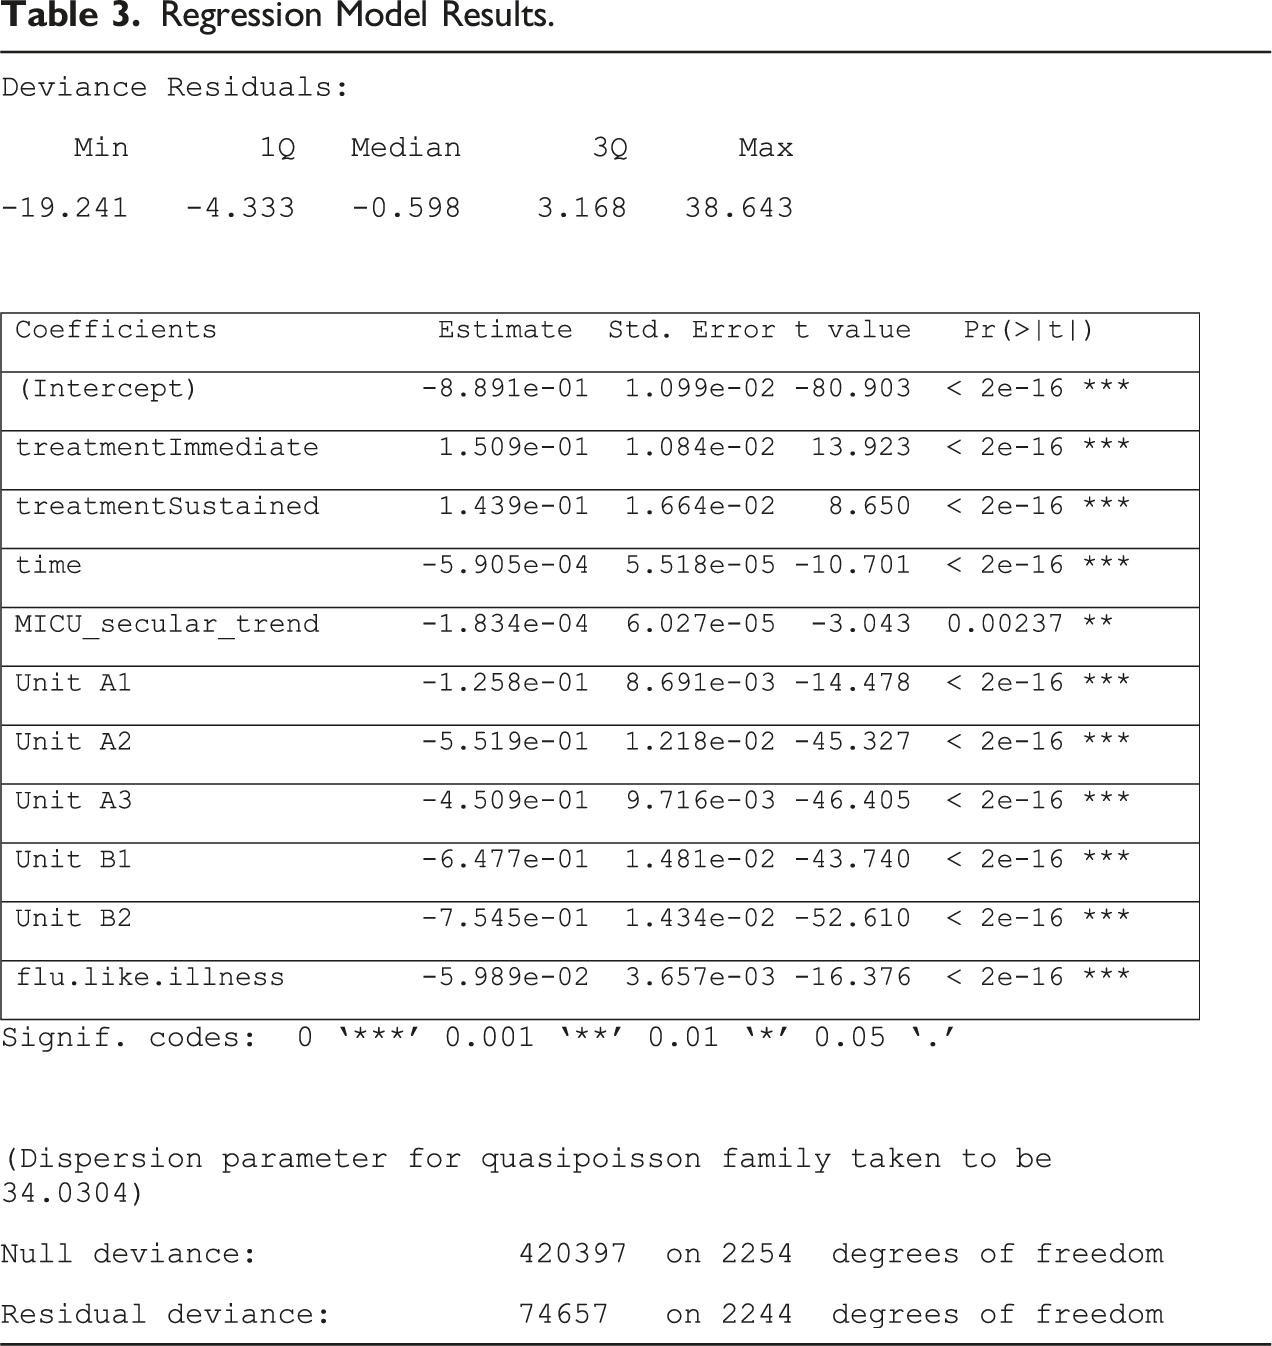
Regression Model Results.
Intervention Impact Summary.
Note. Figures in parentheses represent the 95% confidence interval; *: p < .05; n.d. = no data shown due to insufficient sample size; NA = no applicable data from period.
SPC Analysis
For each hospital unit, a SPC chart was created with the control limit (CL) set as the overall HHC rate for pre-intervention and post-intervention periods combined (Figure 2(a) to (f)). The solid vertical lines on the charts indicate the point of intervention delivery. The upper and lower control limits (UCL and LCL, respectively), were set at ±2SDs from the mean. Traditional statistical techniques used in the medical literature typically use 2SD as the statistical criteria for making decisions. While most SPC charts in industries outside medicine use 3SDs, we were aware that setting the limits too wide would lead to a high risk of type II error. (Wheeler et al., 2018) These are bimodal models, adjusted for seasonal (e.g. flu) and linear (secular) trends. (a–f) SPC control charts for each of the units.
The SPC charts indicate that Unit A1 had a small increase in HHC rate immediately following intervention delivery with a cluster of data points outside the UCL. However, the data fell within UCL and LCL by early October, which was about a month after the intervention delivery. Units A2, A3, and A4 showed increases in HHC rates, but these rises were within the expected variance. The data points that did breach the UCLs were few and were not clustered together. There was a small increase in HHC rates in Unit A3 prior to the intervention. Unit B1 had a strong, increasing uptick in rates post-intervention with most of the data points above of the UCL. Finally, Unit B2 has an immediate drop off, with many of the data points falling outside the LCL.
Robustness Analysis
Robustness Model Analysis.
Discussion
This paper describes outcomes from an implementation of a ‘wise’ intervention on hand hygiene compliance in hospitals. The intervention was based on extensive consultation with experts and novel formative research (Sands & Aunger, 2020), as well as a creative process that involved identification of an insight to drive new thinking about the need to comply with professional demands for good hygiene (Sands & Aunger, 2021). From the ITS analysis, it is apparent that on the aggregate level, there was a positive, statistically significant impact of the intervention on HHC rates among those visiting patient rooms. However, the patterns by unit were varied and in multiple cases, not statistically significant once temporal trends were considered.
The two units with statistically significant increases in HHC were Unit B1 (MICU) and Unit A3 (neuro-surgery ICU). From the literature, we know that the number of opportunities for HH is largely dependent on the process of care provided. (WHO, 2011) Researchers have found that the higher the demand for hygiene— the more opportunities to practice it— the lower the adherence. (Arenas et al., 2005; Harbarth et al., 2001; Hugonnet et al., 2002; Lipsett & Swoboda, 2001; O’Boyle et al., 2001; Pittet, 2000; Pittet et al., 1999) The lowest adherence rates have been found in ICUs while some of the highest rates have been found in surgical and paediatric units. (WHO, 2011) The two units that were found to have statistically significant increases in HHC rates were both ICUs. Once again, these units’ baseline rates were slightly lower than the other units and the nurses most likely had a larger number of opportunities for practicing HH. Units A1 (stem-cell transplant) and A2 (oncology) had the highest HHC rates for the baseline and post-intervention periods, which is most likely due to the nature of care; nurses were attending to patients with compromised immune systems.
Additionally, other factors apart from the intervention may have influenced the outcomes. For instance, in Unit B1, Nurse Mangers provided an incentive of a catered lunch to unit members if enough nurses participated in the study. (Perhaps as a consequence, the participation rate in this unit was higher than in Unit B2.) From non-participant observation (Sands & Aunger, 2020), it was noted that the intervention was consistently mentioned on the unit floor and nurses were reminded of the intervention through automated emails. This could have impacted the nurses’ level of engagement with the intervention. In Unit A3, HHC rates for the unit were on the computer monitors at the nurses’ stations. From observations made, the unit also had a sign that spanned the walls of the nurses’ lounge that read: ‘I pledge to clean my hands with soap and water or Purell before and after I visit each patient’s room. If I forget to do so, I want to be reminded, and I promise to respond positively and with respect’. Such additional factors may have contributed to the positive effect. The relatively lower participation rates in Hospital B units means there could be some self-selection bias during recruitment, and also a weakened effect of the intervention, due to low rates of exposure to the intervention among staff in this hospital.
Moreover, there were several unexpected findings. First, it was noted that in several units, compliance rates were higher more than two months after the intervention than in the months immediately following intervention delivery. It is rare for the effects of an intervention to build over time without additional inputs. This could be attributed to the process evaluation survey, which was conducted in each of the hospital units six weeks after the intervention delivery. The process evaluation asked about retention of the HH message as well as use of the cue-association exercise. The survey—and the presence of the research group in the hospital unit— may have served as a reminder of the intervention for the participants. In addition, it could have prompted the nurse managers of the respective units to further emphasize the importance of the intervention and HH.
Another finding was that the influenza-like illness effect was slightly negative, which means that as the rate of ILI admissions increased, HHC rates decreased. This runs counter to the conventional assumption that the HH rates of HCWs increase with the threat of disease. There are two possible explanations for this occurrence. The first is that the assessment of risk among HCWs can manifest in attitudes towards, and fear of, infectious disease. (Watkins, Wynaden & Hart, 2006) When HCWs feel fear, they have a higher tendency to avoid patient contact. (Imai, Takahashi & Hoshuyama, 2005) In assessing risk, nurses could subconsciously view the flu as a non-serious threat, hence the decrease in performing HH. Additionally, the threat on the flu season could have been somewhat normalized. For example, in both hospitals, there were informational posters about the flu as early as August and in Hospital A nurses had stickers on their ID badges that posed the question: Have you gotten your flu shot yet? This could have reduced HCWs’ perceptions of the flu as being dangerous. Second, increased admissions could mean increased patient loads and thus increased work stress. From the literature, it is evident that high degrees of occupational stress can lead to suboptimal patient care, safety breaches, and increased frequency in errors in everyday clinical practice. (Aiken et al., 2002; Sarafis et al., 2016) While increased patient loads may be acting as a confounder, we are unable to assess whether this was occurring, given the available data.
Finally, there were significant differences in response between the units – with some showing strong positive effects -- such as Unit B1 (MICU) and Unit A3 (neuro-surgery ICU), others with little effect, like Unit A4 (mother-baby), and some showing an initial negative effect such as Unit A1 (stem-cell) and Unit A2 (oncology). This variety could be due to issues with intervention implementation. However, the negative and statistically significant immediate consequences in Units A1 and A2, along with insignificant sustained results, raise questions about the intervention’s effectiveness, particularly when these units had the highest baseline HHC rates, likely due to caring for patients with compromised immune systems. In the process evaluation, we identified that relatively few nurses were reached by the intervention (less than 50% on average) and even those who were reached did not actively engage with the cue-association exercise. (Sands & Aunger, 2024) In addition, the context in which the intervention was delivered—from the varying settings of the hospital units themselves to the dynamic nature of providing health care—could have directly influenced behaviour and thus impacted the nurses’ responses to the intervention in these different units.
The SPC control charts showed that there was significant natural variation in HHC rates, referred to as common cause variation. (Benneyan, 1998; Benneyan et al., 2003) The increases in HHC rates seen in Units A1 through A4 fall within the natural variation expected. Thus, Unit A3’s statistically significant increase in its HHC rate could be due to common cause variation rather than to the intervention itself. The increase in the HHC rate of Unit B1 was strong and fell outside of the upper limits indicating special cause variation. The measured values for Unit B1 deviated from the random distribution models, indicating that the increase in HHC rates could not be explained by naturally occurring variation within the system. Thus, it can be assumed that Unit B1’s statistical evidence of change was due to outside factors—such as the intervention, the involvement of the unit’s Nurse Manager, the offering of incentives, or some combination of these.
Where the model and SPC may be limited in its ability to discriminate between variation owed to the intervention and variation arising from other causes outside of naturally occurring processes, the process evaluation can help tease out whether there were factors associated with intervention implementation, specifically reach and engagement, or if there the substantial variation in the units themselves impacted the observed outcomes.
Conclusions
Hand hygiene is widely accepted as the most important measure for the prevention of HAIs, but HHC rates are typically low. Numerous efforts have been made to increase HHC among HCWs, but these initiatives have been unable to bring about sustained changes in behaviour. We developed a ‘wise’ intervention— a simple intervention based on specific psychological mechanisms — that centred on an attempt to re-animate nurse’s sense of professional identity and responsibility. This was implemented in six acute care units across two different hospitals in the United States during 2016–2017. The study adopted a multiple baseline design with the delivery of the intervention being staggered across time and units. An interrupted time series (ITS) analysis using a quasi-Poisson regression model was performed. Overall there was a positive, statistically significant impact of the intervention on HHC rates among the nurses visiting patient rooms. Yet, at the unit-level, the impact of the intervention varied, in several cases was not statically significant, and showed unusual temporal patterns of change. SPC analysis indicated that most of the increases in HHC rates could be due to naturally occurring variance. However, one of the two units that was found to have a statistically significant increase in its HH rate (Unit B1, the MICU), had changes that could not be accounted for by natural variance; this constitutes statistical evidence of change in that unit related to the intervention. In sum, the aggregate impact should not be taken as evidence of significant intervention effectiveness; the null effects in some units were simply due to unmeasured confounders, and in no case was there an increase in HHC rates likely to result in reduced disease transmission. This study therefore cannot be considered to single-handedly have provided a strong foundation for use of a ‘wise’ intervention targeting nurse professional identity, despite its relatively small financial, logistical and psychological cost. However, given these potential benefits, such interventions should be further studied and tested.
Supplemental Material
Supplemental Material - A Wise Intervention to Increase Hand Hygiene Compliance of Nurses in Acute Care Units in US Hospitals: A Multiple Baseline Interrupted Time-Series Evaluation
Supplemental Material for A Wise Intervention to Increase Hand Hygiene Compliance of Nurses in Acute Care Units in US Hospitals: A Multiple Baseline Interrupted Time-Series Evaluation by Madeline Sands, Ben Tidwell, and Robert Aunger in Evaluation Review
Footnotes
Acknowledgements
We are grateful to Jeff Quinn and Sharon Guten for their support and assistance throughout the intervention design process and implementation.
Declaration of Conflicting Interests
The author(s) declared no potential conflicts of interest with respect to the research, authorship, and/or publication of this article.
Funding
The author(s) disclosed receipt of the following financial support for the research, authorship, and/or publication of this article: This work was supported by the GOJO Industries, Inc.
Supplemental Material
Supplemental material for this article is available online.
References
Supplementary Material
Please find the following supplemental material available below.
For Open Access articles published under a Creative Commons License, all supplemental material carries the same license as the article it is associated with.
For non-Open Access articles published, all supplemental material carries a non-exclusive license, and permission requests for re-use of supplemental material or any part of supplemental material shall be sent directly to the copyright owner as specified in the copyright notice associated with the article.