
Abstract
Furan is a volatile compound formed during the thermal processing of foods. Chronic exposure has been shown to cause cholangiocarcinoma and hepatocellular tumors in rodent models. We conducted a 90 day subchronic study in Fisher 344 rats exposed to various doses by gavage to determine the NOAEL. Previous reports have outlined changes in the liver using gross necropsy examination, histopathology, clinical biochemistry, hematology, immunohistochemistry, and toxicogenomics. The data revealed that males were more sensitive than females. The focus of this study was to evaluate the toxicoproteomic changes by 2-dimensional differential in gel electrophoresis followed by mass spectrometry analysis. To compliment previous studies, protein expression changes were evaluated of male animals after 90 days of exposure to doses of 0, 0.03, 0.5, and 8.0 mg/kg bw/d. Significant statistical treatment-related changes compared to the controls identified 45 protein spots containing 38 unique proteins. Proteins identified are implicated in metabolism, redox regulation, protein folding/proteolysis as well as structural and transport proteins. At lower doses, multiple cytoprotective pathways are activated to maintain a homeostasis but ultimately the loss of protein function and impairment of several pathways could lead to adverse health effects at higher doses of furan administration.
Introduction
Furan (CAS No. 110-00-9) is a colorless, volatile, heterocyclic aromatic, and lipophilic chemical which is used as an intermediate in the synthesis of many chemical and pharmaceutical agents, solvents, lacquers, and resins. 1 –3 In addition to being an important industrial chemical, it is also present in the environment in smog, engine exhaust, smoke of wood and cigarettes. 4 –6 Recently, particular attention has been given to furan for its presence in various foods which had undergone thermal processing such as cooking, canning, roasting, baking, and sterilization. 6 –10 These foods include coffee, canned meats, milk beverages, and baby foods with levels exceeding 100 parts per billion. 11 Furan has also been detected in human breast milk and the breath of both smokers and passive smokers 12 which could also provide additional sources of furan exposure. Studies have shown that furan can be formed via multiple pathways from natural food constituents such as sugars/carbohydrates, ascorbic acid/dehydroascorbic acid, amino acids, polyunsaturated fatty acids, and carotenoids during thermal degradation/oxidation processes. 3,7,9,13 –15 Despite the presence of furan, thermal processing is also important for the preservation of food quality and ensuring food safety from microbial contamination.
The International Agency for Research on Cancer and the National Toxicology Program listed furan as a possible human carcinogen (Group 2B). It is known to act as a potent hepatotoxin and liver carcinogen in rodents. 16,17 Currently there are no studies linking furan exposure to adverse events in humans. There is considerable interest in understanding the metabolic fate of furan in rodent models which can lead to the development of valuable biomarkers for the assessment of human health risks. Previous studies have shown that furan is oxidized by cytochrome P450 2E1 to the reactive metabolite cis-2-butene-1,4-dial (BDA) which is responsible for furan-induced toxicities. 18,19 In addition, BDA has been shown to form adducts with various cellular nucleophiles including DNA, protein, and amines such as lysine, glutamine, ornithine, putrescine, and spermidine. 18,20 Toxicogenomic assessment had been previously determined on liver samples from animals exposed to various doses of furan, 21 where the transcriptional changes were correlated to the various apical end points observed in our subchronic study. 2 These changes were used to establish bench mark dose pathways to explore sex-related and end point specific responses for key events leading to hepatotoxicity. Although the transcriptional changes provide insight on gene expressions, these do not necessarily reflect and/or predict physiologic responses. 22 Studies have shown that RNA and protein levels may not always be correlated and that posttranscriptional regulation may result in divergent RNA and protein levels. 23 –26 Brancini et al 23 showed although there were 1128 mRNAs changed, only 57 proteins were detected supporting the rare occurrence of perfect stoichiometry between transcript and protein abundance. Integrative approaches which include genomics, transcriptomics, proteomics, and metabolomics are needed to provide a comprehensive understanding at the various levels of biological organization. 27 The connection of various levels of molecular and biological events due to adverse outcomes provides additional information for risk assessment. In this study, we used 2-dimensional differential in gel electrophoresis (2D-DIGE) followed by mass spectrometry (MS) to identify the toxicoproteomic changes in the livers of male rats following a 90 day subchronic exposure at doses of 0, 0.03, 0.5, and 8.0 mg/kg bw/d of furan.
Methods
Animals and Furan Exposures
The experimental details for this study including histopathological, clinical biochemistry, and hematology analyses have been previously reported. 2 In brief, male and female F344 rats (7-8 weeks old) were orally exposed by gavage to furan in corn oil at final doses of 0, 0.03, 0.12, 0.5, 2.0, and 8.0 mg/kg bw/d. Dosing occurred 5 days a week for a period of 90 days. 2 Animal handling and treatment procedures were conducted according to the Guidelines of the Canadian Council of Animal Care (Ottawa, Ontario, Canada). Liver samples were collected 24 hours after the last exposure, flash-frozen and stored at −80 °C.
Preparation of Samples for 2D-DIGE
The left lobes of male liver samples were randomly selected (n = 5) from each dose group at 0, 0.03, 0.5, and 8.0 mg/kg bw/d of furan for proteomic analysis. Liver samples (0.2 g) were homogenized in 1.5 mL Standard Cell Lysis Buffer (pH 9.0) containing 7M Urea, 2M Thiourea, 30mM Tris, 4% (wt/vol) 3-[3-cholamidopropyl) dimethylammonio]-1-propanesulfonate (CHAPS), and (1:100) of protease inhibitors. Samples were sonicated (5 × 2 sec) followed by an incubation on ice for 20 minutes. This was followed by centrifugation at 4 °C for 40 minutes at 15,000 × g to remove the insoluble material. The transferred supernatants were diluted (1:20) in Standard Cell Lysis Buffer (pH 9.0) and the protein concentration was determined by the Bradford assay (Biorad). Liver samples were additionally precipitated to remove interfering substances and improve the labeling efficiency by using the 2D Clean-Up kit following the manufacturer’s instructions. Pellets were resuspended in Standard Cell Lysis Buffer (pH 9.0) to a final concentration of 10 μg/μL. All samples were adjusted to a final pH of 9.0. Stock solutions of CyDye DIGE Fluor Cy2, Cy3, and Cy5 minimal dyes were made by adding 5 µL of fresh dimethylformamide (Sigma-Aldrich) to each vial containing 5 nmol of dye. To take advantage of the multiplexing capabilities of 2D-DIGE, an internal standard representing a pool of all samples (n = 20) was labeled in a single tube with Cy2 to be included on each gel to eliminate gel-to-gel variation thus increasing the consistency, matching accuracy, and reproducibility. For analytical gels, each sample containing 50 µg of protein was labeled with 400 pmol of the appropriate dye. Each individual protein sample was labeled with either Cy3 or Cy5 alternating dyes between doses in a random fashion. 28 Labeling was conducted in the dark for 30 minutes and the reaction was stopped with 0.2 µL of 10 mM Lysine per 50 µg of labeled protein.
Two-Dimensional Differential in Gel Electrophoresis
First-dimensional separation via isoelectric focusing (IEF) was completed using 18 cm Immobiline Drystrips pH 4-7 using the Ettan IPGphor3 Isoelectric Focusing System. The Cy2pooled standard and a Cy3 and Cy5 individually labeled samples were combined (150 μg) for each analytical gel and the total volume adjusted to 340 µL by the addition of rehydration buffer containing 7M Urea, 2M Thiourea, 2% (wt/vol) 3-[3-cholamidopropyl) dimethylammonio]-1-propanesulfonate (CHAPS), 0.5% IPG Buffer pH 4 to 7, 0.2% (wt/vol), Dithiothreitol (DTT), and 0.04% (wt/vol) bromophenol blue. Each Cy2/Cy3/Cy5 sample was added to individual 18-cm ceramic strip holders with an Immobiline Drystrip (18 cm, pH4-7) following the manufacturer’s instructions (Ettan DIGE System User Manual 18-1173-17 Edition AB). These were placed into the Ettan IPGphor3 unit to commence first-dimensional separation of proteins by IEF at 20 °C and 75 µA/strip using the following active rehydration protocol: 14 hours at 30 V; 1 hour at 500 V; 1 hour gradient up to 1000 V; 3 hours gradient up to 8000 V; and a final step of 8000 V to a total of 33,217 V hrs. The focused Immobiline Drystrips were stored at −80 °C until the equilibration of strips and second-dimensional separation was performed.
Second-dimensional separation (SDS-PAGE) was completed by casting 15% polyacrylamide gels following the manufacturer’s instructions (Ettan DIGE System User Manual #18-1173-17 Edition AB). Focused Immobiline Drystrips were placed in a solution containing Equilibration Buffer (6M Urea, 30% Glycerol, 2% [wt/vol] SDS, 50 mM Tris-HCl [1.5M, pH 8.8], and 0.02% bromophenol blue) with the addition of 0.5% (wt/vol) of DTT for 15 minutes with gentle rocking on an orbital shaker. This was followed by a second incubation of Equilibration Buffer but with the addition of 4.5% (wt/vol) Iodoacetamide (IAA) for 15 minutes with gentle rocking. The strip was added to the top of each gel and covered with 0.5% (wt/vol) agarose overlay solution containing 0.02% bromophenol blue. Electrophoresis was performed using the Ettan DALT 6 electrophoresis system with a MultiTemp III cooling unit and the EPS601 Electrophoresis Power Supply by applying 0.5W/gel overnight followed by 17W/gel until the bromophenol blue dye front reached the bottom of the gels.
Image Acquisition and Statistical Analysis
Analytical gels were scanned using the Ettan DIGE Imager (GE Healthcare) at 100 µm resolution using excitation/emission wavelengths specified by selecting the DIGE File Naming Format: Cy2 at 480 nm/530 nm, Cy3 at 540 nm/595 nm, and Cy5 at 635 nm/680 nm which enabled the fluorescent proteins to be visualized. The exposure was set for each channel in that the maximum pixel value was achieved without saturation as outlined in the Ettan DIGE Imager user manual. Images were analyzed using the Decyder 2D software version 7.0 (GE Healthcare) according to the manufacturer’s recommendation. A single cropped “master” gel containing the pooled internal standard (Cy2) and 2 individual samples (Cy3, Cy5) were analyzed in the Differential In-Gel Analysis (DIA) module. Spot detection was performed using an estimation of 10,000 spots with an exclusion of background by selecting the volume of the first true spot. Cropped images (n = 30) representing each channel (Cy2, Cy3, and Cy5) of all gels were processed using the Batch Processor module which performs automated matching of spot boundaries from all gels to the “master” gel using the parameters selected in the DIA module. Samples were specified into dose groups or as internal standards with the master gel identified. Each standard Cy2 spot was compared to the corresponding Cy2 spot on the “master gel” to normalize each gel image. Then individual samples (Cy3, Cy5) were compared to the corresponding protein spot of the internal standard (Cy2) on the same gel to provide normalized spot protein abundance ratios (ie, Cy2: Cy3, Cy2: Cy5). Overall, the intra- and inter-gel variation is reduced allowing only the biological variation to be compared in future analyses. Images were then viewed in the Biological Variation Analysis (BVA) module to verify that all spots on the gel images were matched.
Statistical analysis was conducted using the Extended Data Analysis (EDA) module of the Decyder 2D software version 7.0 (GE Healthcare). A base set was created to filter both proteins and spot maps by selecting proteins spots present in 90% of the gel images and removing unassigned proteins. Differential Expression Analysis calculations for one-way analysis of variance (ANOVA; P < .05) with a Tukey’s multicomparison test (MCT) between all doses as well as the average ratio between each dose and the control were performed. An additional set was created by filtering only those proteins which had a one-way ANOVA (P < .05) and a change in the average ratio either −1.4
Preparative Gels and Spot Picking
Preparative gels were conducted in duplicate using the same protocol as analytical gels with the following exceptions. A single sample containing 500 µg of pooled unlabeled protein was used which represented all dose groups. This enabled more proteins to be selected for MS analysis. First-dimensional separation was completed on the unlabeled sample and the total volume was adjusted to 340 µl by the addition of rehydration buffer. For second-dimensional separation, the glass plates were first washed in 1% Decon (vol/vol) overnight, 1% HCl for 1 hour, treated with bind saline working solution, and left to dry for a minimum of 1.5 hours before casting the gels. Upon completion of the electrophoresis, the glass plates were separated with the gel remaining on the bind saline treated plate. Gels were notched for identification and placed in a tray covered with fixing solution (50% methanol, 7% acetic acid) twice for 30 minutes with gentle rocking on an orbital shaker. Fixed gels were stained in the dark with SYPRO Ruby on an orbital shaker until optimal staining was achieved. In order to minimize background, a wash solution (10% methanol, 7% acetic acid) was applied for 30 minutes on an orbital shaker followed by 2 washes in ultrapure water. Preparative gels were scanned using the Ettan DIGE Imager at 480 nm/595 nm (SR1-filter setting) which enabled the fluorescent proteins to be visualized. The exposure was set in that the maximum pixel value was achieved without saturation. Gels were scanned to identify POIs and improve manual spot picking. Gels were placed on a Dark Reader Transilluminator (Clare Chemical Research) and POIs confirmed on the scanned gel were manually picked using the OneTouch Plus spot-picker pipette with disposable tips (Gel Company Inc). Selected gel plugs containing POIs were placed in a microcentrifuge tube containing 1% acetic acid and then stored at −20 °C until identification. Gels were scanned a second time to confirm accurate spot picking.
In-Gel Digestion and Protein Identification
Dithiothreitol, IAA, [Glu1]-Fibrinopeptide B, ammonium bicarbonate (NH4HCO3), acetonitrile (ACN), and formic acid (FA) were used without purification (Sigma-Aldrich). Water was purified with resistivity ≥ 18 MΩ using a Millipore Milli-Q Synthesis system (Fisher Scientific). Excised gel spots were placed in low-binding tubes (LoBind, Eppendorf), washed with water and prepared as previously described. 29 Washed gel pieces were dehydrated (50% ACN/50 mM NH4HCO3 buffer) followed by 100% ACN. The ACN was removed and the gel pieces were dried in a vacuum centrifuge (Savant DNA 120 Speed Vac System, Thermo Fisher Scientific) to remove any residual solvent. The gel pieces were then rehydrated (500 mM DTT/50 mM NH4HCO3 buffer) for 30 minutes at 37 °C followed by alkylation with freshly prepared IAA (1M IAA/50 mM NH4HCO3 buffer) for 30 minutes in the dark. After removal of residual IAA buffer, the gel pieces were washed with water then dehydrated (50% ACN/50 mM NH4HCO3 buffer) followed by 100% ACN. The ACN was removed and the gel pieces were dried once again as previously described. The digestion was initiated by the addition of 20 ng/µL Promega sequencing grade trypsin (Fisher Scientific) for 5 minutes followed by the addition of buffer (50 mM NH4HCO3) so the gel plugs remained immersed throughout the digest overnight at 37 °C. For peptide recovery, 1% FA was added followed by centrifugation and removing the supernatant to new low binding tubes. The gel pieces were washed (70%ACN/5%FA) followed by centrifugation and added to the previous supernatant. The solution was dried in a vacuum centrifuge and reconstituted in buffer (0.1% FA) for MS analysis. Peptide analysis was performed on a nESI-qTOF Premier (Waters). This system is comprised of a nanolockspray source coupled to a nanoAcquity UPLC system (Waters). An auxiliary solvent manager was used to deliver a reference mass calibration standard (0.5 µM [Glu1]-Fibrinopeptide B in 50% aqueous methanol). The separation system consisted of a trap column (Symmetry C18 5 µm 180 µm × 20 mm, Waters) and an analytical column (BEH 130 C18 1.7 µm 100 µm × 100 mm, Waters). Solvent A consisted of water with 0.1% FA and Solvent B consisted of ACN with 0.1% FA. In a typical experiment, samples were injected (4 μL) onto the trap column for 3 minutes at a flow rate of 3.0 µL/min using 99% solvent A. The samples were then diverted to the analytical column and eluted at 300 nL/min. The elution program started with 99% Solvent A for 1 minute followed by a gradient to 50% Solvent B in 35 minutes. The column was washed by bringing the gradient to 85% B in 3 minutes and then holding this for an additional 3 minutes before bringing the solvent back to 99% A in 1 minute.
The mass spectrometer was operated in positive ion mode in a V configuration (resolution > 10,000 FWHM) and the acquired data collected using MassLynx version 4.1 software package. Data were collected in both MS survey scan mode and an automated data directed analysis mode. Mass spectrometry survey scan data were acquired in continuum mode from m/z 300 to 1500 and the collection of MS/MS information (m/z 100 to 1500) was triggered when the threshold rose above a minimum (5 counts/sec). Data were collected on up to 3 simultaneous masses and the system was returned to MS survey scan mode when the counts for each triggered mass returned to a minimum (10 counts/sec) or a time constraint was reached (4.8 seconds). Data collected from the LC-MS/MS analysis of each gel sample was submitted directly to an in-house Mascot server with distiller software version 2.4.3.1. The tandem MS information was then searched against the NCBI database (version 20130503) with up to 1 missed cleavage, a fixed carbamidomethylation modification at cysteine and a variable oxidation of methionine. Identified proteins were included if they were detected in all samples, had a protein score above the confidence threshold, and a sequence coverage of at least 10% based on at least 2 identified peptides. 30 The online database UniProtKB (http://www.uniprot.org/) was used by adding the GI accession numbers of identified proteins that passed the cutoff criteria to gain additional information on the proteins.
Bioinformatics Analysis
Pathway enrichment analyses were performed on proteins identified at the 8.0 mg/kg bw/d using David’s bioinformatics resource 6.8 (https://www.david.ncifcrf.gov/). 31,32 The identifier “PROTEIN_GI_ACCESSION” or “UNIPROT_ACCESSION” and list type “gene list” were used for the analysis. Three gene ontology (GO) terms were searched for protein involvement in the categories cellular component, molecular function and biological process, and the Kyoto Encyclopedia of Genes and Genomes (KEGG) pathways to find clusters of coexpressed proteins and their relationships to biological systems.
Results
Proteome Differential Expression in Liver Tissues Identified by 2D-DIGE
All gels were matched to the master gel and statistical analysis was conducted using the EDA module of the Decyder 2D software version 7.0 (GE Healthcare). A base set of proteins (n = 817) was established by the filtering criteria of selecting proteins spots present in 90% of all the gel images and removing unassigned proteins.
Differential Expression Analysis was conducted by performing a one-way ANOVA with Tukey’s MCT (P < .05) on the base set to further reduce the number of proteins (n = 390). Comparisons between the control and each dose group by the associated average ratio allowed the further filtering of a differential protein expression of −1.4
Proteins of Interest (n = 45) Which Identified 38 Unique Proteins by Mass Spectrometry With a One-Way Analysis of Variance (P < .05) and a Differential Protein Expression of −1.4
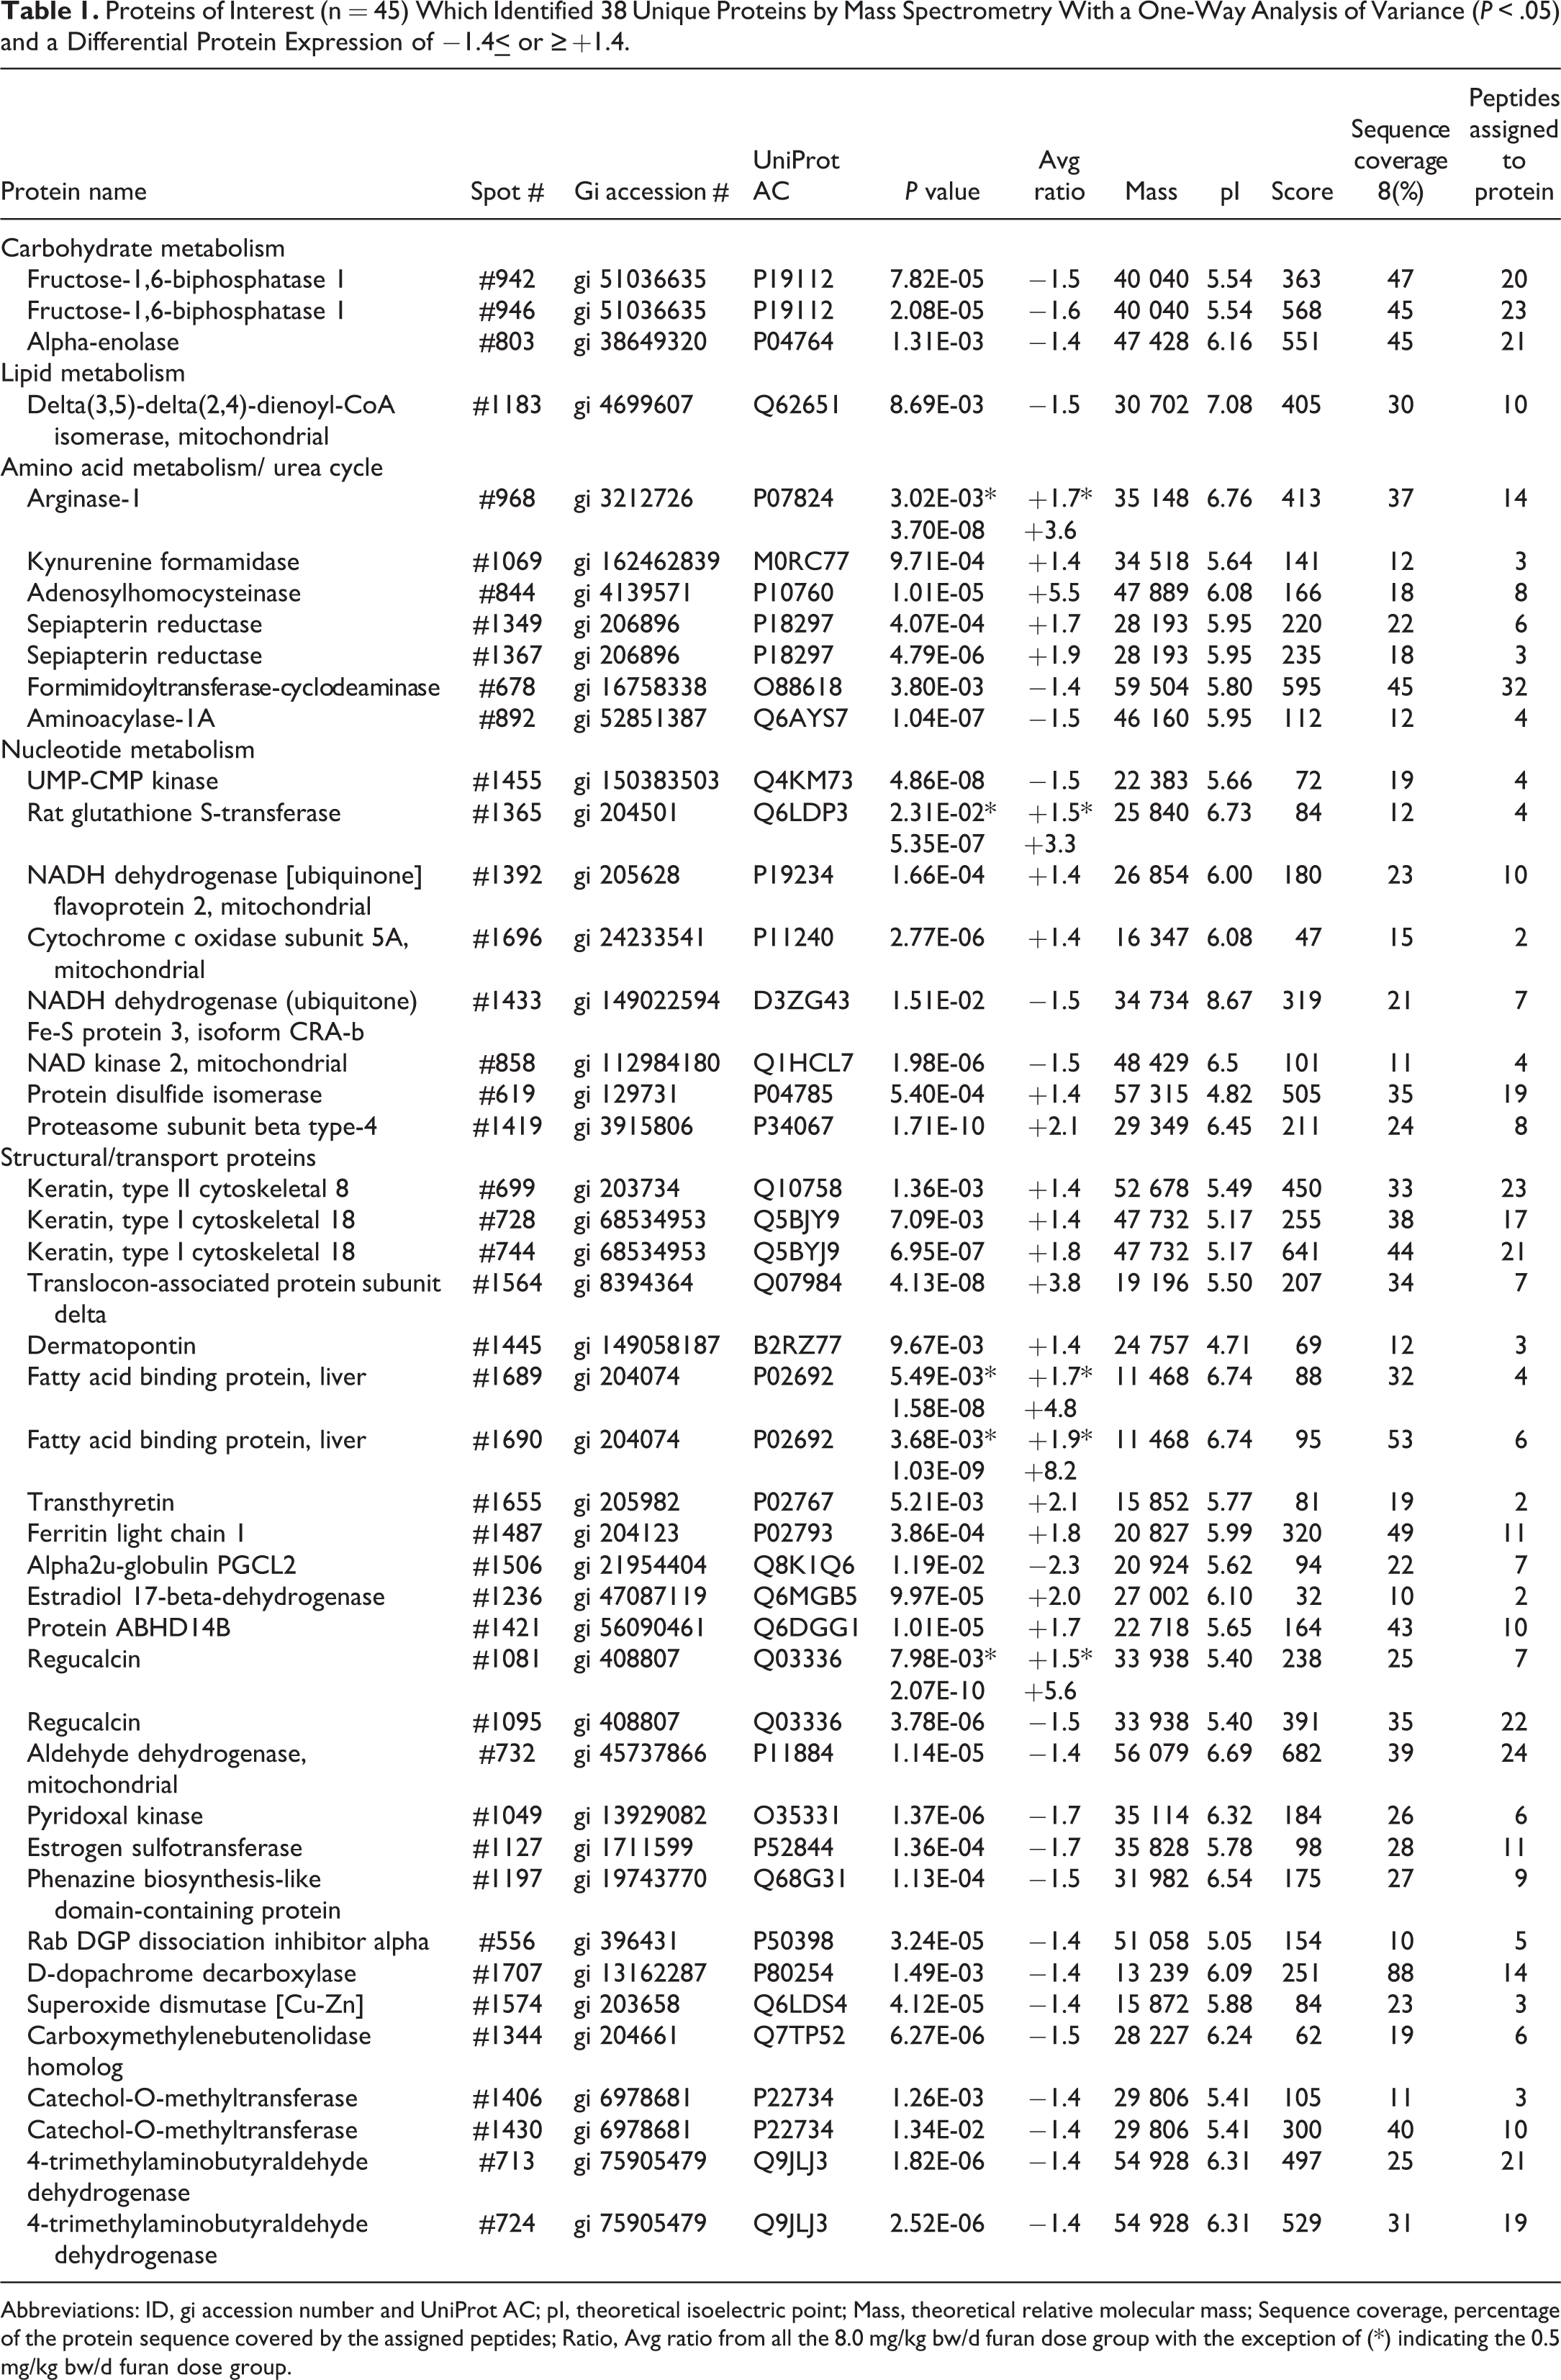
Abbreviations: ID, gi accession number and UniProt AC; pI, theoretical isoelectric point; Mass, theoretical relative molecular mass; Sequence coverage, percentage of the protein sequence covered by the assigned peptides; Ratio, Avg ratio from all the 8.0 mg/kg bw/d furan dose group with the exception of (*) indicating the 0.5 mg/kg bw/d furan dose group.
Principal component analyses were conducted on the data set (P < .05, avg ratio −1.4
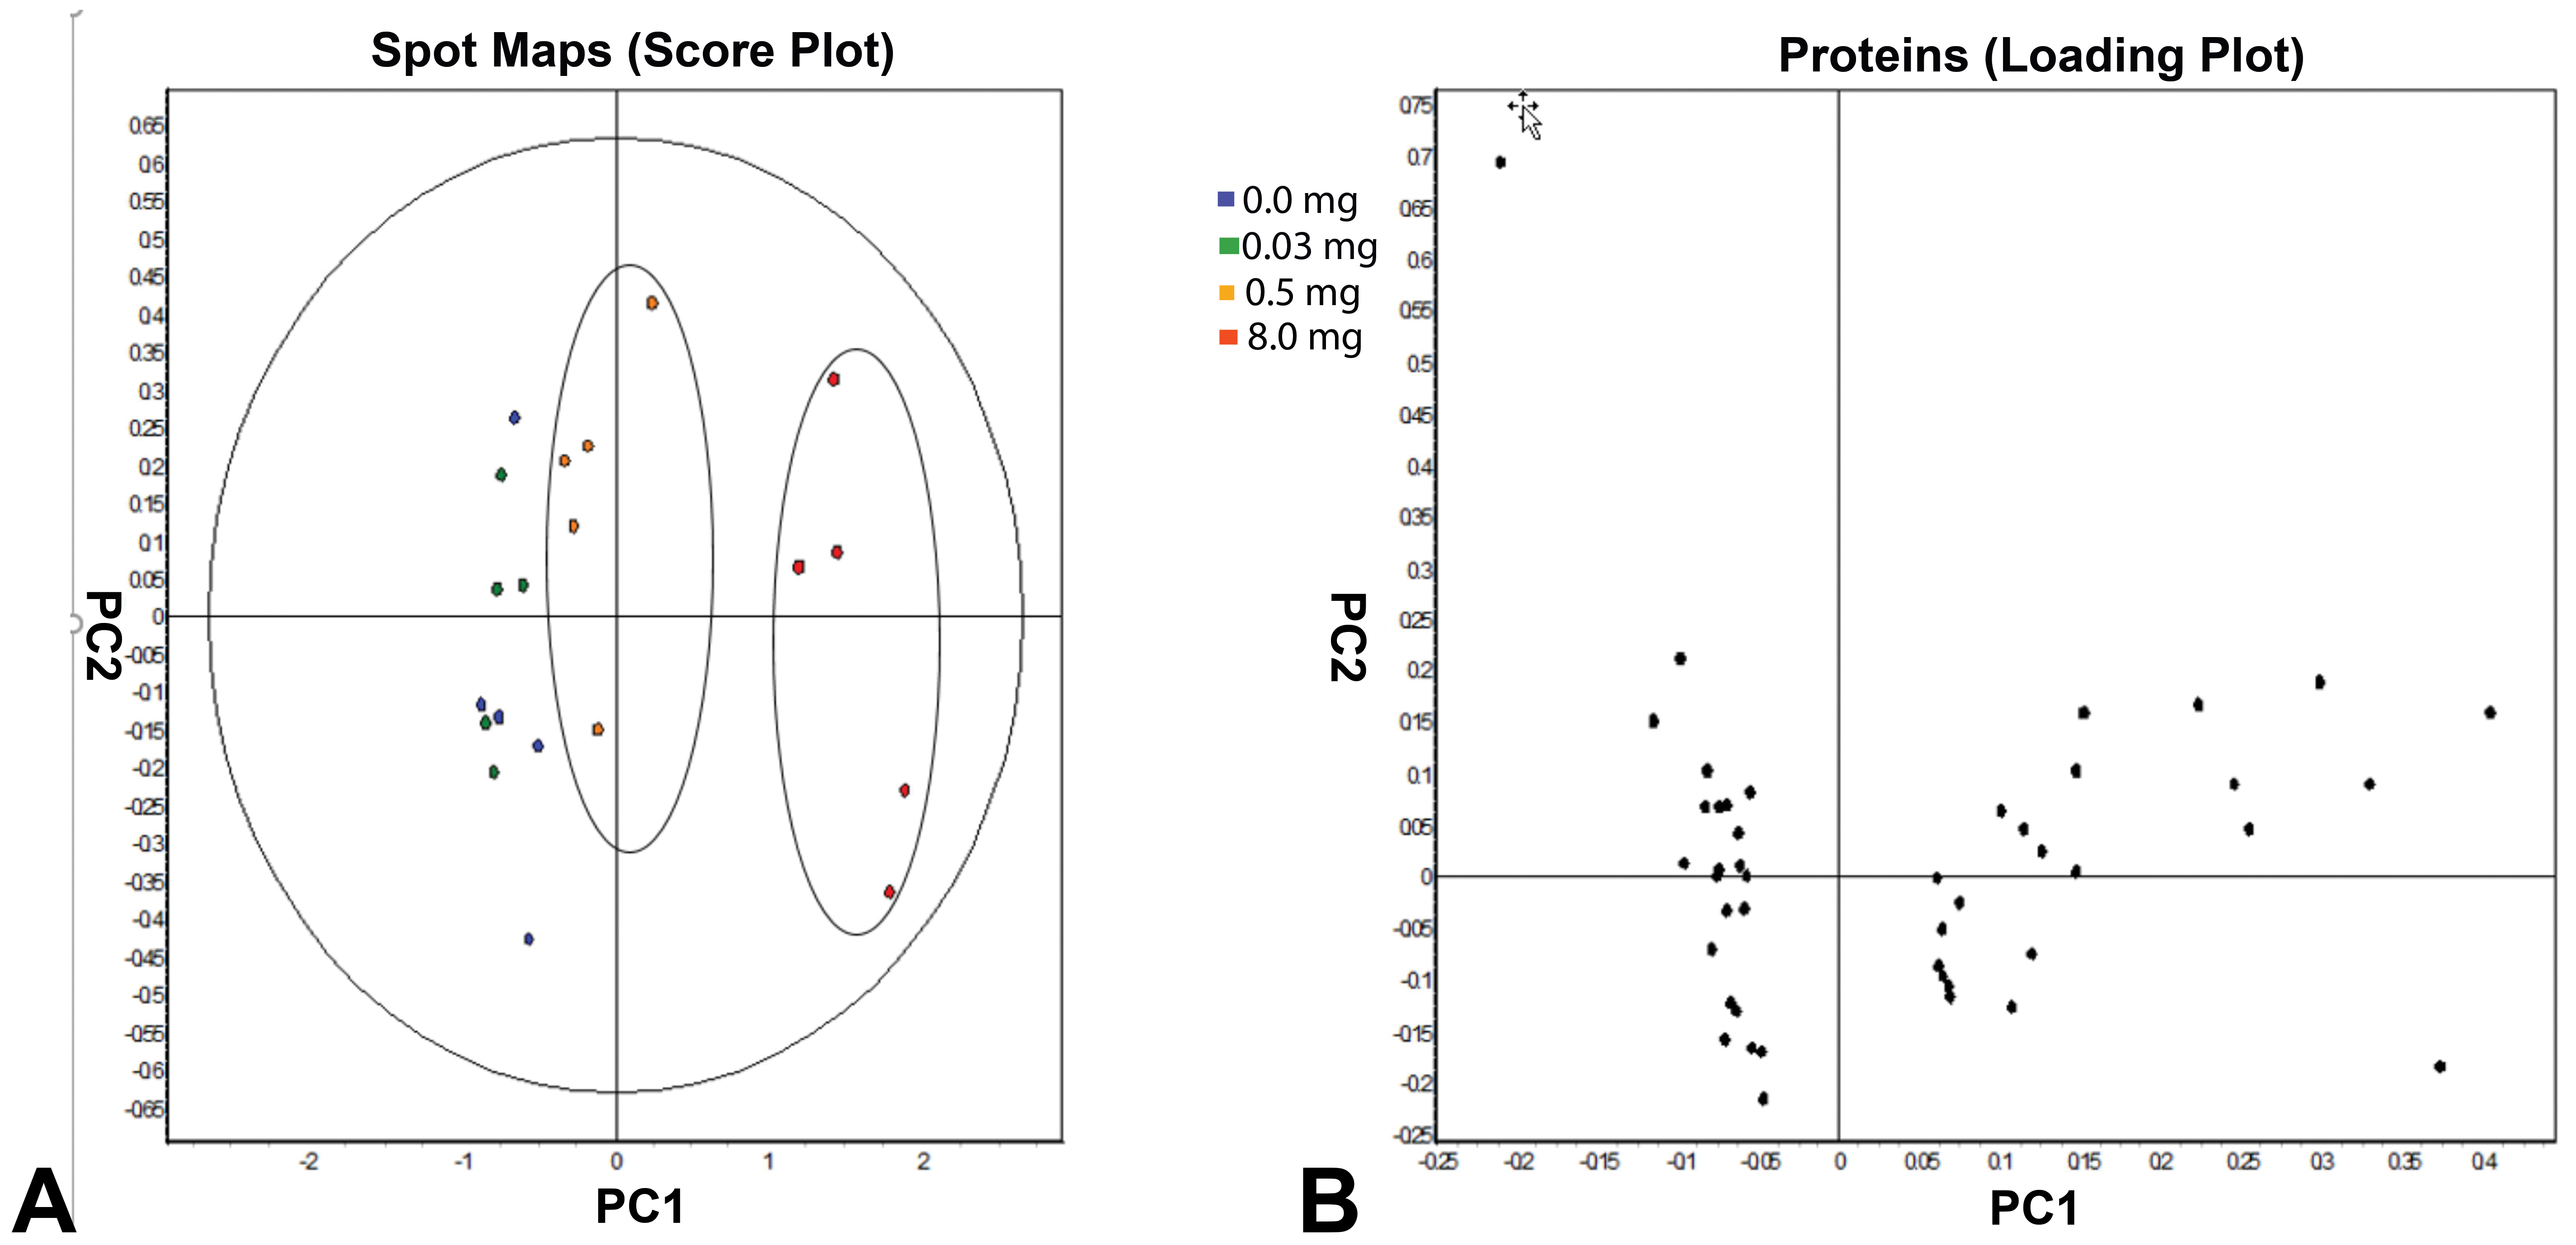
Identified protein spots (one-way analysis of variance, P < .05, avg ratio −1.4≤ or ≥ +1.4, n=45). A, The spot maps belonging to each dose are grouped together showing that biological replicates are responding in similarly, thus demonstrating a high reproducibility among the replicates. The 0.5 and 8.0 mg/kg bw/d of furan exposure show increased separation from lower doses, especially in the latter dose. B, The loading plot shows individual proteins (n = 45) randomly labeled spot maps as a result of furan exposure. The 8.0 mg/kg bw/d dose group is clustered apart from the remaining dose groups.
Hierarchical clustering was performed on the identified protein spots (P < .05, avg ratio −1.4
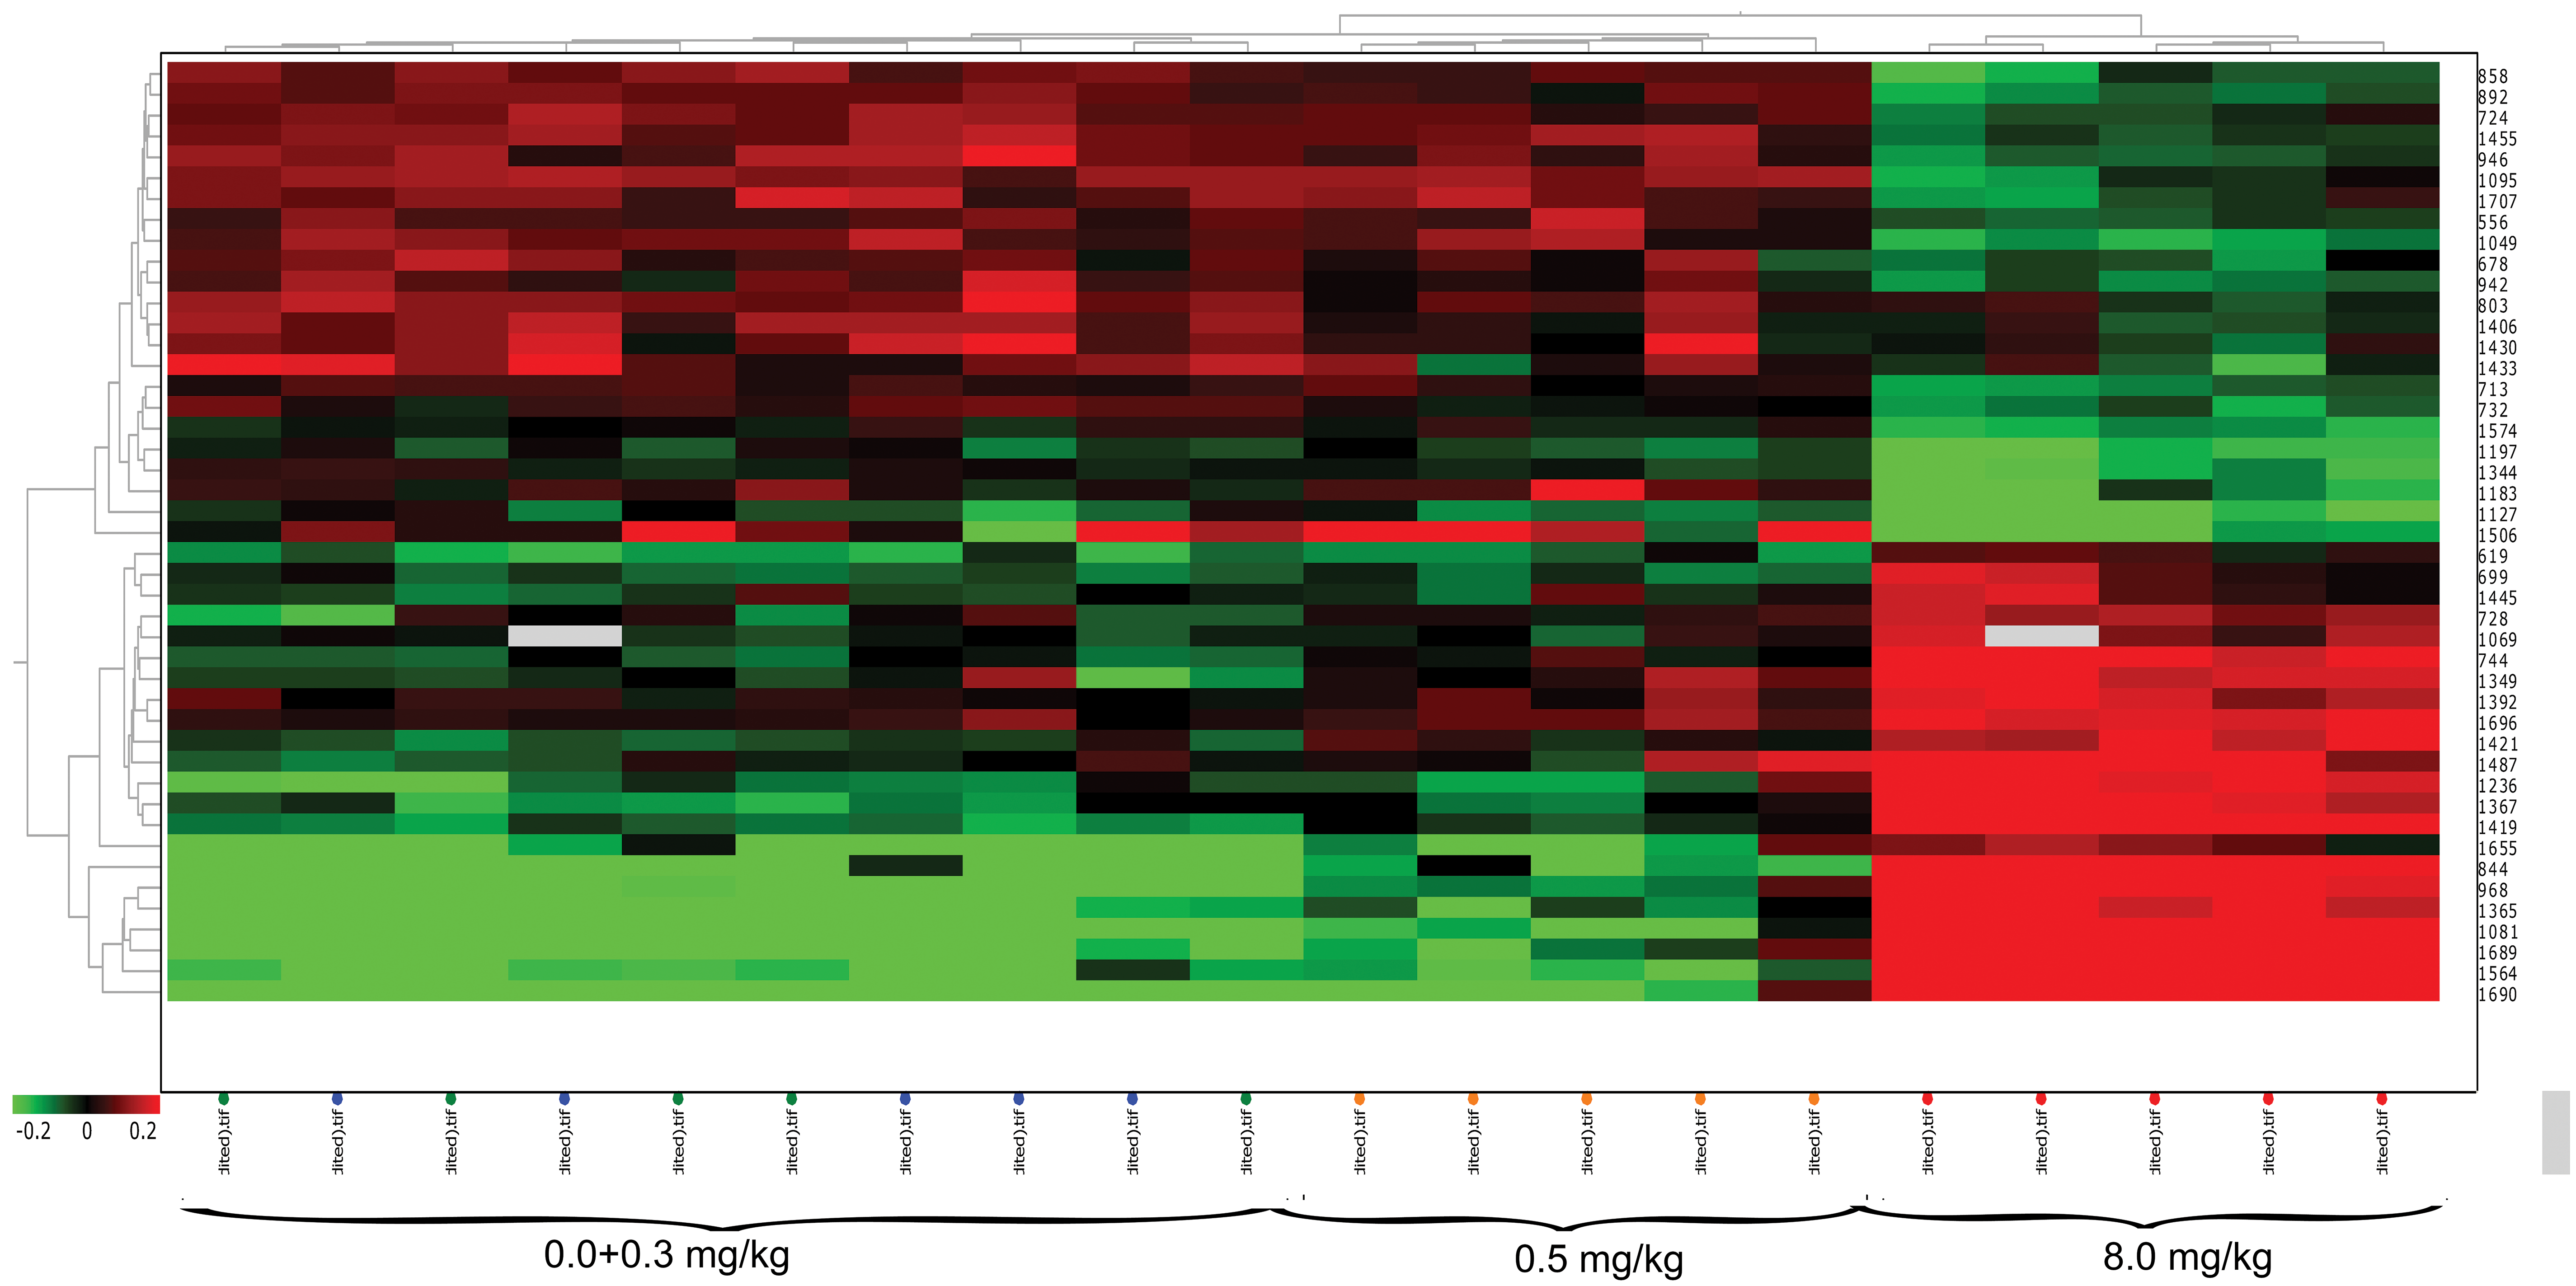
Hierarchical cluster analysis of all significant identified protein spots (one-way analysis of variance, P < .05, avg ratio −1.4≤ or ≥ +1.4). Heat map analysis shows that biological samples are clustered together within each dose group and the 0.5 and 8.0 mg/kg bw/d are clearly separated from the lower doses.
K-means analyses were performed on the same data set of identified proteins (P < .05, avg ratio −1.4
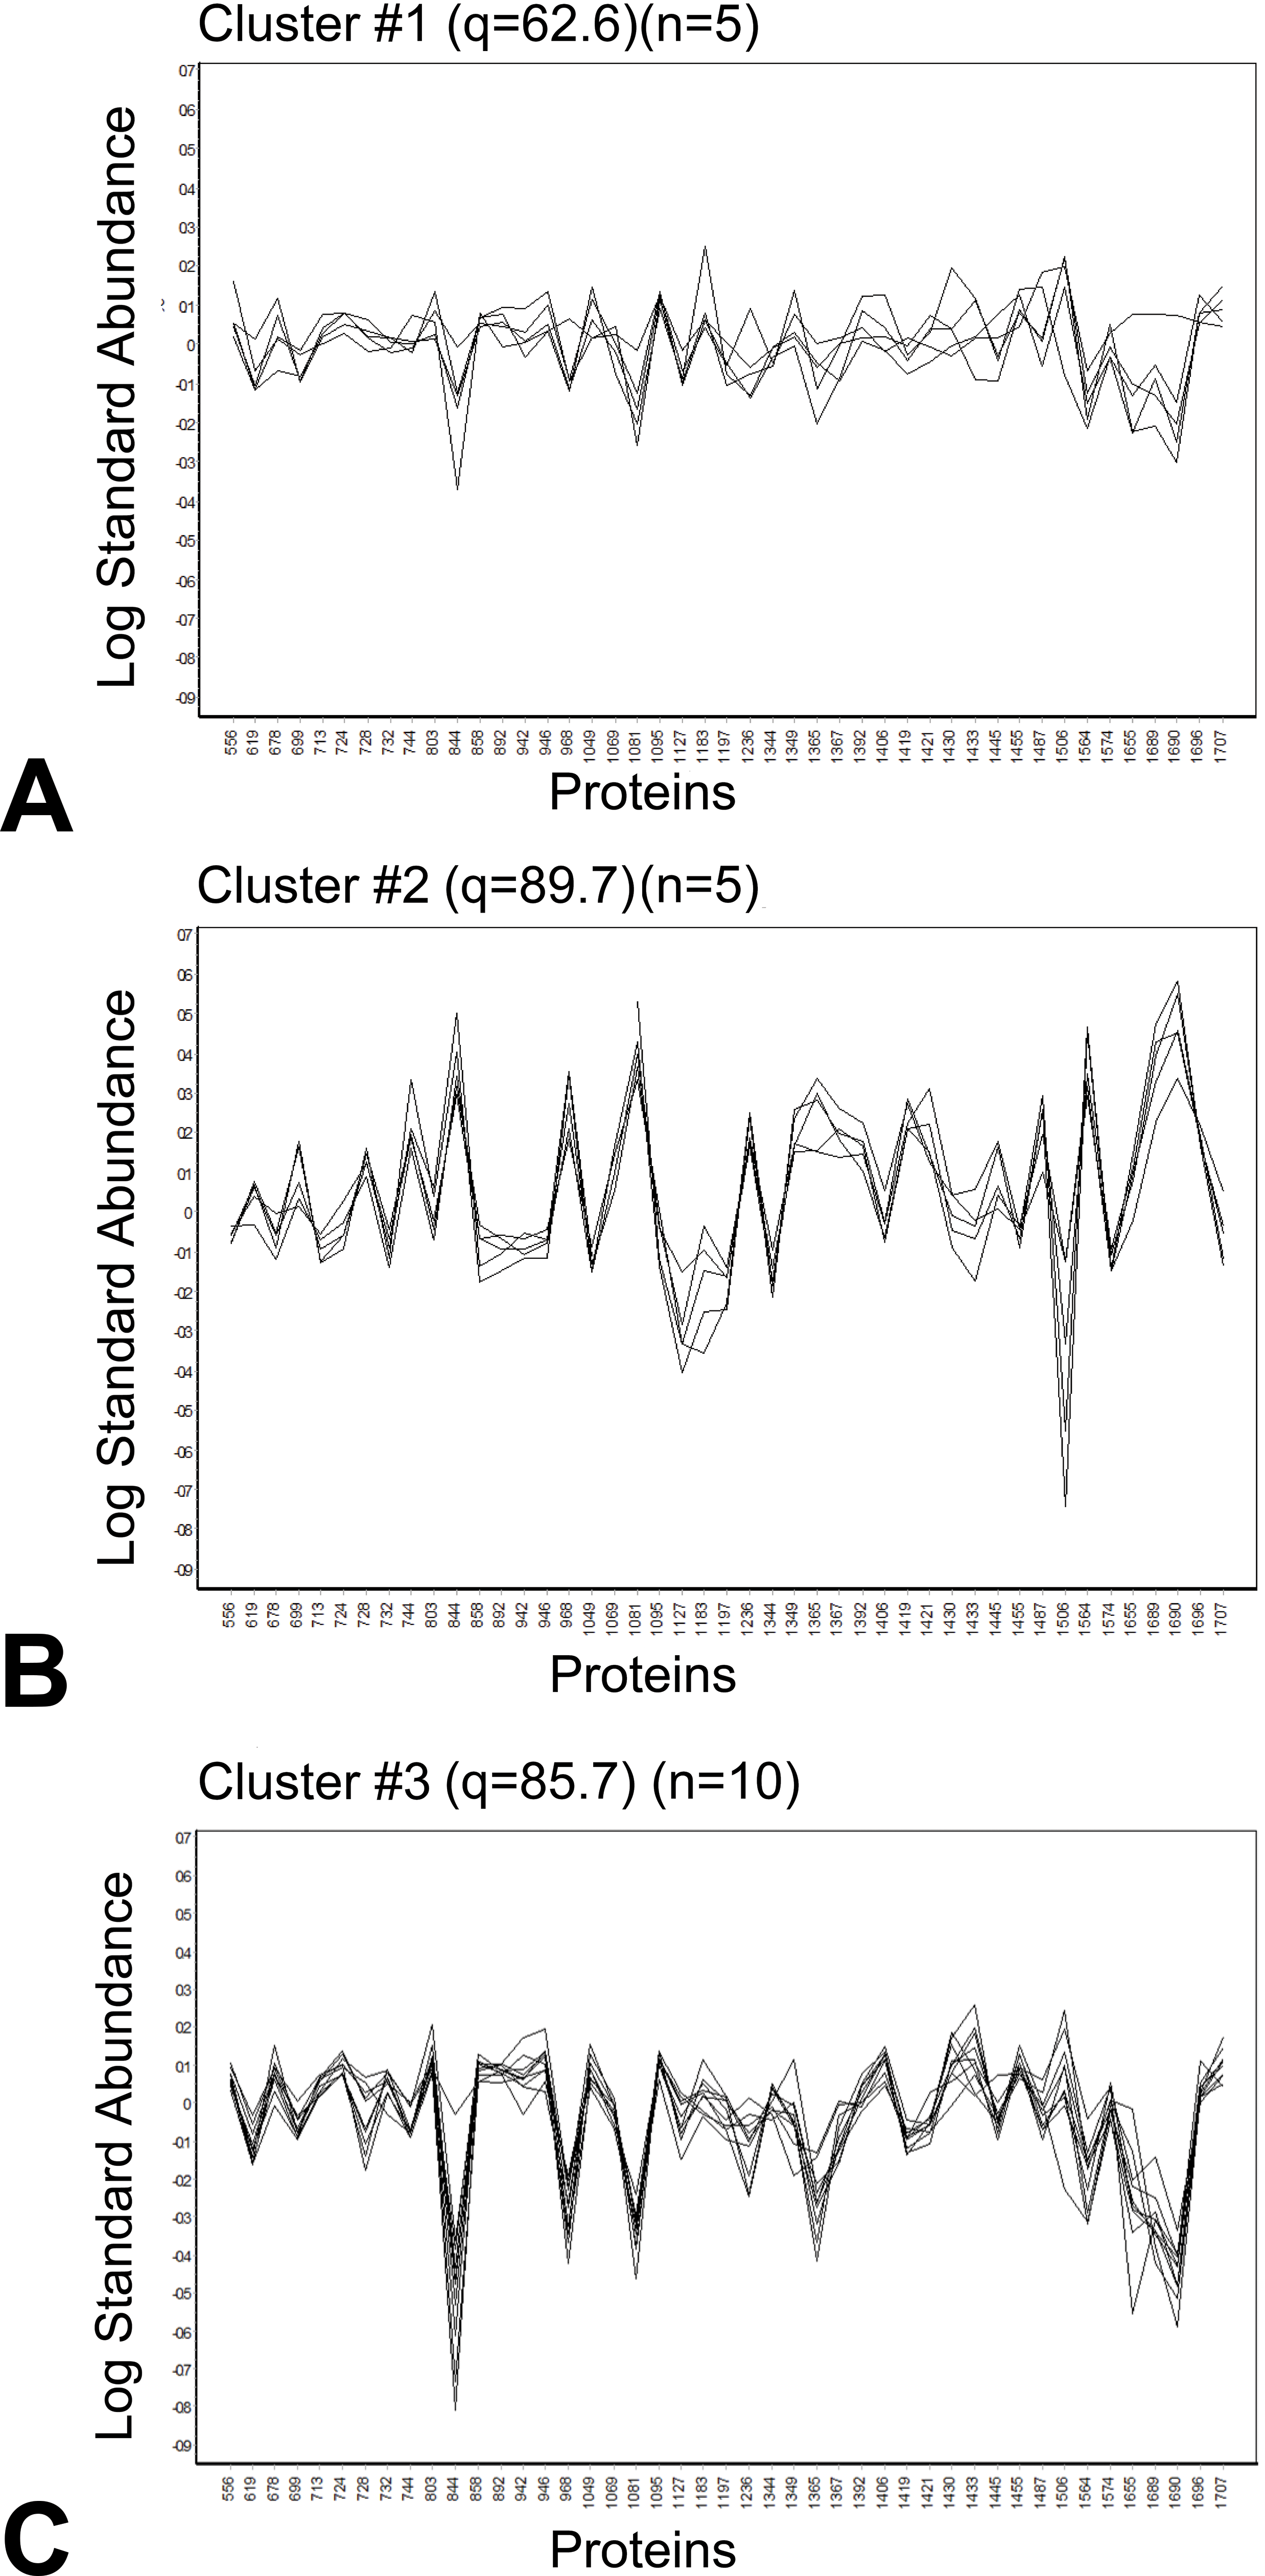
K-means analysis of liver samples of male rats treated with various doses of furan. Spot maps of proteins were used to identify clusters by furan dose. A, Cluster #1 (q = 62.6; n = 5), all 0.5 mg/kg bw/d. B, Cluster #2 (q = 89.7; n = 5), all 8.0 mg/kg bw/d. C, Cluster #3 (q = 85.7; n = 10), all control and .03 mg/kg bw/d.
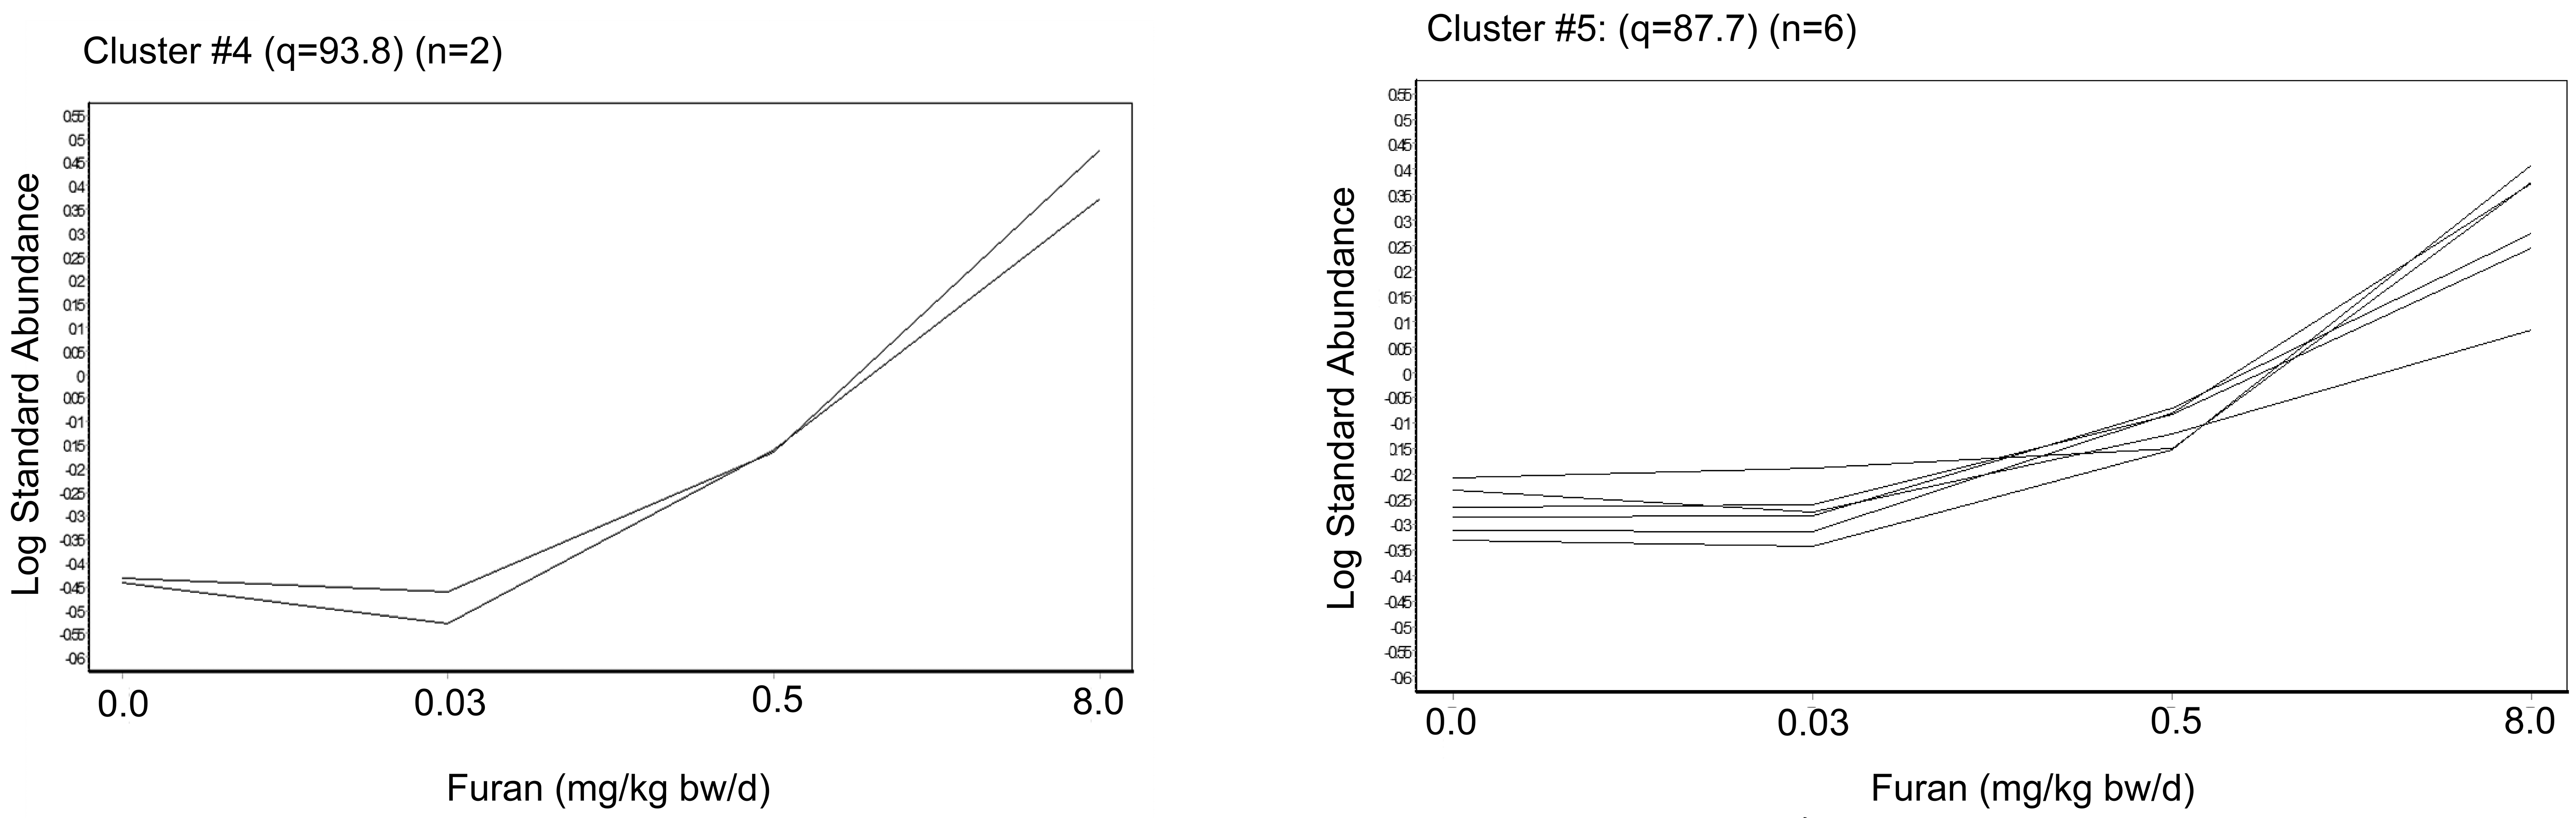
K-means analysis showing 2 main significant clusters of identified proteins (one-way analysis of variance, P < .05, avg ratio −1.4≤ or ≥+1.4) (n = 45). Both of these clusters had significant upregulation in proteins. A, Cluster #4 (q = 93.8; n = 2) B, Cluster #5 (q = 87.8; n = 6).
The differential expression of proteins was examined at each dose of furan compared to the control. At the lowest dose of 0.03 mg/kg bw/d furan dose, there were no changes in the proteins identified. The 0.5 mg/kg bw/d furan dose group had 5 significant POIs (P < 0.05, avg ratio −1.4
Functional and Biological Categorization of Furan Target Proteins
Proteomic analysis identified 45 protein spots with 38 unique proteins in which similar numbers of upregulated and downregulated proteins were found (Table 1). Pathway mapping of the 38 unique identified proteins through DAVID (Table 2) showed significantly enriched KEGG pathways which included metabolic pathways (20/38), biosynthesis of antibiotics (8/38), and glycolysis/gluconeogenesis (4/38). The GO category biological process showed enriched pathways of oxidation-reduction process (7/38), negative regulation of apoptotic process (6/38), response to a drug (5/38), and liver development (4/38). The GO category molecular function identified enriched areas of protein homodimerization activity (6/38) and identical protein binding (6/38). The GO category cellular component showed enriched terms of extracellular exosome (27/38), cytoplasm (21/38), cytosol (12/38), mitochondrion (11/38), myelin sheath (7/38), neuron projection (5/38), and protein complex (5/38).
Pathway Mapping of Unique Identified Proteins of Interest by DAVID Analysis.a
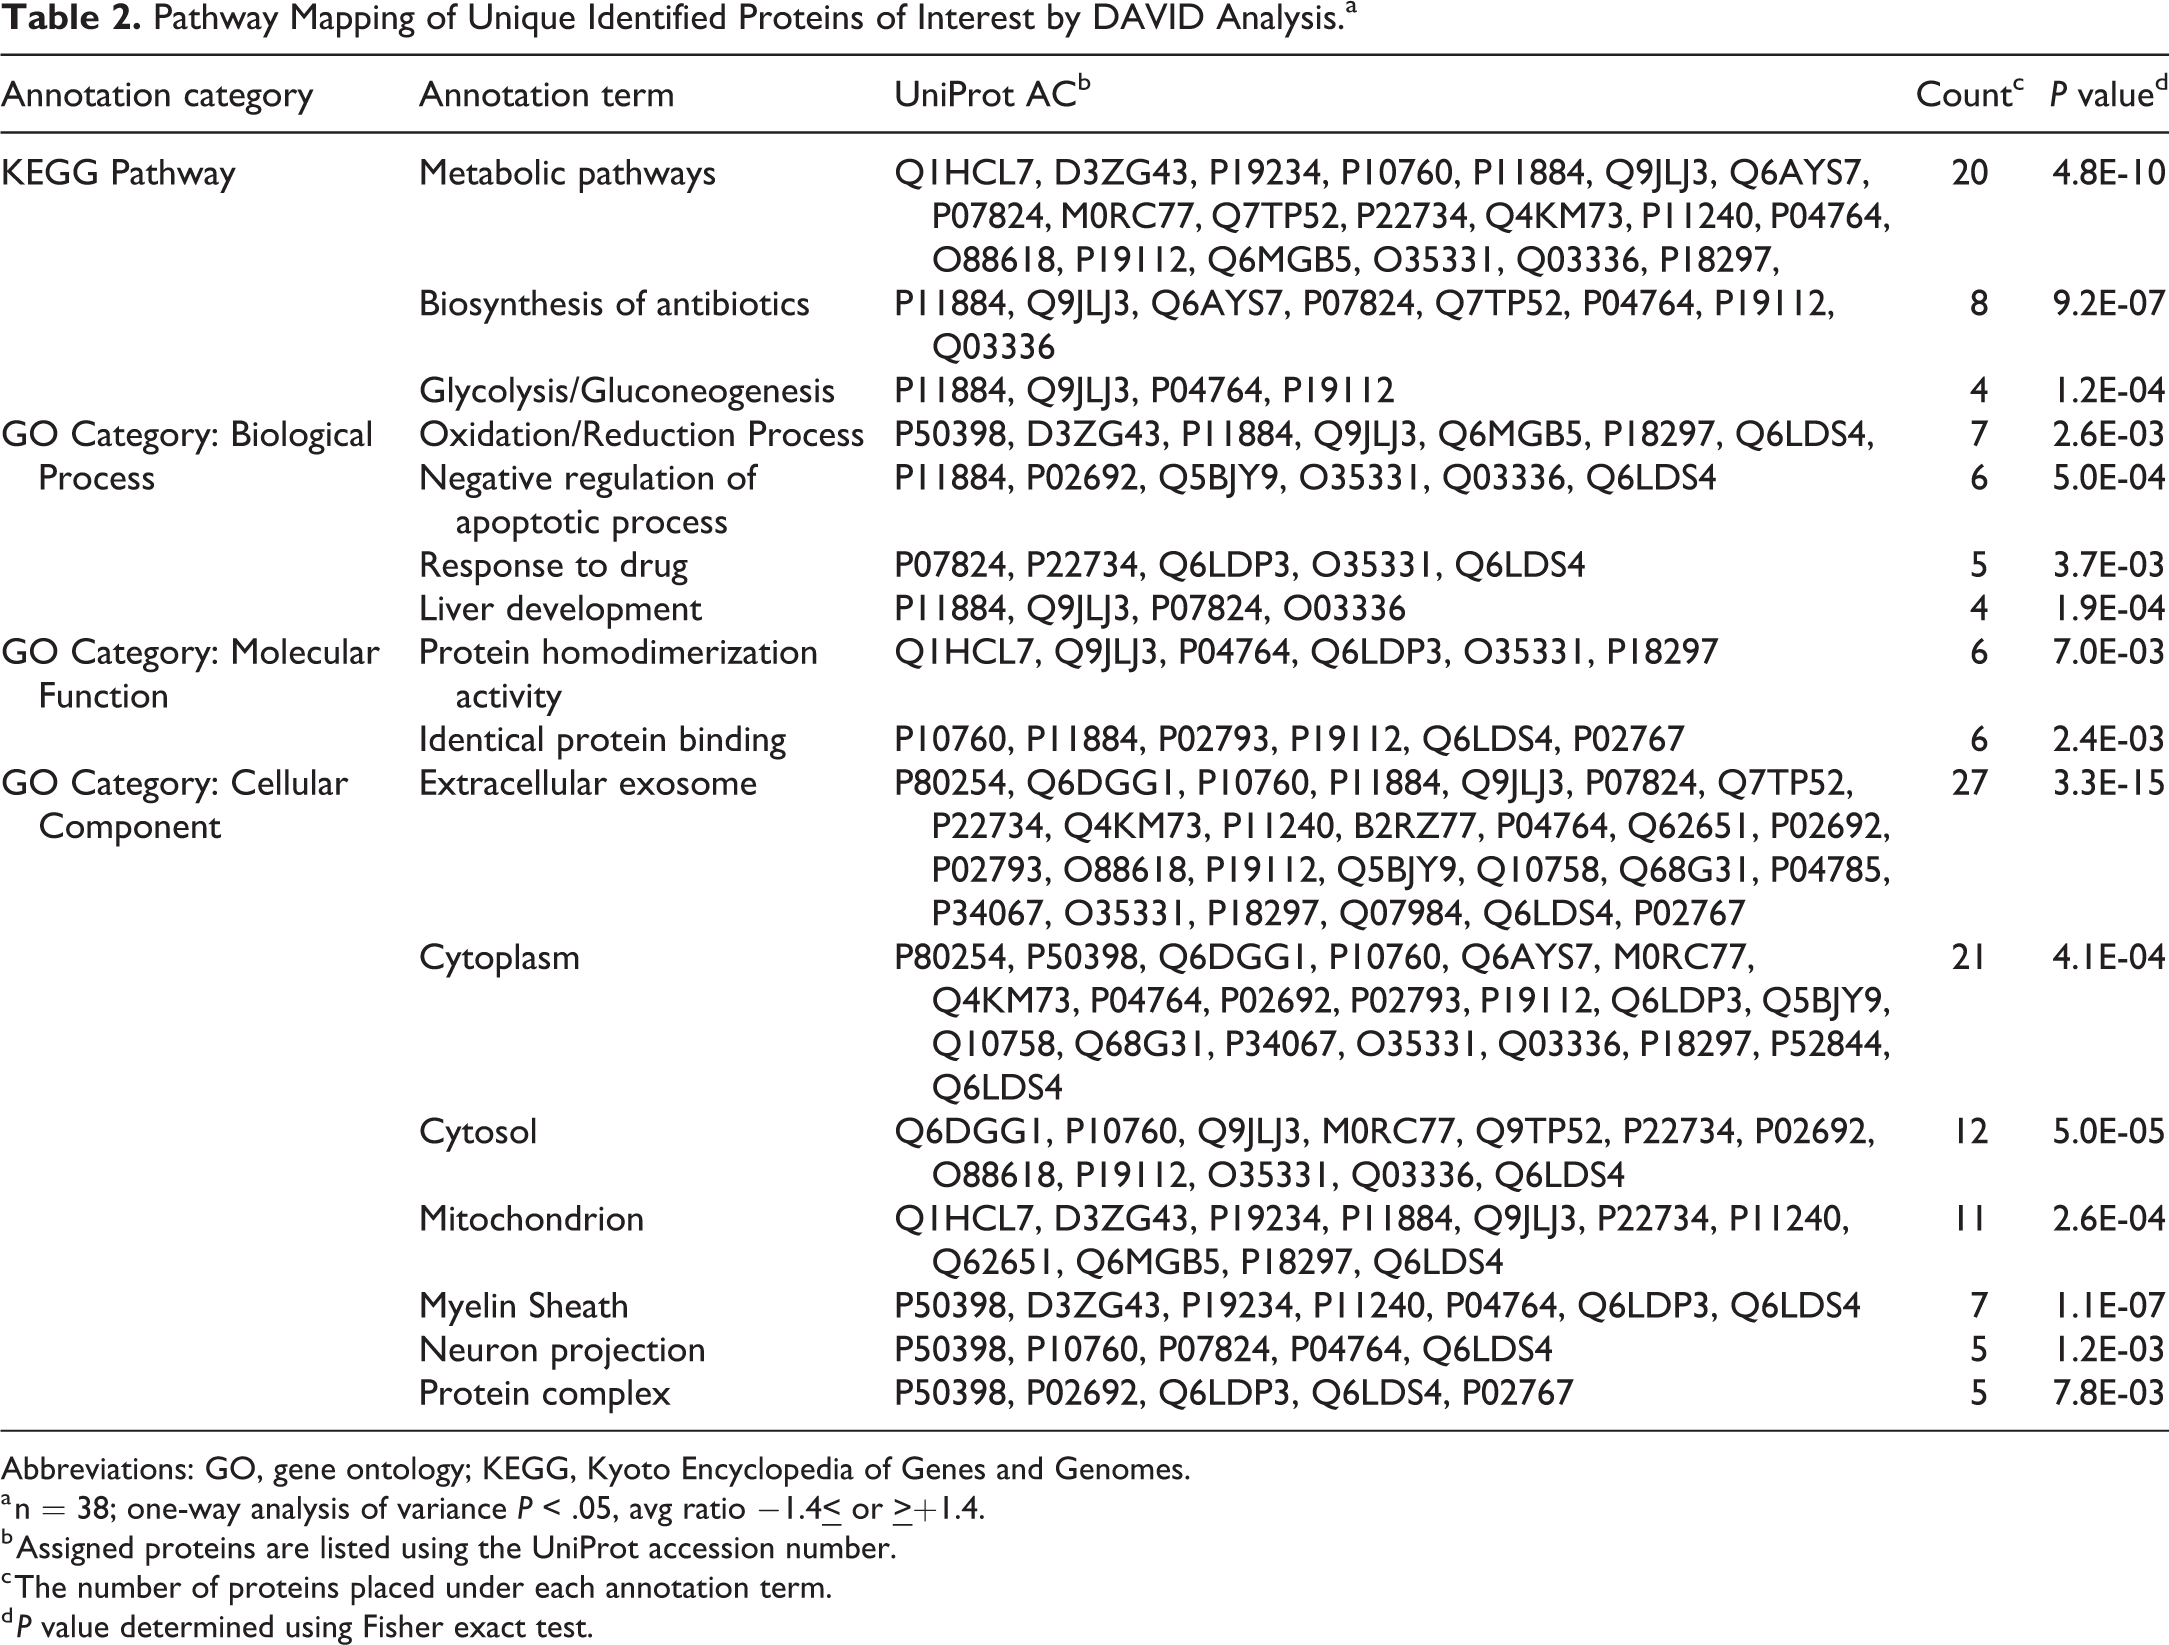
Abbreviations: GO, gene ontology; KEGG, Kyoto Encyclopedia of Genes and Genomes.
a n = 38; one-way analysis of variance P < .05, avg ratio −1.4
b Assigned proteins are listed using the UniProt accession number.
c The number of proteins placed under each annotation term.
d P value determined using Fisher exact test.
Discussion
Previously we conducted a subchronic 90-day study in Fisher 344 rats exposed to 0, 0.03, 0.12, 0.5, 2.0, and 8.0 mg/kg bw/d of furan. 2 There were histological changes starting at the 0.12 mg/kg bw/d of furan exposure which included mild subcapsular lesions, hepatocyte apoptosis, Kupffer cells filled with yellowish pigment, and small foci of inflammatory cells in the caudate lobe. There was a dose-dependent increase from the mild lesions in the caudate lobe to extensive areas of cholangiofibrosis in the caudate and the left lobe of the highest dosed animals. 2 Based on this data, a NOAEL of 0.03 mg/kg bw/d was proposed. 2 To understand the molecular events associated with this hepatotoxicity, transcriptional profiles were performed. 21 Gene expression analysis showed that various pathways involved in liver injury, inflammation, oxidative stress, cell-cycle perturbations, and apoptosis were identified contributing to the apical endpoints. The current study focused on the possible liver toxicoproteomic changes in male rats at 0, 0.03, 0.5, and 8.0 mg/kg bw/d of furan administration. Overall, statistical analysis revealed a dose-dependent increase in the number of differentially expressed proteins compared to the controls. There were no protein changes at the 0.03 mg/kg bw/d dose of furan exposure. This further supports our NOAEL of 0.03 mg/kg bw/d for furan hepatic toxicity as suggested by our animal study. 2
At the 0.5 mg/kg bw/d dose of furan exposure, there were 4 unique proteins whose expression was increased. The same proteins showed an increased expression in the 8.0 mg/kg bw/d exposure. These were arginase-1, fatty acid binding protein (Fabp), glutathione–S-transferase (GST), and regucalcin. These proteins belong to different pathways of detoxification/cytoprotection suggesting concerted actions of stress response pathways. Arginase-1 is a critical enzyme in the final step of the urea cycle to eliminate toxic ammonia produced by amino acid metabolism through a conversion of L-arginine to L-ornithine and urea which is then eliminated through the bloodstream to the kidneys. The antioxidant defense system is a key factor that prevents oxidative stress seen by the increase in the detoxification enzyme GST. Fatty acid binding protein is speculated to have an important cytoprotective role by binding potentially toxic fatty acids, heme, and other unbound molecules that may cause severe cytotoxicity. 33 These proteins were upregulated dose-dependently in concomitant with changes in various other proteins involved in xenobiotic metabolism. The Fabp protein was also previously reported to be one of the most heavily adducted by reactive furan metabolites. 34 At higher dose of furan exposure, Fabp protein was found in 2 different protein spots. These duplications are likely due to posttranslational modifications that change the pI and possible function of the protein thus appearing as 2 spots when undergoing first-dimensional separation. 35 Regucalcin was also found to be upregulated in a dose-dependent manner at the 0.5 and 8.0 mg/kg bw/d furan doses but in addition, one spot was found to be downregulated at the highest dose. This is acceptable as regucalcin plays a multifunctional role in cell regulation by maintaining intracellular Ca2+ homeostasis and by suppressing signal transduction, protein synthesis, cell proliferation, and apoptosis. 36
At the 8.0 mg/kg bw/d dose, from the 45 protein gel spots identified there were 38 unique proteins differentially expressed (Table 1). At repeated exposure at these high concentrations, additional multiple cellular stress pathways were triggered including those of the endoplasmic reticulum (ER) and other pathways including DNA damage and hypoxia. The activation of these pathways may underlie changes at the cellular and/or organ level observed in our previous study. 2 Pathway mapping of these proteins revealed enriched pathways which include areas of metabolism, redox regulation, protein folding/proteolysis in addition to many transport and structural proteins (Tables 1 and 2). Previous reports have identified these areas to be involved in furan toxicity and as proteins to be the most heavily adducted by the reactive metabolite cis-2-butene-1,4-dial. 21,34,37
Metabolism
The KEGG pathway that was highly enriched was the annotation term metabolic pathways. This supports the significant decreases in blood glucose and triglyceride levels observed in the 28- and 90-day studies of furan administration in Fischer rats. 2,30 The protein delta(3,5)-delta(2,4)-Dienoyl-CoA isomerase, mitochondrial involved in fatty acid β-oxidation was found to be downregulated compared to the controls at the highest dose. Genes involved in activated fatty acid transport into mitochondria, β-oxidation, and ketogenesis were also found to be downregulated. 32 A metabolomics study 38 reported increased levels of endogenous metabolites from fatty acid oxidation in livers of animals exposed to furan, which suggests an increase of fatty acids as an energy source due to decreases in serum triglyceride levels. 2 This is supported by the increase of the Fabp, which is also a key regulator of fatty acid metabolism. This study identified a second enriched KEGG pathway as glycolysis/gluconeogenesis. Proteins identified that were attributed to this pathway included the mitochondrial enzymes α-enolase, fructose-1,6-biphosphate, aldehyde dehydrogenase, and 4-trimethylamino-butryaldehyde dehydrogenase which were all downregulated. Glycolysis/gluconeogenesis was also identified as an enriched pathway 34 by investigating the target proteins of furan reactive intermediates for the potential loss of target protein function leading to furan toxicity. Studies by Ramm et al 38 support the inhibition of the glycolysis pathway, suggesting an alternate source of ATP production. This alternate source of ATP production could be the amino acids that are released through proteolysis due to hepatocyte injury. 38 Interestingly, this study also identified several upregulated proteins involved in amino acid metabolism and the urea cycle. Significant increases in various amino acids including arginine, aspartate, glutamate, glutarate, lysine, and ornithine were previously reported. Some of these amino acids can also serve as a precursor for polyamine and proline synthesis which are vital to tissue repair processes following injury. 39
Redox Regulation
Disruptions to redox regulation causing ATP depletion and oxidative stress have been suggested as a mechanism of furan toxicity. In this study, the GO cellular component category mitochondrion and GO biological process category oxidation/reduction process were enriched (Table 2). This included significant changes in protein levels identified at various stages of the electron transport chain (Complex I and IV), detoxification, and lipid metabolism. Specifically, it included the downregulation of NADH dehydrogenase [ubiquitone] Fe-S protein 3, isoform CRA-b (Complex I) and NAD kinase 2, mitochondrial (Complex I) and the upregulation of NADH dehydrogenase [ubiquinone] flavoprotein 2, mitochondrial (Complex I) and cytochrome c oxidase subunit 5A, mitochondrial (Complex IV) of the electron transport chain (Table 1). The disruptions to the electron transport chain causing the depletion of ATP production results in an increase of reactive oxygen species (ROS) known to trigger inflammation, damage, protein denaturation, and/or lipid peroxidation. Mugford et al 40 showed that furan induced changes in proteins participating in mitochondrial energy production and that toxicity may be linked to ATP depletion. We also observed a decrease at the highest dose in superoxide dismutase (Cu-Zn) which suggests increasing ROS levels and associated damage. The disruption to redox homeostasis explains the additional protein changes identified in detoxification (aldehyde dehydrogenase, 4-trimethylaminobutyraldehyde dehydrogenase, catechol-O-methyltransferase) and lipid metabolism (delta [3,5]-delta[2,4]dienoyl CoA isomerase, estradiol 17-b dehydrogenase) also known to be proteins that are heavily adducted with furan administration. This is also supported by Dong et al (2015), 21 whose pathway analysis of transcriptional changes revealed that the NRF2-mediated oxidative stress response pathway was the most significant canonical pathway enriched in their data set.
Protein Folding/Degradation
Proteins involved in proteolysis and protein folding are part of the unfolded protein response (UPR), a homeostatic control mechanism which serves to prevent toxicity associated with accumulation of unfolded proteins. 21,32,34 Inactivation of protein function by covalent binding of furan or its reactive metabolites impairs its ability to respond thus suggested as a method of furan toxicity. 37,41,42 Changes in protein expression patterns revealed the upregulation of protein disulfide isomerase responsible to catalyze the formation, breakage, and rearrangement of disulfide bonds which at higher levels also acts as a chaperone to inhibit the aggregation of misfolded proteins. Proteasome subunit beta type 4 was also upregulated and important in protein homeostasis by removing misfolded/damaged proteins from impairing cellular functions. Interestingly, studies have reported that the UPR was not activated but the proteins involved in protein folding/proteolysis are heavily adducted by furan and its reactive metabolites. 34 They suggest that furan toxicity is independent of the accumulation of misfolded proteins or that losing their functionality through adduction and the inability to respond to the increasing number of damaged proteins.
Structural/Transport Proteins
The structural and transport proteins serve a dual role through transport processes involved in metabolic flow to allow exchange of materials among different cellular organelles. Our proteomic analysis revealed several structural proteins that were all upregulated with furan administration. Keratins are essential for tissue integrity and are involved in intracellular signaling pathways that regulate cell response to injuries, cell growth, and death. Keratin type I cytoskeletal 18 and its coexpressed complementary partner keratin type II cytoskeletal 8 were both upregulated at the highest dose and have been shown to be expressed in a variety of adult epithelial organs such as the liver, lung, kidney, pancreas, gastrointestinal tract, and mammary gland and in cancers that arise from these same tissues. 43,44 Weng et al 43 suggested that cytoskeletal 18 may affect carcinogenesis through several signaling pathways including the phosphoinositide 3-kinase/Akt, Wnt, extracellular signal-regulated kinase (ERK), and mitogen-activated protein kinase (MAPK) signaling pathways. Transcription profiling showed that the p38/ERK MAPK signaling pathways were affected in exposure to furan. 21 Mitogen-activated protein kinases are signaling components that are important in converting extracellular stimuli into a wide range of cellular responses that integrate signals that affect proliferation, differentiation, survival, and migration. 45,46 A structural extracellular matrix protein dermatopontin was also upregulated that promotes cellular adhesion and matrix assembly. Translocon-associated protein (TRAP) subunit delta was the highest upregulated structural protein in this study. It is part of the TRAP protein complex that binds calcium to the ER membrane thus regulating the retention of ER proteins. Both structural and transport proteins have been identified as the most adducted proteins by furan and its reactive metabolites. 34 These authors suggest that these high abundance proteins may be used for binding reactive furan metabolites to prevent further insult and loss of protein function critical for cell survival. There were 2 proteins keratin 18 and Fabp which were located at 2 different spots, possibly these shifts could be explained by the formation of adducts with these proteins. Hence, binding to this high abundance protein functions an additional means of detoxification/inactivation of reactive furan metabolites.
Several high abundance transport proteins were altered thus supporting an increased demand for detoxification/inactivation of reactive metabolites. As stated earlier, Fabp was found to be upregulated in a dose-dependent manner. This is a multifunctional protein which binds to a broad range of ligands including cholesterol and free fatty acids, the latter representing the most avidly bound ligand class with 2 molecules of fatty acid bound per molecule of Fabp. This protein is known to play a crucial role in intracellular fatty acid trafficking and protection against the potential adverse effects of free fatty acids. These ligands are transported to the liver where the fatty acid amides are involved in fatty acid oxidation and cholesterol catabolism. The ligands are also imported into the nucleus where they interact with peroxisome proliferator-activated receptor and retinoic acid receptors and/or metabolic enzymes. 47 Peroxisome proliferator-activated receptors are implicated in major metabolic and inflammatory regulations with the consequences of controlling cellular fate. 48 These signaling pathways were altered in our transcriptional analysis. 21 Studies have also shown that variants of the Fabp protein have increased cholesterol binding affinity which may impact lipoprotein-mediated cholesterol uptake and accumulation in hepatic cells. 47 Our previous study reported an increase of preproapolipoprotein A-1 in the serum, 28 which mediates the reverse transport of cholesterol peripheral sites through the vasculature to the liver for either cholesterol catabolism and/or biliary elimination. 47 The increases in both the protein levels of Fabp in the liver and preproapolipoprotein A-1 in the serum would explain the increases in cholesterol levels seen in both our 28 and 90 day furan studies. 2,30 Ferritin light chain was also upregulated at the highest dose of furan exposure. Studies have shown that ferritin mitigates oxidant stress by sequestering iron and preventing its participation in reactions that generate ROS. 49 This sequestering was also highlighted by an increase in serum macroglobulin proteins 28 serving as binders of circulatory proteinases released in response to tissue injury, necrosis, or inflammation. An increase in protein expression of transthyretin was seen at the 8.0 mg/kg bw/d furan dose which correlates to the increased serum levels of thyroid hormones T3 and T4 starting at 0.12 mg/kg bw/d and albumin at 8.0 mg/kg bw/d doses of furan. 2 Although there were increased T4 levels in the serum, the genes involved in thyroid synthesis were downregulated. It is speculated that an increase in circulating thyroid hormones is due to an increase in the serum levels of carrier proteins as the vast majority of circulating T4 is associated with these proteins. 21 Clinical biochemistry data confirm an increase in albumin levels. 2 As speculated previously, increased serum thyroid hormones levels with a concomitant hypothyroid status in liver tissues may be due to indirect effects of furan exposure (eg, metabolic enzyme induction) rather than perturbation of the hypothalamic–pituitary–thyroid axis. 21
Conclusion
Our proteomic data corroborates and shows a strong correlation to the transcriptional changes which supports that exposure to furan has an effect on various pathways of metabolism, redox reactions, and protein folding/degradation in addition to many transport and structural proteins. Decreased protein levels in areas of carbohydrate metabolism (glycolysis) and lipid metabolism (β-oxidation) were identified in conjunction with increases in amino acid/urea cycle proteins levels. Disruptions to redox regulation through the electron transport chain supports ATP depletion and the resulting increase in ROS products causing oxidative stress. Our data further demonstrates changes in protein expression levels of structural and transport proteins in addition to those involved in protein folding/proteolysis that others have shown to be heavily adducted by reactive furan metabolites. This would cause interference, a potential loss of protein function and impairment of fundamental cellular processes critical for the maintenance of cell homeostasis and integrity. At lower doses of exposure, multiple cytoprotective pathways such as xenobiotic metabolism, detoxification, and elimination are activated to maintain a homeostasis. At higher doses, these mechanisms are overwhelmed by the loss of protein function and the impairment of multiple pathways which results in hepatocellular damage.
Footnotes
Authors’ Note
The data sets generated and/or analyzed, including a large number of TIF images and image analysis data are available upon request.
Acknowledgments
Authors would like to thank Drs Catherine Smith and Tim Schrader for reviewing the manuscript.
Declaration of Conflicting Interests
The author(s) declared no potential, real, or perceived conflicts of interest with respect to the research, authorship, and/or publication of this article.
Funding
The author(s) received no financial support for the research, authorship, and/or publication of this article.