
Abstract
It is well established that hexachlorophene, which is used as an antibacterial agent, causes intramyelinic edema in humans and animal models. The hexachlorophene myelinopathy model, in which male Sprague-Dawley rats received 25 to 30 mg/kg hexachlorophene by gavage for up to 5 days, provided an opportunity to compare traditional neuropathology evaluations with magnetic resonance microscopy (MRM) findings. In addition, stereology assessments of 3 neuroanatomical sites were compared to quantitative measurements of similar structures by MRM. There were positive correlations between hematoxylin and eosin and luxol fast blue stains and MRM for identifying intramyelinic edema in the cingulum of corpus callosum, optic chiasm, anterior commissure (aca), lateral olfactory tracts, pyramidal tracts (py), and white matter tracts in the cerebellum. Stereology assessments were focused on the aca, longitudinal fasciculus of the pons, and py and demonstrated differences between control and treated rats, as was observed using MRM. The added value of MRM assessments was the ability to acquire qualitative 3-dimensional (3-D) images and obtain quantitative measurements of intramyelinic edema in 26 neuroanatomical sites in the intact brain. Also, diffusion tensor imaging (fractional anisotropy [FA]) indicated that there were changes in the cytoarchitecture of the white matter as detected by decreases in the FA in the treated compared to the control rats. This study demonstrates creative strategies that are possible using qualitative and quantitative assessments of potential white matter neurotoxicants in nonclinical toxicity studies. Our results lead us to the conclusion that volumetric analysis by MRM and stereology adds significant value to the standard 2-D microscopic evaluations.
Keywords
Introduction
Standard neuropathological assessment of the effect of toxic compounds to supraspinal areas of the central nervous system (CNS) involves routine examination of at least 7 coronal brain sections in rodents. 1,2 A microscopic evaluation of prescribed 2-dimensional (2-D) fields of view from these sections is the traditional approach for identifying suspect lesions and other abnormalities. This method draws conclusions about whole structures in the brain based on abnormal histological findings and, occasionally, linear and area measurements. 1 Magnetic resonance microscopy (MRM) and stereology complement traditional neuropathology evaluations and include both qualitative and quantitative end points such as global volume, local volume, absolute counts, surface area, and length within a 3-D space.
The aim of the present research was to compare stereology measurements with MRM assessment of the CNS. 3 Magnetic resonance microscopy is based on the same physical principles as clinical magnetic resonance imaging (MRI). Magnetic resonance imaging can be performed in vivo for small animals but with considerably lower spatial resolution. It has been adapted to the needs of pathologists and toxicologists by a number of innovations that allow scanning of fixed tissues at spatial resolution more than about ×32 000 that of clinical MRI. 4 -7 Volume changes of myelinated tracts of rats were measured using both the stereology-based Cavalieri method of volume estimation and the diffusion-weighted, 3-D renderings reconstructed from MRM scanning of the entire fixed brain. These were accompanied by light microscopy to document the myelinopathy and compare those changes with 2- and 3-D images provided by MRM.
Quantitative comparative assessments were focused on 3 regions of the brain as examples of dense white matter concentrations that are readily identified. These included the anterior commissure (aca), longitudinal fasciculus of the pons (lfp), and the pyramidal tracts (py). The thrust of the evaluation was not to compare actual numeric values of white matter volumetric changes with both methods but to determine to what extent the 2 methods provided comparable percentage changes in volume in treated and control animals. This is because in stereology, the measures are absolute calculations from several coronal light microscopic sections, while in MRM, the measurements are 3-D volumetric calculations from larger expanses of the same white matter regions.
Methods: Animals and Dosage
Male Sprague-Dawley (SD) rats (Hsd:SD, weight 320-340 g, 11-12 weeks of age) were purchased from Envigo. Rats were housed individually in ventilated caging (Techniplast) on autoclaved hardwood bedding (Sani-Chips, P.J. Murphy) with autoclaved Enviro-dri nesting material (Shepherd Specialty Papers). Rats received an autoclaved NIH-31 diet (Teklad 7017C; Envigo) and deionized, reverse-osmosis water ad libitum. Rooms were maintained on a 12:12-hour light:dark cycle at 22 ± 2 °C and at 30% to 70% humidity. Rats were acclimated to handling and housing for 1 week prior to the start of the experimental work. All procedures were conducted in accordance with the NIH Guide for the Care and Use of Laboratory Animals 8 and approved by the National Institute of Environmental Health Sciences animal care and use committee.
Dosing with hexachlorophene (100% purity) in corn oil vehicle was performed with 6 separate cohorts of 4 rats per cohort (2 controls and 2 hexachlorophene; 24 total for study). All rats were weighed daily prior to dosing. Each cohort received a single daily dose of hexachlorophene (30 mg/kg for cohorts 1-4; 25 mg/kg for cohorts 5-6) or corn oil vehicle in a volume of 10 mg/mL via oral gavage and performed between 7:30
Methods: Neuropathology
Brains were fixed in the calvarium using the fixation procedure for MRM preparation (see Magnetic Resonance Microscopy section). This involved Nembutal anesthesia and cardiac perfusion with methanol-free 10% neutral-buffered formalin (NBF) solution containing 10% gadoteridol (ProHance; Bracco Diagnostics, Inc). After additional immersion in methanol-free 10% NBF followed by 1% gadoteridol solution (in phosphate-buffered saline) and MRM evaluation, the brains were dissected free and sliced to produce 7 coronal planes according to the standard National Toxicology Program brain trimming protocol (Figure 1) as outlined by Rao et al 1 and Bolon et al Society of Toxicologic Pathology best practices 2013. 2 These brain slices were paraffin-embedded, and serial sections were obtained using a 5-µm block advance. The sections were slide mounted and then stained with hematoxylin and eosin (H&E) or luxol fast blue counterstaineds with cresyl violet (LFB/CV). Specific neuroanatomic landmarks were identified and examined via light microscopy according to Rao et al 1,9 and Paxinos and Wason. 10 Paxinos and Watson’s atlas was used in lieu of the Nomina Anatomica Veterinaria because the use of this atlas is integral to the neuroanatomic locations and calculations used by stereology and MRM. Additionally, structures in quadruped animals as brain domains can be identified more readily by non-neuroscientists using atlas images than the purely descriptive Nomina Anatomica Veterinaria text. Three regions of interest (ROIs) for stereology and associated Bregma levels were obtained from the same brain and included the aca, lfp, and py (Figure 1).
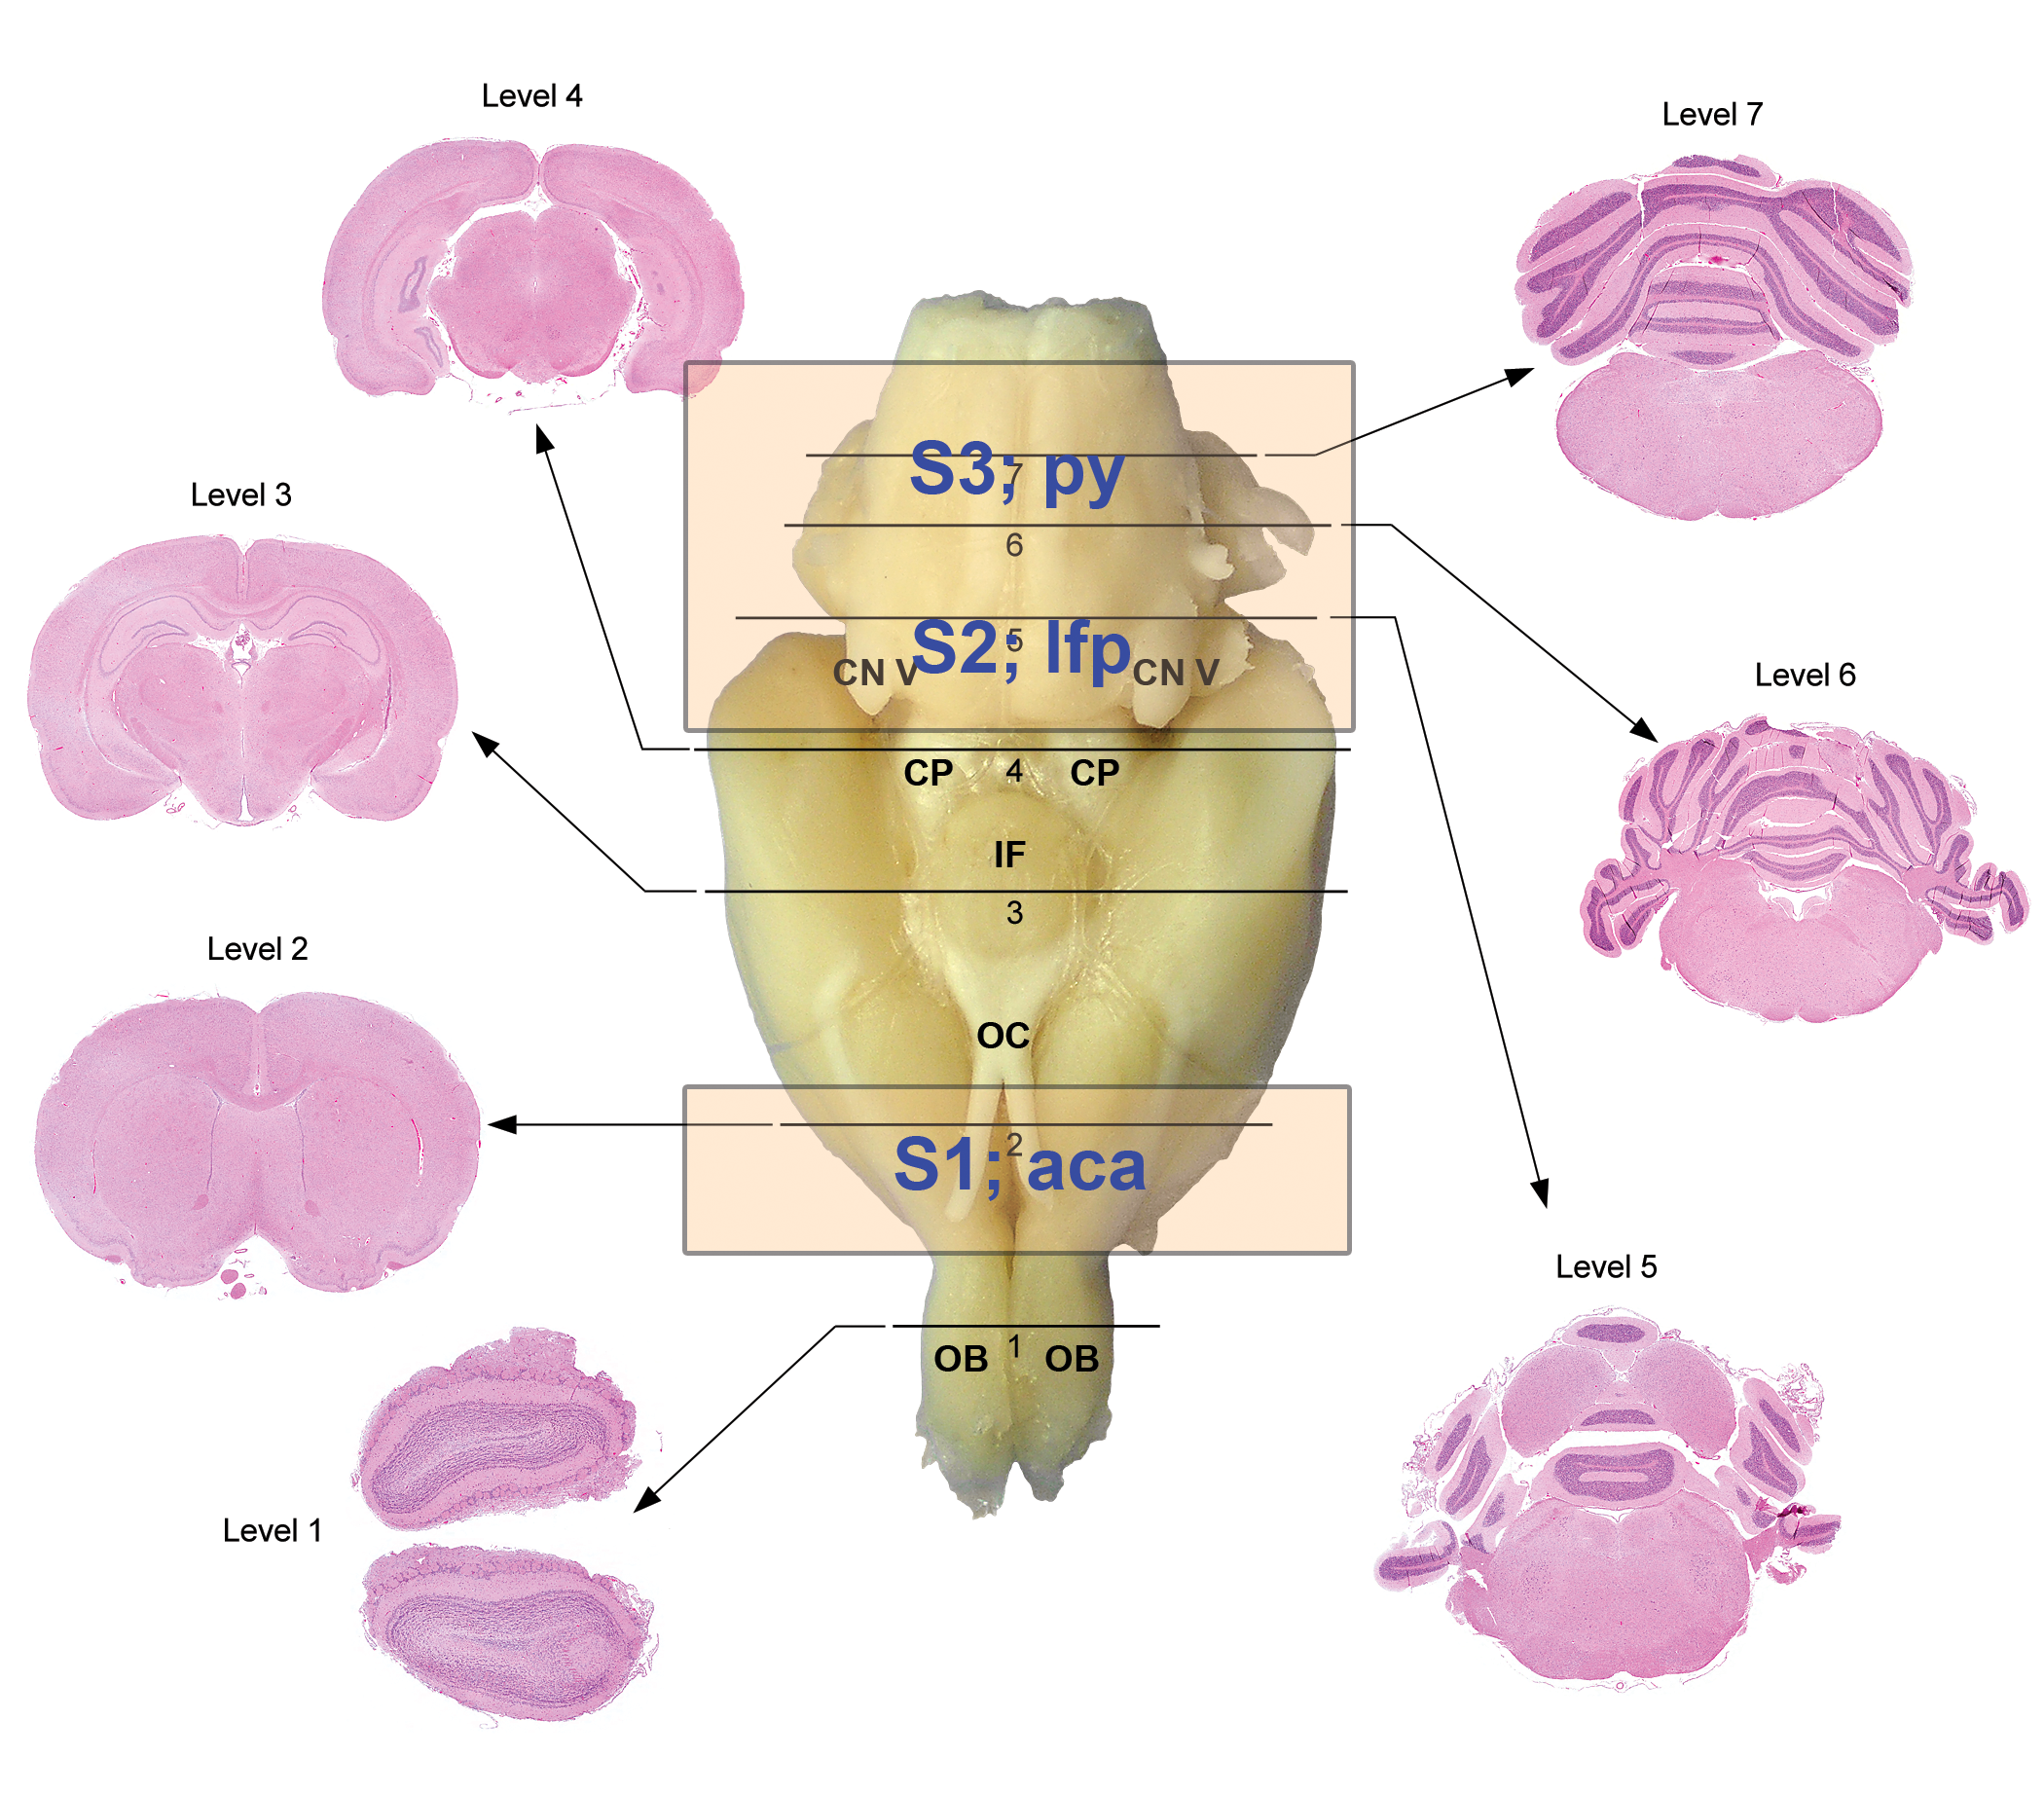
Sections of brain examined by histopathology and stereology. The 7 sections of brain examined for histopathology are as follows: Level 1—section through the olfactory bulbs; level 2—section of frontoparietal cortex (optic chiasm); level 3—section through the parietal cortex at the midpoint of the infundibulum; level 4—section through the midbrain at the midpoint of the anterior colliculi (cerebral peduncle); level 5—section at the midpoint of the posterior colliculi (cranial nerve V); level 6—section through the mid cerebellum; and level 7—section through the posterior medulla at the area postrema. The 3 stereology sections from the same brain used for histopathology included area S1—enclosed the anterior portion of the anterior commissure (aca); area S2—enclosed the longitudinal fasciculus of the pons (lfp); and area S3—enclosed the pyramidal tracts (py).
Slide evaluation for both H&E- and LFB/CV-stained slides was performed via light microscopy on an Olympus BX40 microscope. Seven sections of brain (Figure 1) were examined with particular focus on the specific neuroanatomic landmarks described below:
Level 1: Plexiform, mitral, glomerular, and granule cell layers of the olfactory bulbs
Level 2: Cingulum, piriform cortex, aca, septal nuclei, caudate putamen, corpus callosum, olfactory tract, and external capsule
Level 3: Amygdaloid nucleus, hippocampus, thalamus, hypothalamus, habenular nucleus, and internal capsule
Level 4: Anterior colliculus, medial geniculate body, red nucleus, substantia nigra, and cerebral peduncle
Level 5: Posterior colliculi, superior olivary nucleus, pyramids, locus coeruleus, tract of spinal nerve V, and sensory nuclei of cranial nerve V
Level 6: Cerebellar lobules (vermis, ansiform, paraflocculus, lingual), cochlear nucleus, cranial nerve VII nucleus, and the spinal tract of cranial nerves V and VII
Level 7: Area postrema, cranial nerves X and XII, inferior olivary nucleus, and pyramids
The presence of vacuolation (representing intramyelinic edema) in white matter was graded based on the following criteria: 1+ (minimal) = small vacuoles without expansion of white matter regions; 2+ (mild) = small vacuoles, though increased in number over that noted with minimal severity and mild expansion of white matter; 3+ (moderate) = medium to large vacuoles with moderate expansion of white matter tracts and contributory pallor of LFB/CV staining; and 4+ (marked) = large vacuoles with disruption of the white matter tract resulting in decreased staining (pallor) at low power.
Methods: Stereology
Three ROIs within the white matter of the brain were chosen for volume estimation by stereological analysis: the anterior portion of the aca (Figure 2), the lfp (Figure 3), and the py (Figure 4). The brains were trimmed to isolate the above 3 ROIs using a rat brain matrix. Resulting tissue pieces were each weighed preprocessing and postprocessing, and 3-D global shrinkage of the tissue was estimated using the following equation: 1 − W par/W fix, where W fix is the preprocessing weight and W par is the postprocessing weight. 3 The thickness of each tissue segment was also measured to calculate the appropriate sampling interval. The tissue sections were then embedded separately in paraffin.
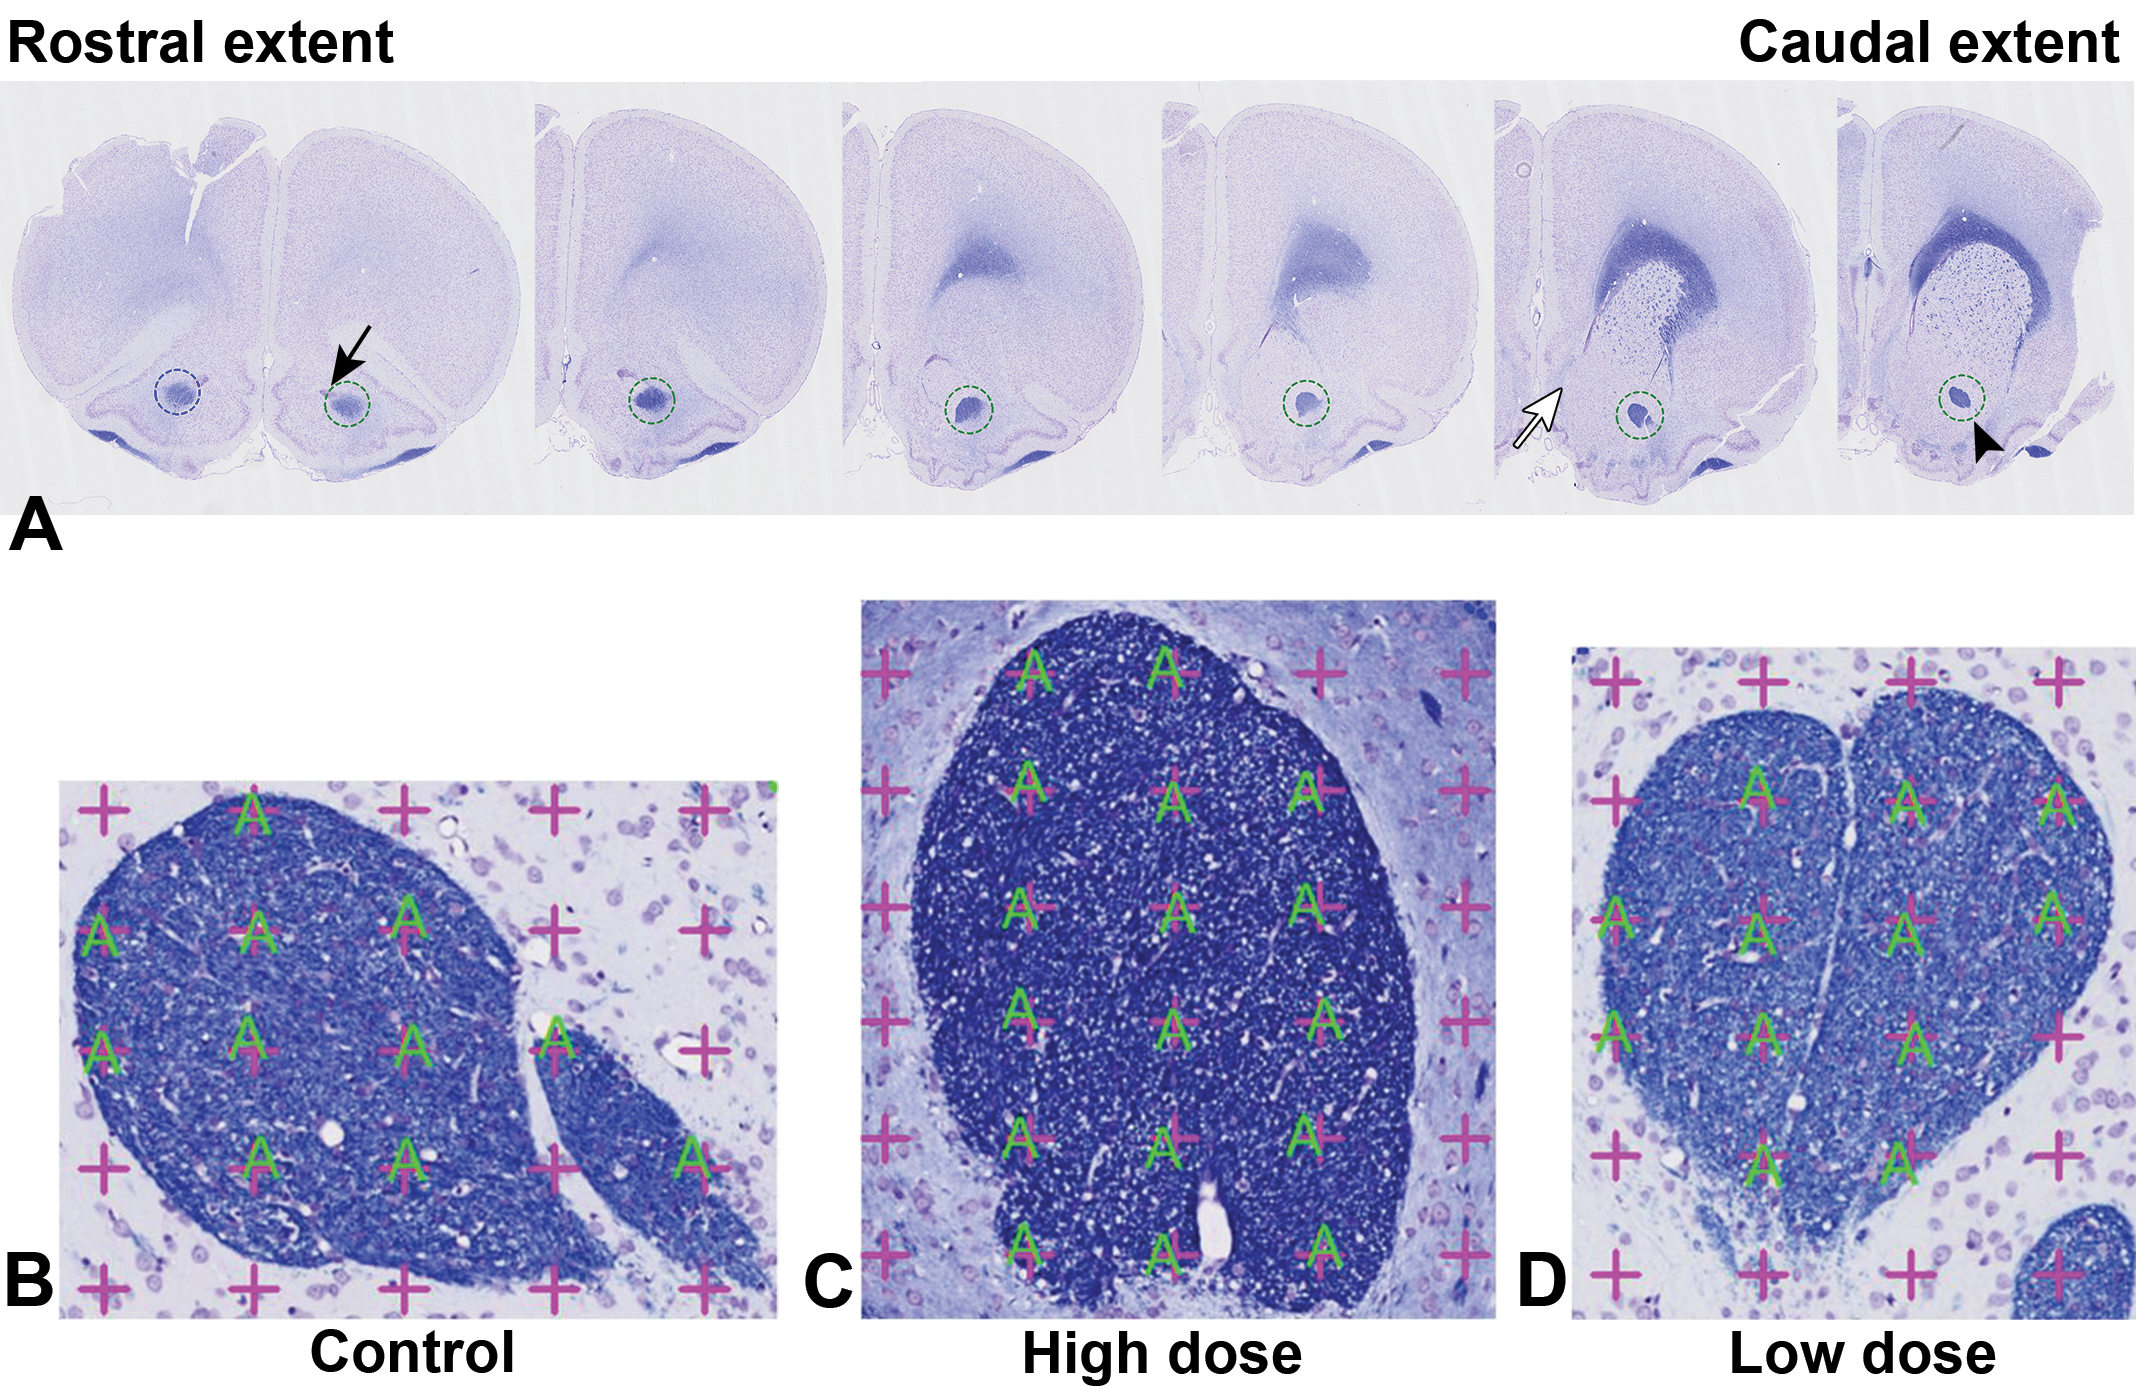
A, The anterior commissure (aca), anterior part (arrowhead) was identified bilaterally as discrete bundles of darkly stained fibers ventral to the lateral ventricles. The caudal extent of the aca corresponded to where the boundary of the lateral septum and the shell of the nucleus accumbens was no longer marked by a major islet of Calleja (white arrow). The anterior extent of the aca was identified as the area where the ependyma and the subependyma of the olfactory ventricle mingled with the aca (black arrow). B, High magnification of the aca (control). C, High magnification of the aca (high-dose hexachlorophene). D, High magnification of the aca (low-dose hexachlorophene), luxol fast blue/cresyl violet stain.
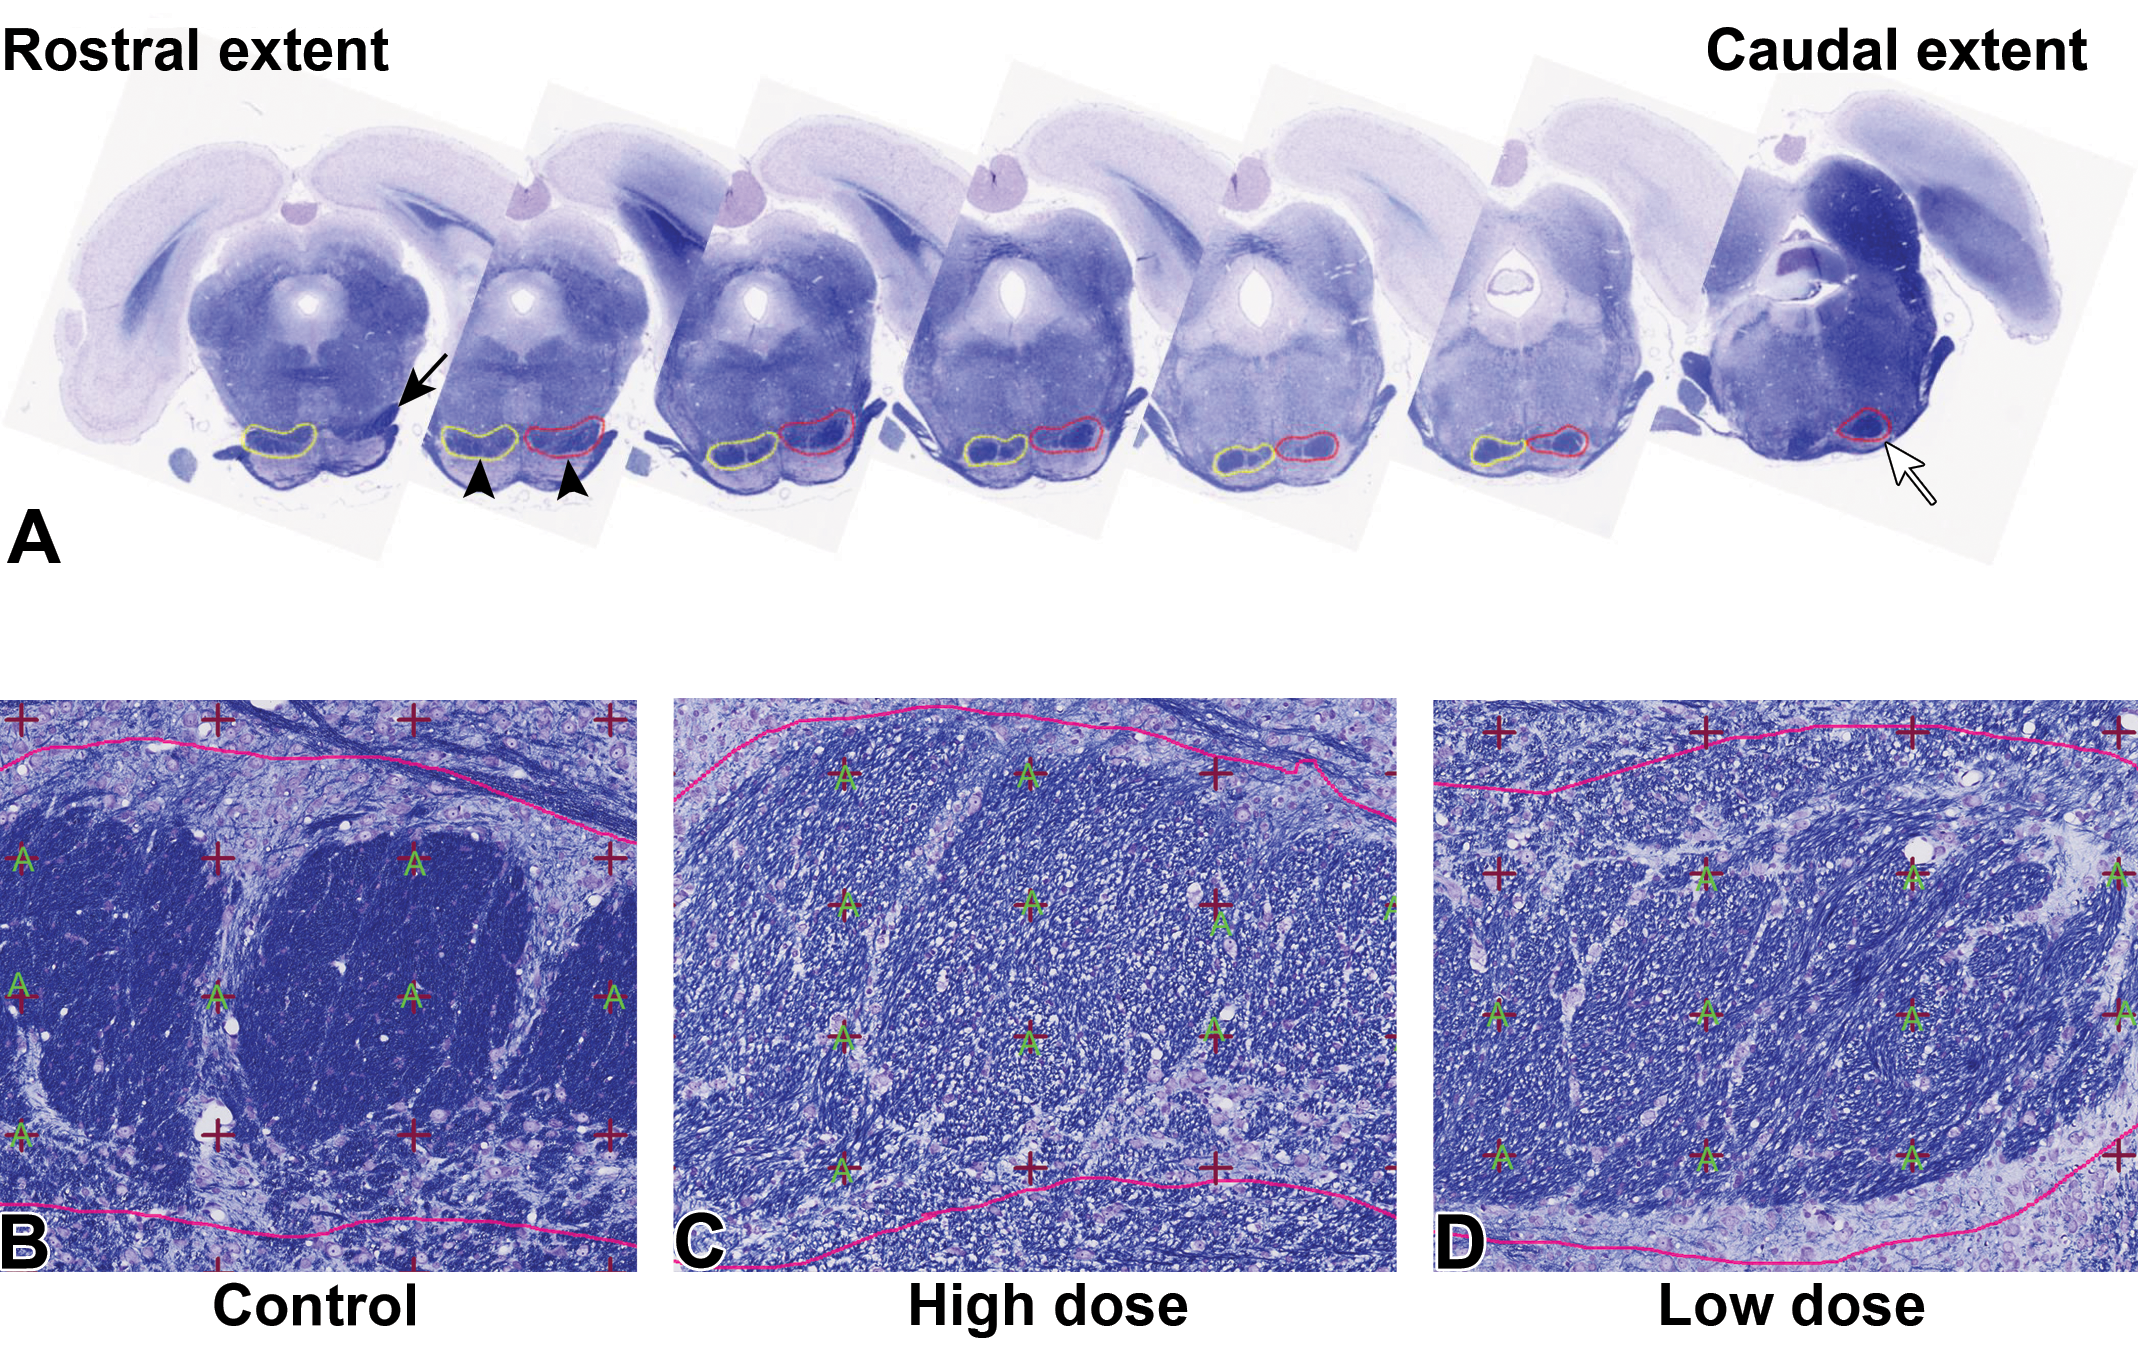
A, The rostral extent of the longitudinal fasciculus of the pons (lfp; arrowheads) was identified as the area where the corticospinal tract was no longer continuous with the lateral lemniscus (black arrow). The caudal extent of the lfp was identified as the last section in which the pons was still visible and the lfp did not yet mingle with the transverse fibers of the pons (white arrow). The pyramidal tracts are the caudal continuation of the lfp and extend all the way to the pyramidal decussation at the boundary between the hindbrain and the spinal cord. B, High magnification of the lfp (control). C, High magnification of the lfp (high-dose hexachlorophene). D, High magnification of the lfp (low-dose hexachlorophene), luxol fast blue/cresyl violet stain.
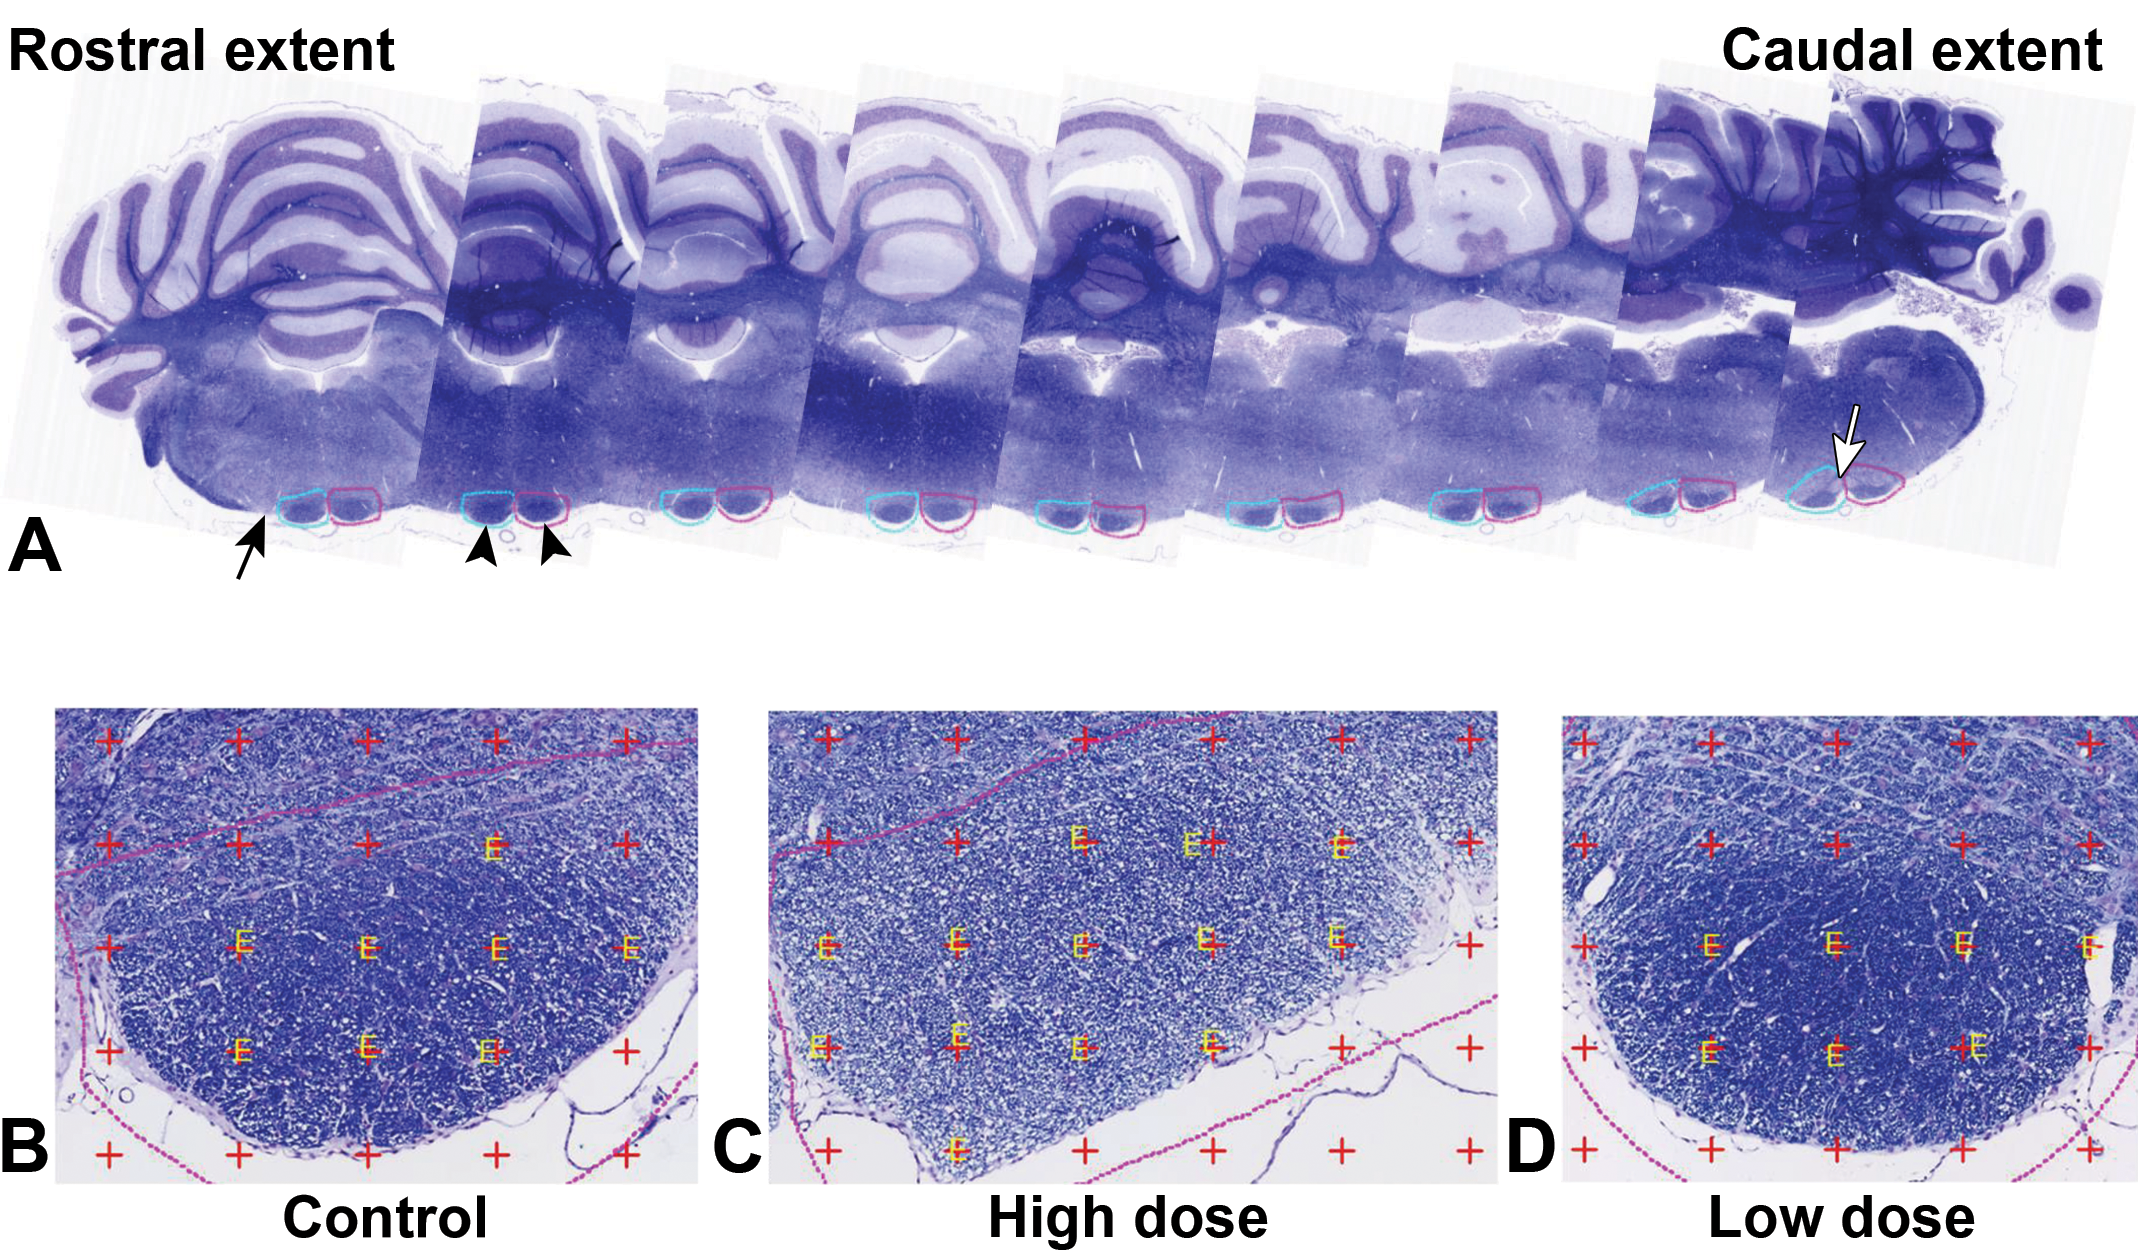
A, The pyramidal tracts (py; arrowheads) were collected from a rostral point, where the decussation of the trapezoidal bodies was no longer evident or mingling with the py (black arrow). Due to the large rostral–caudal extent of the py, for this study, the caudal extent was set as the area where the medial nucleus of the inferior olive could be seen immediately dorsal to the py (white arrow). B, High magnification of the py (control). C, High magnification of the py (high-dose hexachlorophene). D, High magnification of the py (low-dose hexachlorophene), luxol fast blue/cresyl violet stain.
Systematic uniform random sampling was applied at microtomy. A sampling interval (T) was chosen for each ROI based on the postprocessing section thickness, with a goal of obtaining 8 sections per ROI for analysis. The first section for each ROI was randomly selected from 0 to T using a random number table, and sections were regularly spaced throughout the tissue thereafter at intervals of T. The following sectioning intervals were chosen for each ROI: aca = 175 µm, lfp = 145 µm, py = 130 µm. All sections were cut at 5-µm thickness.
Sections were stained with LFB to visualize myelin against a CV counterstain. These sections were scanned at ×20 magnification using a Hamamatsu Nanozoomer whole slide scanner and imported into the Visiopharm software version 6.2.0.2089. Each ROI was manually outlined, and 100% of the ROI was sampled at ×5 magnification. Due to asymmetry of the coronal plane, brain hemispheres were sampled and analyzed separately. The aca was identified bilaterally as discrete bundles of darkly stained fibers ventral to the lateral ventricles. The caudal extent of the aca was identified as the point where the boundary between the lateral septum and the shell of the nucleus accumbens was no longer marked by the major islet of Calleja. This is roughly in the area where the rhinal fissure becomes distinct in the lateral aspect of the hemisphere. The rostral extent of the aca was identified as the point where the shell of the nucleus accumbens disappeared (where the ependyma and the subependyma of the olfactory ventricle mingled with the aca). The anterior extent of the lfp was identified as the point where the corticospinal tract (CST) was no longer continuous with the lateral lemniscus mediolaterally. The caudal extent of the lfp was identified as the last section in which the pons was still visible and the lfp did not yet mingle with the transverse fibers of the pons. The pyramids (py) are the caudal continuation of the lfp and extend all the way to the pyramidal decussation at the boundary between the hindbrain and the spinal cord. The rostral extent of the py was identified as the point where the decussation of the trapezoidal bodies was no longer evident or mingling with the py. The most caudal extent of the py was not present in the section and, in this study, was set as the point where the medial nucleus of the inferior olivary nucleus could be observed immediately dorsal to the py. 11
Each field of view was visualized within the Visiopharm software, a point probe was overlaid, and the points intersecting each ROI were tagged for estimation of volume using the Cavalieri principle. 12 The area per point for each point probe was as follows: 13,341.75 µm2 for the aca, 30,018.94 µm2 for the lfp, and 35,725.02 µm2 for the py. The total points intersecting each structure were summed within the software for each hemisphere. Data were exported to Microsoft Excel, and the volume was estimated using the following formula: V = ΣP × T × A(p), where ΣP was the sum of intersecting points, T was the sectioning interval, and A(p) was the area per point. All volumes were corrected for shrinkage using the following equation: V corrected = V estimated/global shrinkage. 3 Volumes for the right and left hemispheres were summed to estimate the total volume for each structure.
Coefficient of error (CE) was estimated for each structure according to Løkkegaard. 13 Noise, a measure of the variability of the volume estimate introduced by the random placement of the counting grid, was calculated using the formula: Noise = 0.0724 × (b/√a) × √(n × ΣP), where n is the number of sections and b/√a is the average profile shape, judged to be a value of 2 for the aca and py, and 4 for the lfp based on the degree of irregularity of each structure. 14 This was combined with the sampling variance (VarSURS) to produce a total variance, which was used to calculate a CE for each ROI: CE = √total variance/ΣP. 13
Methods: MRM
Specimen preparation
All experiments and procedures were done with the approval of the Duke University Institutional Animal Care and Use Committee. Upon arrival at the Duke Center for In Vivo Microscopy, animals remained in transit caging for approximately 4 hours until perfusion for imaging. Perfusion of all the animals in the group was completed within 4 hours. Brains were actively stained using methods that have been described in detail previously. 7,15 Active staining with gadoteridol (ProHance, a paramagnetic contrast agent) reduces the spin lattice relaxation time (T 1) from ∼1200 to ∼100 milliseconds, which results in a signal enhancement of nearly 10×. Perfusion with ProHance does not interfere with routine chemoarchitectural stains. Adult male SD rats were anesthetized with Nembutal (sodium pentobarbital) at a dose of 75 to 80 mg/kg intraperitoneally. The thorax was opened, and a 21-Gauge needle was placed in the left ventricle of the heart. In addition, a small hole was created in the right atrium to drain. The blood was flushed using 50 mL room temperature Heparin/saline solution driven by a peristaltic pump for 5 to 6 minutes @ 7 to 8 mL/min. This was followed by perfusion fixation with a solution of methanol-free 10% NBF containing 10% (50 mM) gadoteridol. One hundred milliliters of solution was supplied by a peristaltic pump at room temperature over ∼6 minutes. After perfusion fixation, the head was removed intact. The skin was removed, and the intact skull was immersed in fresh methanol-free 10% NBF for 24 hours at 4 °C. Finally, the fixed rat head was transferred to a 0.1 M solution of PBS containing 1% (5 mM) gadoteridol at 4 °C for 5 to 7 days to ensure equilibration of contrast agent. Prior to imaging, the fixed brain, still in the skull, was placed in a custom-made, MRI-compatible tube and immersed in MRI, signal-free, liquid fluorocarbon (Fomblin perfluoropolyether, Ausimont) for susceptibility matching and to prevent specimen dehydration and shrinkage. All imaging experiments were performed with the brain in situ in the skull to preserve its native shape.
Magnetic resonance imaging data acquisition
All imaging experiments were performed on a 7-Tesla MRI system controlled with an Agilent MR console (VNMR J version 4.0). The specimen in the custom holder was placed in a 25-mm-diameter single-sheet solenoid coil designed specifically to maximize the signal from a single specimen. Diffusion-weighted images were acquired using a modified 3-D Stejskal-Tanner spin echo sequence with repetition time/echo time of 100/18 milliseconds with b value of 3000 s/mm2. Sixteen 3-D volumes were acquired, each with the diffusion gradient at a different angle. The angles were distributed uniformly on the unit sphere. Two baseline images were also acquired. Data were reconstructed on a 256 × 256 × 512 array with isotropic spatial resolution of 62.5 μm.
Postprocessing
The sixteen 3-D volumes were registered to the baseline (b 0) images to remove errors from gradient-induced eddy currents using advanced normalization tools (ANTs; compiled November 2017, http://picsl.upenn.edu/software/ants/). The resulting 4-D array was passed to DSI Studio (compiled 2014, http://dsi-studio.labsolver.org/) and processed using the diffusion tensor algorithm. Labels were mapped onto the MR images by passing the data through a third pipeline, which also uses the ANTs. 16,17 Labels were provided from a 3-D digital atlas developed previously in this laboratory that includes the 26 structures: accumbens nucleus, amygdala, aca, axial hindbrain, bed nucleus of the stria terminalis, cerebellum, cingulum, corpus callosum/deep cerebral white matter, diagonal band nucleus, diencephalon, fibria/fornix, hippocampal formation, hypothalamus, internal capsule/cerebral peduncle/pyramids, isocortex, mesencephalon, olfactory structures, optic pathways, pallidum, pineal gland, pituitary, preoptic area, septum, striatum, substantia nigra, and all ventricles. The orientation and delineation of the labels have been carefully constructed to be consistent with those of the canonical rat brain atlas of Paxinos and Watson. 18 The pipeline works in 3 stages. The first stage is a simple linear scaling with translation and rotation into the same orientation. A second stage exploits an affine transformation, which is a linear mapping that corrects for local geometric distortions. The final diffeomorphic stage compares the signal intensity in the 3-D digital atlas, which itself is based on the same MR protocol, with the signal intensity in the target image. The steps are repeated iteratively with a comparison of signal in the 3-D digital atlas and target image to maximize the alignment. The output from this final pipeline is a set of scalar images derived from the diffusion data, including the axial diffusivity (AD), radial diffusivity (RD), mean diffusivity (MD), and fractional anisotropy (FA). The pipeline generates a final Excel sheet for each specimen that provides the volume and mean values for these scalar images for each of the 26 regions.
Diffusion tensor imaging
Diffusion tensor imaging (DTI) is a technique that generates multiple images that provide insight into the structure and integrity of the white matter. 19 Diffusion tensor imaging protocols deliver a suite of 8 different “proton stains” that can be linked to specific histopathology, such as changes in myelin, neuronal loss, changes in axon morphology, and distribution. The DTI scalar images including AD, RD, MD, apparent diffusion coefficient (ADC), and FA each show different properties of the cytoarchitecture and pathology outcomes and are reviewed by Mori and Zhang. 20 The focus of this study was on FA images that provide quantitative measures of changes in white matter cytoarchitecture. Changes might arise from increase in RD from demyelination or decrease in AD arising from axonal injury. Both will result in reduced FA.
Methods: Statistics
In most cases, normality of volume data (MRM and stereology) and FA data could not be rejected using the Shapiro-Wilks test. However, since sample sizes were small, a randomization t test was used to compare control volume (ctl) and treated volume (trt) sample groups. The randomization t test is a nonparametric statistical test that compares the observed t-statistic to the distribution of t-statistics calculated from all possible permutations of the data. The P values are 2 sided and considered statistically significant if less than .05. Data are reported as mean ± standard error. Percent difference between the control and treated groups is calculated as (m trt − m ctl)/m ctl × 100%. Percent difference estimates of zero represent no volume differences between control and treated samples. Bootstrap 95% CIs were calculated based on the adjusted bootstrap percentile (BCa) method, with 10 000 bootstrap replicates using the boot.ci function in the R/boot package. The BCa approach adjusts for bias and skewness in the bootstrap distribution. 21 The 95% CIs contain the true value of the estimate with a probability of .95, where the bootstrap method for estimating uncertainty is based on random resampling and does not assume normality. The CIs assess whether a volume difference exists (ie, whether the percent differences in volume overlap zero) as well as the lower and upper limits of the percent differences between the control and treatment groups.
Results: Animals and Observations
All study rats were observed twice daily. Rats treated with hexachlorophene displayed generalized lethargy starting typically by the third day of dosing accompanied by porphyrin staining around the eyes and slightly roughened hair coat. Additionally, rats at the higher dosage (30 mg/kg) displayed noticeable ataxia of the hindlimbs. No other neurological signs were observed during the study. Three early deaths occurred during the study, and all had prominent white matter changes at all levels of the brain. The most affected rat received the full dose of hexachlorophene (30 mg) for 5 consecutive days. The lethargy, hindlimb ataxia, and early deaths were attributed to the prominent intramyelinic edema observed throughout the CNS. Each group of treated rats had a progressive decrease in body weight. The percentage of weight loss ranged from 3% to 16% of total body weight during the dosing period.
Titration of dose levels and dosing length occurred as a result of early deaths in the study and resulted in the ability to observe the effects of altering dosing time and length on brain lesions. The 3 early death rats had prominent morphologic changes in the white matter at all levels of the brain. The most affected rat was an early death animal that received the full dose of hexachlorophene (30 mg/kg) for 5 consecutive days. Treatment groups that received 30 mg/kg, even as the number of days of dosing decreased to 4, displayed neuropathological changes consistent with rats receiving the full dose for 5 days.
Results: Light Microscopy
The intramyelinic edema appeared microscopically as vacuolation of white matter and was characterized by pallor of LFB/CV staining in affected areas (Figure 5). In general, the changes were well-demarcated, bilaterally symmetrical, and not accompanied by a cellular response. This change has been confirmed as intramyelinic edema via electron microscopy. 22 Subsites most affected included lateral olfactory tracts, optic chiasm, cerebellar folia of the vermis and anisiform lobe, external capsule, cingulum, aca, and py. These lesions were not evident grossly at necropsy.
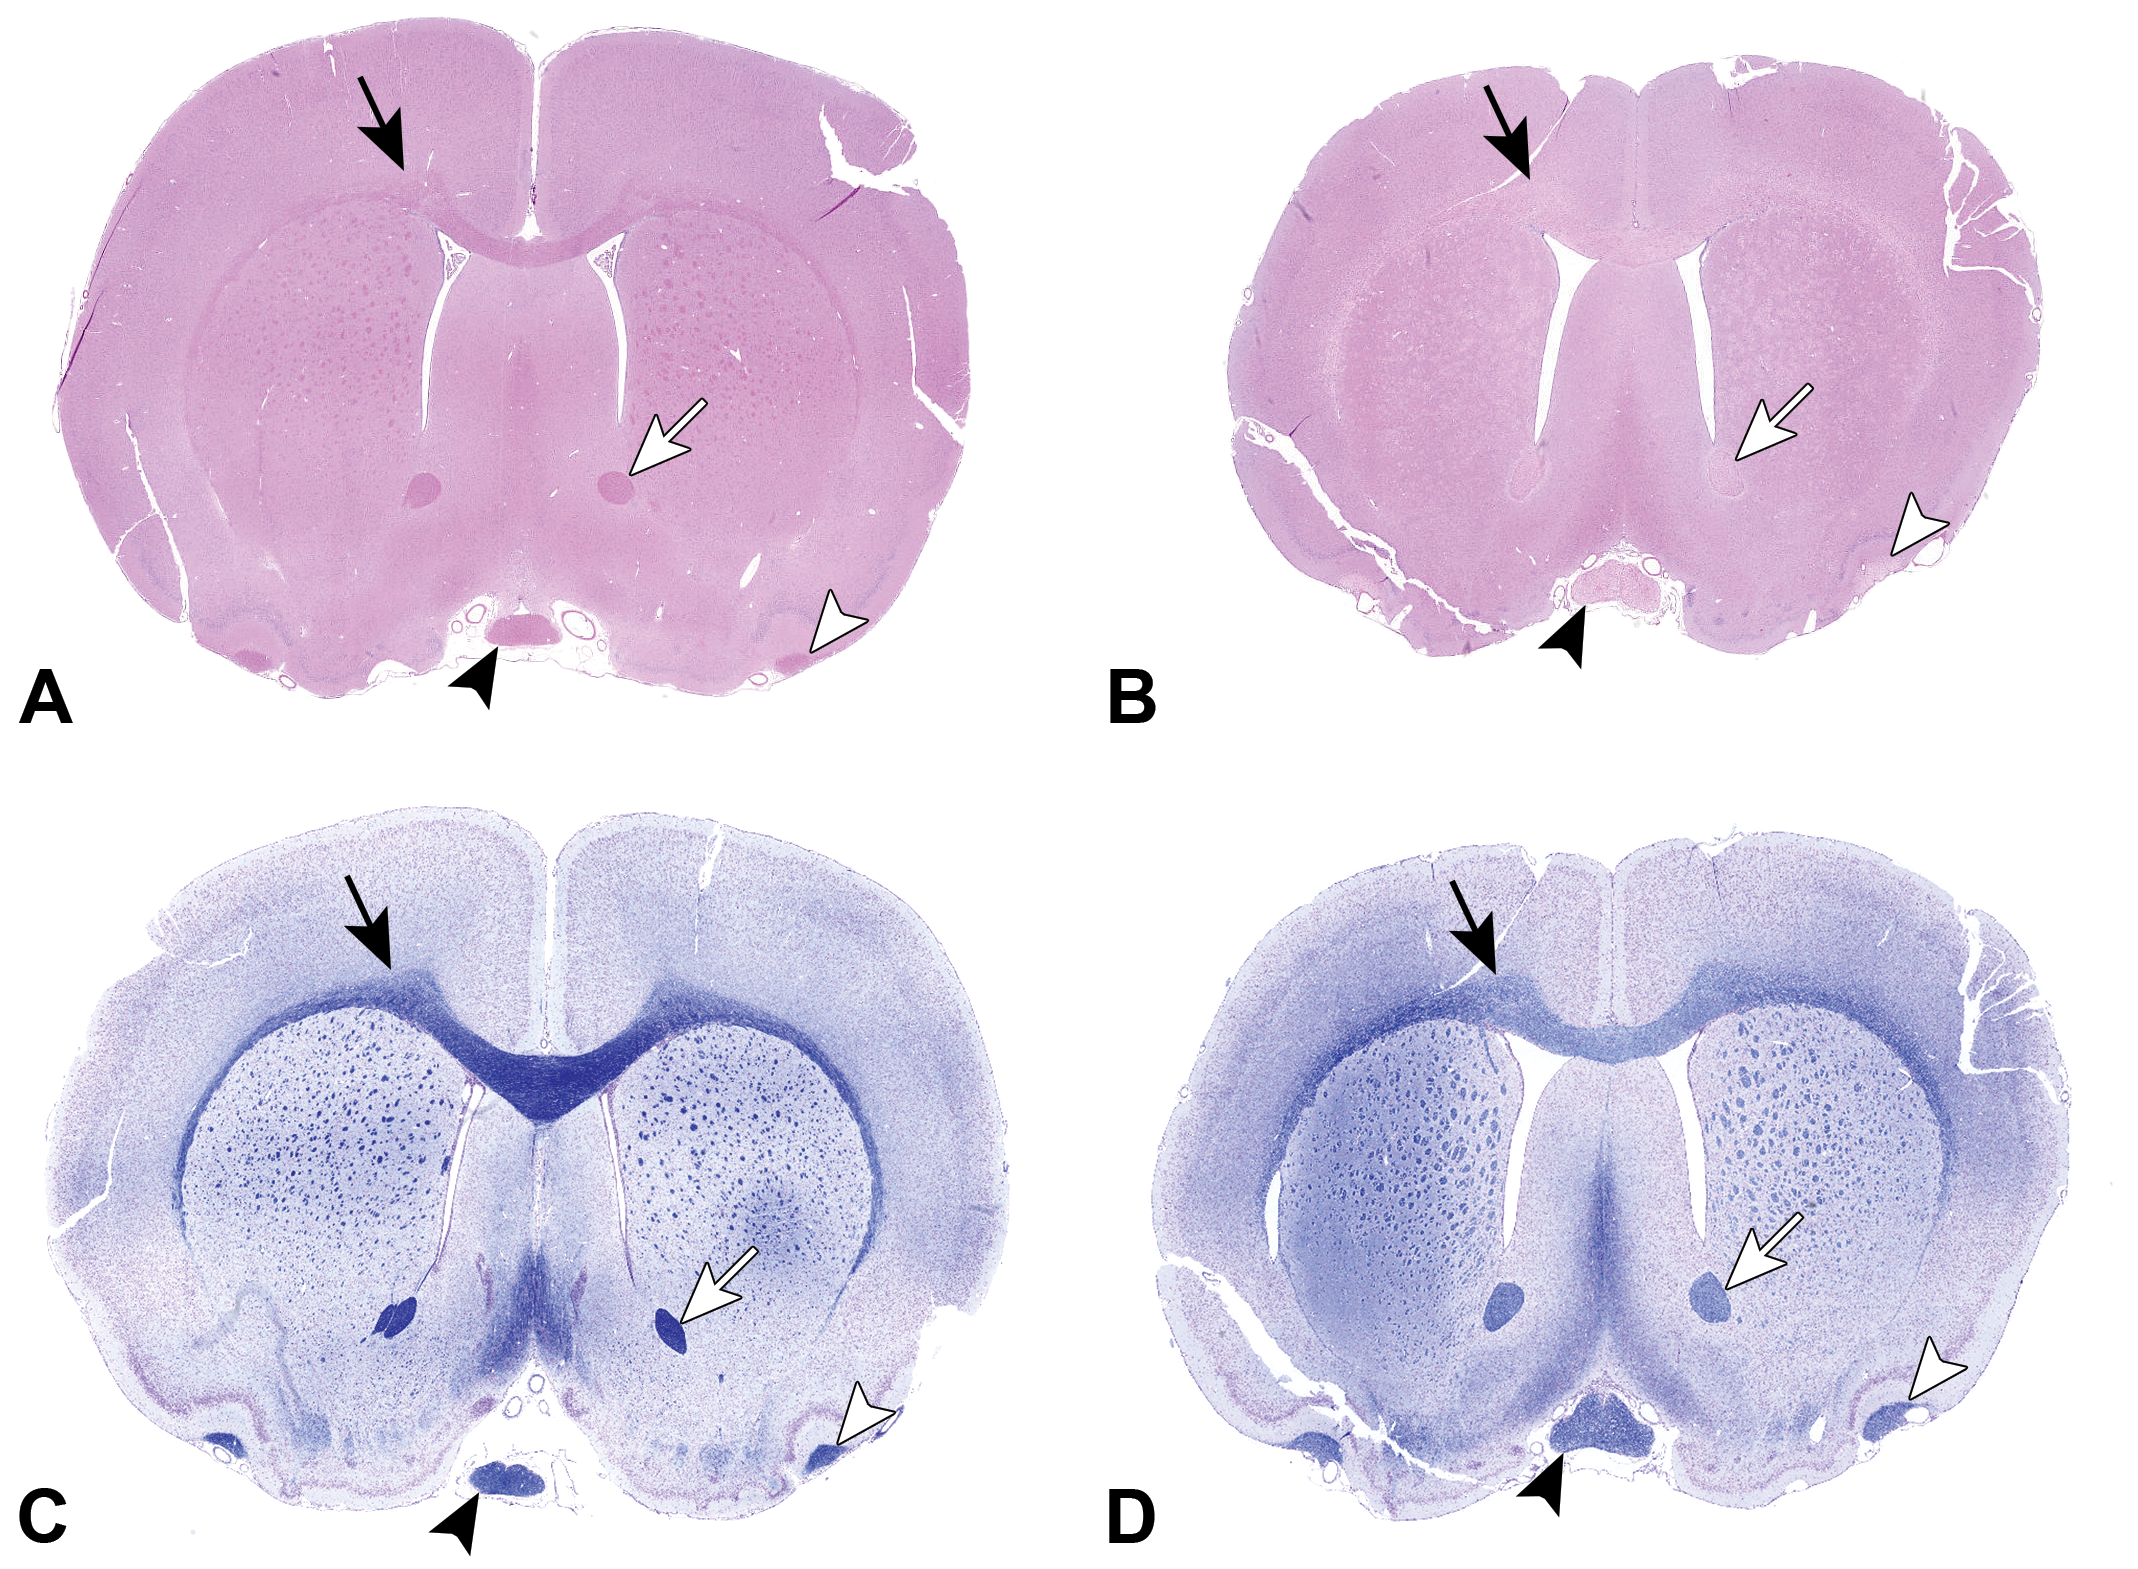
Subgross comparison of a control versus a hexachlorophene-treated rat, ×0.6 original magnification. Low-magnification hematoxylin and eosin–stained images of control rat (A) and treated rat (B) and concurrent luxol fast blue/cresyl violet stained images (C and D), respectively. Note the decreased density (staining pallor) of large white matter tracts, including cingulum of corpus callosum (black arrow), optic chiasm (black arrowhead), anterior commissure (white arrow), and lateral olfactory tracts (white arrowhead), in treated rat (B and D), compared to the control rat (A and C).
Results: Qualitative Neuropathology and MRM Assessments
There was good correspondence between LFB/CV stains and MRM for identifying intramyelinic edema in the cingulum of the corpus callosum, optic chiasm, aca, lateral olfactory tracts (Figures 5-7), py, and white matter of the cerebellum (Figures 8-10).
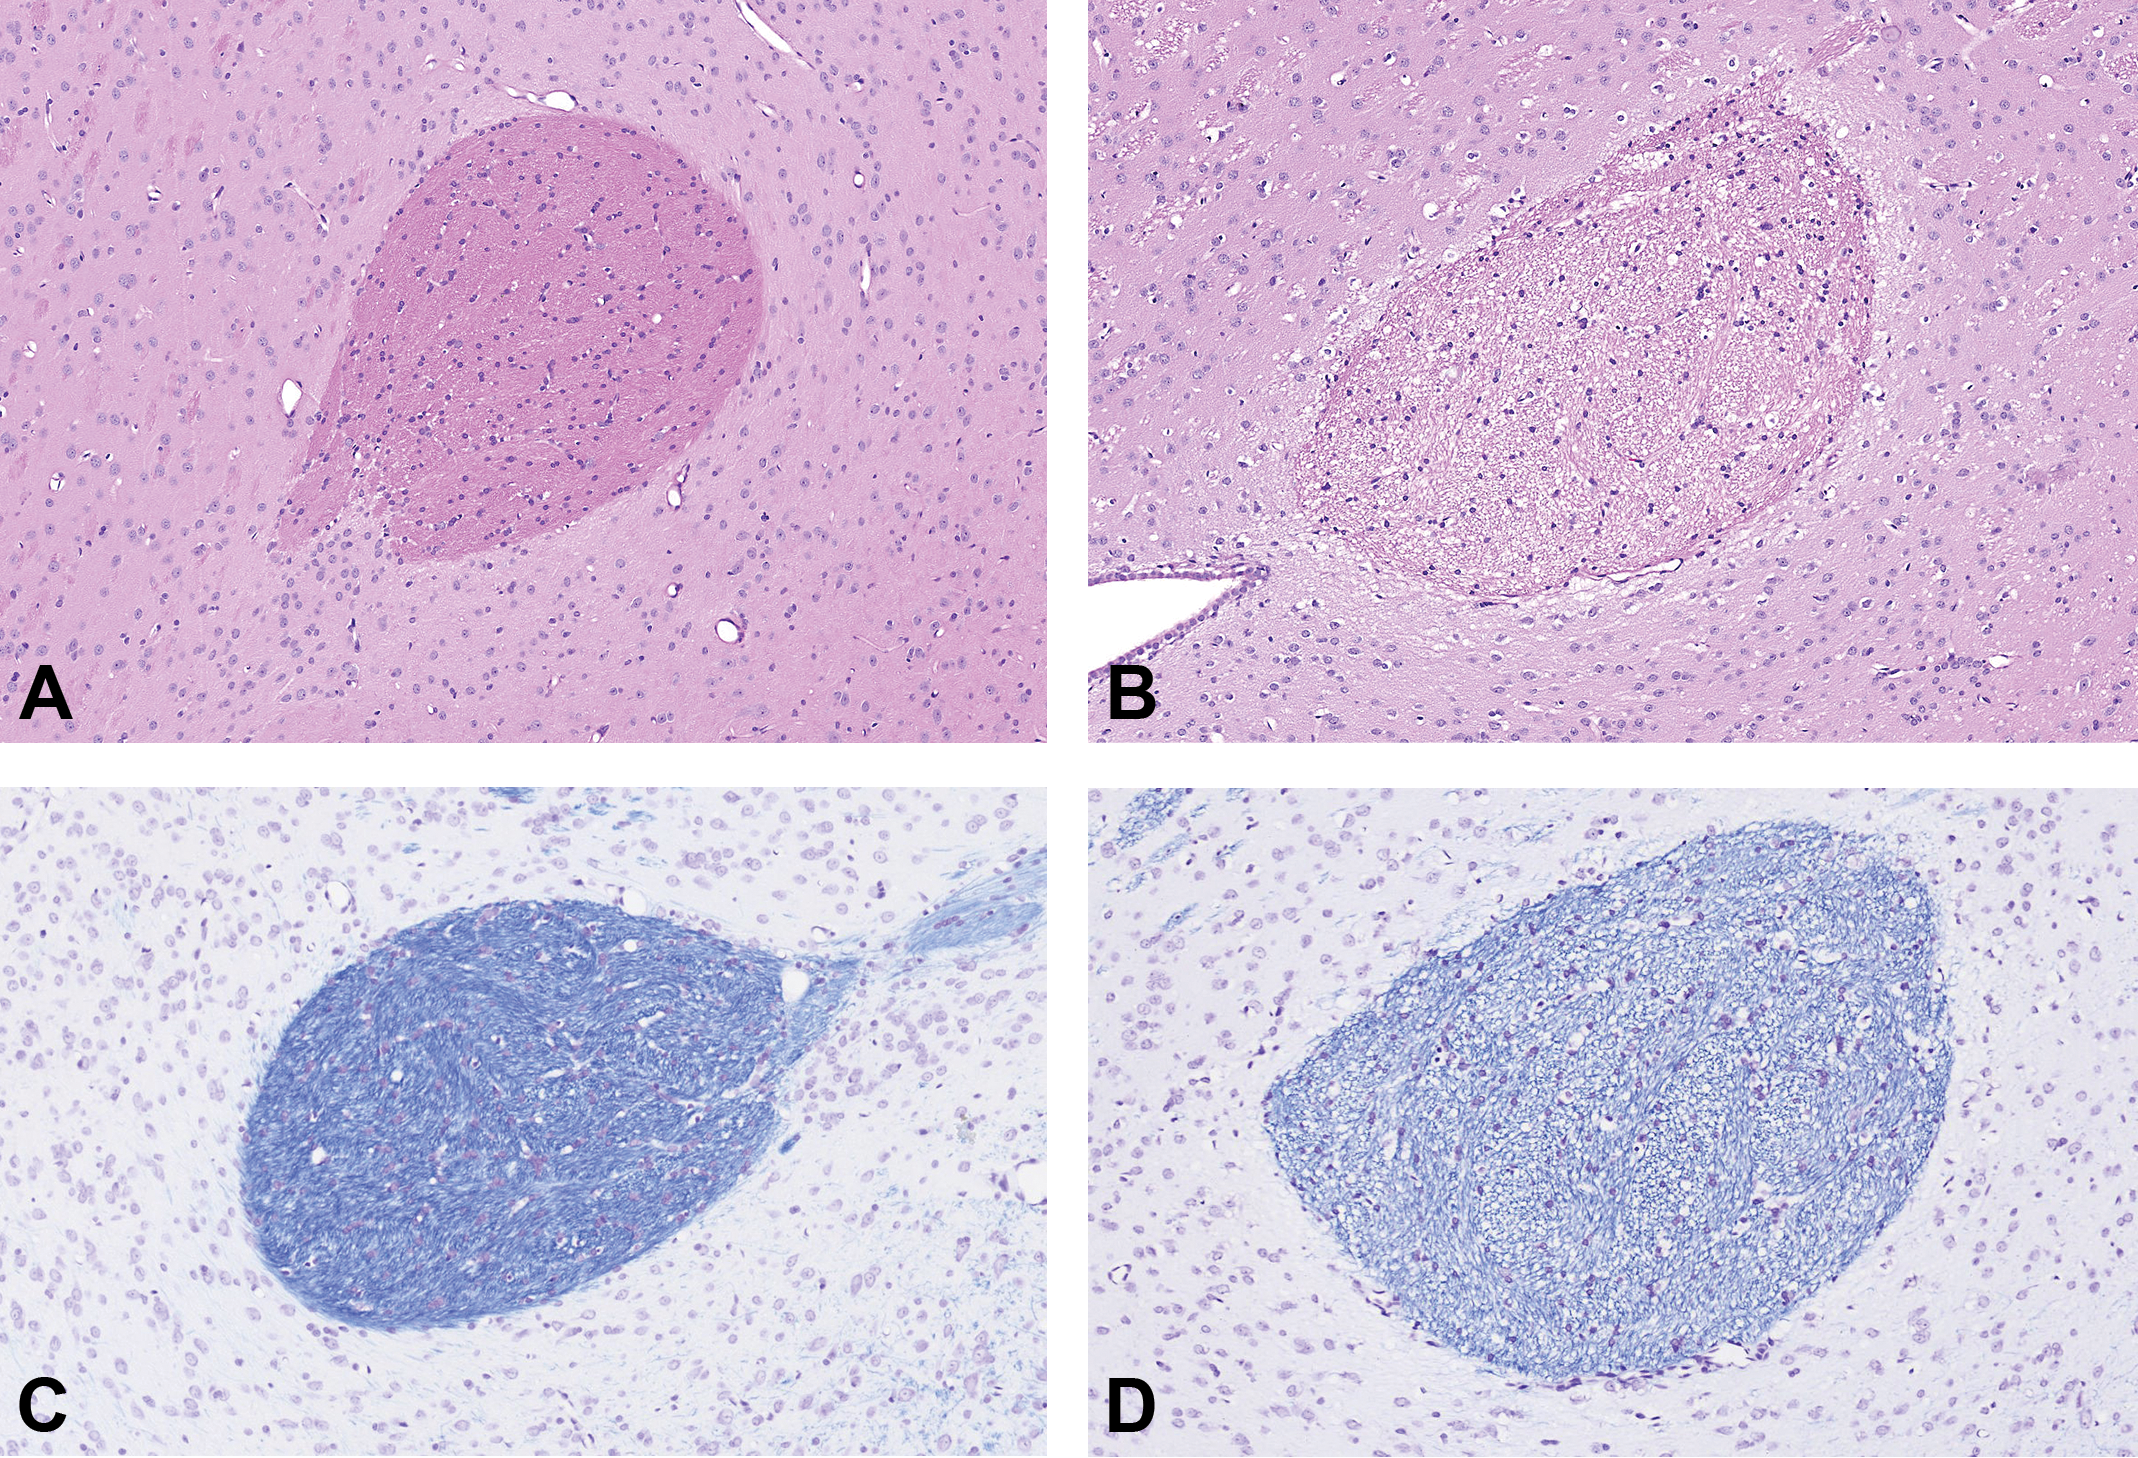
Hematoxylin and eosin staining comparison of the anterior commissure of a control rat (A) and a treated rat (B), with accompanying luxol fast blue/cresyl violet images of the control rat (C) and treated rat (D), original magnification ×10. Note the increased size of the anterior commissure in the treated rat due to intramyelinic edema.
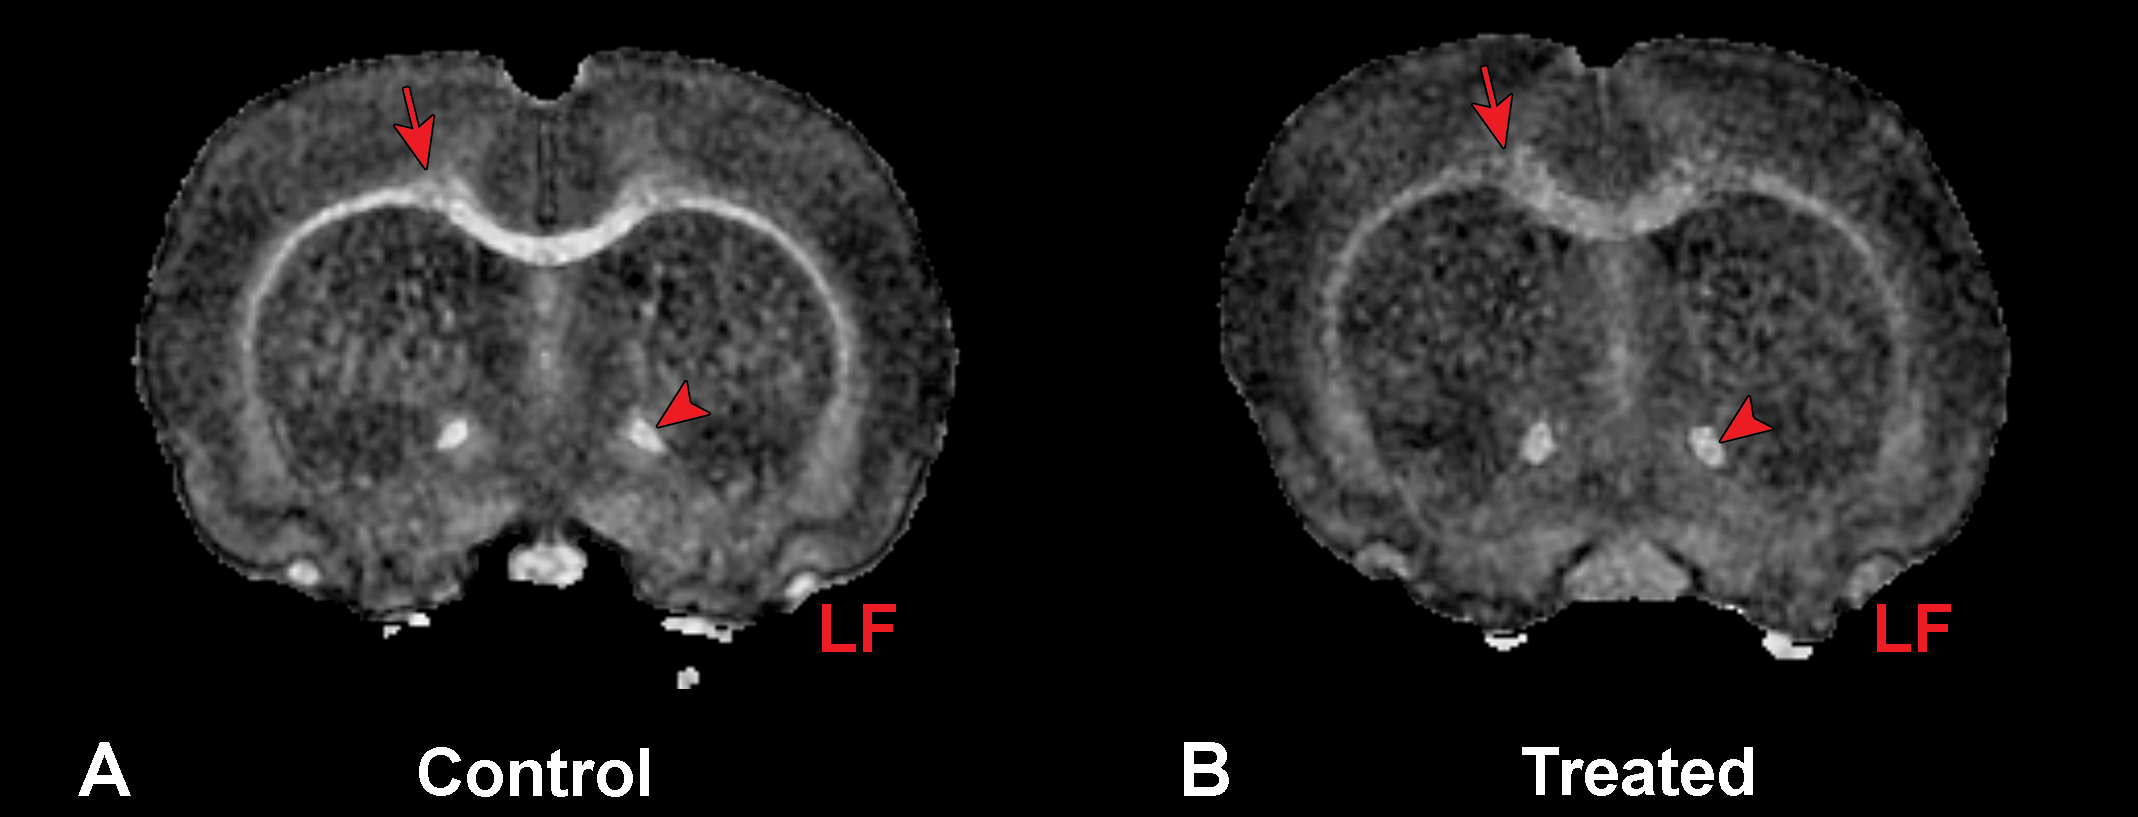
Magnetic resonance microscopy images of a control (A) and a treated rat (B). Note the hypointense areas in the cingulum of the corpus callosum (arrow), optic chiasm, anterior commissure (arrowheads), and lateral olfactory tract (LF) that correlated with the intramyelinic edema demonstrated in the hematoxylin and eosin– and luxol fast blue/cresyl violet–stained sections. Transverse section through the brain at 7 Tesla. Note that the optic chiasm in the treated rat also appears enlarged.
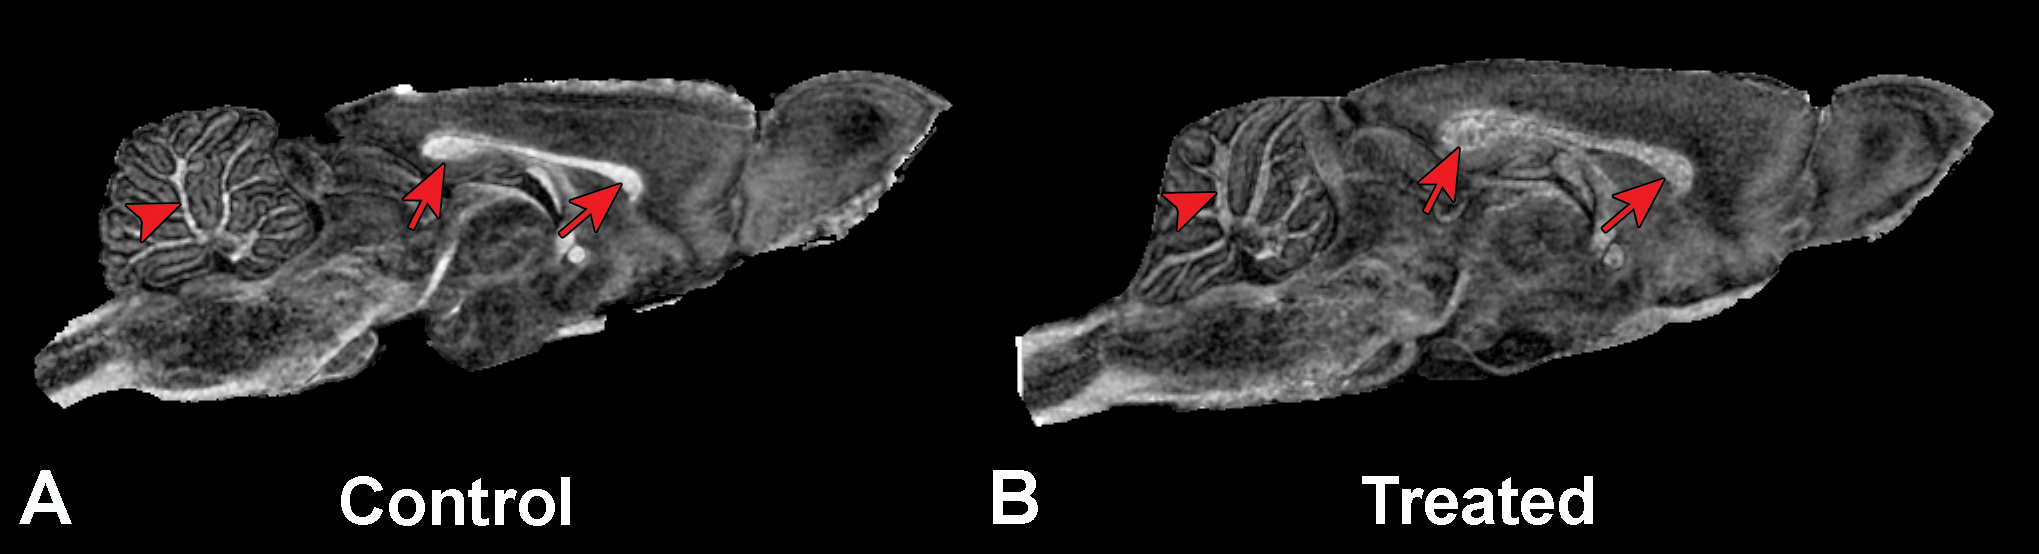
Sagittal magnetic resonance microscopy images of a control rat (A) and a treated rat (B). Note the extent of intramyelinic edema characterized by the hypointense area in the corpus callosum (arrows) and the white matter tracts of the cerebellum (arrowheads) in the treated rat compared to the control. One of the benefits of MRM over histopathology is the opportunity to see the intramyelinic edema in multiple planes.
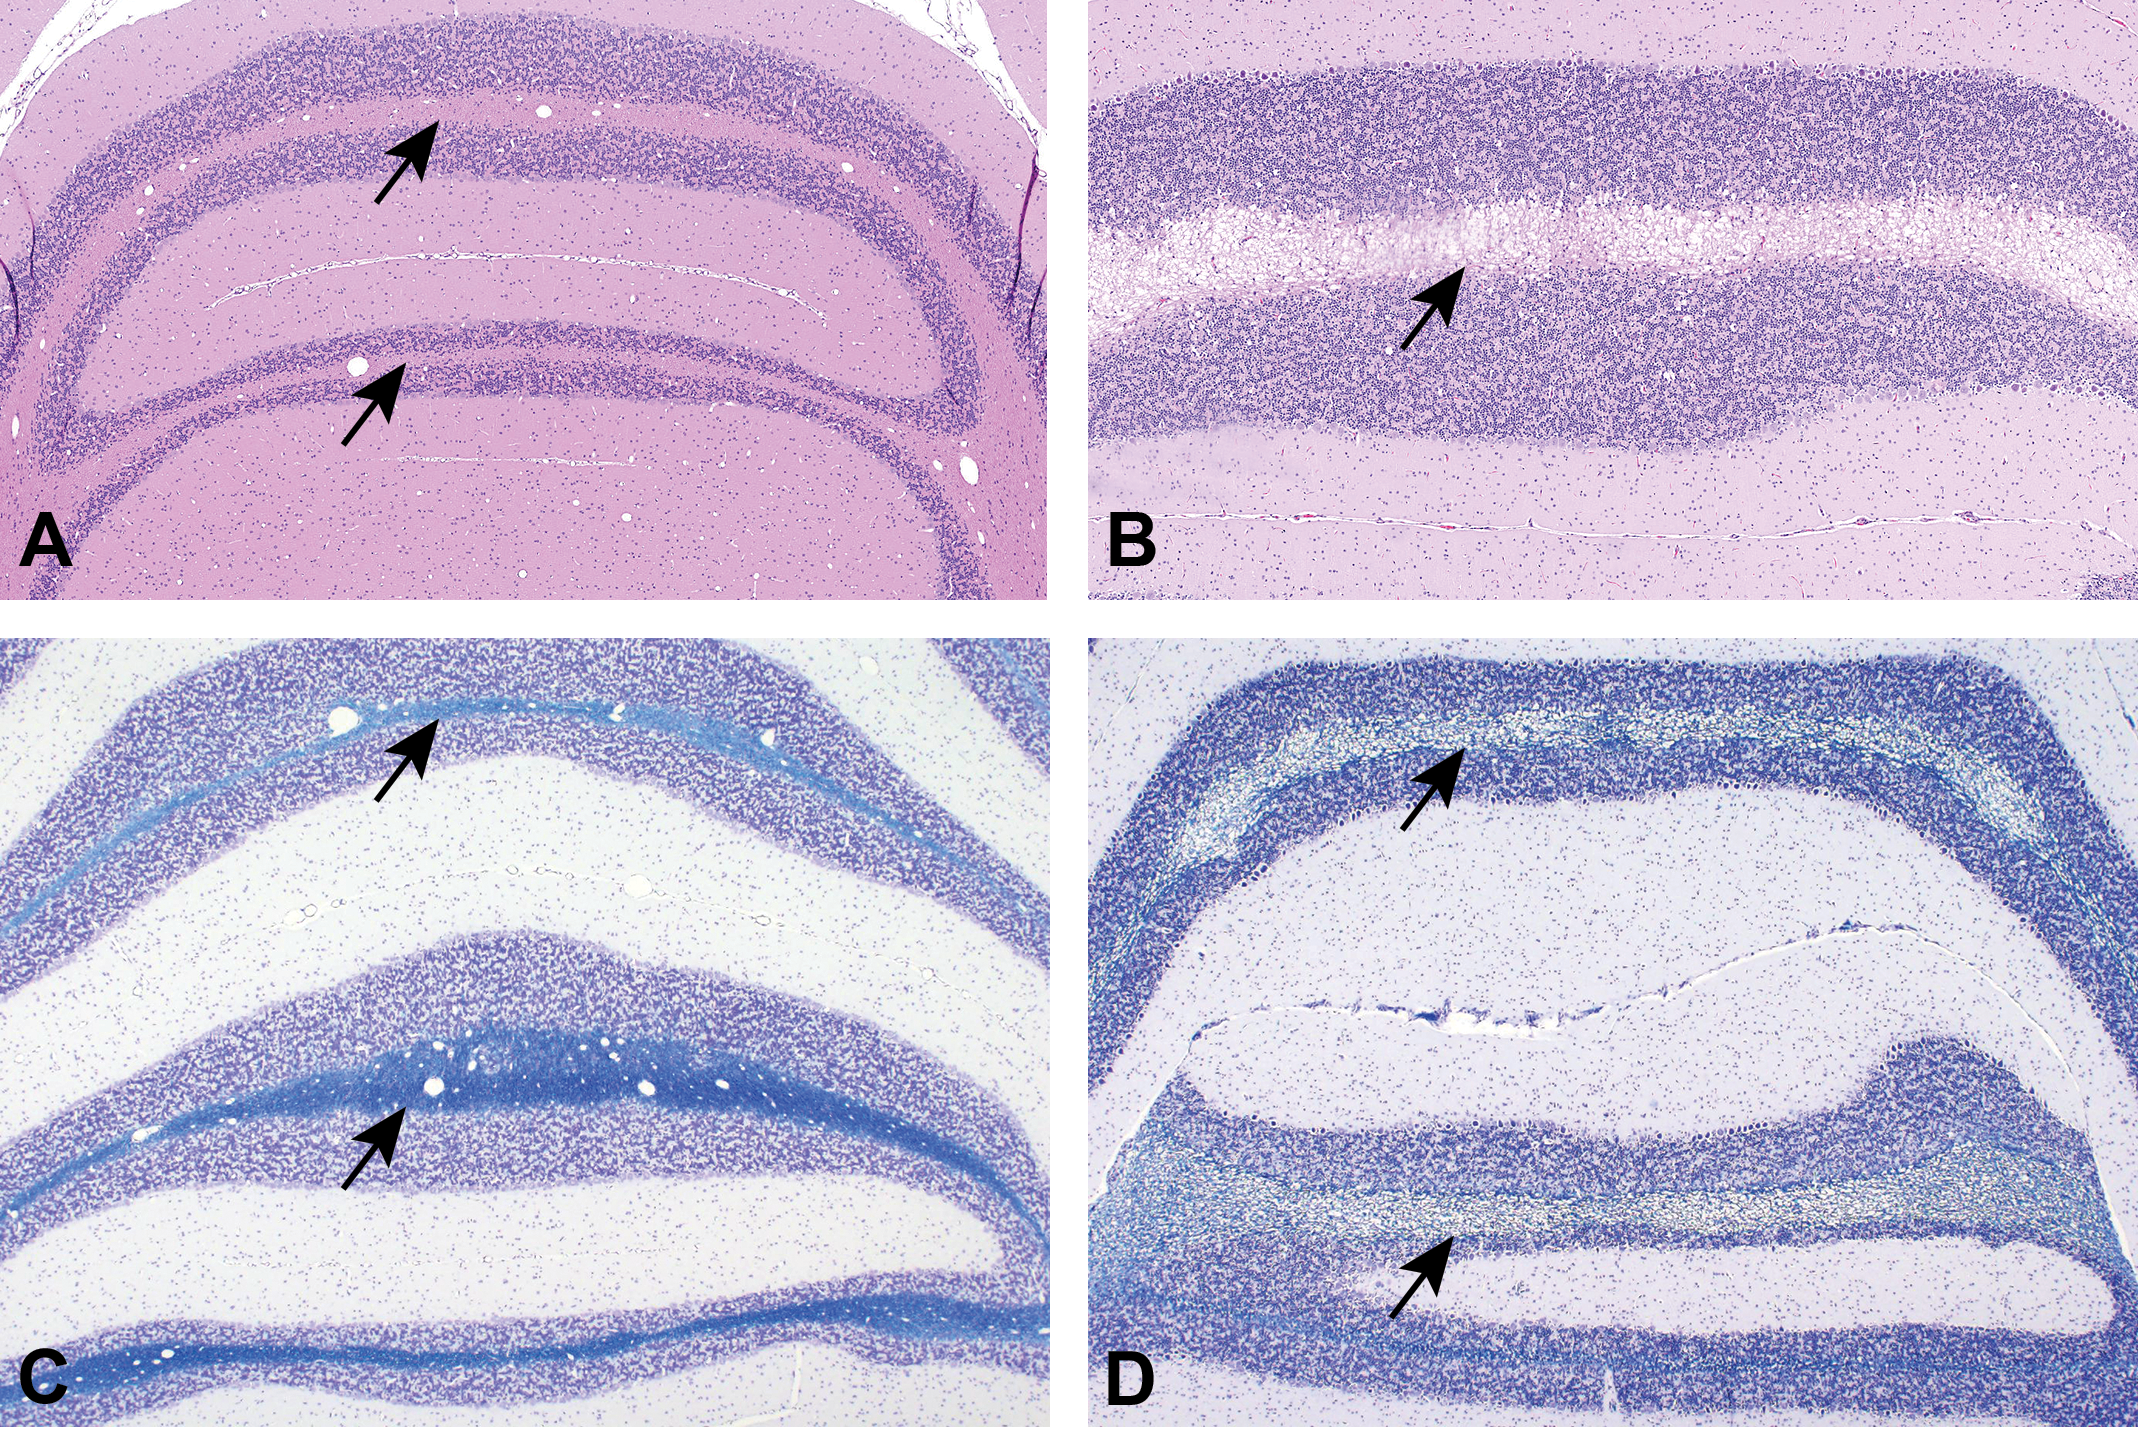
Level 6, cerebellum, hematoxylin and eosin staining of the cerebellar vermis from a control rat (A) compared to a treated rat (B). Similar sections of the cerebellar vermis stained with luxol fast blue/cresyl violet in the control rat (C) and treated rat (D) show expansion of the white matter (arrows) by pale vacuoles.
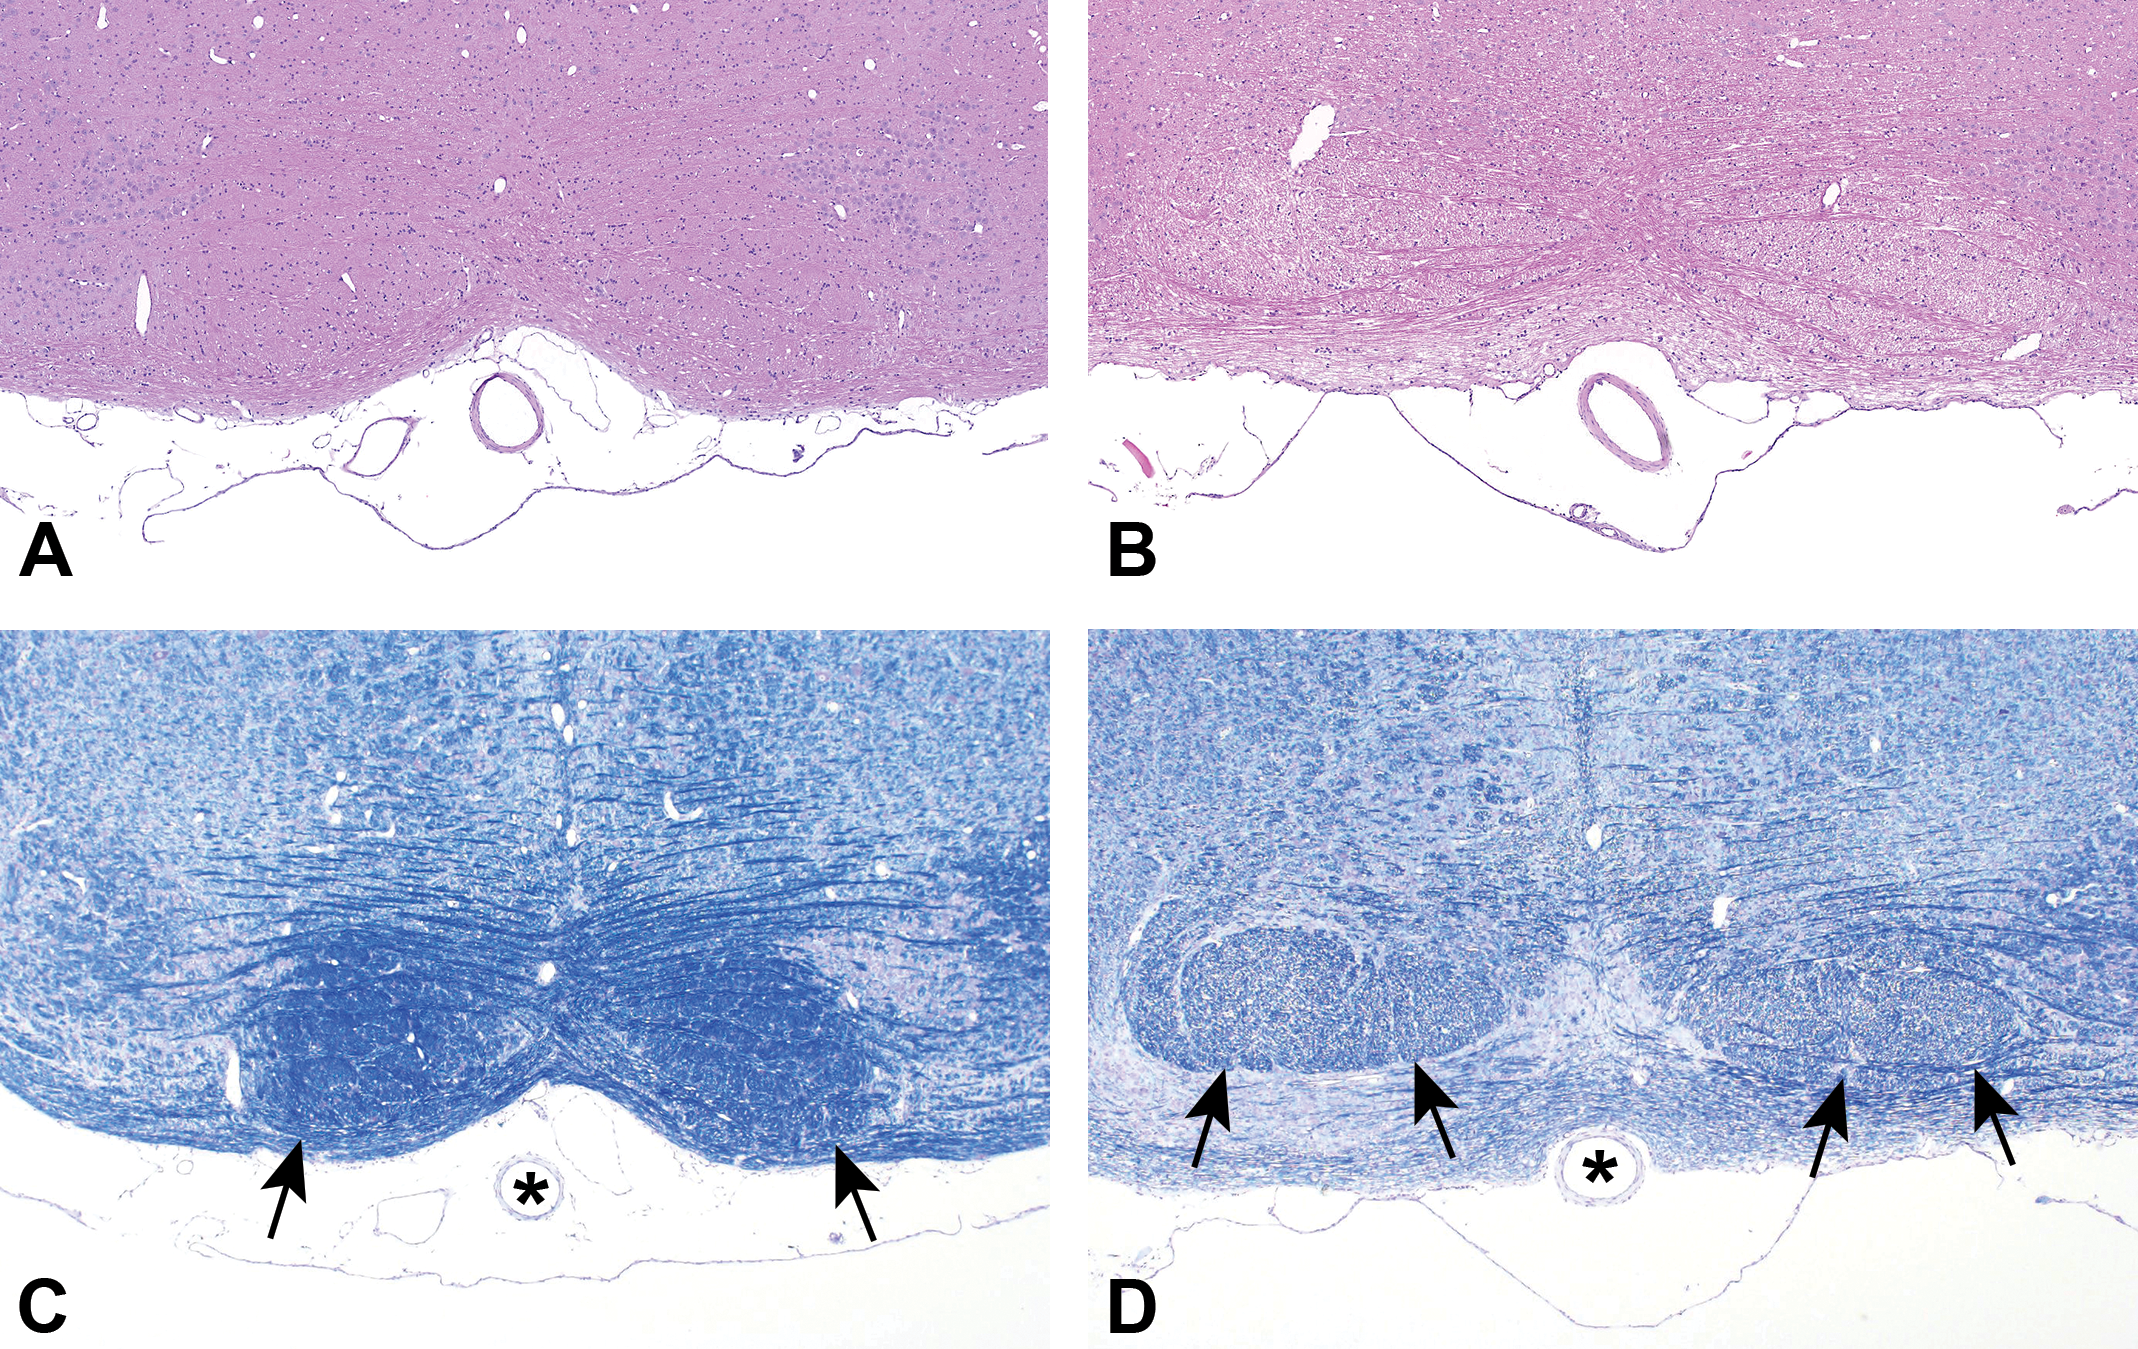
Level 5, pyramidal tracts, ×4 original magnification. Normal fiber density of the pyramidal tracts (arrows) in the control rat (A, H&E and C, LFB/CV). Loss of staining intensity is present in the pyramidal tracts (arrows) in the treated rat (B, H&E and D, LFB/CV). The Basilar artery is also present in all 4 images (asterisks in C and D). Note: A nontissue artifact in image B was removed from white areas only via Photoshop. H&E indicates hematoxylin and eosin; LFB/CV, luxol fast blue/cresyl violet.
Results: Quantitative Assessments
Stereology
Higher volume estimates were observed in all 3 regions in animals treated with hexachlorophene compared to the control group (Table 1). Stereology produced absolute calculations from the distinct anatomical regions of the aca, lfp, and py, which are part of the CST (Figure 11). Of the CST structures, the pyramids were significantly increased in size in both the 25 and 30 mg/kg treated rats compared to controls.
Volume of White Matter (mm3) by Stereology.
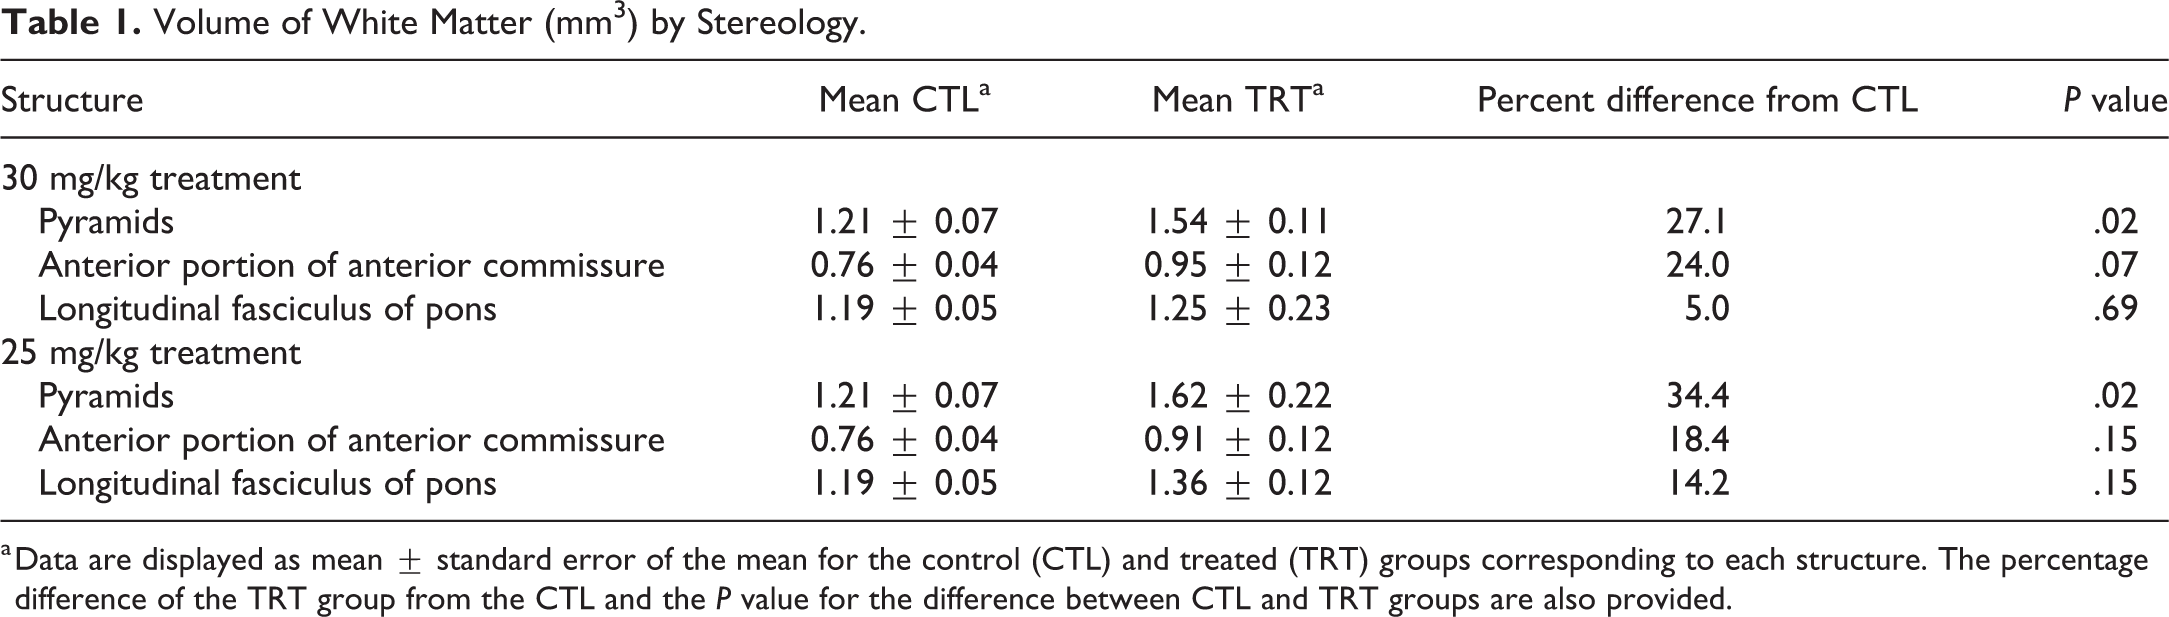
a Data are displayed as mean ± standard error of the mean for the control (CTL) and treated (TRT) groups corresponding to each structure. The percentage difference of the TRT group from the CTL and the P value for the difference between CTL and TRT groups are also provided.
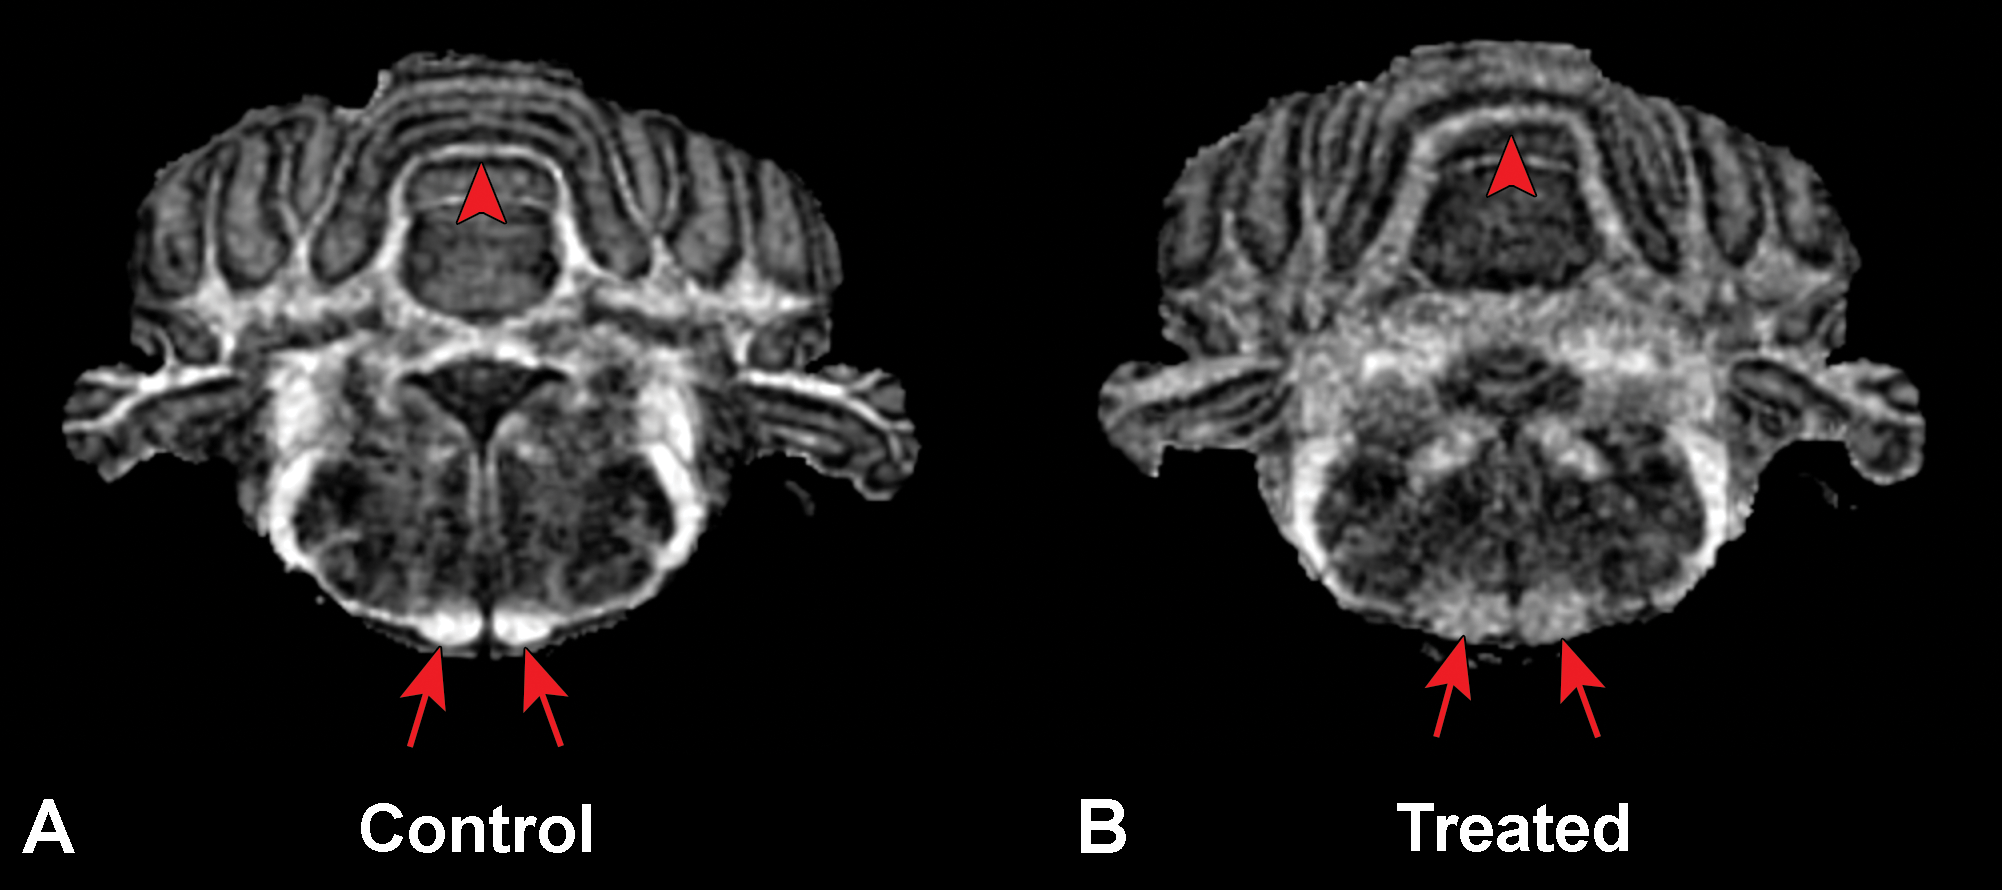
Magnetic resonance microscopy images of a control (A) and a treated rat (B). Note the hypointense areas in the white matter tracts of the cerebellum (arrowhead) and pyramids (arrows) in the treated rat that correlated with the intramyelinic edema.
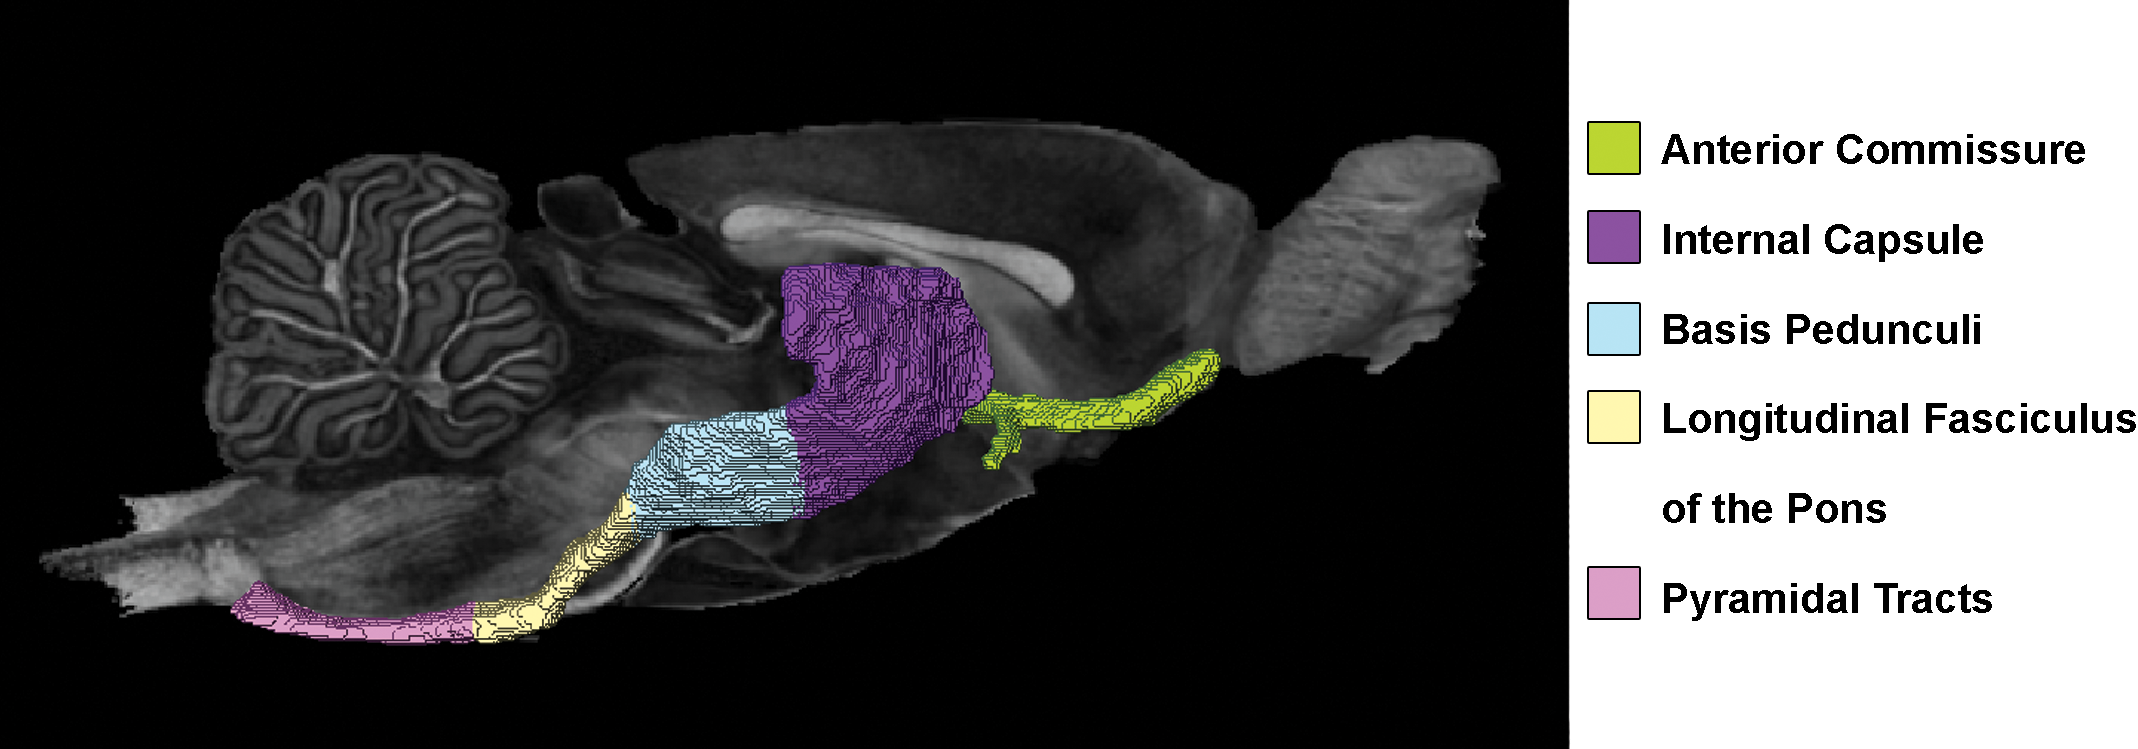
Corticospinal tract (anterior commissure, internal capsule, basis pedunculi, longitudinal fasciculus of the pons, pyramidal tracts) targeted by hexachlorophene in rats.
Magnetic resonance microscopy
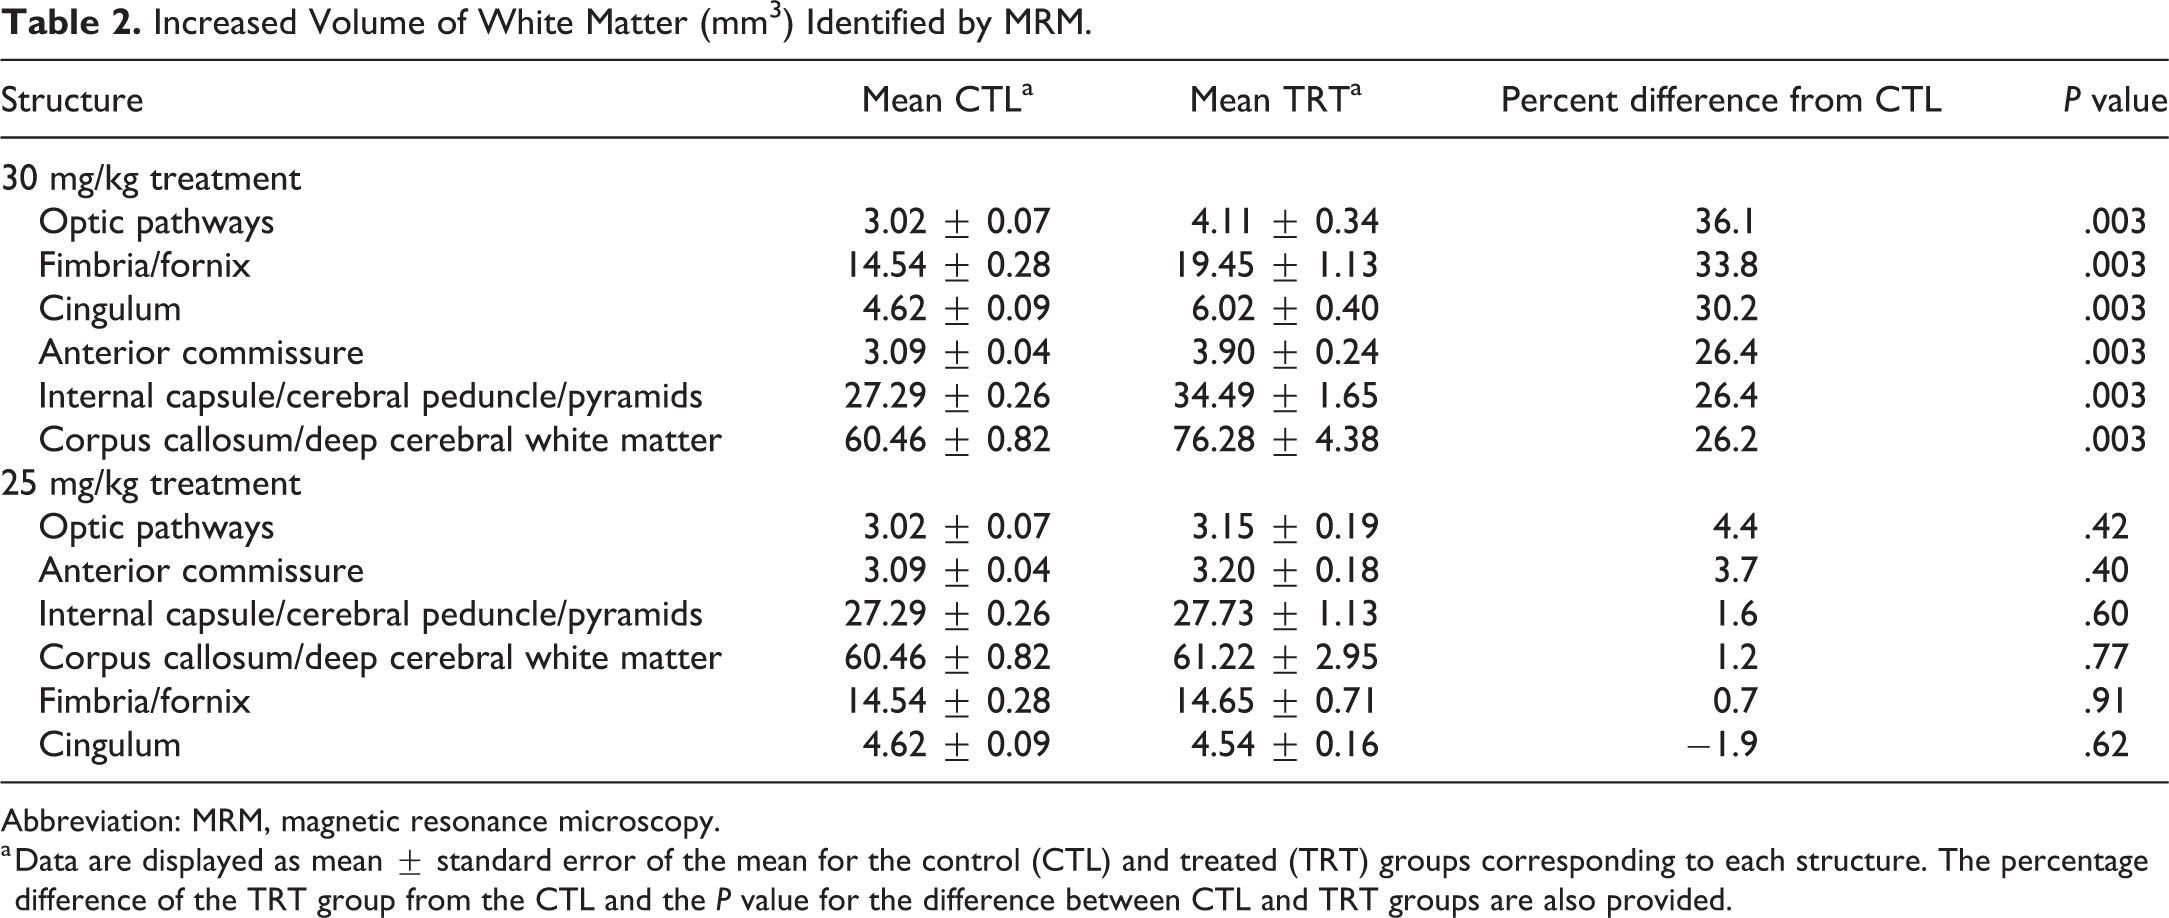
Magnetic resonance microscopy yielded higher volume estimates in major white matter tracts of 30 mg/kg treated animals, including the optic pathways, fibria/fornix, cingulum, aca, internal capsule/cerebral peduncle/pyramids, and corpus callosum/deep cerebral white matter when compared to the controls (Table 2). Although not significantly different from controls, the 25 mg/kg group had slight increases in volume in most of the above white matter structures, with the exception of the cingulum, when compared to the controls (Table 2).
Increased Volume of White Matter (mm3) Identified by MRM.
Abbreviation: MRM, magnetic resonance microscopy.
a Data are displayed as mean ± standard error of the mean for the control (CTL) and treated (TRT) groups corresponding to each structure. The percentage difference of the TRT group from the CTL and the P value for the difference between CTL and TRT groups are also provided.
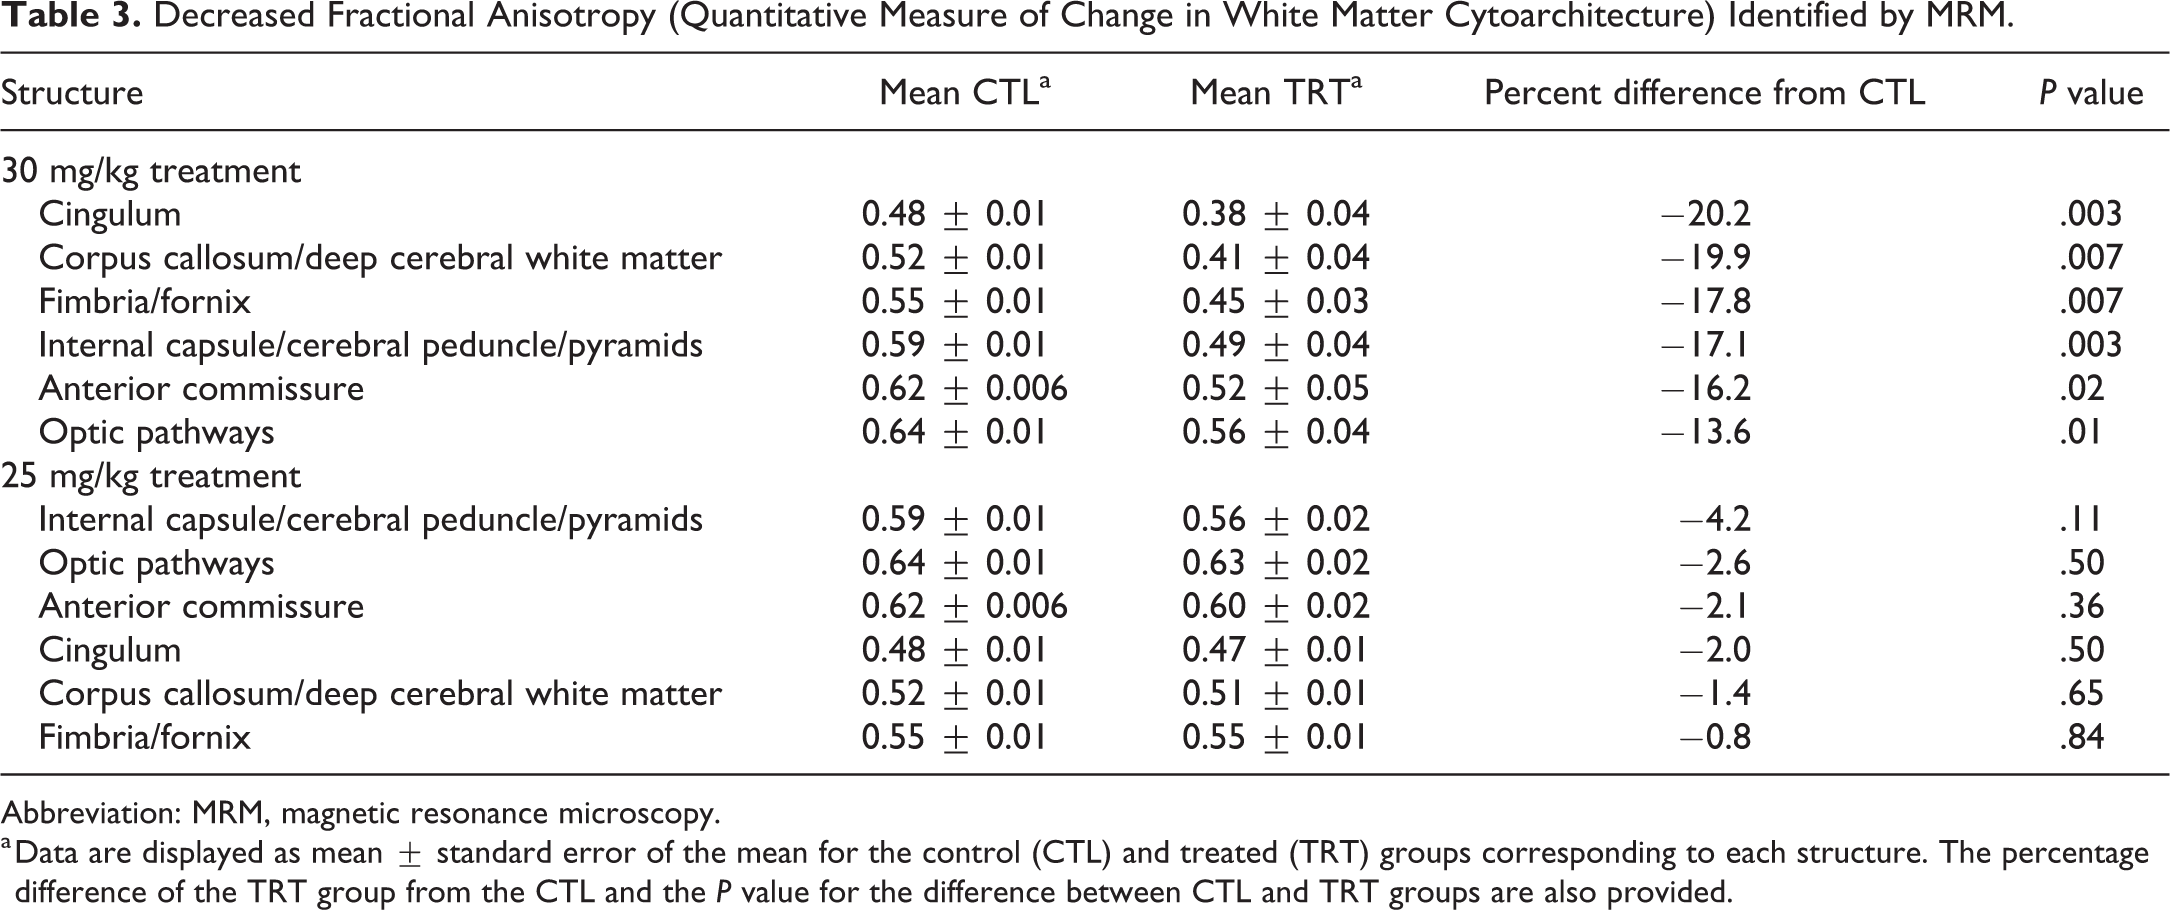
In addition to identifying structural increases in the volume of white matter tracts, MRM provided an opportunity to assess the cytoarchitecture of the white matter by evaluating FA at 30 mg/kg compared to controls, which is a quantitative measure of myelin integrity. 23 Decreases in FA were detected in the major brain regions including the cingulum, corpus callosum/deep cerebral white matter, fibria/fornix, internal capsule/cerebral peduncle/pyramids, aca, and optic pathways (Table 3). At 25 mg/kg, there were also slight decreases in FA of other major white matter structures that were not significant when compared to controls (Table 3).
Decreased Fractional Anisotropy (Quantitative Measure of Change in White Matter Cytoarchitecture) Identified by MRM.
Abbreviation: MRM, magnetic resonance microscopy.
a Data are displayed as mean ± standard error of the mean for the control (CTL) and treated (TRT) groups corresponding to each structure. The percentage difference of the TRT group from the CTL and the P value for the difference between CTL and TRT groups are also provided.
Assessment of percentage differences in volume by stereology and MRM
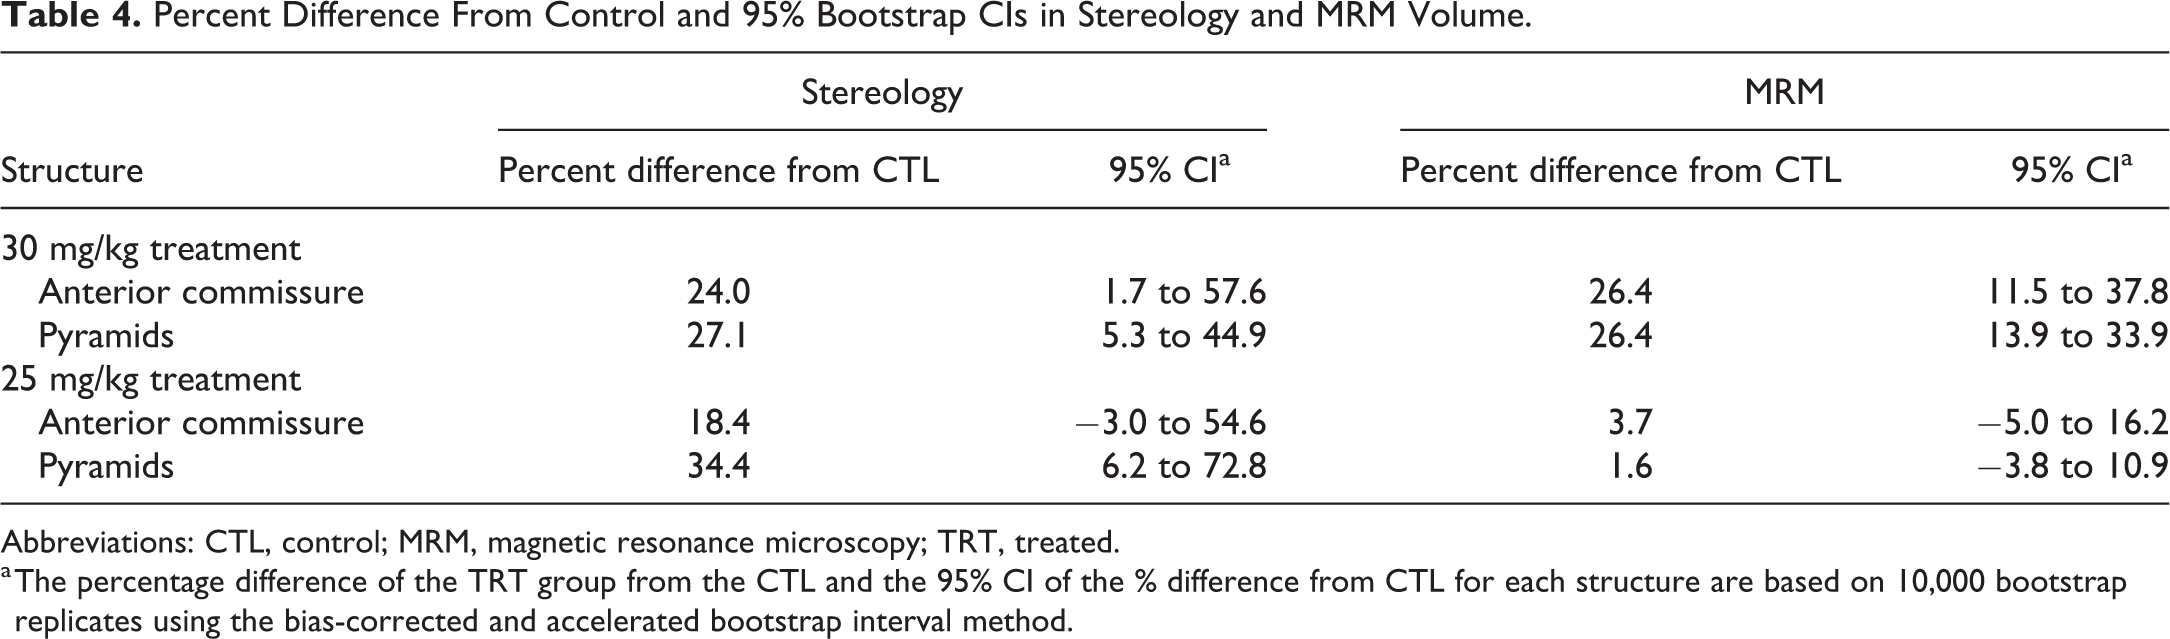
The percent difference in volume in the aca, lfp, and py between control and treatment, and bootstrap 95% CIs for these estimates were calculated for both stereology and MRM methods. Of the 3 regions evaluated here, the bootstrap 95% CIs of the percent difference in volume from control for the pyramids and aca regions were all above 0 after 30 mg/kg hexachlorophene in both stereology and MRM methods (Table 4), indicating that percentage differences from control were increased with treatment. However, using stereology, at 25 mg/kg, only the pyramids region showed percentage increases that did not overlap zero (Table 4).
Percent Difference From Control and 95% Bootstrap CIs in Stereology and MRM Volume.
Abbreviations: CTL, control; MRM, magnetic resonance microscopy; TRT, treated.
a The percentage difference of the TRT group from the CTL and the 95% CI of the % difference from CTL for each structure are based on 10,000 bootstrap replicates using the bias-corrected and accelerated bootstrap interval method.
Discussion
This study was initiated in order to use MRM and stereology in parallel in a well-defined model of toxic myelopathy and in a species that is important in toxicologic pathology. The aim was to use the quantitative approaches of MRM and stereology to determine whether increased volumetric measures of the severity of myelinopathy were comparable from a percentage perspective if not in absolute terms.
Evaluation of the 3 methods used here has shown that each approach can provide complementary information. However, each method has individual merits to be considered in planning future studies. Light microscopy has the advantage of speed (approximately 30 minutes per animal was required to evaluate all the H&E and LFB/CV sections), but does not provide quantitative data. Light microscopy and stereology have the advantage of higher resolution images of brain tissue than current MRM technology. Magnetic resonance microscopy has the distinct advantage of a noninvasive technology that can cover the entire brain in multiple dimensions and provide information in advance to direct ROIs for light microscopic and stereological investigations. For example, in a previous study, MRM was critical in defining our strategy for sectioning the brain and for designing mechanistic and functional assessments on specifically targeted anatomical sites following carbonyl sulfide exposure in F344 rats. 24 The previous study also demonstrated correlations between MRM and light microscopy (H&E images) for neuropathology findings such as gliosis, necrosis, and hemorrhage.
In addition, MRM has the advantage of providing volumetric measurements of a large number of ROIs beyond what is currently feasible in stereology. Cleary, the type of toxicologic study will determine which of these technologies should be used. Currently, we have no data that indicate how valuable MRM can be in toxicities where neuronal loss needs quantification, while stereology has proven its capacity in that regard. Magnetic resonance microscopy has the unique capacity to determine the cytoarchitecture of the white matter tracts, as demonstrated here using DTI to show reduced FA. Importantly, cost factors will be significant in the selection of technologies to apply. The cost considerations of using light microscopy and stereology, having been in use for a long time, are well defined. However, the cost of MRM technology, being relatively newly applied, may differ based on imaging centers. Comparisons are complicated because the methods are so different and the cost of MR is very dependent on the resolution. The cost of MR for a whole brain study has been rapidly plummeting. In these studies, the 3-D volume acquisition covered a 16 mm × 16 mm × 32 mm field of view that covered the entire brain. These data can then be “sliced” along any plane at any position in the brain. The acquisition time for a single specimen (8 hours) results in a cost for data acquisition/processing using the current recovery rates at the Duke Center for In Vivo Microscopy of <$2000 per specimen. Similar studies of a whole brain using conventional methods would be considerably higher.
The light microscopic changes present in our study were consistent with intramyelinic edema noted previously and correlated with the increased volume along myelinated fiber tracts as detected by MRM and stereology. 25 -29 Both stereology and MRM methods provided quantitative measurements of absolute volume of brain regions evaluated, increasing the sensitivity of detection beyond the limitations of standard neuropathological evaluation. Stereology measured the distinct regions of the pyramids, whereas MRM measured the major structures of the CST, including the aca, internal capsule, basis pedunculi, lfp, and py (Figure 11). Therefore, the specific treatment-related effects of the pyramids when measured by MRM may have been diluted to some extent. In addition, comparison of stereology and MRM measurements conducted in control and treated animals at 30 mg/kg treatment, while giving different numeric volumetric results due to differing extent of structures measured (Tables 1 and 2), showed similar mean percentage increases in the volume of white matter in treated animals compared to controls (Table 4). However, at the lower dose of 25 mg/kg, only stereology revealed a significant increase in volume of the py of hexachlorophene-treated rats (Table 4). Decreases in FA were detected in major white matter tracts at 30 mg/kg, but only decreases in trends of FA (not significant) were observed at 25 mg/kg (Table 3).
The greater sensitivity of stereology versus MRM at the lower doses may be due to increased microscopic resolution. The lfp and the py were able to be analyzed separately by stereology, while MRM did not make structural distinctions along the length of the CST. Fine anatomical details within the sections used for stereology allowed for defining and consistently discerning the rostral and caudal extents of each subdivision of the CST. Using stereology, it was possible to differentiate the lfp from the transverse fibers of the pons where they mingle with one another in the brainstem, representing the caudal extent of the lfp. Similarly, the decussation of the trapezoidal bodies was differentiated from the py where they mingle in the hindbrain, defining the rostral extent of the pyramids. These distinctions revealed that the py was more affected by hexachlorophene-induced intramyelinic edema when compared with the lfp.
Our study took advantage of advances in imaging by focusing on DTI. The DTI provides insight into white matter structures through measurement of multiple diffusion parameters. 23 This study also offered the opportunity to investigate the white matter microstructure (Figure 12) and provided a quantitative measure that was related to brain injury. The white matter volume increases were due to the hexachlorophene-induced intramyelinic edema. The DTI also revealed decreases in FA in various white matter regions consistent with the disruption of white matter integrity. Decreases in FA have been reported in various pathology outcomes, such as ischemia, inflammation, edema, and demyelination. 19
Magnetic resonance microscopy provides full brain coverage with considerably improved precision since the brain is in the skull and the entire pipeline for data reduction has been streamlined to remove user bias. Image pipelines automate the complex process of postprocessing. For example, the registration pipeline registers each 3-D volume to the baseline image. This can be done manually using landmarks to identify common coordinates. Manual registration, however, may result in user bias as she or he “chooses” the anatomic landmarks. The automated registration pipeline uses a combination of mutual information and cross-correlation that is driven by the registration algorithm. A second pipeline to calculate the diffusion tensor (and the FA images) is automated via scripting to eliminate the tedium and potential errors of manual entry of processing variables. The studies here exploited only one of the contrasts (“stains”) derived from DTI, that is, FA. The AD, RD, and MD provide complementary data on different types of pathology. Full exploitation of these and other “stains” promises considerably higher automation and reproducibility. For example, MD can be linked to cell density. Radial diffusivity is very sensitive to changes in myelin integrity, and AD can be related to axonal density.
In conclusion, this study has shown that light microscopy, stereology, and MRM provide valuable complementary morphological and quantitative information in this well-known example of toxic myelinopathy. Further studies will be necessary to evaluate these methods with different modes of neural toxicity such as prominent and subtle neuronal loss as well as precision in dose–response evaluations.
Footnotes
Acknowledgments
The authors thank DNTP and Division of Intramural Research for funding this project. DIR collaborations included the Biostatistics and Computational Biology Branch, Comparative Medicine Branch, and Neurobiology Laboratory. The authors also thank all staff who collaborated on this project. The authors would like to specifically recognize Beth Mahler for assistance in preparing the figures for this manuscript.
Declaration of Conflicting Interests
The author(s) declared no potential, real, or perceived conflicts of interest with respect to the research, authorship, and/or publication of this article.
Funding
The author(s) disclosed receipt of the following financial support for the research, authorship, and/or publication of this article: This research has been supported by the Division of the National Toxicology Program, National Institute of Environmental Health Sciences, Research Triangle Park, NC, Duke Center for In Vivo Microscopy, Duke University School of Medicine, Durham, NC (grant/award number: 1R01NS096720-01A1 1S10OD010683-015-P41-EB015897-28), and National Institutes of Health, Intramural Research Project: ES103319-04 (https://intramural.nih.gov./search/searchview.taf?ipid=110659&ts=1572865130).