
Abstract
Detection of test article–related effects and the determination of the adversity of those changes are the primary goals of nonclinical safety assessment studies for drugs and chemicals in development. During these studies, variables that are not of primary interest to investigators may change and influence data interpretation. These variables, often referred to as “nuisance factors,” may influence other groups of data and result in “block or batch effects” that complicate data interpretation. Definitions of the terms “nuisance factors,” “block effects,” and “batch effects,” as they apply to nonclinical safety assessment studies, are reviewed. Multiple case examples of block and batch effects in safety assessment studies are provided, and the challenges these bring to pathology data interpretation are discussed. Methods to mitigate the occurrence of block and batch effects in safety assessment studies, including statistical blocking and utilization of study designs that minimize potential confounding variables, incorporation of adequate randomization, and use of an appropriate number of animals or repeated measurement of specific parameters for increased precision, are reviewed.
*This Points to Consider article is a product of a Society of Toxicologic Pathology (STP) Working Group commissioned by the Scientific and Regulatory Policy Committee (SRPC) of the STP. It has been reviewed and approved by the SRPC and Executive Committee of the STP but it does not represent a formal Best Practice recommendation of the Society; rather, it is intended to provide key “points to consider” in designing nonclinical studies or interpreting data from toxicity and safety studies intended to support regulatory submissions. The points expressed in this document are those of the authors and do not reflect views or policies of the employing institutions. Readers of Toxicologic Pathology are encouraged to send their thoughts on these articles or ideas for new topics to the Editor.
Introduction
The design and implementation of nonclinical safety assessment studies, as well as the accurate interpretation of study results, are complicated processes that involve a variety of professionals of different backgrounds, education, and scientific expertise. Veterinary anatomic and clinical pathologists, toxicologists, investigative biologists, regulatory scientists, physicians, statisticians, and a variety of other subject matter experts must collaborate to plan rigorous safety assessment studies, interpret the complex data generated in these studies, and generate comprehensive reports necessary for regulatory review of new drugs and chemicals in development. 1 -4
Central to these studies is the consistent and humane handling of animals to obtain meaningful and reproducible data, appropriate analysis of specimens and data collected, and unbiased reporting of results to reach an accurate interpretation regarding potential test article–related effects, risk assessment, and acceptance of study results by regulatory agencies. Regulatory authorities advise that studies should always be designed to minimize bias, 5,6 yet there are multiple case examples that indicate that some study designs and conduct may inadvertently allow various factors to impact nonclinical safety assessment studies. These unintended influences, when present, may be significant enough to complicate study results or obscure accurate attribution of test article–related effects. 7 -9
In nonclinical safety assessment studies, there is usually one end point that is of primary interest: the effect of treatment with the test article on the animal model. However, there are often other variables that can impact this assessment that are not of primary interest to the investigator referred to as “nuisance factors.”
10
Known nuisance factors affect groups of data and can result in systematic bias within a study, whereas unknown nuisance factors usually result in random variability and may be referred to as noise or inherent variability within a study.
10
Potential nuisance factors include differences in time of treatment or manipulations (
The term “block effect” originally referred to changes observed with crops grown on different blocks or plots of land in field experiments and was used to describe some unifying characteristic that set it apart from other blocks in the study. 12 The term has since been adopted more generally to describe such phenomena in many different types of scientific investigations. As defined by Fisher, 12 the term “block” therefore refers to a subset or group being studied within a test system, and block effects are thus alterations that affect an entire set of test subjects that are not due to the treatment of interest in the study. Block effects may occur in the preanalytical, analytical, or postanalytical stages of any safety assessment study, and the consequences of these effects may interfere with the accurate interpretation of the study results.
“Batch effects” are types of block effects that occur in smaller groups of data that vary from the main mass of study data due to technical differences that are not related to the important scientific or biological aspects in the study and are instead due to the unintended introduction of variability. These differences in groups of data may arise from technical factors such as differences in analysts, reagents, sample handling, processing or storage conditions, or time/day of data collection. 7,13 -15 Batch effects result in increased data variability within the overall study and may present challenges for data interpretation. Batch effects may be insidious, multifaceted, and vary in severity or attributes. 15 Batch effects occur more commonly with high throughput, big data laboratory platforms (e.g., gene expression, chromatography–mass spectrometry) for which methods continue to evolve, and few universally accepted protocols exist. These assay techniques often lack commercially available quality control materials (such as internationally recognized standards), and control matrices may not be available. Causes for batch effects have been reviewed, 16 -18 and various data reporting methods have been suggested. 16 Investigators and statisticians have developed a variety of methods and advanced statistical tools to assist in removal of nuisance factors from studies with batch effects. 18 -26
For the purpose of this article, the authors will define block or batch effects as alterations in study parameters that occur when one or more sets of groups, animals, or specimens are handled differently than all the others in a single study. This inadvertent introduction of nuisance factors into a data system may be due to unexpected environmental or technical influence or inadequate randomization and can result in perceived group test article–related effects when none exists. 9,13 Due to the common features of the block and batch effect nuisance factors and for easier reading, the authors will use the term “block/batch effect” from this point forward in the introduction and discussion sections when referring to material that is pertinent to both. Well-recognized examples of block/batch effects in the recent literature include artifactual vacuolation of brain secondary to tissue processor malfunctions and retinal degeneration due to excessive light exposure in rats. 27,28 In the case examples section that follows, we will identify scenarios as either block or batch effects for clarity.
The objective of this points-to-consider article, written by members of a working group of the Society of Toxicologic Pathology’s Scientific and Regulatory Policy Review Committee, is to introduce the concepts of nuisance factors and block/batch effects with emphasis on those that may occur in safety assessment studies and their potential consequences to data interpretation. Suggested practices are included for identifying procedures or actions that may confound interpretation of pathology study data and to circumvent problems associated with nuisance factors. The authors provide multiple case examples of nuisance factors and block/batch effects that encompass a wide variety of procedures and subdisciplines involved in safety assessment studies. In addition, the authors review methods and techniques to avoid block/batch effects in safety assessment studies.
Examples of Block/Batch Effects
To understand how to prevent block/batch effects, the authors believe that it is necessary and critical to identify past scenarios in which such nuisance factors have previously posed potential problems for investigators. To this end, the following section contains real-world examples of block/batch effects that occurred during the conduct of safety assessment studies for which the names and companies of investigators, study sites, and test articles have been anonymized. The case presentations selected illustrate a wide variety of situations that may be encountered in the biopharmaceutical and chemical industries.
Example 1
Variability in Picrosirius staining process within and between studies limits utility in mouse models of unilateral ureter obstruction (UUO).
History
Unilateral ureter obstruction is a technique used in mouse models to test the efficacy of test articles to alleviate the progression of renal fibrosis. Four UUO studies were conducted at a biopharmaceutical company with different test articles and therapeutic targets. Mouse kidney collagen content was quantitatively assessed by digital image analysis of Picrosirius red–stained sections.
Results
Within vehicle control groups, there was often substantial variability in the Picrosirius red staining in UUO mouse kidneys even between animals in the same study (Figure 1). Due to the pharmacologic nature of the test article targets, the test article efficacy was anticipated to be subtle, making it challenging to determine whether any potential alleviation in fibrosis was test article-related or instead simply associated with the variability in the model. Therefore, in an attempt to further characterize the dynamic variability of the model, vehicle control groups across four studies were compared. The intensity of staining varied markedly (as measured both semi-quantitatively by the pathologist and quantitatively by image analysis) between staining batches and studies, demonstrating a quantifiable batch effect confounding interpretation. Although it may be tempting to compare between routes of administration or dose levels or test articles across studies, it is important to recognize that appropriate comparisons can only be made between samples stained in the same staining run and not between samples stained in different staining runs (batches).
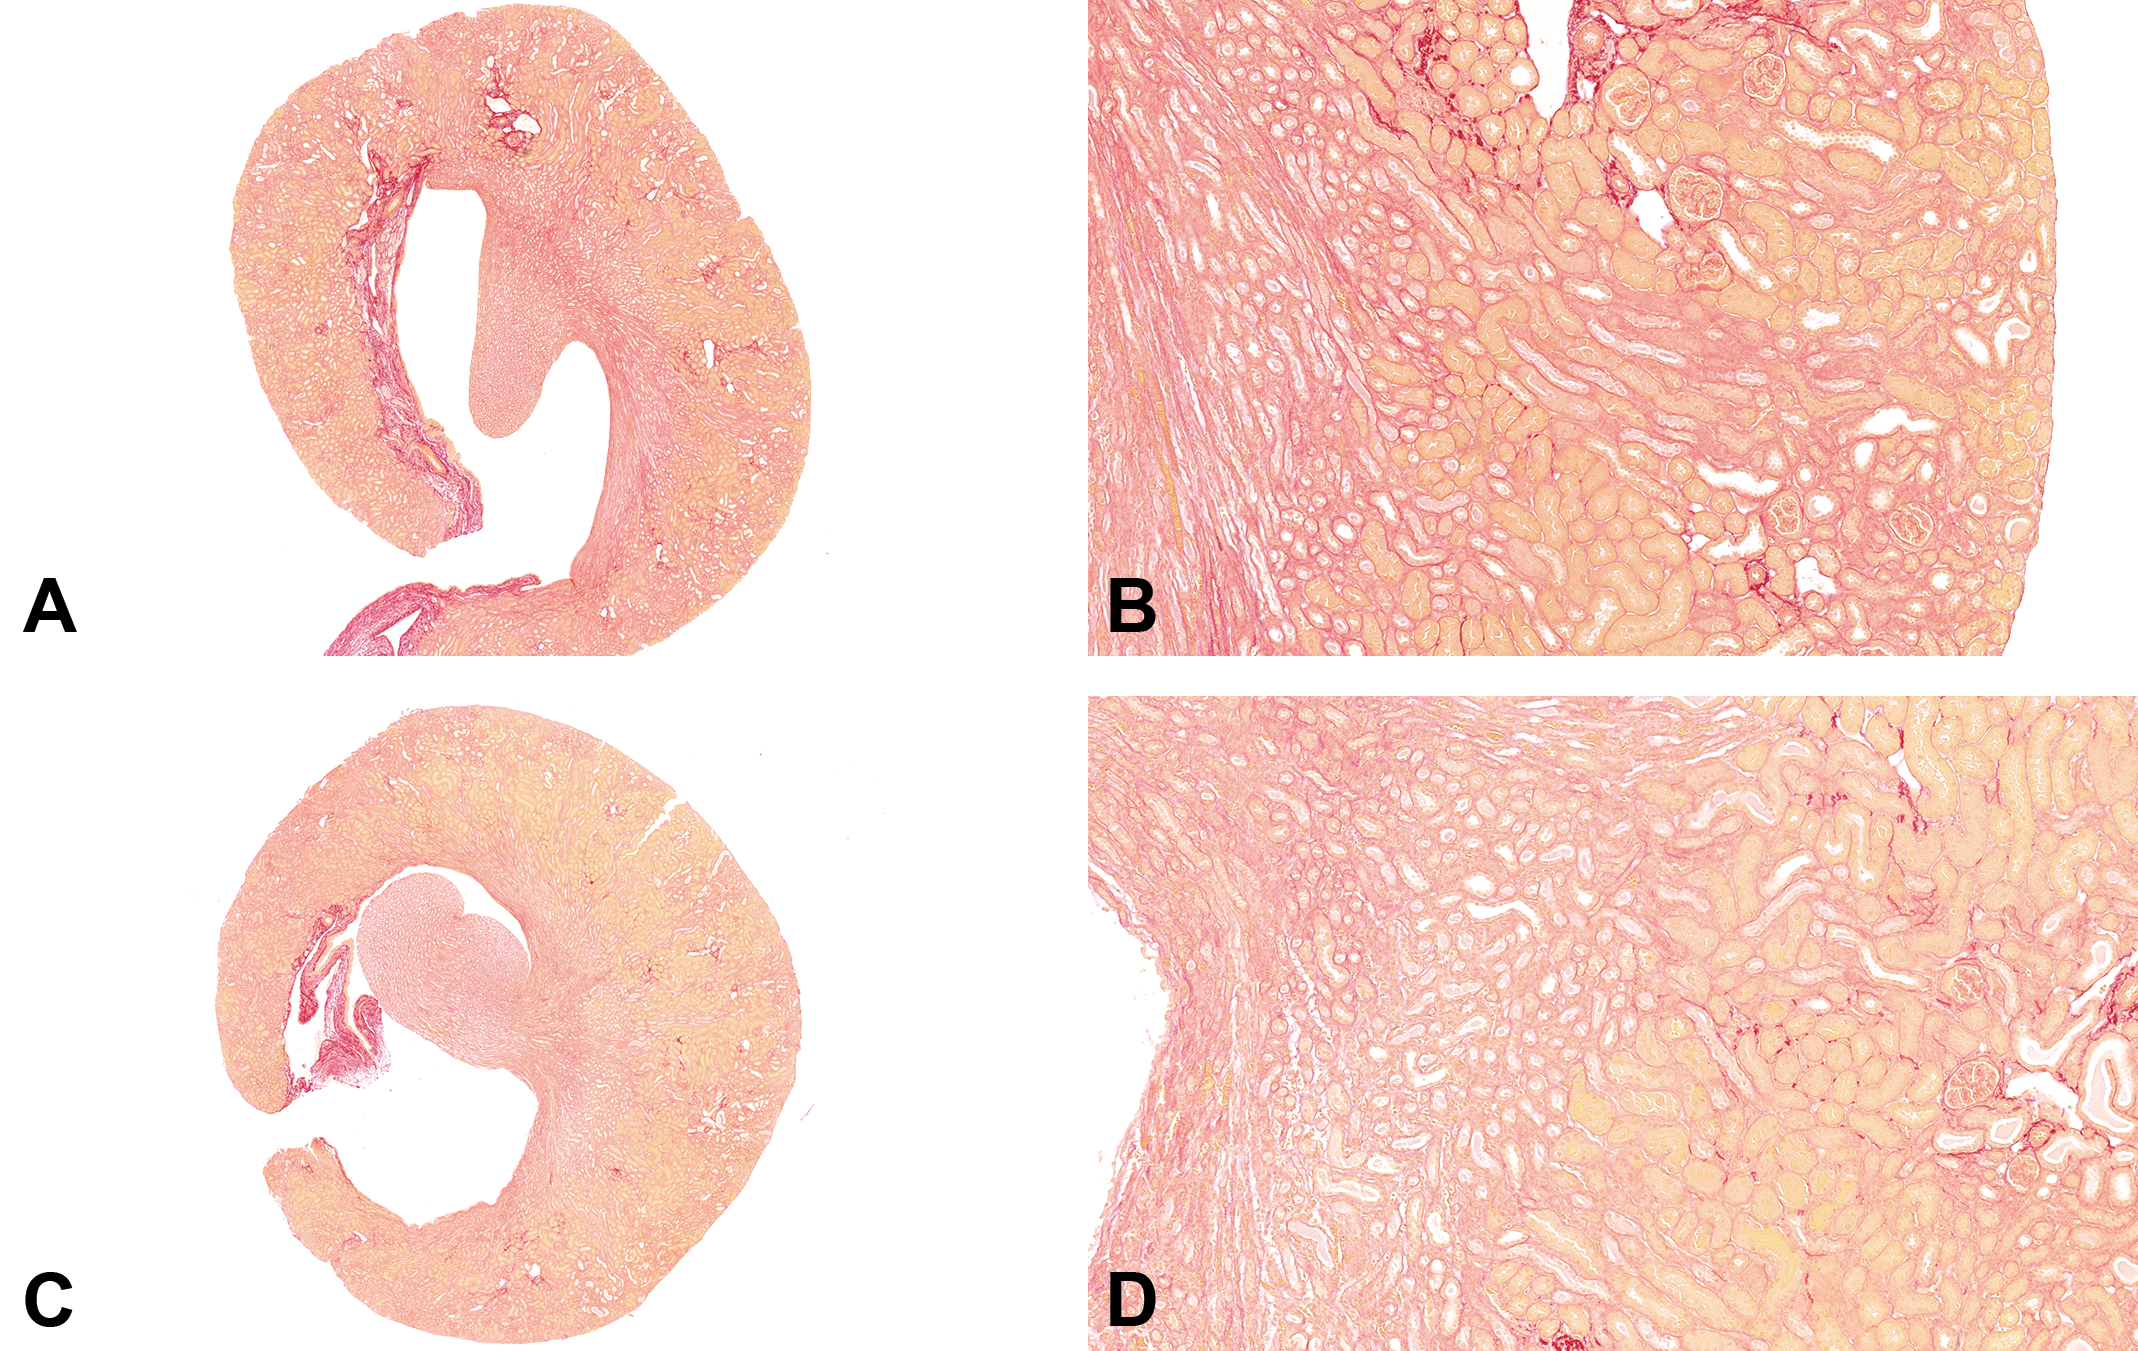
A-D, Picrosirus red staining of kidney sections. A, Study #1 Kidney original objective ×2. B, Study #1 Kidney original objective ×10. C, Study #2 Kidney original objective ×2. D, Study #2 Kidney original objective ×10. Overall percentage of the collagen content in the study #1 was higher than that in study #2. Picrosirius red staining between studies was different, but the staining was consistent within each group and between groups within the same study.
Example 2
Unexpected changes in glucose concentration and aspartate aminotransferase (AST) activity in a 1-week rat toxicity study.
History
A biopharmaceutical company performed a 1-week daily oral gavage toxicity study using male and female Sprague Dawley rats. There were four treatment groups including vehicle control. Blood was collected for standard clinical chemistry testing immediately prior to necropsy at study termination.
Results
Investigators were puzzled initially by the changes in glucose concentration and AST activity from rats in this study (Table 1). The results suggested a pattern of minimally increased serum glucose concentration and decreased AST activity (statistically significant at high dose). These results were unexpected and did not agree with prior studies of this test article.
Mean Glucose Concentration and AST Activity From Sprague Dawley Rats in a 1-Week Toxicity Study.
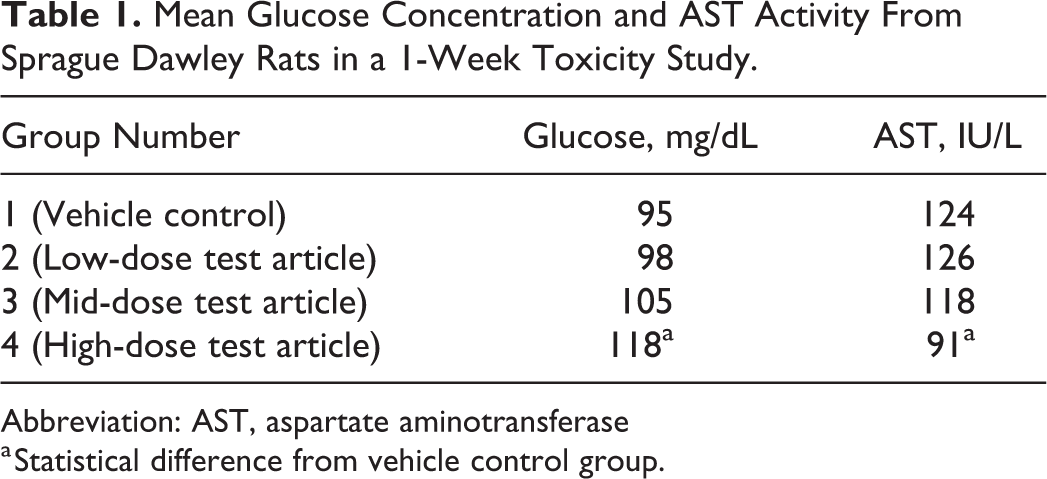
Abbreviation: AST, aspartate aminotransferase
a Statistical difference from vehicle control group.
In this study, the blood samples were collected in numerical group order and not delivered to the clinical pathology laboratory until the collection from the last group (Group 4) was completed. The delay in sample centrifugation enabled erythrocytes to continue to metabolize serum constituents until centrifugation and serum separation occurred. Delayed sample delivery to the laboratory can result in an approximately 10% decrease in glucose concentration per hour. 29 Since the control samples were collected first and had the longest delay before sample processing, this decrease was most pronounced in control, followed by the low-, mid-, and high-dose test article groups, the last with minimal impact. Additionally, erythrocytes have AST activity, and this enzyme can diffuse extracellularly into the serum if the blood sample is left unprocessed resulting in the same block/batch effect. In this example, the group changes in glucose concentration and AST activity appeared dose-related and could have been mistakenly attributed to the test article, whereas these findings were artifactual resulting from block effects that occurred due to non-randomized sample collection and a delay in sample processing.
Example 3
Inexperienced phlebotomy team/incorrect order of blood sample collection
History
A biopharmaceutical company conducted a routine 3-month oral gavage toxicity study in male and female Fischer 344 rats. There were four treatment groups including vehicle control. The test article had no history of causing alterations in routine clinical pathology parameters evaluated during test article discovery or lead optimization and candidate evaluation safety assessment studies in rats and dogs.
Results
EDTA-anticoagulated blood was analyzed using a Siemens ADVIA 120 Hematology System and reagents. Hematology data review indicated a lack of test article–related changes in complete blood count parameters. However, there was an unusual pattern of variance (standard deviation, SD) in several blood cell count parameters (Table 2).
Erythrocyte Counts in Male and Female Fisher 344 Rats Treated With a Test Article for 3 Months.a
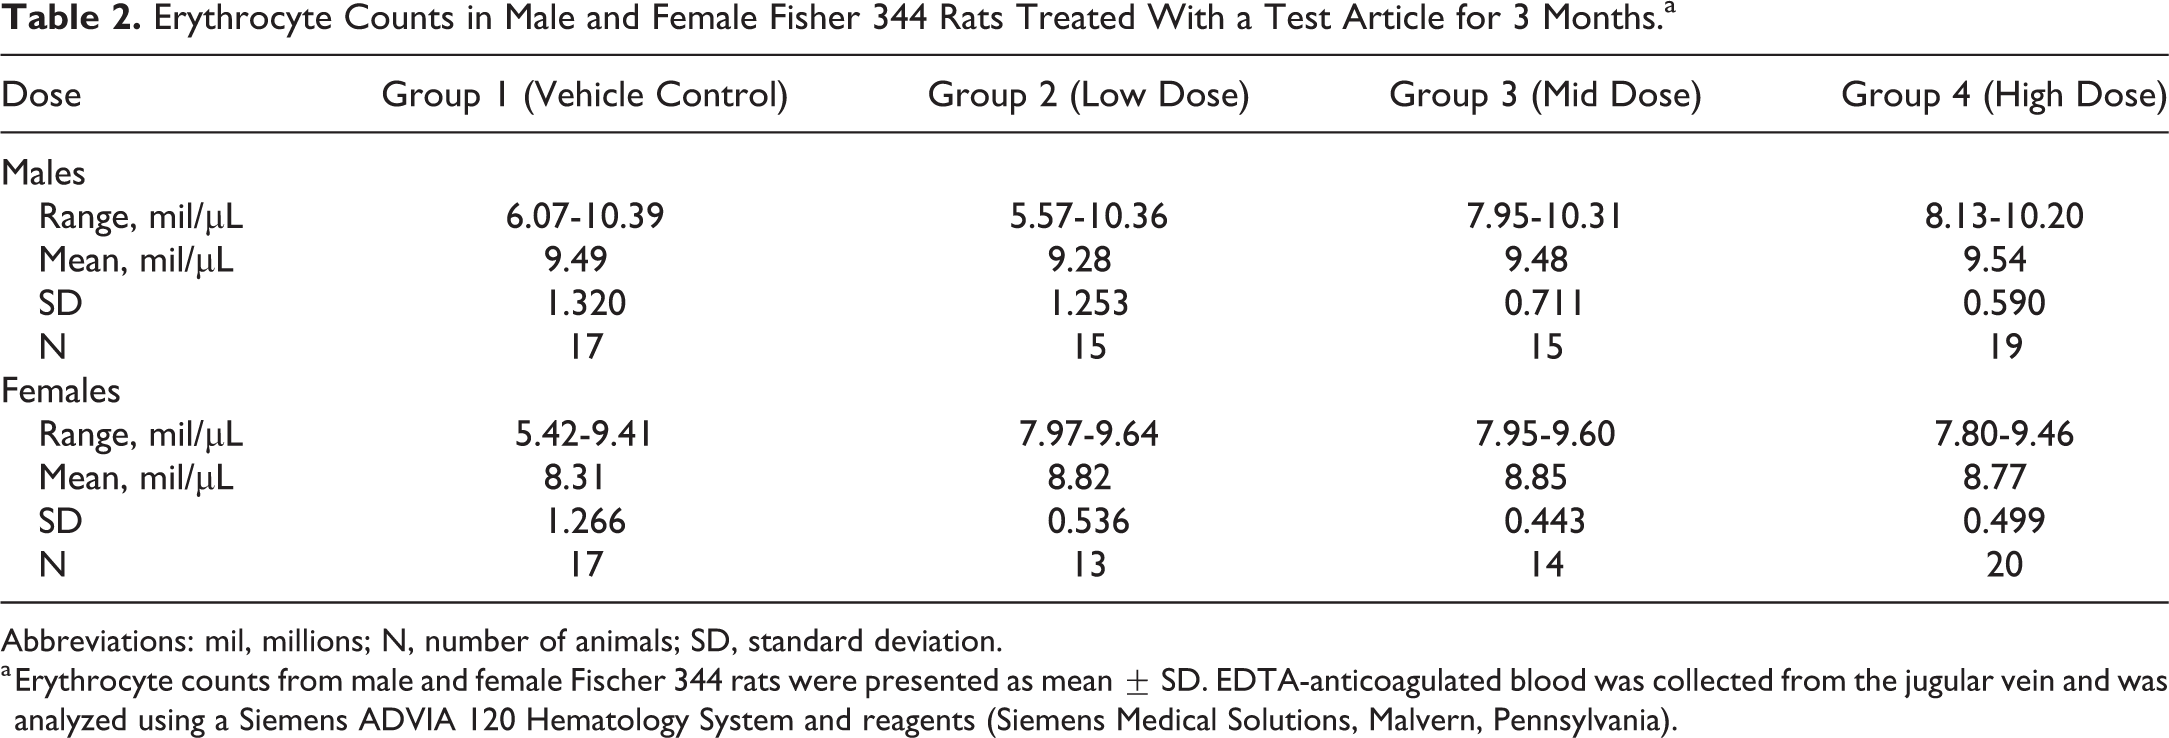
Abbreviations: mil, millions; N, number of animals; SD, standard deviation.
a Erythrocyte counts from male and female Fischer 344 rats were presented as mean ± SD. EDTA-anticoagulated blood was collected from the jugular vein and was analyzed using a Siemens ADVIA 120 Hematology System and reagents (Siemens Medical Solutions, Malvern, Pennsylvania).
Review of erythrocyte data in both male and female rats indicated that the variation in counts (SD) was greatest in healthy rats treated with the vehicle control, and erythrocyte count variance decreased with increasing dose of the test article. Although the mean erythrocyte counts were not statistically different in either sex in this study, this pattern of decreasing SD with increasing dose of test article was unusual. Rats treated with vehicle control often have the lowest variation, and those treated with test article often have greater variation in blood cell counts. In some cases, high variability in vehicle control values for a parameter may interfere with the ability to detect a subtle test article–related effect in a safety assessment study.
Although samples of EDTA blood from the rats appeared normal at time of collection and upon receipt in the clinical pathology laboratory, numerous microclots were identified in blood smears. Similar microclots had been detected by the hematology analyzer, preventing fully accurate erythrocyte counts and resulting in the observed variance. It was learned later that the phlebotomy team assigned to this study lacked experience in jugular puncture technique and in determining the proper order for blood sample collection. Rather than alternating between treatment groups or randomizing blood collections, the phlebotomy team collected blood from the animals in group order. Expertise in jugular blood collection increased with experience so that the animals bled last (high dose) had more efficient blood collection with fewer microclots produced, resulting in the observed block effect. In this case, the block effect occurred when the phlebotomy team collected blood via jugular puncture in group order rather than rotating collections between groups.
Example 4
Effect of anesthesia on glucose concentration in rats.
History
A biopharmaceutical company performed a 4-week rat toxicity and toxicokinetics (TK) study in male and female Sprague Dawley rats. There were four treatment groups including vehicle control. Blood glucose concentration was analyzed using the samples collected for TK analysis.
Results
Glucose concentrations were discovered to be sharply elevated above previous baseline values in control rats during the latter part of the study (Figure 2). It was later learned that the number of rats assigned to the control group was miscalculated prior to study start. As the study progressed, personnel at the contract research organization (CRO) decided to anesthetize and rebleed some of the rats in the control group in order to provide an adequate N for analysis of the glucose data. Only these control animals were sampled under isoflurane anesthesia, and this type of anesthesia has been shown to cause spikes in blood glucose concentrations. 30 In this example, the control animals were treated as a separate group or block during the later time points in the study in that handling (anesthesia) was different from all other test article–treated animals.
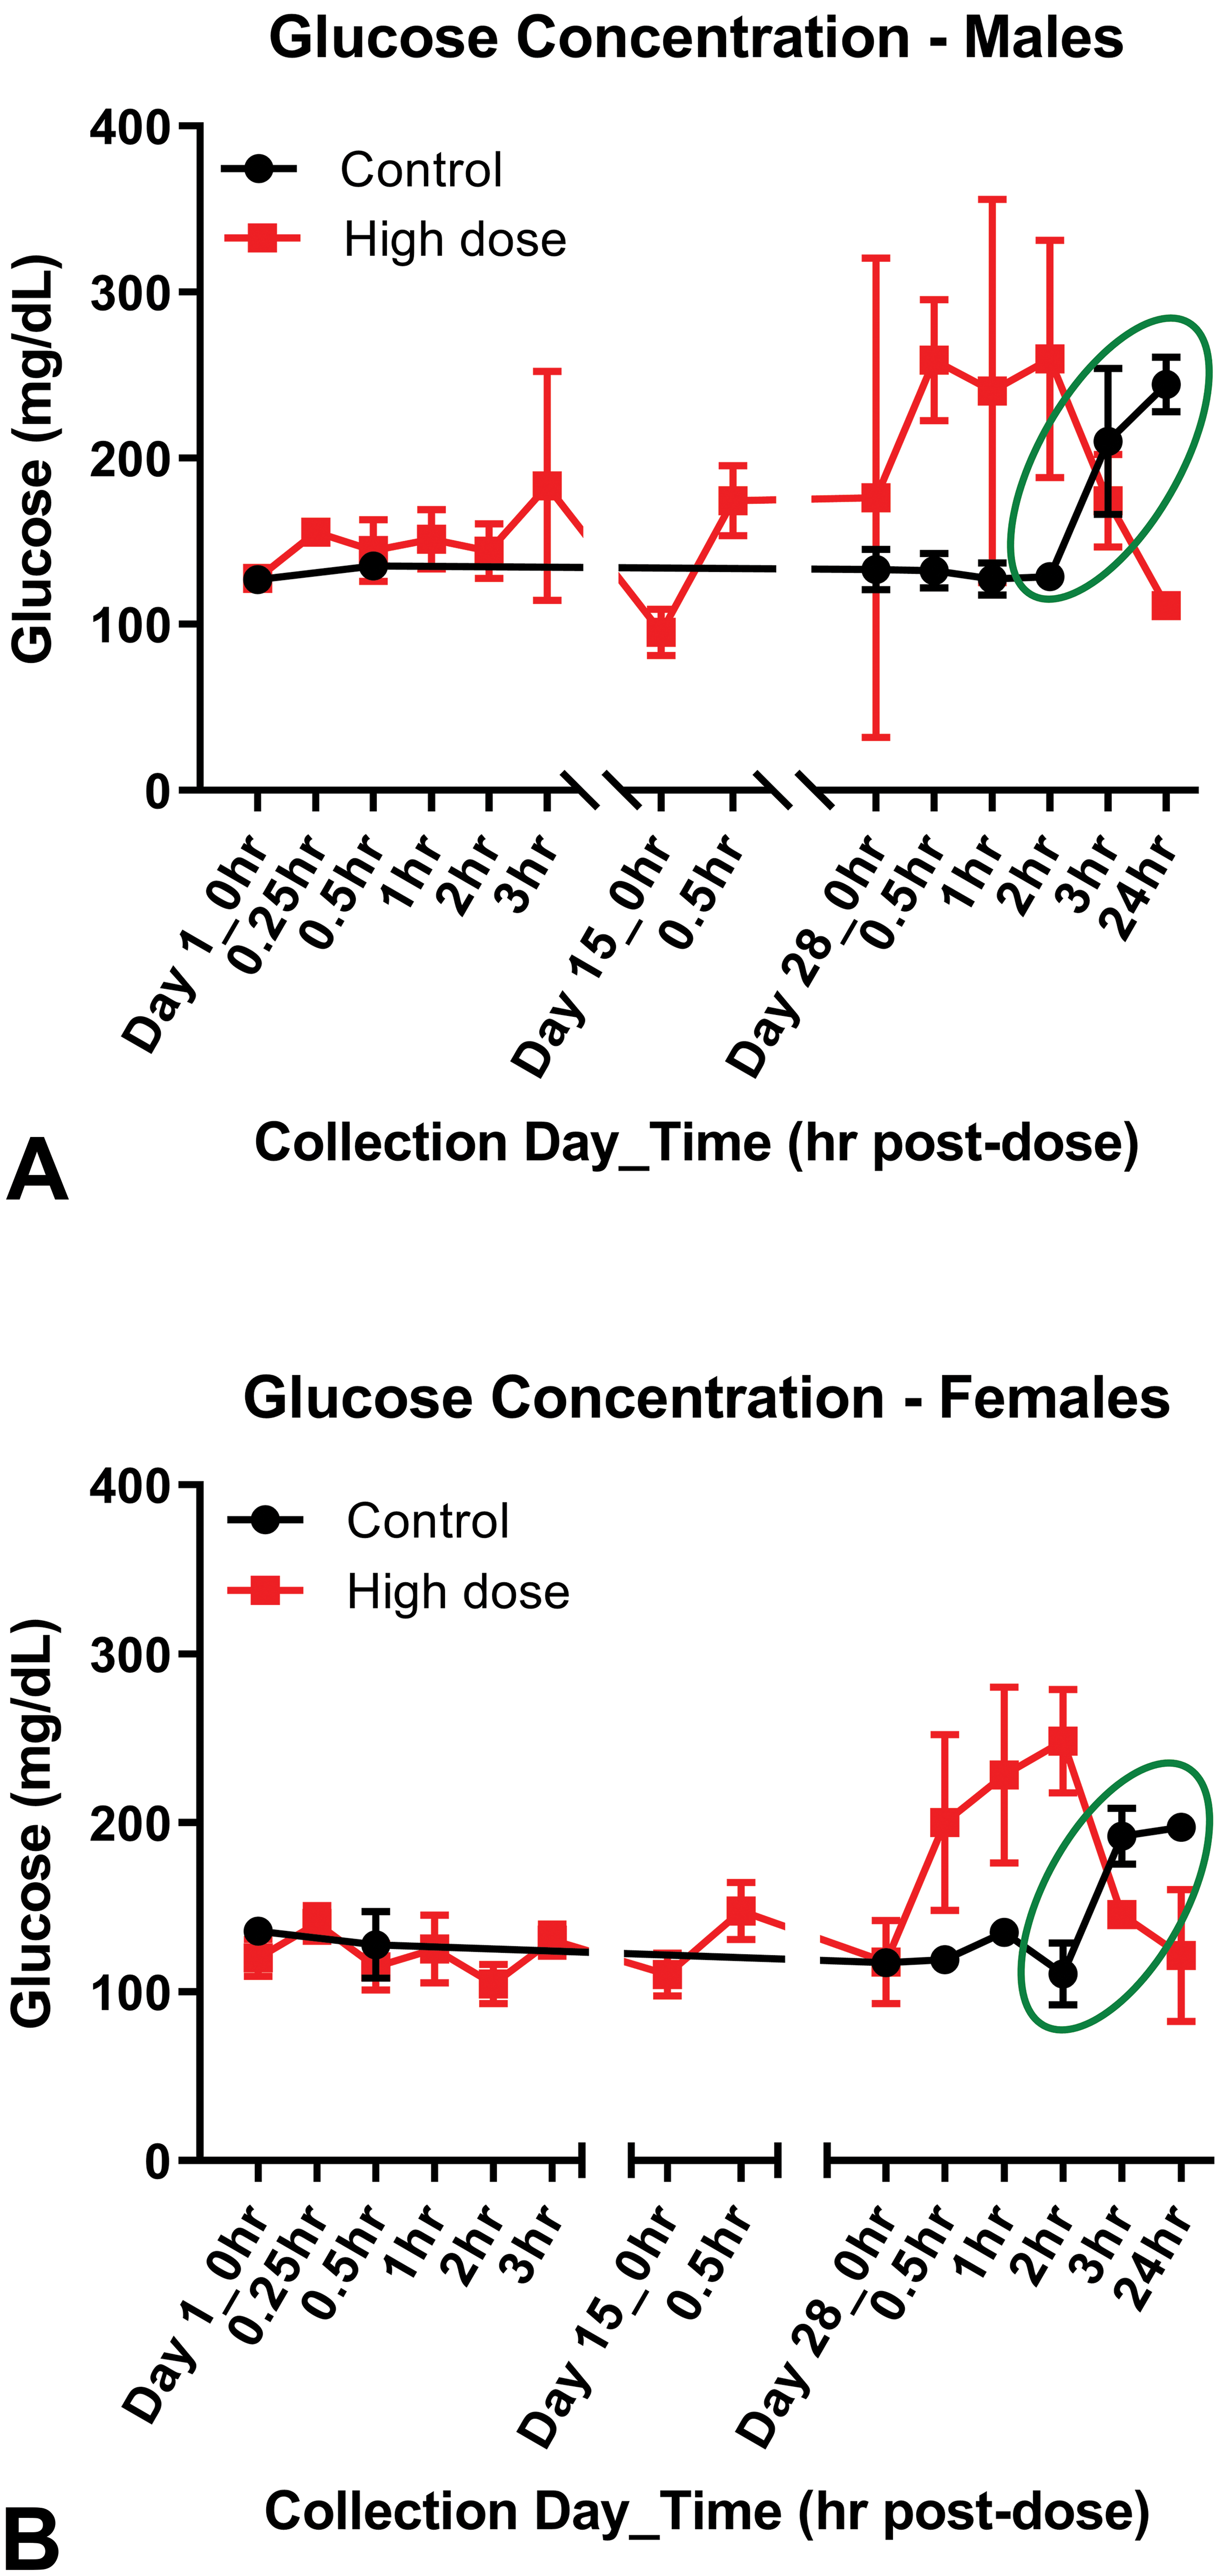
Glucose concentrations in (A) male and (B) female Sprague Dawley rats. Note: Green circle—control rats at later times (day 28 at 3 and 24 hours) were anesthetized. Compare glucose concentrations in rats treated with vehicle control to baseline values.
Example 5
Effect of age at time of dosing on incidence of hydronephrosis in rat pups.
History
A biopharmaceutical company conducted multiple pre- and postnatal rat studies and investigative rat juvenile toxicity studies in which various test articles were given orally to rat pups between 7 and 21 days of age. The incidence of hydronephrosis (renal pelvic dilation) was much higher than expected, reaching levels as high as 30% in test article and vehicle control groups (Figure 3). The lesion was typically unilateral and more common in the right kidney. When dosing rats beginning after 25 days of age with the same vehicles and test articles, hydronephrosis was uncommon and occurred in fewer than 10% of litters.
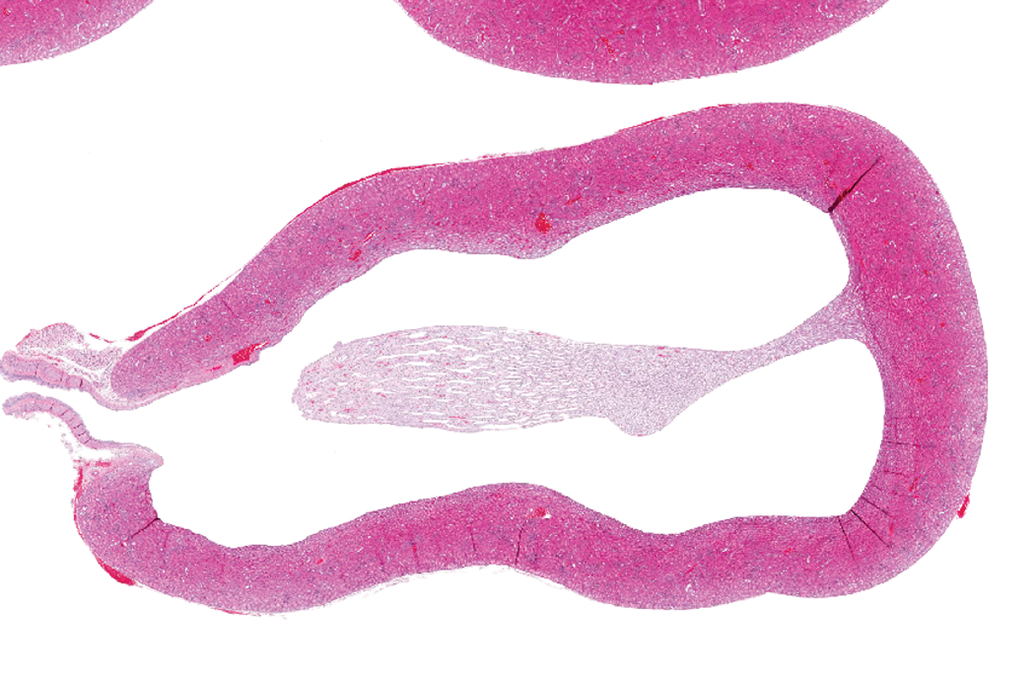
Kidney section from a rat at postnatal day 18. Hematoxylin and eosin stain, original objective ×4. Rats were given oral water twice daily from postnatal day 7 to 14. Note dilated renal pelvis (hydronephrosis).
Results
To investigate the cause of the unexpectedly high incidence of hydronephrosis, rat pups were dosed from 7 to 14 days with water (only) twice daily and necropsied a few days later, and then results were compared to pups that were not handled until necropsy on day 18. Hydronephrosis was noted in 7 of 20 pups that were manually restrained during days 7 to 14 versus in only 1 pup restrained solely on day 18. This result suggested to investigators that either gastric fluid overload from oral dosing caused the effect or, much more likely, the simple act of handling young rat pups for oral dosing may have induced hydronephrosis due to altered hydrodynamic pressures in the right kidney, which is located superficially, very close to the retroperitoneal wall and skin in rat pups of this age (7-21 days). This case is an example of a batch effect, as handling artifacts were dependent on how each group and individuals were manipulated rather than what drug or dose they were given.
Example 6
Early deaths on study, autolysis, and cataract diagnosis.
History
Rats in subchronic toxicity studies performed at a biopharmaceutical company had evidence of early cataract changes by microscopic evaluation, and investigators therefore considered the lens of the eye to be a potential target organ of this compound. The lesion was characterized by mild changes to the epithelial bow of the lens and small Morgagnian globule formation in a small percentage of animals. Based on the serious clinical indication for the test article (cancer), the high-dose selection for the chronic study was necessarily aggressive and resulted in a relatively large number of early decedents in mid- and high-dose animals relative to vehicle controls. Many of these decedents were found dead during morning inspections and had extensive autolysis in some organs. Based on the heightened awareness of lenticular changes, eyes were scrutinized in the carcinogenicity study. At the interim peer review histologic evaluations of early decedents (prior to main study termination), there was a much higher incidence and severity of lenticular lesions in mid- and high-dose rats than was expected by investigators and that was not supported by ophthalmologic examinations. Although there were also a few cases of lens changes noted in vehicle control animals that were found dead, interim results caused increased concern for clinical patients in trials of the test article, since the dose at which effects occurred was near clinical parity.
Results
Upon completion of the study and evaluation of all animals, including the rats that survived until terminal euthanasia, it was noted that the vast majority of the cases of histopathologic lens observations were in rats that were found dead. High-dose rats that were euthanized at study end had lenticular changes but of lower severity, incidence, and at doses similar to those noted previously. No euthanized vehicle control or low-dose rats had lens changes. Further, the severity of the lens changes seemed to correlate with the severity of autolysis in other organs, suggesting that the diagnoses in the lens were being complicated by artifactual postmortem autolytic changes that were mimicking lenticular toxic changes. In fact, lenticular changes were quite rare in test article–treated animals that survived to terminal necropsy and were limited to the highest dose group. In addition to timing between death and necropsy (>10 hours), upon further review it was discovered that the type of ocular fixative also appeared to be a factor in the postmortem deterioration of the lenses in the study, as eyes from early deaths were often temporarily immersed in a different fixative than those from rats that survived until study end. Thus, a batch effect occurred in preterminal dead rats resulting in a postmortem artifact initially being incorrectly identified as a treatment effect with the potential to impact the incidence and severity of the ocular finding in treated versus control groups.
Example 7
Prominent changes in prothrombin time (PT) due to change in reagent in a 1-month rat toxicity study
History
A biopharmaceutical company performed a 1-month daily oral gavage toxicity study using male and female Sprague Dawley rats in four treatment groups including vehicle control. Blood was collected for coagulation testing during week 1 and before terminal necropsy (week 4).
Results
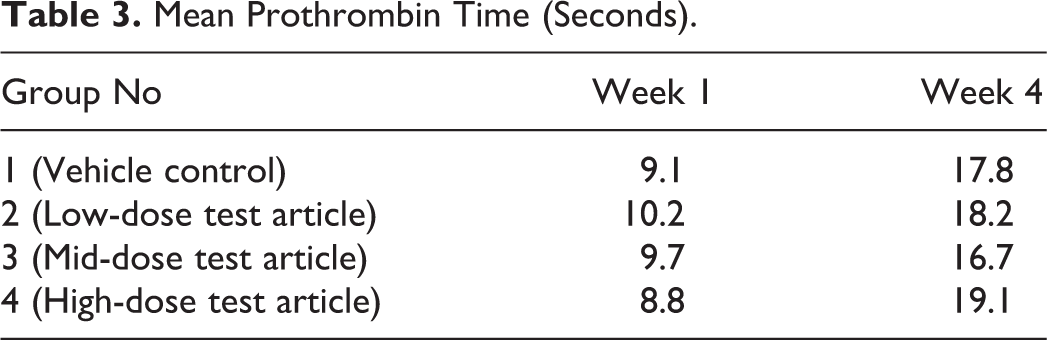
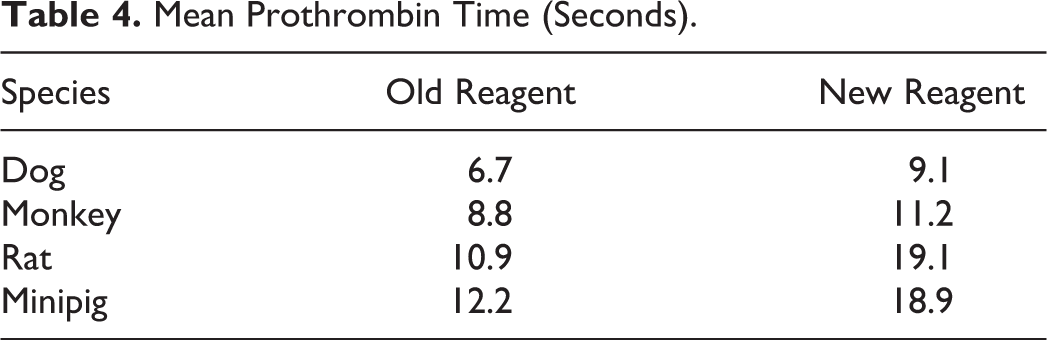
There were prominent differences in PT results between week 1 and week 4 in all the groups, including controls (Table 3). A review of the analytical methods used at both time points confirmed that sample collection and analysis were performed in a similar manner using the same method and instrument at both time points; however, one reagent used in the PT analysis had been substituted in between time points because the previous reagent in use had been discontinued by the vendor. The laboratory provided data from an in-house comparison testing the “new” versus “old” reagents. This in-house reagent comparison generated similar differences in PT as those observed in this rat study, and thus, the findings were attributed to a batch effect due to the change in reagent that occurred in week 4 of the study. As shown in Table 4, the impact of reagent change varied among species—rats and minipigs had more pronounced differences in PT compared to other species tested.
Mean Prothrombin Time (Seconds).
Mean Prothrombin Time (Seconds).
It should also be noted that unlike measuring concentration of an analyte (e.g., albumin) which will be expected to be more precise and accurate between laboratories, these kinetic assays are end results of a cascade event, so obtaining different results with different methods or reagent systems does not necessarily mean “false” results but instead may represent analytical differences between the instruments/reagent systems. Because of such variability in these kinetic assays, any reference ranges or data produced in one laboratory should not be compared to another laboratory or between different institutions (such as published reference ranges).
Example 8
Transcriptomic analysis of peripheral blood confounded by seasonal batch effects.
History
A biochemical company performed gene analysis on peripheral blood samples in order to assess the effect of a nutrition product. Blood was collected 28 days apart (in late winter and early spring) and stored at −80°C until processed. RNA was isolated by individual (i.e., the blood samples from each day of collection from an individual were processed and sequenced in the same lot but in different wells).
Results
Differential gene expression analysis showed that 174 immune system genes were differentially regulated in untreated individuals. Recognizing that batch effects can be very confounding, especially if treatment effects are small and batch effects significant, hypothesis-independent data exploration was used to detect batch effects. To do this, during initial analysis of gene expression, the data were filtered for variance in order to maximize projection score to determine what drives the separation in gene expression clusters. 31 The next step was to remove the variance filtering and perform a “two group test” to identify the variables that best explain the two groups. Looking at the filtered variable list and performing a literature search, the hypothesis was developed that the variables were largely associated with a shift in the seasons (winter into spring; Figure 4). 32 Awareness of, and correction for, the potentially seasonally-affected genes in the data set helped to offset the seasonal batch effect and reveal gene expression clustering related to treatment.
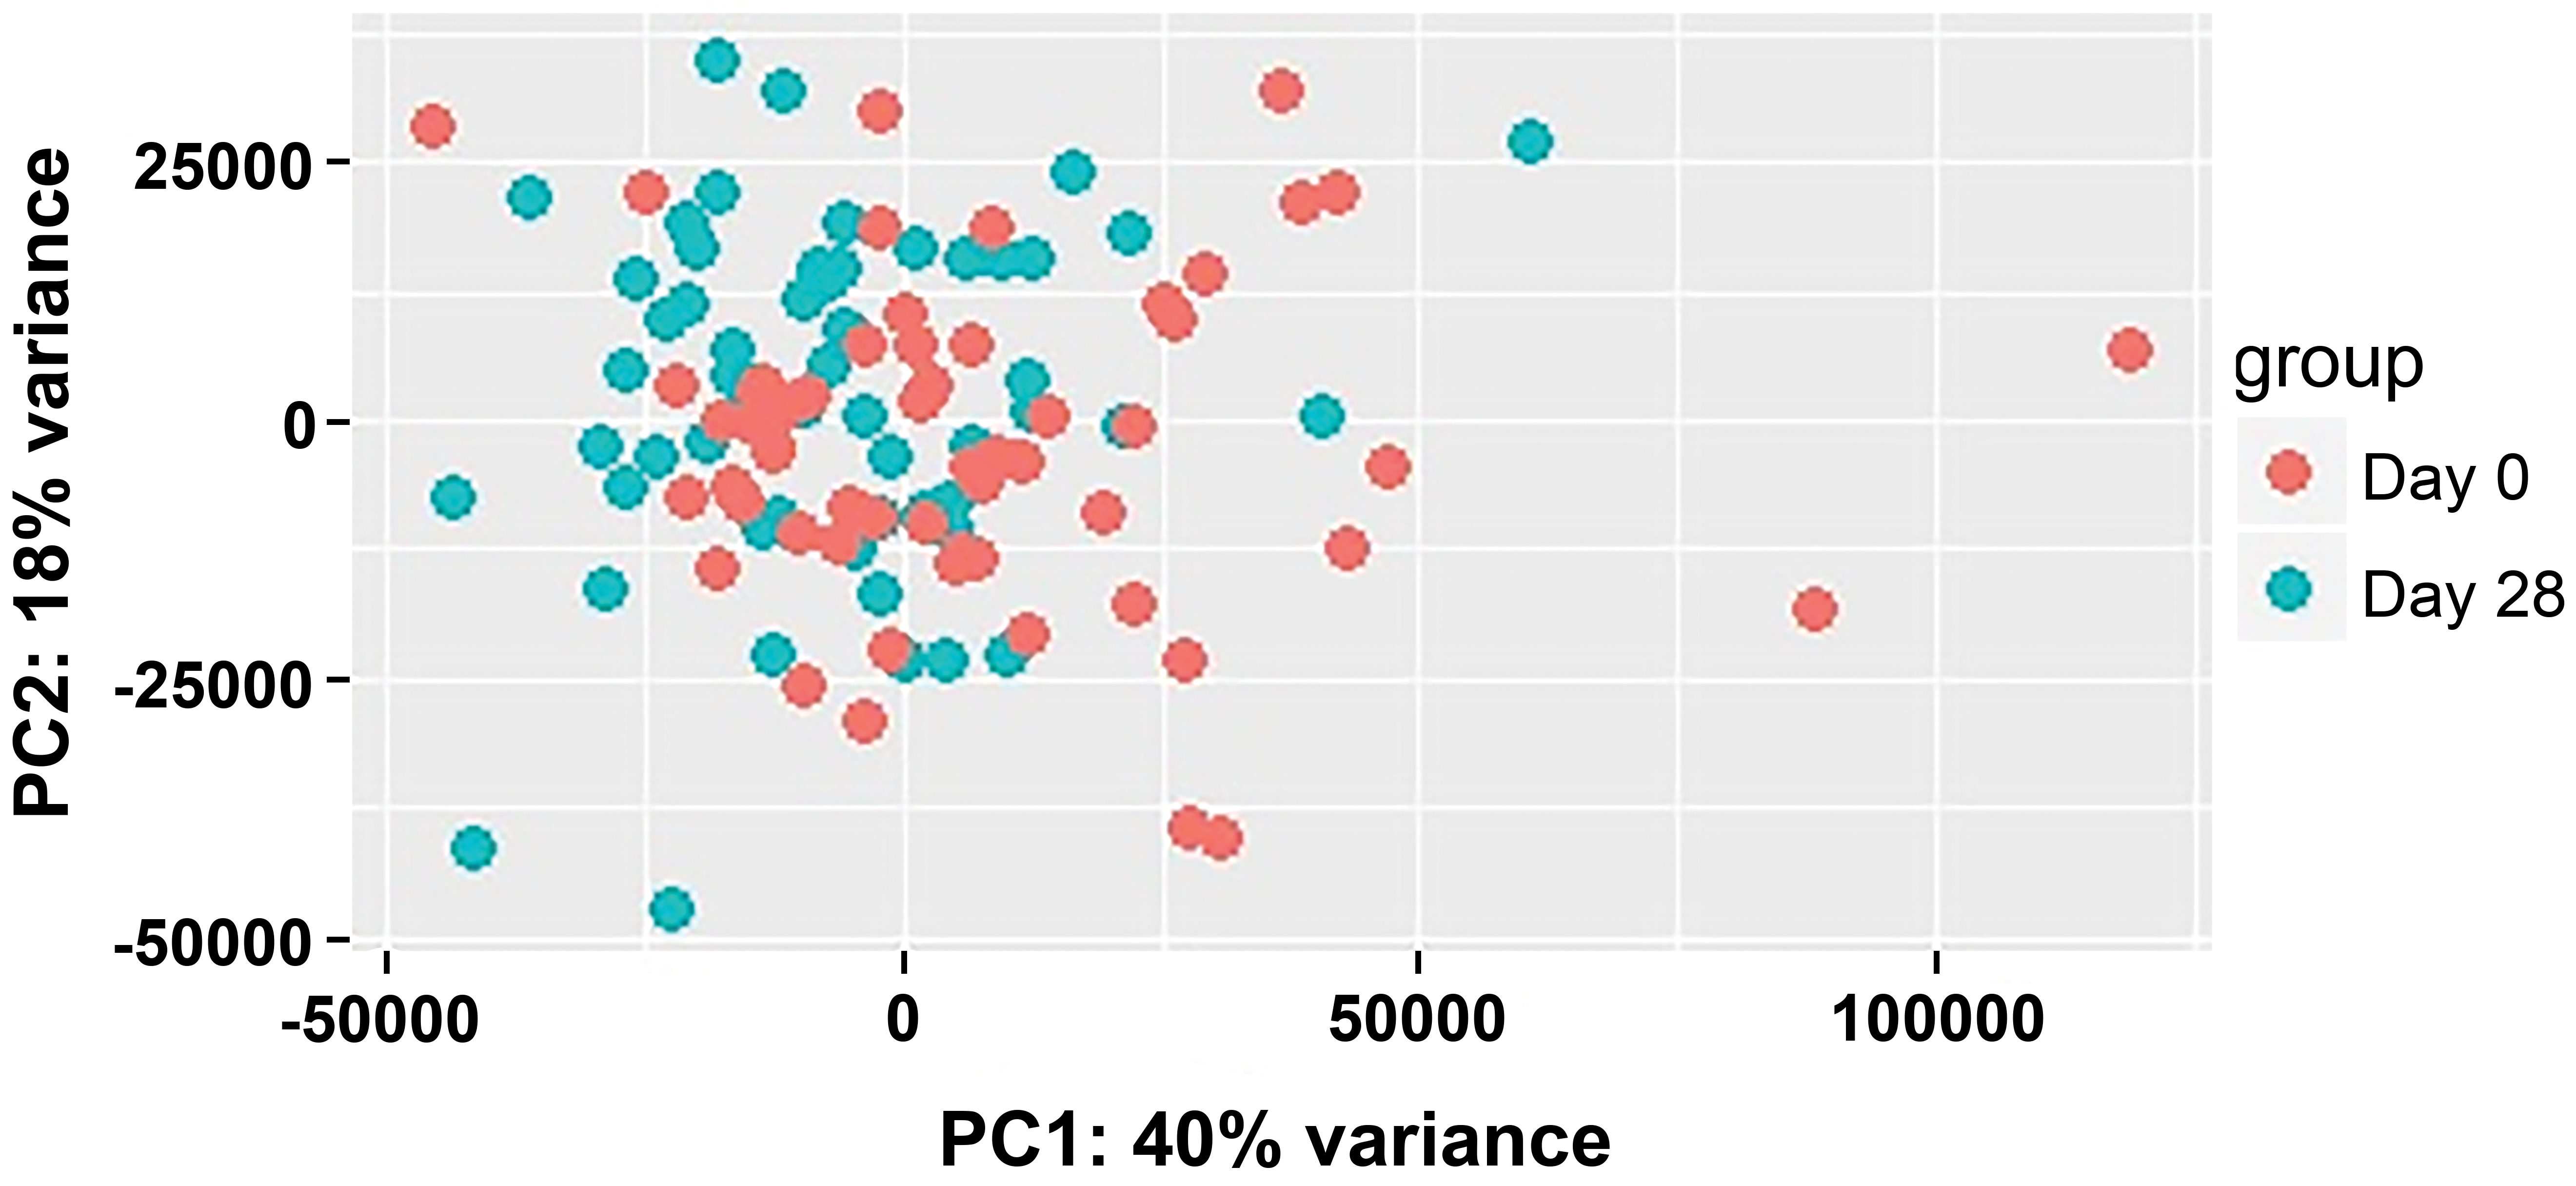
Principle Component Analysis (PCA) plot of gene expression of selected immune parameters in the peripheral blood of untreated control individuals from a longitudinal study. Data shown refer to blood samples drawn on March 11 and April 8. Patients were from the Mid-Atlantic region of the United States.
Scenarios and Examples of Nuisance Factors That Are Not Considered to Be True Block/Batch Effects
There are other common situations encountered in nonclinical safety assessment studies, where physiological or procedural phenomena specific to and unavoidable in the test system may have a pronounced effect on results and interpretation but do not fit into the Working Group’s definition for block/batch effects. These situations may arise from unintentional differences in mode of action, absorption, and/or distribution of a test article due to sex differences, food effects, differences in vehicle or route of administration, and other factors leading to pharmacokinetic or pharmacodynamic variability and perceived differences among groups. Although such effects do cause unintended bias and can produce or amplify apparent test article effects in common with block/batch effects, the toxic or physiologic changes that result are still inherently tied to the biologic and chemical properties of the test article itself.
Sex-Related
Sex differences in toxicity may be related to significant differences in systemic concentrations between males and females given the same dose of test article. This occurs relatively commonly and may be due to specific differences between sexes in cytochrome P450s involved in test article or chemical metabolism, sex-related differences in transporter expression that result in differences in organ uptake, or secondary effects of sex hormones that may act as cofactors in test article regulation, sequestration, or cellular uptake. This can result in marked differences in plasma drug concentrations and increased toxicologic potential.
Food–Drug Interactions
Food effects, or more accurately termed food–drug interactions, are changes in the pharmacokinetic or pharmacodynamic action of a test article resulting from food ingestion. These types of phenomena share many features with block/batch effects in that differences in feeding paradigms among dose groups can introduce unwanted variables into studies, thereby affecting toxicologic outcomes. Food effects are noted relatively commonly, and most cases relate to food-induced changes in test article bioavailability. 33 The timing of food delivery can drastically alter the gastric or intestinal absorption of a test article or chemical agent that is given orally. In some instances, the presence of food can slow or inhibit absorption of the test article or chemical agent across the gastrointestinal interface. Conversely, induction of gastric acid secretion from food ingestion may speed the solubilization and absorption of an agent by lowering pH of the local milieu and hence altering the pharmacokinetic profile. 34 Diet may also alter phase II enzymes and transporters and particularly CYP3A4 and P-glycoprotein function, affecting metabolism and clearance of the agent. 35
Procedural Effects
Feeding Regimens
In addition to the pharmacological characteristics of the test article and the physiologic response of the animals, procedural processes increase the risk of occurrence of food interactions. This could manifest as enhanced pharmacology or toxicity in one group relative to another, irrespective of original dose of the test article. This is usually detected by noting unusual or unexpected differences in exposure and can be prevented by standardizing feeding regimen and timing, or alternatively by randomization practices. The following example illustrates some of these considerations.
A small molecule was given orally to cynomolgus monkeys in a 4-week toxicology study performed at a CRO where monkeys were fed twice daily. There were no reported issues with test article tolerability. Conversely, during a follow-up 3-month study that was performed at a different CRO, there were tolerability issues, notably significant weight loss among treatment groups. The study team investigated possible causes for this cross-study discrepancy and learned that in the second study, the monkeys were fed only once daily. Although the caloric content of the diet was similar between the two CROs, the timing of the once-daily feeding coincided with the Tmax (timing of maximum test article concentration or Cmax) of test article being tested, which resulted in decreased appetite of the animals at higher doses when food was available. Although there was no significant difference in test article concentration between groups as a result of a food–drug interaction, there was a pronounced effect on total daily food intake between controls and those treated monkeys. This example would not fit into the classic definition of food–drug interactions, as the presence or absence of food has no effect on the absorption or pharmacokinetics/dynamics of the test article. Rather, the effect on study parameters (i.e., decreased body weight due to reduced food intake) is related to exposure to the test article. However, by standardizing feeding regimens between studies and groups, carefully assessing the potential timing of feeding in relationship to dosing, and preventing bias by eliminating unnecessary variables, unexpected study results such as these can and should be prevented.
Study Conduct
Procedural differences in study conduct that affect all groups equally may result in variance in pathology data that can be confused with block/batch effects. However, this situation would not strictly fit the definition of block/batch effect, since the resultant alterations in test parameters do not affect individual treatment groups but rather are recognized as affecting the validity of the study as a whole. The following examples illustrate this situation.
Example 1
A 7-day non-Good Laboratory Practice toxicology study testing a small-molecule candidate was conducted by a CRO using Beagle dogs. A previous study in Beagle dogs evaluating the same test article identified the spleen as a target organ for lymphoid depletion (Table 5). In the second study, marked congestion was observed on microscopic review of splenic tissue collected from control and treated animals, rendering assessment of test article–related histopathology in this target organ on this study unreliable (Table 6). A detailed review of all medications and treatments identified that all of the Beagle dogs were given acepromazine as a sedative agent prior to euthanasia in one but not both studies, complicating splenic evaluation between the studies. Acepromazine, a phenothiazine derivative with tranquilizing properties, has been implicated in causing splenic congestion. 36 Thus, unexpected effects observed with the same compound in different studies arose from procedural differences.
Pathology—Intergroup Comparison on Histopathology Observations (Previous Study).
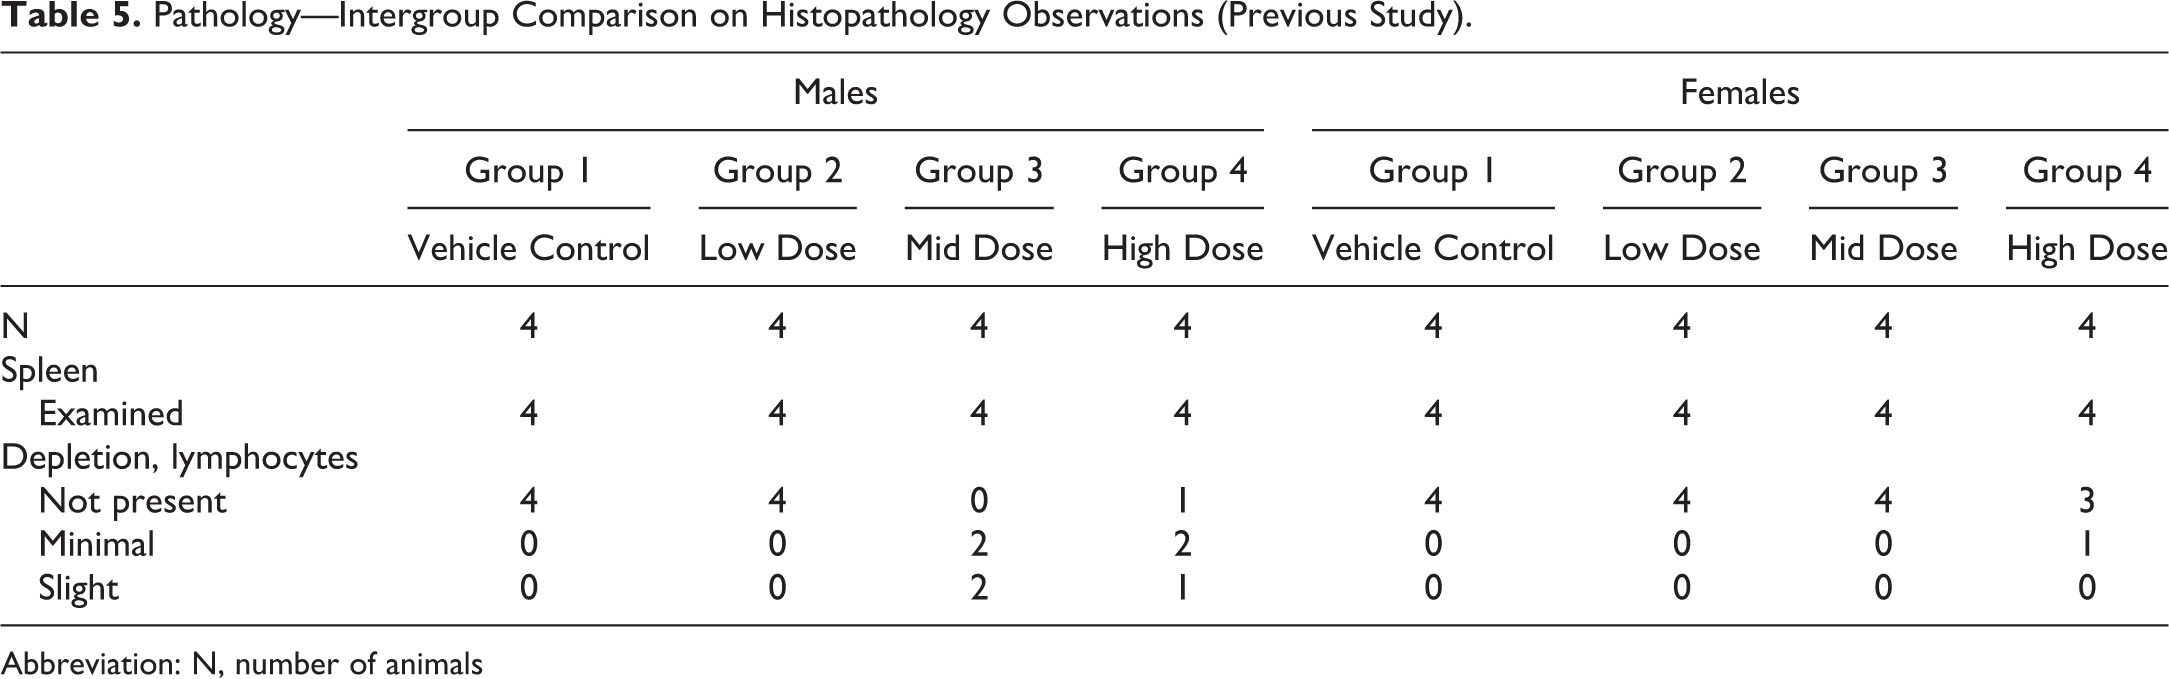
Abbreviation: N, number of animals
Pathology—Intergroup Comparison on Histopathology Observations (Day 8).
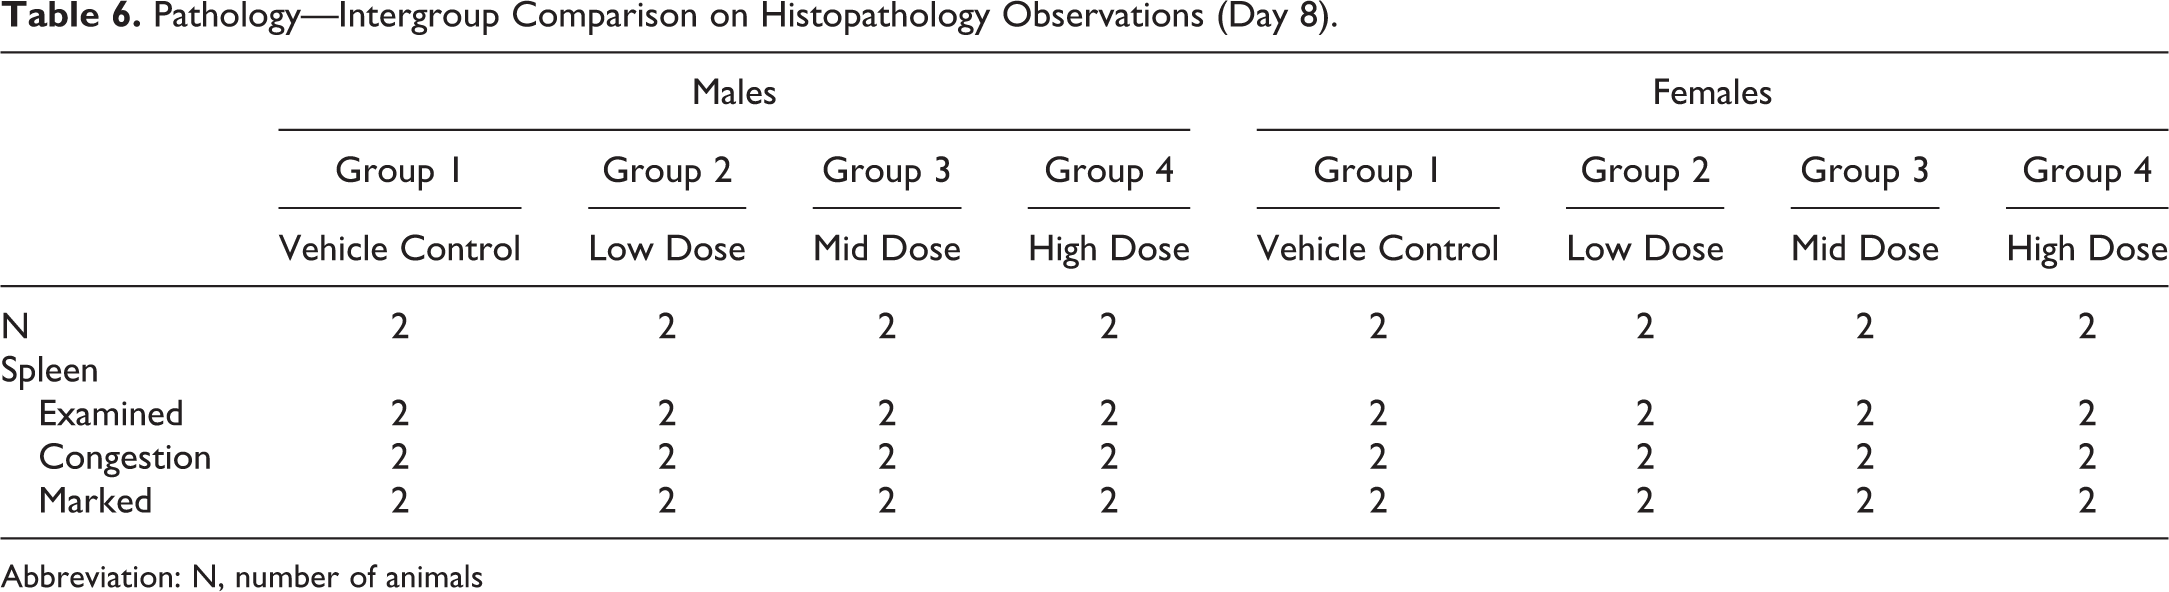
Abbreviation: N, number of animals
Example 2
An intravenous glucose tolerance test (IVGTT) was conducted at a CRO using male Sprague Dawley rats. Blood glucose values were markedly increased in both vehicle control- and test article–treated animals (Table 7). Upon review, it was discovered that the tail vein was inadvertently utilized for both the injection of dextrose solution for the IVGTT and the collection of blood samples for glucose concentration determinations. As a result, blood glucose concentrations were falsely increased, and this confounded assessment of test article–related effects on glucose regulation. Although these artifactually increased glucose concentrations prohibited accurate interpretation of glucose values in the IVGTT, a true block/batch effect as defined by our working group did not occur, as procedural effects encompassed all groups equally.
Rat IVGTT Blood Glucose Values (mg/dL): Cohort A: Day 4 Postdose.a
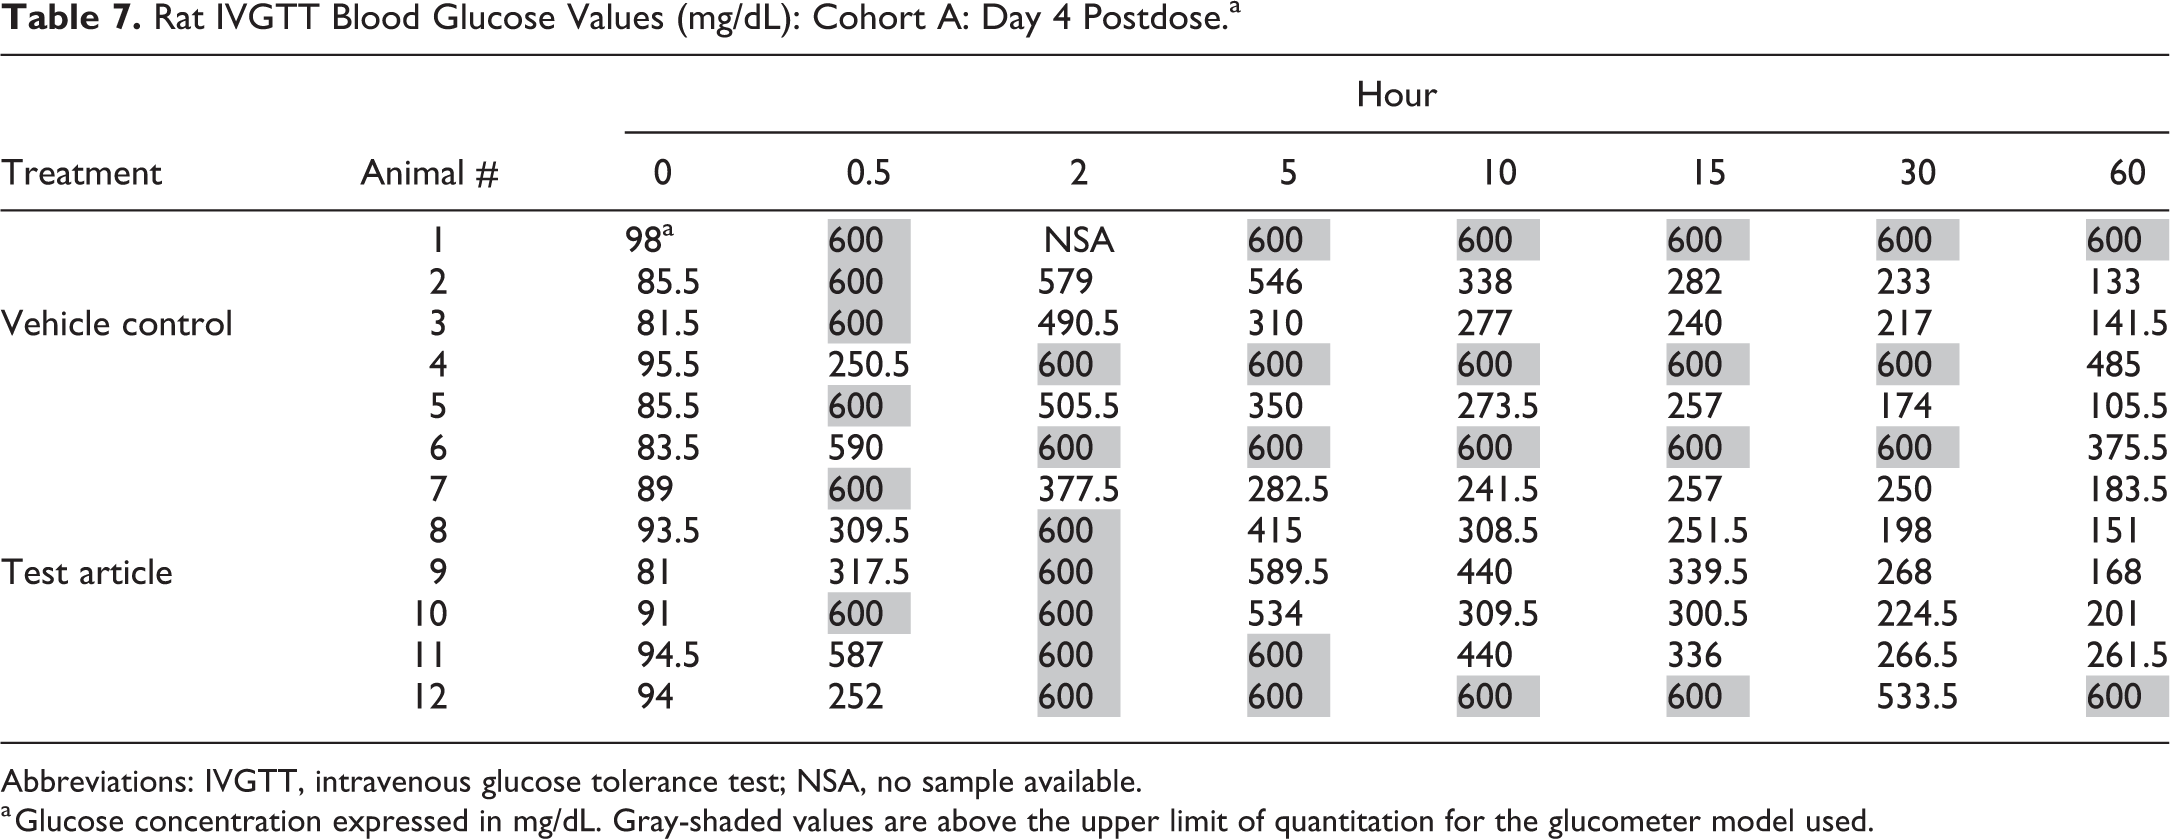
Abbreviations: IVGTT, intravenous glucose tolerance test; NSA, no sample available.
a Glucose concentration expressed in mg/dL. Gray-shaded values are above the upper limit of quantitation for the glucometer model used.
Data Analysis
“Blocking” is a technique used by statisticians to group certain data points within a study and perform statistical analysis to determine the importance of variation caused by block/batch effects. During statistical analysis, intentional blocking of the data provides a mechanism for explaining and controlling variation among the experimental units due to nuisance factors. 37,38 Sometimes, suspected block/batch effects turn out, upon statistical analysis, to be inconsequential (i.e., non-significant). In that situation, statistical testing can be re-done without the “block factor,” thus yielding more power to test the main hypothesis. Readers are encouraged to consult with study statisticians and additional references for a more detailed discussion regarding the statistical use of “blocking.” 39 -41
Points to Consider
Key discussion points relating to nuisance factors and block/batch effect are summarized below.
The term nuisance factor may not be familiar to many readers of Toxicologic Pathology. However, a review of the literature by members of this working group found that nuisance factors occur in many different aspects of experimental science including through assay-specific effects, 42 with certain populations and cell lines, 43 age, 44 performance variability, 45 epistasis (locus interactions), 46 technical bias, 47 and placebo effect. 48
Examples of nuisance factors that may lead to block/batch effects resulting in pathology data that are difficult to interpret and that may occur in nonclinical studies are presented in Table 8.
When nuisance factors can be predicted and/or identified a priori, they can be prevented or accounted for in the study design.
Utilize study design aids to minimize the occurrence of nuisance factors (see “Experimental Design Assistant ), “Independent and Nuisance Variables” at the NC3Rs. 11
If the nuisance factors are unknown and uncontrollable:
Engage the assistance of statisticians experienced in design of safety assessment studies during protocol development.
Randomization should be utilized to spread the probability of any unknown bias equally across all groups within the study. More detailed plans for randomization may be necessary to address certain types of nuisance factors (see, as an example, Supplemental Methods to Reduce Immunohistochemical/Immunofluorescent Autostainer Block Effects).
Replication is another potential approach to deal with uncontrollable nuisance factors, whereby the number of animals studied is increased; however, this decision needs to be adequately justified based on the degree of precision required within a given study and in light of 3Rs-related considerations. 10,11,49
Occasionally, factors deemed as nuisance factors in early investigations may become more relevant to investigators as data accumulate and later become specific targets of focused investigations as has been the case with the placebo effect and age. 48,50,51
Block statistical designs may help maintain internal validity of a study, by reducing the possibility that the observed effects are due to a confounding nuisance factor. 52
Examples of Nuisance Factors That May Occur in Nonclinical Safety Assessment Studies.
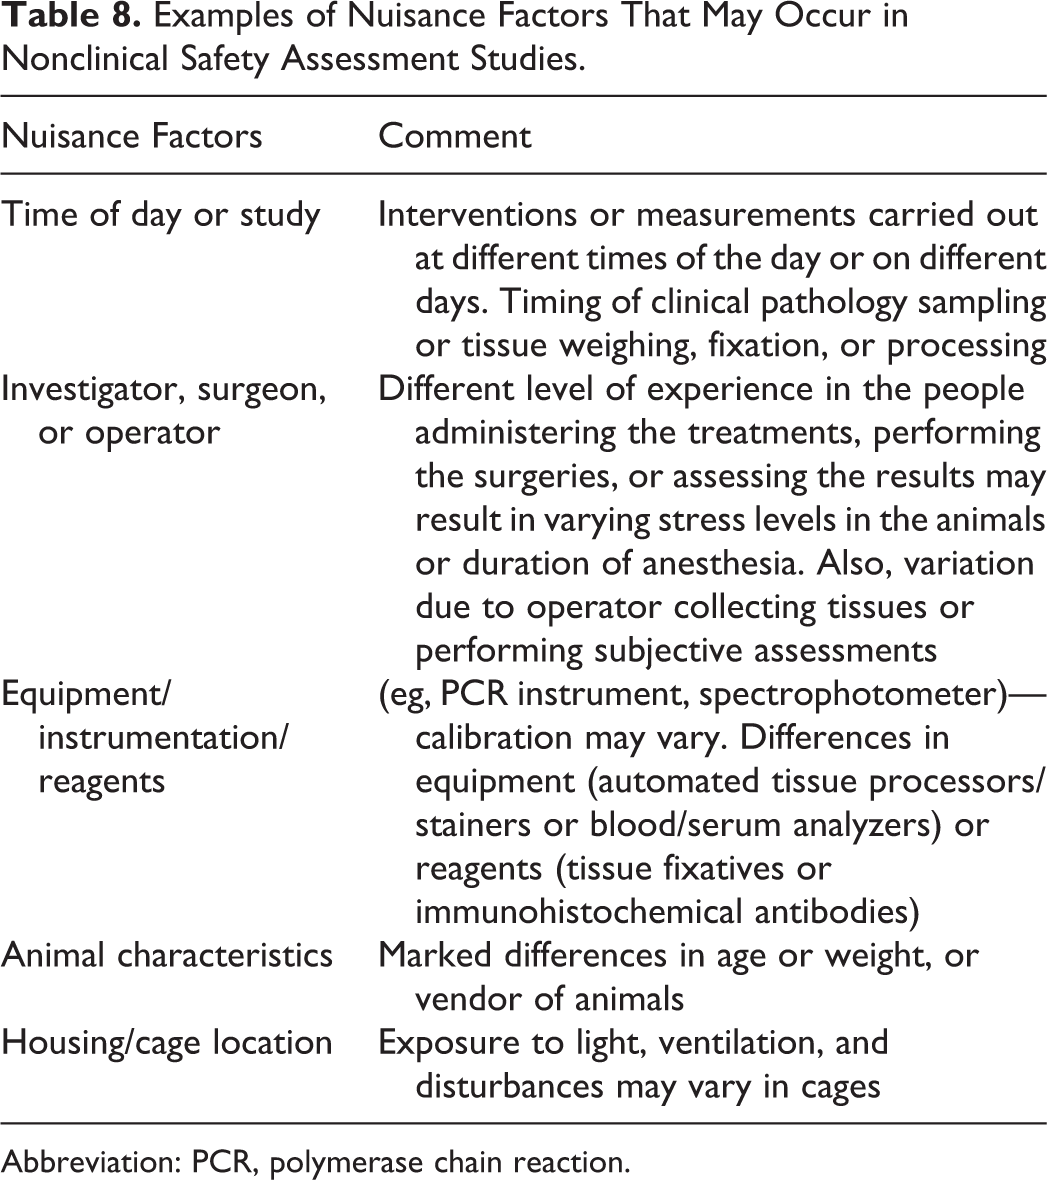
Abbreviation: PCR, polymerase chain reaction.
Summary/Conclusions
Nuisance factors and block/batch effects can occur in nonclinical safety assessment studies. When they occur, interpretation of pathology data for true test article–related effects may be difficult. It is imperative that investigators recognize these confounders and deal with them effectively to minimize bias within current studies, minimize the occurrence or effects of these alterations in future studies, and interpret experimental data correctly.
The best approach to mitigating nuisance factors such as block/batch effects is careful study design, when necessary with the assistance of a statistician who is familiar with safety assessment studies and their objectives. Adequate randomization incorporated into the study, careful consideration of whether improved precision of measurement and/or if repeated measurement of specific parameters is warranted, and statistical blocking are methods to deal with these factors when they occur.
Supplemental Material
Supplemental Material, sj-docx-1-tpx-10.1177_0192623320906385 - Scientific Regulatory Policy Committee Points to Consider*: Nuisance Factors, Block Effects, and Batch Effects in Nonclinical Safety Assessment Studies
Supplemental Material, sj-docx-1-tpx-10.1177_0192623320906385 for Scientific Regulatory Policy Committee Points to Consider*: Nuisance Factors, Block Effects, and Batch Effects in Nonclinical Safety Assessment Studies by Albert Eric Schultze, Bindu Bennet, Jessica Caverly Rae, Alan Y. Chiang, Kendall Frazier, Paula Katavolos, LuAnn McKinney, Daniel J. Patrick and Niraj Tripathi in Toxicologic Pathology
Footnotes
Acknowledgments
The authors wish to recognize the expertise of Michael Pritt, Keith Goldstein, and Frank Burns in figure creation for this article.
Declaration of Conflicting Interests
The author(s) declared no potential conflicts of interest with respect to the research, authorship, and/or publication of this article.
Funding
The author(s) received no financial support for the research, authorship, and/or publication of this article.
Supplemental Material
Supplemental material for this article is available online.
References
Supplementary Material
Please find the following supplemental material available below.
For Open Access articles published under a Creative Commons License, all supplemental material carries the same license as the article it is associated with.
For non-Open Access articles published, all supplemental material carries a non-exclusive license, and permission requests for re-use of supplemental material or any part of supplemental material shall be sent directly to the copyright owner as specified in the copyright notice associated with the article.