
Abstract
We evaluated the growth plates (GPs) of rats after a 14-day reduction in food consumption caused by either daily oral dosing with 5-fluorouracil (5-FU: a positive control reducing food consumption and affecting the GPs) or a direct reduction in food consumption to determine whether the observed changes were attributable to a direct effect of drug toxicity. Histomorphometric analyses of the femoral GP were performed for a nontreated (NT) control group, three groups treated with 5-FU (12, 15, and 18 mg/kg/day) and three groups with food intake restricted to levels corresponding to those consumed by the rats in the three 5-FU-treated groups. Compared with the NT group, the GP widths and the number of chondrocytes in the proliferative zone decreased significantly in all the 5-FU-treated groups and the dietary restriction groups. Importantly, no significant differences between the 5-FU-treated groups and the groups with matched dietary restrictions were seen for most parameters. Thus, the 14-day dietary restriction caused significant changes in the proliferative zone of the GP, and similar changes observed in the 5-FU-treated groups were presumed to result from the comparable reduction in food intake rather than being a direct toxic effect of the drug.
Keywords
Moderate to severe body weight loss and decreased food consumption are often observed in drug toxicity studies, particularly at doses close to the maximum tolerated dose. Distinguishing between body weight loss caused by direct drug effects and secondary changes related to significant reductions in food consumption is important but sometimes difficult. Not only body weight loss but also decreased food consumption are known indicators of general systemic toxicity in subacute and subchronic toxicity studies (Wallig and Keenan 2013), and many studies have demonstrated the influence of decreased food consumption caused by 14-day dietary restrictions on laboratory data, including hematology, blood cell morphology, and serum biochemistry parameters (Asanuma et al. 2009; Levin, Semler, and Ruben 1993; Miyata et al. 2009; Moriyama et al. 2008). However, evaluations of growth plate (GP) parameters, notably their measurements, are rare. In addition, 14-day toxicity studies are frequently performed to identify short-term drug toxicity, typically in 6- to 8-week-old rats (pubescent to young adult rats) in which the GPs continue to be active in growing long bones (Fukuda and Matsuoka 1979).
When performing 14-day toxicity studies in young rats, decreased longitudinal bone growth in these rapidly growing young animals is a common finding that could be secondary to either decreased food intake or a direct toxic effect of the test drug or the combination of the above (Gunson, Gropp, and Varela 2013). This is because the GPs of such young rats are known to respond sensitively to drugs that affect bone growth (Gunson, Gropp, and Varela 2013). GPs are known to play an important role in endochondral bone growth and are affected by a variety of hormones and dietary factors (Gunson, Gropp, and Varela 2013; Leininger and Riley 1990; Young and Heath 2000). Indeed, identifying the cause of changes in toxicity studies can be difficult since GPs can be affected by secondary drug-related changes, such as decreased body weight or decreased food consumption, as well as direct toxic effects of the test drug (Gunson, Gropp, and Varela 2013). The qualitative detection of GP changes using routine histopathological analysis is also reportedly difficult (Fossey et al. 2016).
Histopathological examinations have been conducted on many organs, including bone and/or bone marrow, to demonstrate the influence of decreased food consumption (Levin, Semler, and Ruben 1993; Moriyama et al. 2008). However, 14-day dietary restriction studies thus far have used only routine histopathological analyses, and only a few histomorphometric examinations for heart and skeletal muscle have been reported (Burkhardt et al. 1996; Kemi et al. 2000; Molon-Noblot et al. 2005), with no reports on bone tissue published to date. Histomorphometry is a useful technique that provides good detail, and many studies have used this method to reveal the effects of decreased food consumption and fasting on GPs (Even-Zohar et al. 2008; Farnum et al. 2003; Heinrichs et al. 1997; van Leeuwen et al. 2003). To date, however, the results obtained from these studies have been inconsistent with 14-day toxicity studies, probably because of differences in animal age, study duration, and observation site.
In this study, we evaluated the femoral GP in a 14-day toxicity study to determine whether the effects observed on the GPs of young rats were attributable to a direct effect of 5-fluorouracil (5-FU), a secondary drug effect caused by decreased food consumption, or a combination of the above. This primary study analyzed the GP of the proximal femur, which was used in a previously reported study examining the effects of 5-FU treatment on bone marrow (Miyata et al. 2009). 5-FU was used as a positive control drug because it causes myelotoxicity and decreased food consumption (Miyata et al. 2009) and is known to affect GPs (Xian et al. 2004). We show that 5-FU effects on femoral GPs are not distinguishable from those induced by quantity-matched dietary restrictions without 5-FU and therefore direct 5-FU toxicity on GP is not confirmed, when administered daily at oral dose levels of 12, 15, and 18 mg/kg/day. This is in contrast with data obtained with a single intraperitoneal injection of 150 mg/kg, in which decreased GP thickness occurred, with complete recovery, but without accompanying decreased food consumption (Xian et al. 2006). In this study, histopathological, histomorphometric, and immunohistochemical analyses were performed on the proximal femurs of nontreated control (NT) rats, rats treated with 5-FU, and rats subject to dietary restriction; the same sections from animals used in our previous study (Miyata et al. 2009) were used in the present study.
Materials and Methods
Sources of Materials
Hematoxylin and eosin (HE)-stained sections and formalin-fixed paraffin-embedded tissue sections from the proximal end of the femur were obtained from a previously reported study (Miyata et al. 2009). In our previously reported myelotoxicity study (Miyata et al. 2009), the proximal femur was selected and examined because this site was recommended for histologic evaluation of bone marrow cellularity in rat (Cline and Maronpot 1985). Briefly, we purchased 84 six-week-old male Crl: CD Sprague-Dawley rats from Charles River Japan Inc. (Tsukuba, Ibaraki, Japan) and divided them into the following seven groups (n = 12 per group): an NT group, three 5-FU-treated groups (FU12, FU15, and FU18), and three dietary restriction groups (R12, R15, and R18). Animals in the FU12, FU15, and FU18 groups were treated orally once a day with 5-FU for 14 days (Wako Pure Chemical Industries Ltd., Osaka, Japan) at doses of 12, 15, and 18 mg/kg/day, respectively. The 14-day drug administration period was followed by a 7-day recovery period (n = 6 per phase group) to examine the reversibility of the changes. Animals in the NT, FU12, FU15, and FU18 groups had free access to a standard laboratory animal diet. Animals in the R12, R15, and R18 groups were not treated with 5-FU but were instead fed a restricted amount of food corresponding to amounts consumed by the rats in the FU12, FU15, and FU18 groups, respectively. The start date for the dietary restriction groups (R12, R15, and R18) was the day following the initial administration day in the 5-FU-treated groups (FU12, FU15, and FU18). Food consumption in these groups, compared with the NT group, is summarized in Table 1. The animals were euthanized and necropsied at 8 to 9 weeks of age at the end of the administration period and 9 to 10 weeks of age at the end of the recovery period. All the animals were treated in accordance with the recommendations of the Guide for the Care and Use of Laboratory Animals of Taisho Pharmaceutical Co., Ltd.
The Percentage Reduction in Food Intake.
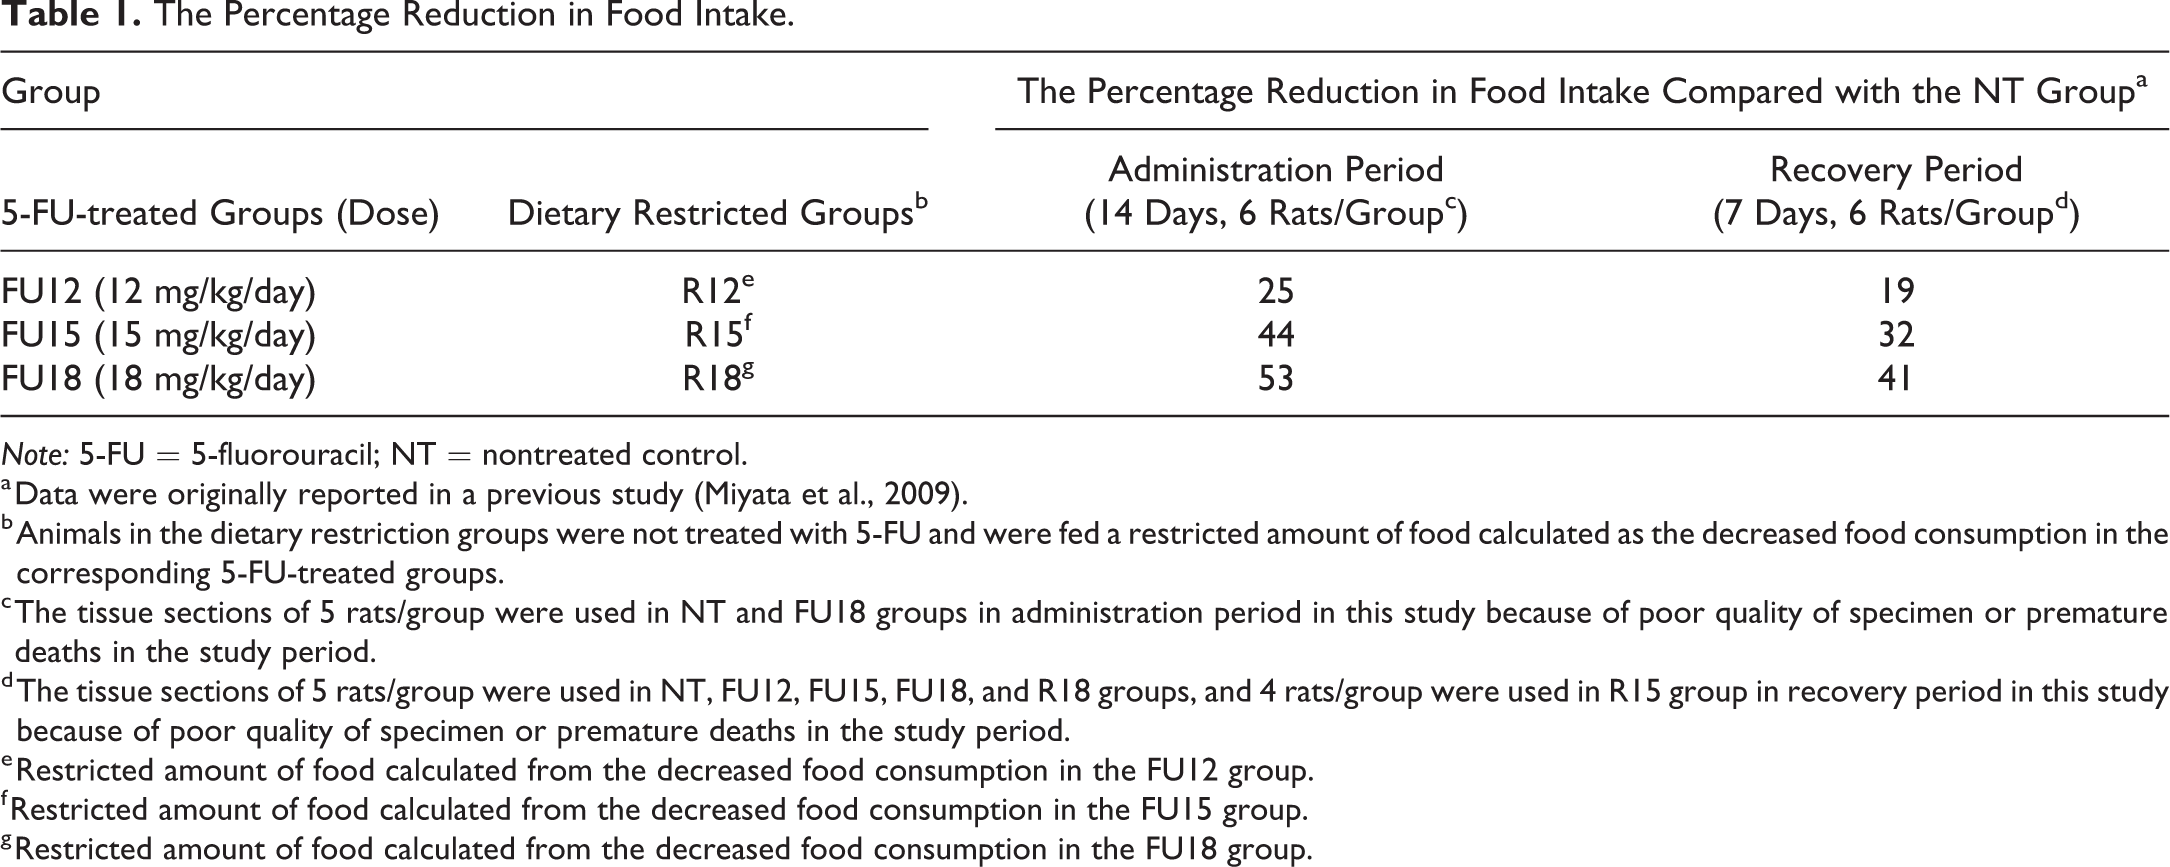
Note: 5-FU = 5-fluorouracil; NT = nontreated control.
a Data were originally reported in a previous study (Miyata et al., 2009).
b Animals in the dietary restriction groups were not treated with 5-FU and were fed a restricted amount of food calculated as the decreased food consumption in the corresponding 5-FU-treated groups.
c The tissue sections of 5 rats/group were used in NT and FU18 groups in administration period in this study because of poor quality of specimen or premature deaths in the study period.
d The tissue sections of 5 rats/group were used in NT, FU12, FU15, FU18, and R18 groups, and 4 rats/group were used in R15 group in recovery period in this study because of poor quality of specimen or premature deaths in the study period.
e Restricted amount of food calculated from the decreased food consumption in the FU12 group.
f Restricted amount of food calculated from the decreased food consumption in the FU15 group.
g Restricted amount of food calculated from the decreased food consumption in the FU18 group.
Histopathology, Histomorphometry, and Immunohistochemistry
The HE-stained sections of the proximal end of the femur were evaluated by histopathology and histomorphometry. The histomorphometric analyses consisted of measuring the widths of the GPs and the number of chondrocytes per GP column in the proliferative and hypertrophic zones of each GP. A ScanScope® XT was used with ImageScope™ software (Leica Byosystems, Heidelberg, Germany). The widths of the GP were obtained from three different areas in the central region of the GP, and a mean widths was calculated per rat. The number of chondrocytes per column in the GP was counted from three different columns in the central region of the GP, and a mean of the number of chondrocytes was calculated per rat. To evaluate the cartilage extracellular matrix, paraffin-embedded tissue sections were stained with safranin O-fast green, which detects sulfated glycosaminoglycan (GAG; Yoshida et al. 2014; Hoemann et al. 2012). For the quantitative analysis of cellular proliferation, paraffin-embedded tissue sections were assessed using immunohistochemical staining for proliferating cell nuclear antigen (PCNA) as follows. After the deparaffinization of the tissue sections, heat-induced epitope retrieval was performed in 10 mM citrate buffer (pH6.0; 00-5000; Invitrogen, Frederick, MD) for 40 min. The specimens were then reacted with the primary antibody (monoclonal mouse anti-rat PCNA antibody, M0879, 2.625 μg/ml; Dako Japan, Tokyo, Japan) overnight at 4°C. Then, the secondary antibody, biotin-conjugated horse anti-mouse IgG (BA-2001, 5 μg/ml; Vector Laboratories, Burlingame, CA), was applied for 1 hr at room temperature. The slides were exposed to 0.3% H2O2 for 30 min to quench endogenous peroxidase. The sections were then incubated using the ABC method (PK 6100; Vector Laboratories). Positive reactions resulted in brown nuclear staining with 3,3'-Diaminobenzidine (DAB)-buffer tablets (102924; Merck, Kumamoto, Japan). In the proliferative zone of the GP, the number of PCNA-positive cells and the total numbers of chondrocytes were counted in all the fields and were used to calculate the PCNA-positive cells in the proliferative zone (%).
Statistical Analysis
The mean value and the standard deviation of the numerical data obtained in the histomorphometric analysis were calculated for each group. Data were analyzed for statistically significant differences by performing a multiple comparison test of the data obtained in the FU12, FU15, FU18, and NT groups and of the data obtained in the R12, R15, R18, and NT groups. The homogeneity of variance among the groups was first analyzed by performing the Bartlett test (p < .05) and then by a one-way analysis of variance, if the variance was homogeneous. Whenever a significant difference was found among the groups, the Dunnett’s test (parametric) was performed to test the difference between the mean values of the groups for statistical significance. When the variance was heterogeneous, the Kruskal–Wallis H-test (p < .05) was performed, and if a significant difference was found between the groups, the Steel’s test was performed to test the difference between the mean values of the groups. Differences between the FU12 group and R12 group, between the FU15 group and R15 group, and between the FU18 group and R18 group were analyzed for statistical significance. The homogeneity of the variance among the groups was first tested by the F test (p < .05) and then the Student’s t test (if homogenous) or Aspin–Welch’s t test (if heterogeneous) was performed. We used the EXSUS Version 7.7.1 Statistical Analysis System (CAC Croit Corporation, Tokyo, Japan), which is based on the SAS software program (version 9.2; SAS Institute Inc., Cary, NC), to perform all the statistical analyses.
Results
Histopathology
The histopathological features of proximal femurs stained with HE and safranin O-fast green in the NT group, the 5-FU-treated groups (FU12, FU15, and FU18), and the dietary restriction groups (R12, R15, and R18) are shown in Figure 1. No obvious differences were detected among the NT group, the 5-FU-treated groups, or the dietary restriction groups by routine histopathological analysis using HE staining of the proximal femurs in the administration and recovery periods (Figure 1A–C). Although a tendency toward a thinning of the femoral GP was seen in the 5-FU-treated groups and the dietary restriction groups, a histopathological diagnosis of “thinning” or “atrophy” was difficult because the degree of change was within the tolerable range for age-matched historical controls. No remarkable findings such as single-cell necrosis (pyknotic nuclei) were observed in the chondrocytes of the GP, osteoblasts, or osteoclasts or in the metaphyses among the NT group, the 5-FU-treated groups, or the dietary restriction groups. When the cartilage extracellular matrix was evaluated using safranin O-fast green staining, no remarkable findings in the GP were observed among the NT group, the 5-FU-treated groups, or the dietary restriction groups, though decreased stainability with safranin O was observed from the mineralizing zone to the metaphyses (the center of the primary spongiosa) in two-fifths of the animals in the FU18 group (Figure 1D–F).
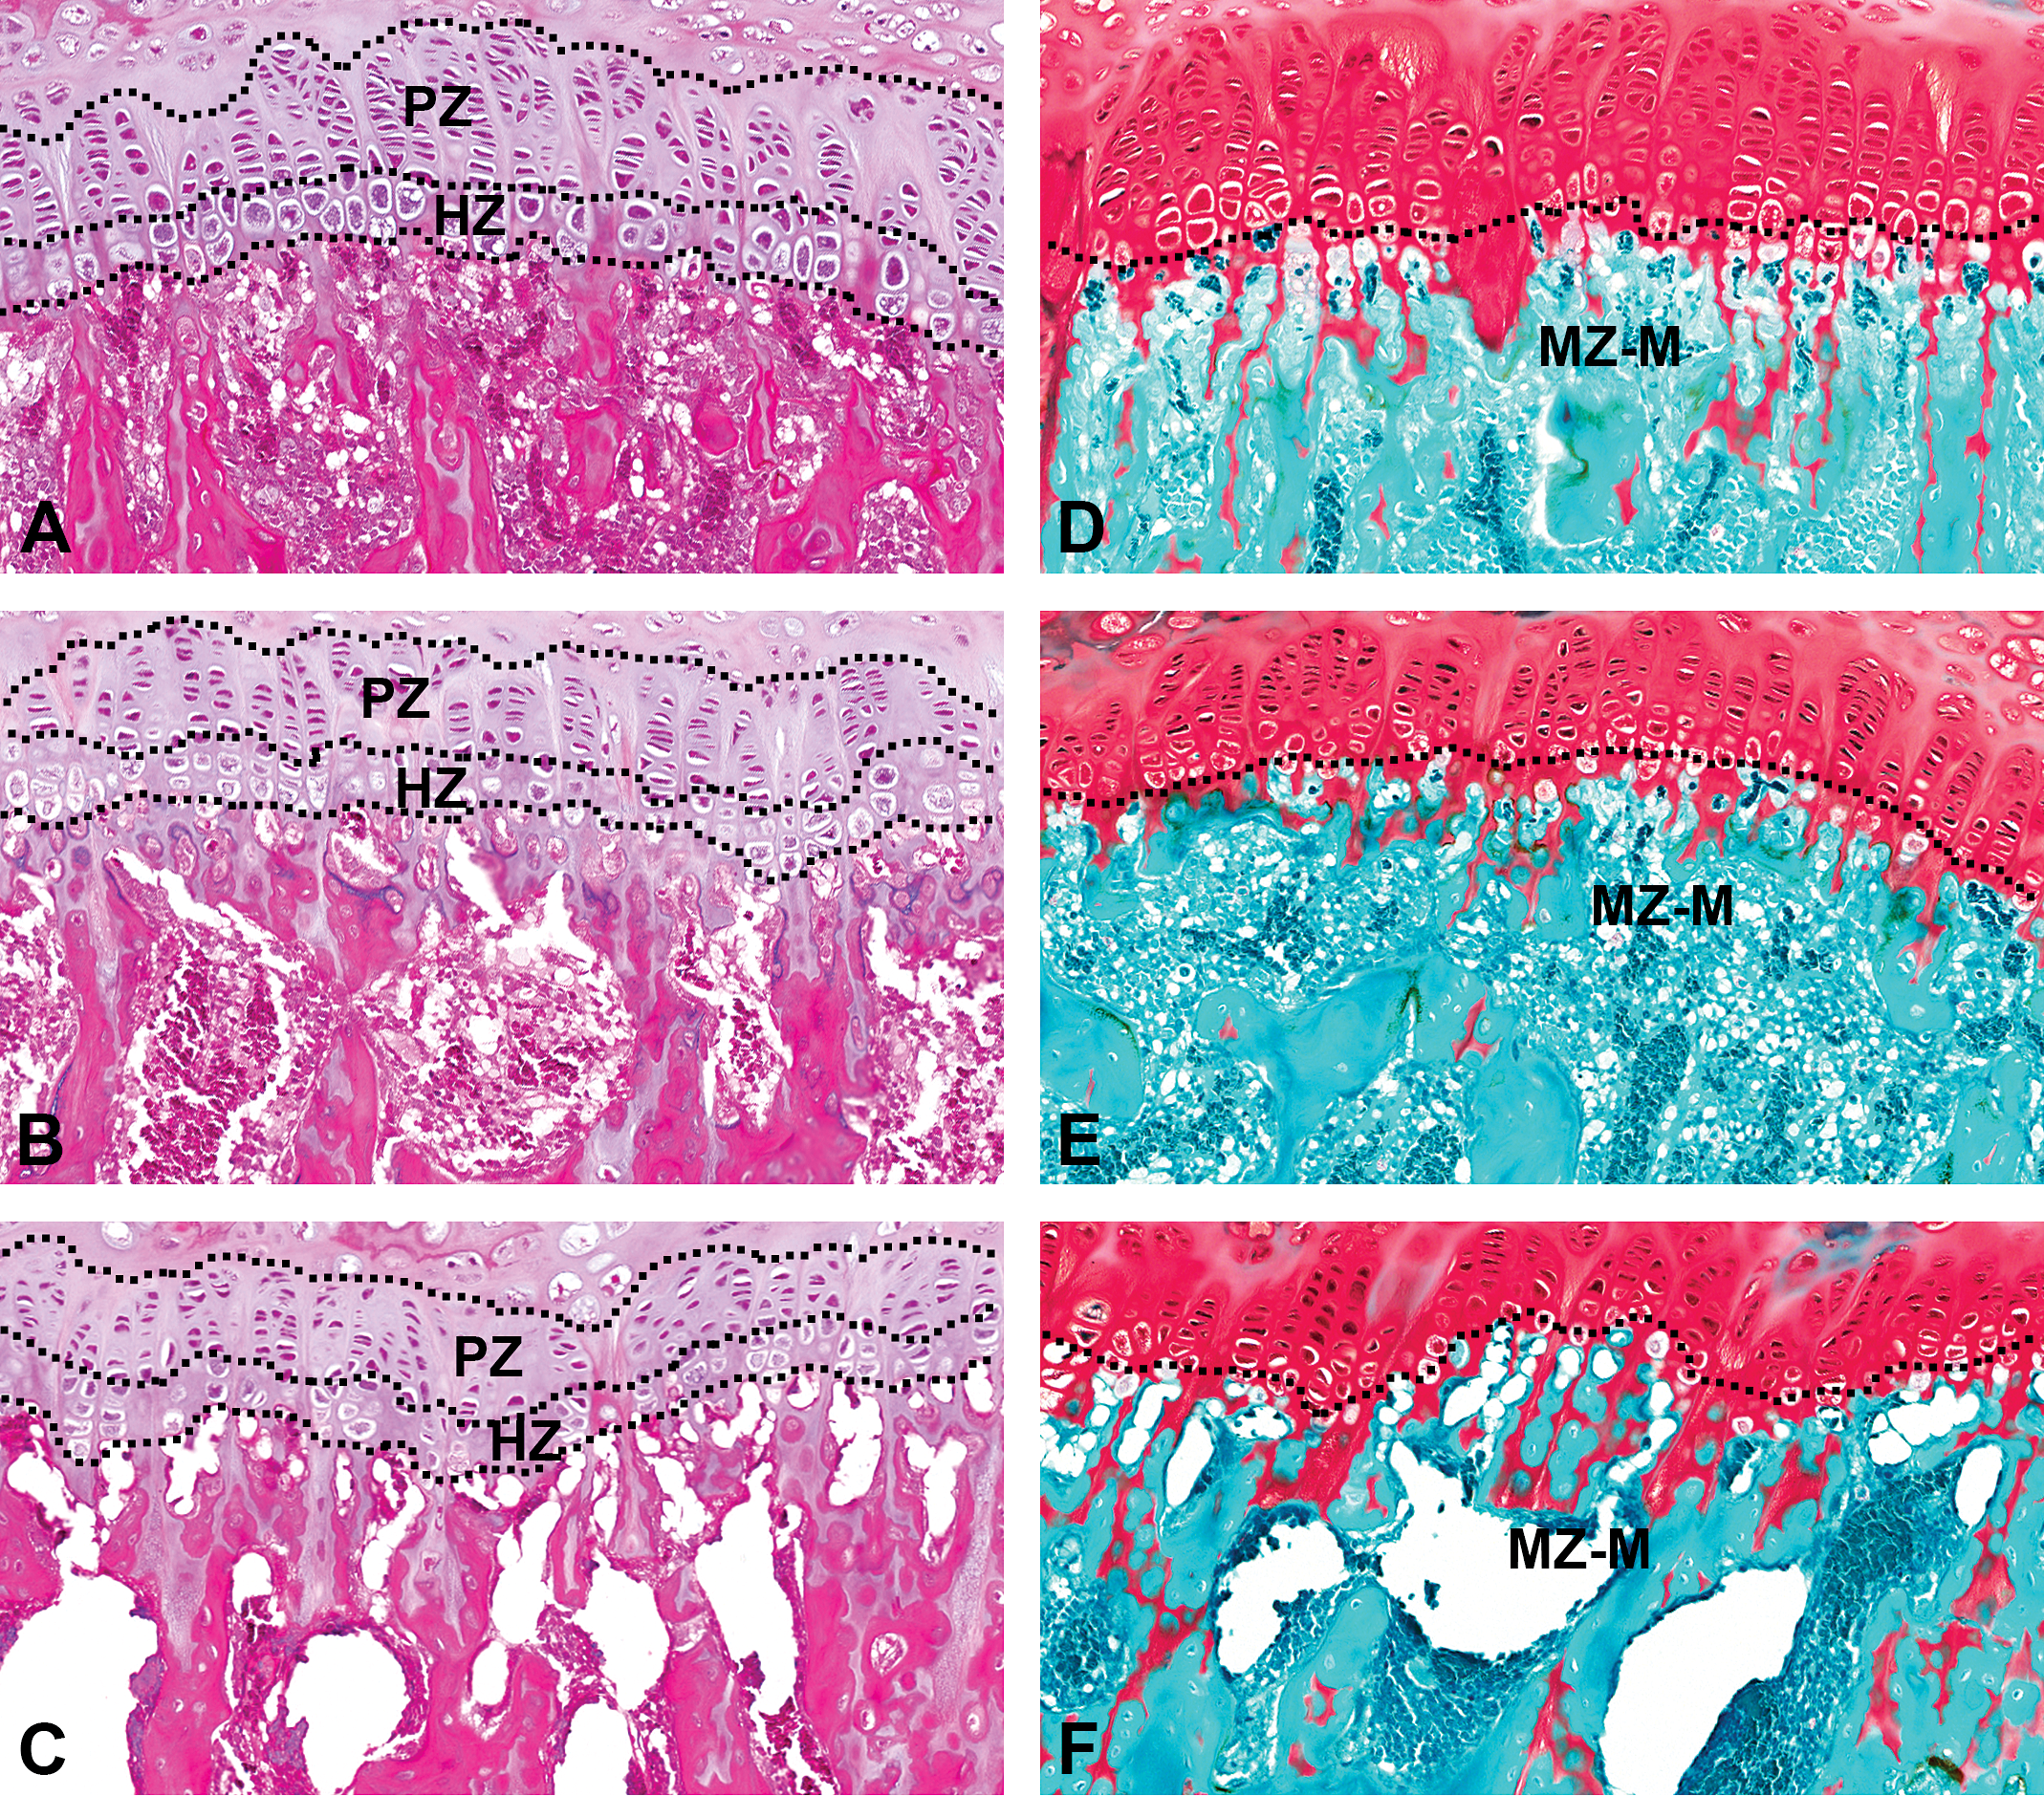
Sections of proximal femurs were stained with hematoxylin and eosin (HE; A–C) or safranin O-fast green (D–F). (A) and (D) NT group. (B) and (E) FU18 group (18 mg/kg/day of 5-FU). (C) and (F) R18 group (dietary restriction group receiving the same amount of food as that consumed in the FU18 group). A routine histopathological analysis using HE staining (A–C) showed no obvious differences among the seven study groups (NT group, 5-FU-treated groups [FU12, FU15, and FU18], and dietary restriction groups [R12, R15, and R18]). A tendency toward thinning of the femoral growth plate was observed in the 5-FU-treated groups and the dietary restriction groups but was diagnosed as histopathologically normal because the change was within the normal range for age-matched controls. Histopathological analysis using safranin O-fast green staining (D–F) also showed no obvious differences in the growth plate among the seven study groups; however, a reduction in the cartilage extracellular matrix, observed as a decreased stainability with safranin O, was observed from the mineralizing zone to the metaphyses in the FU18 group (E), compared with the other groups (D) and (F). 5-FU = 5-fluorouracil; NT = nontreated control; PZ = proliferative zone; HZ = hypertrophic zone; MZ-M = from mineralizing zone to metaphyses.
Histomorphometry: Widths of the GP
The GP widths of the proliferative and hypertrophic zones are summarized in Figure 2.
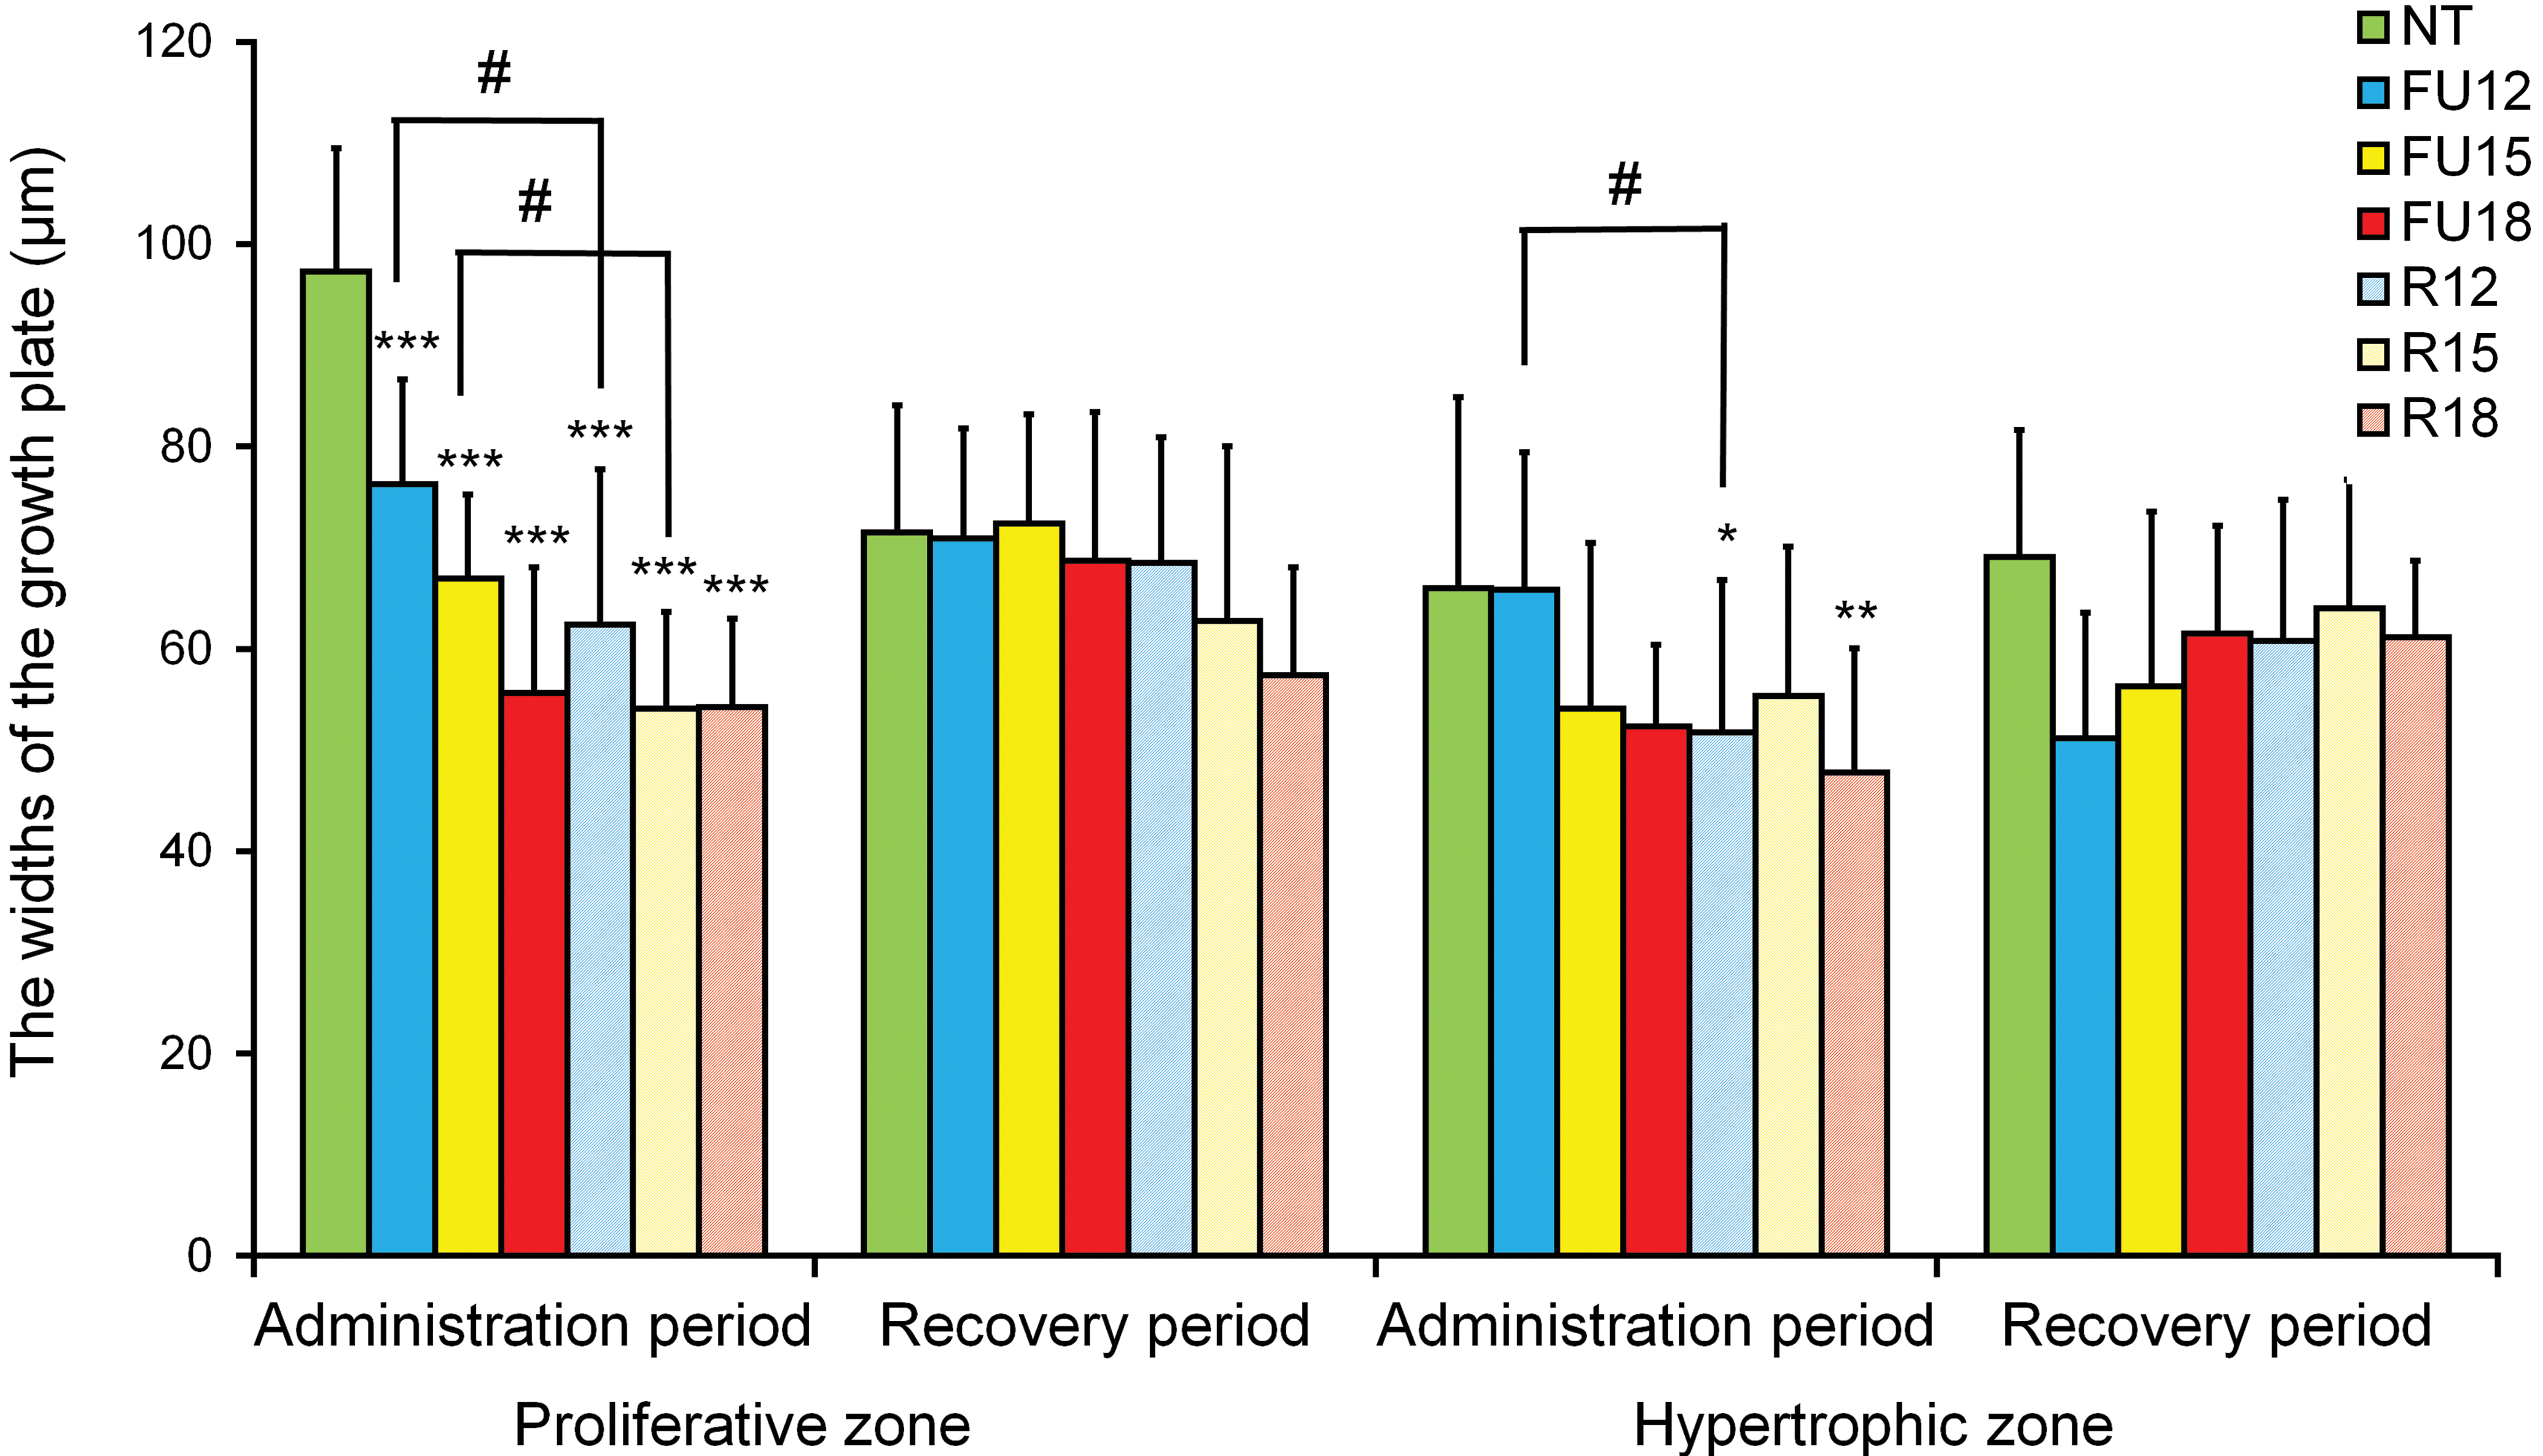
The widths of the growth plate in the NT group, the 5-FU-treated groups (FU12, FU15, and FU18), and the dietary restriction groups (R12, R15, and R18). Data are means ± SD (n = 5–6 in administration period, n = 4–6 in recovery period). Asterisks indicate a statistically significant difference from the NT group (*p < .05; **p < .01; ***p < .001 by multiple comparison test), and #indicates a statistically significant difference between the 5-FU-treated group and the dietary restriction group (p < .05 by t test). 5-FU = 5-fluorouracil; NT = nontreated control.
Widths of proliferative zone
In the administration period, a statistically significant (p < .001) decrease in the GP widths of the proliferative zone was observed in all 5-FU-treated groups and dietary restriction groups compared with the NT group. Compared with the NT group, the percentage decreases in the administration period were 22%, 31%, and 43% in the FU12, FU15, and FU18 groups, respectively; the corresponding percentage decreases in the R12, R15, and R18 groups were 36%, 44%, and 44%, respectively. In the recovery period, no statistically significant differences were observed in the widths of the proliferative zone in any of the groups, compared with the NT group, indicating full reversibility of the change. When comparing the 5-FU-treated groups with the dietary restriction groups in the administration period, statistically significant (p < .05) decreases were observed in the R12 group, compared with the FU12 group, and in the R15 group, compared with the FU15 group; no significant change was observed between the FU18 group and the R18 group, since the values were similar in these two groups. In the recovery period, no statistically significant differences were observed between the 5-FU-treated groups and the dietary restriction groups.
Widths of hypertrophic zone
In the administration period, statistically significant (p < .05 and p < .01) decreases of 22% and 28% were observed for the widths of the hypertrophic zone in the R12 and R18 groups, respectively, compared with the NT group, but no significant differences were observed between these groups in the recovery period. Also, no statistically significant differences were observed between any of the groups, except for the R12 and R18 groups, in the administration period, and no significant differences were observed in the recovery period. Comparisons between the 5-FU and dietary restriction groups in the administration period showed a significant decrease in the widths of the hypertrophic zone in the R12 group compared with that in the FU12 group (p < .05), but no statistically significant differences were observed in any of the groups in the recovery period.
Histomorphometry: Number of Chondrocytes per Column in the GPs
The number of chondrocytes per column in the GPs for the proliferative and hypertrophic zones is summarized in Figure 3.
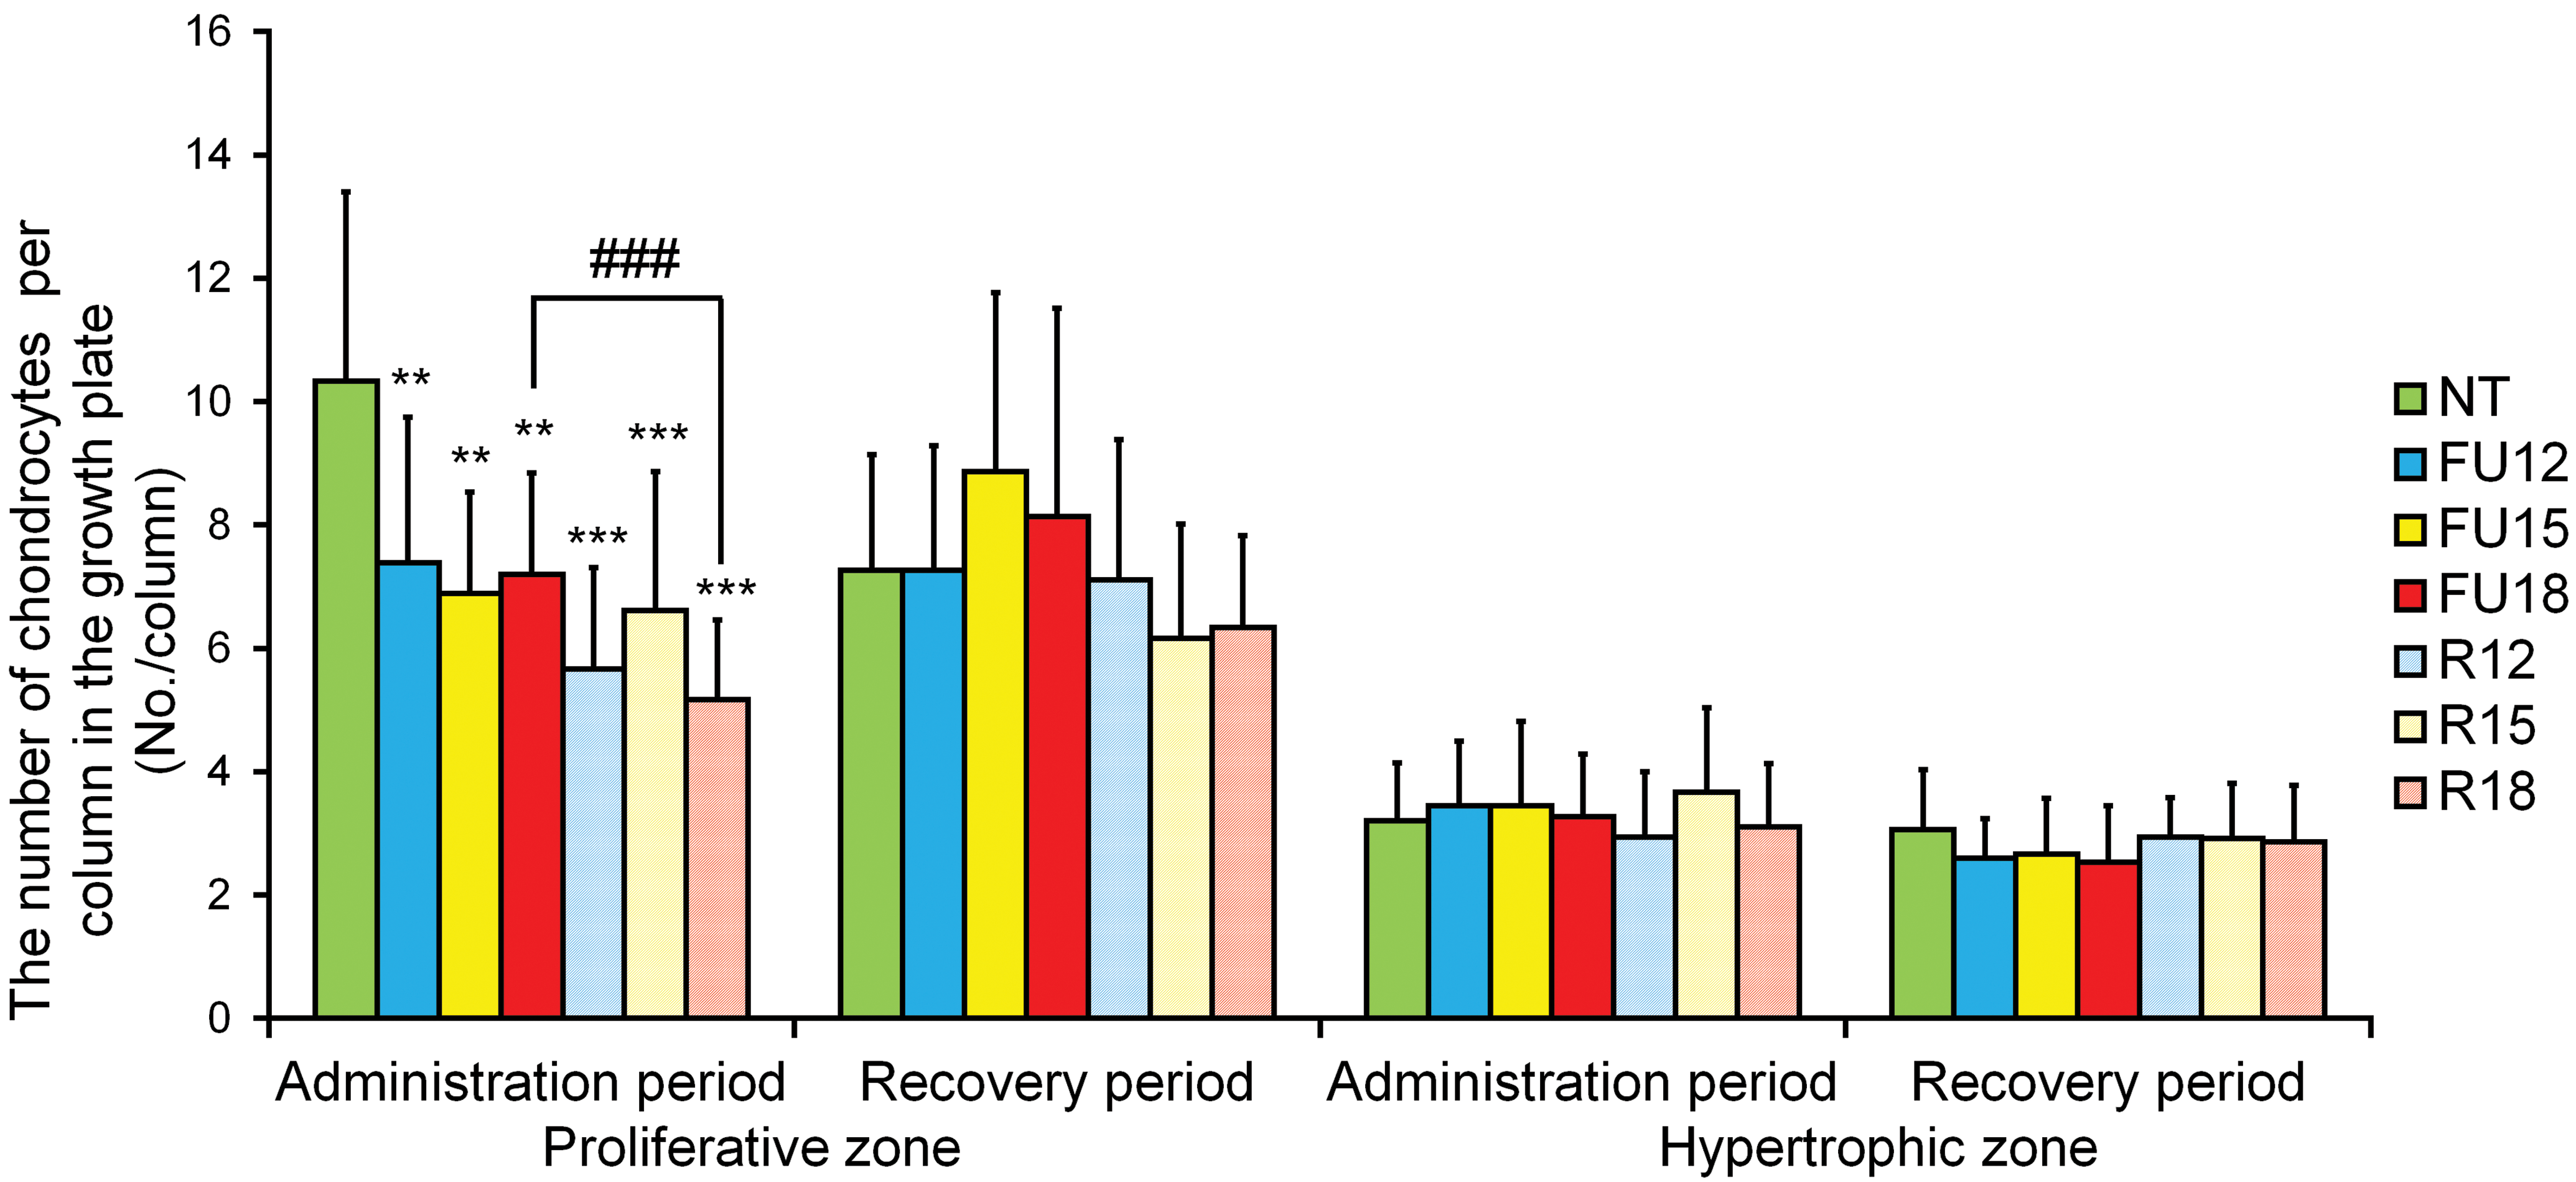
The number of chondrocytes per growth plate column in the NT group, the 5-FU-treated groups (FU12, FU15, and FU18) and the dietary restriction groups (R12, R15, and R18). Data are means ± SD (n = 5–6 in administration period, n = 4–6 in recovery period). Asterisks indicate a statistically significant difference from the NT group (**p < .01; ***p < .001 by multiple comparison test), and ###indicates a statistically significant difference between the 5-FU-treated group and the dietary restriction group (p < .001 by t test). 5-FU = 5-fluorouracil; NT = nontreated control.
Number of chondrocytes in proliferative zone
In the administration period, statistically significant (p < .01 or p < .001) decreases in the number of chondrocytes in the proliferative zone were observed in the 5-FU-treated groups and the dietary restriction groups, compared with the NT group. In comparison with the NT group, the percentage decreases in the administration period were 28%, 33%, and 30% in the FU12, FU15, and FU18 groups, respectively; the corresponding decreases in the R12, R15, and R18 groups were 45%, 36%, and 50%, respectively. No statistically significant differences in the number of chondrocytes in the proliferative zone were observed in any of the groups compared with the NT group, in the recovery period. Comparisons between the 5-FU and dietary restriction groups showed a statistically significant (p < .001) decrease only in the number of chondrocytes in the proliferative zone between the R18 and FU18 groups in the administration period. In the recovery period, no statistically significant differences in the number of chondrocytes in the proliferative zone were observed between the 5-FU and dietary restriction groups.
Number of chondrocytes in hypertrophic zone
No statistically significant differences in the number of chondrocytes in the hypertrophic zone were observed in any of the study groups, compared with the NT group, in either the administration period or the recovery period.
Immunohistochemistry
The immunohistochemical features of PCNA-positive cells in the proliferative zone are shown in Figures 4 and 5. Many PCNA-positive chondrocytes in the proliferative zone were observed in the GPs of the NT group (Figure 4 A), but these cells were less obvious in the FU18 and R18 groups in the administration period (Figure 4B and C), as shown by the following measurements. In the administration period, statistically significant (p < .01 or p < .001) decreases were observed in the PCNA-positive cells in the proliferative zone in the 5-FU-treated groups (FU15 and FU18) and the dietary restriction groups (R12, R15, and R18), compared with the NT group. In comparison with the NT group, the percentage decreases in the administration period were 46%, 79%, and 89% in the FU12, FU15, and FU18 groups, respectively; the corresponding decreases in the R12, R15, and R18 groups were 61%, 86%, and 91%, respectively. No statistically significant differences were observed in the PCNA-positive cells in the proliferative zone in any of the groups compared with the NT group, in the recovery period except for the FU18 group (p < .05).
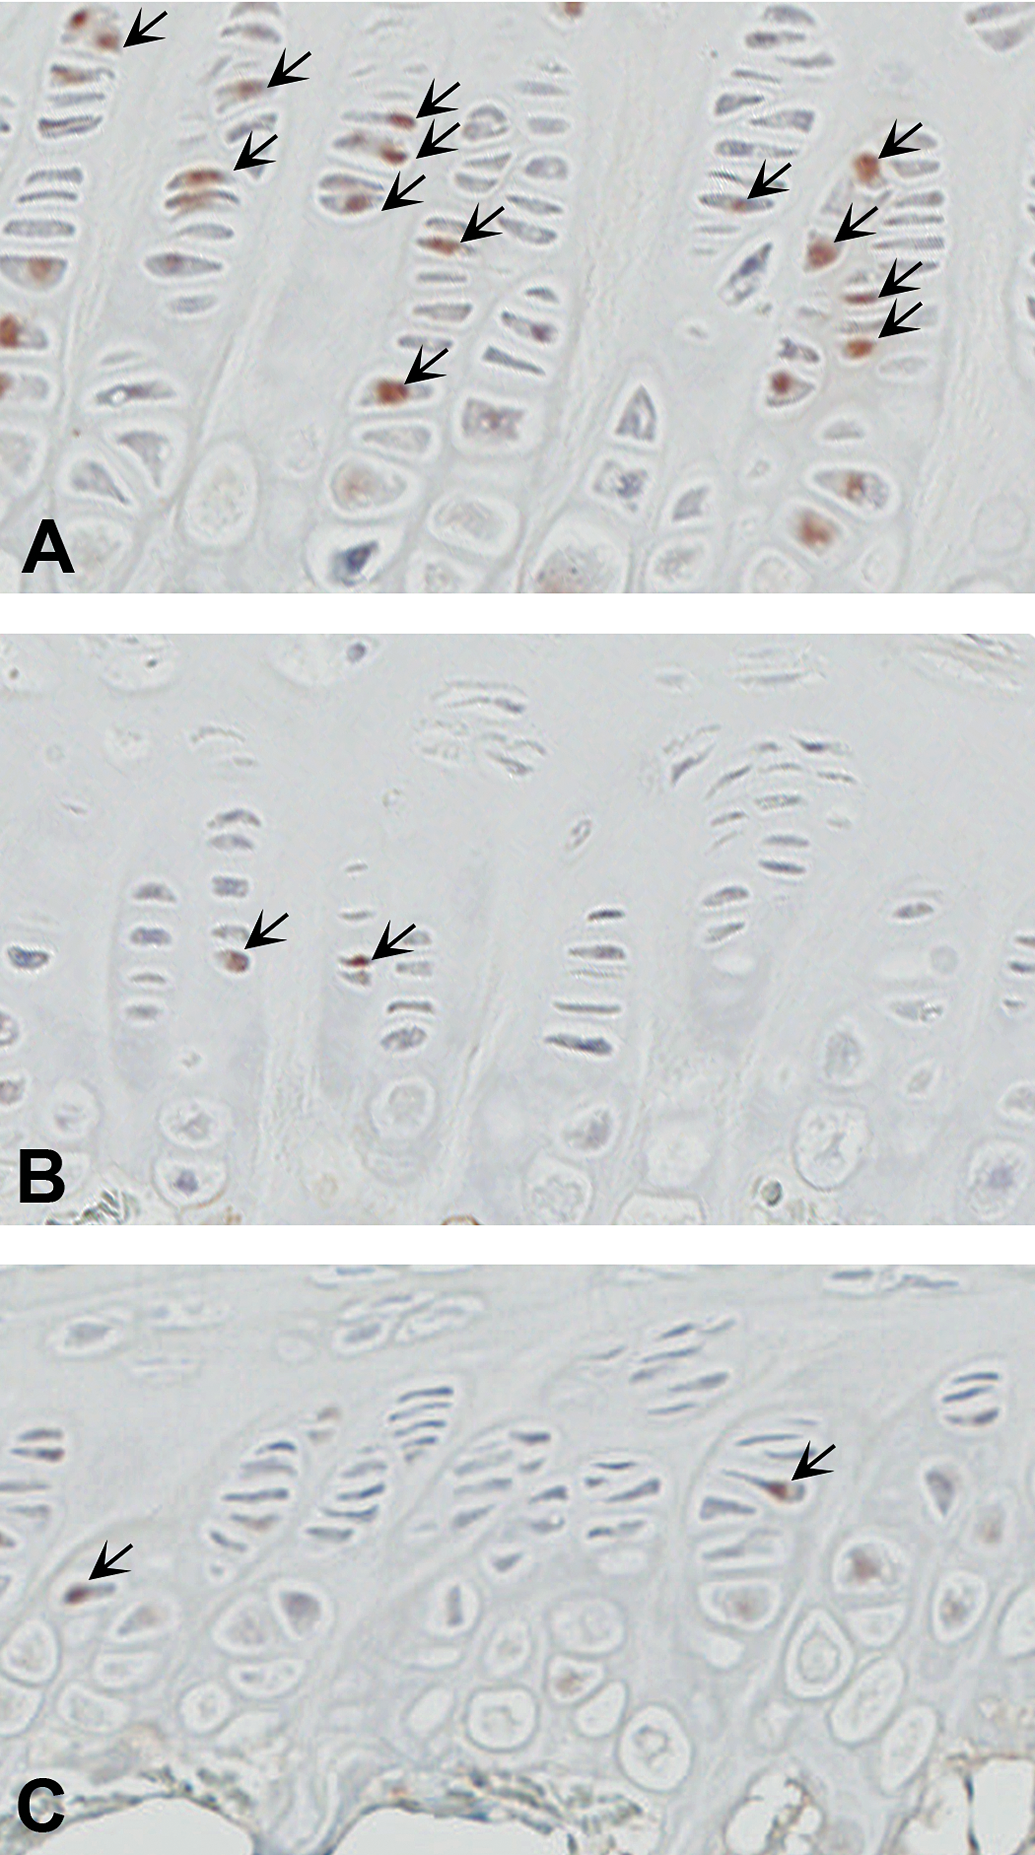
Sections of proximal femurs were immunostained for PCNA (A–C). Many PCNA-positive chondrocytes in the proliferative zone were observed in the growth plates of the NT group (A) but were less obvious in the FU18 (B; 18 mg/kg/day of 5-FU) and R18 (C; dietary restriction group receiving the same amount of food as that consumed in the FU18 group) groups. 5-FU = 5-fluorouracil; NT = non-treated control; PCNA = proliferating cell nuclear antigen.
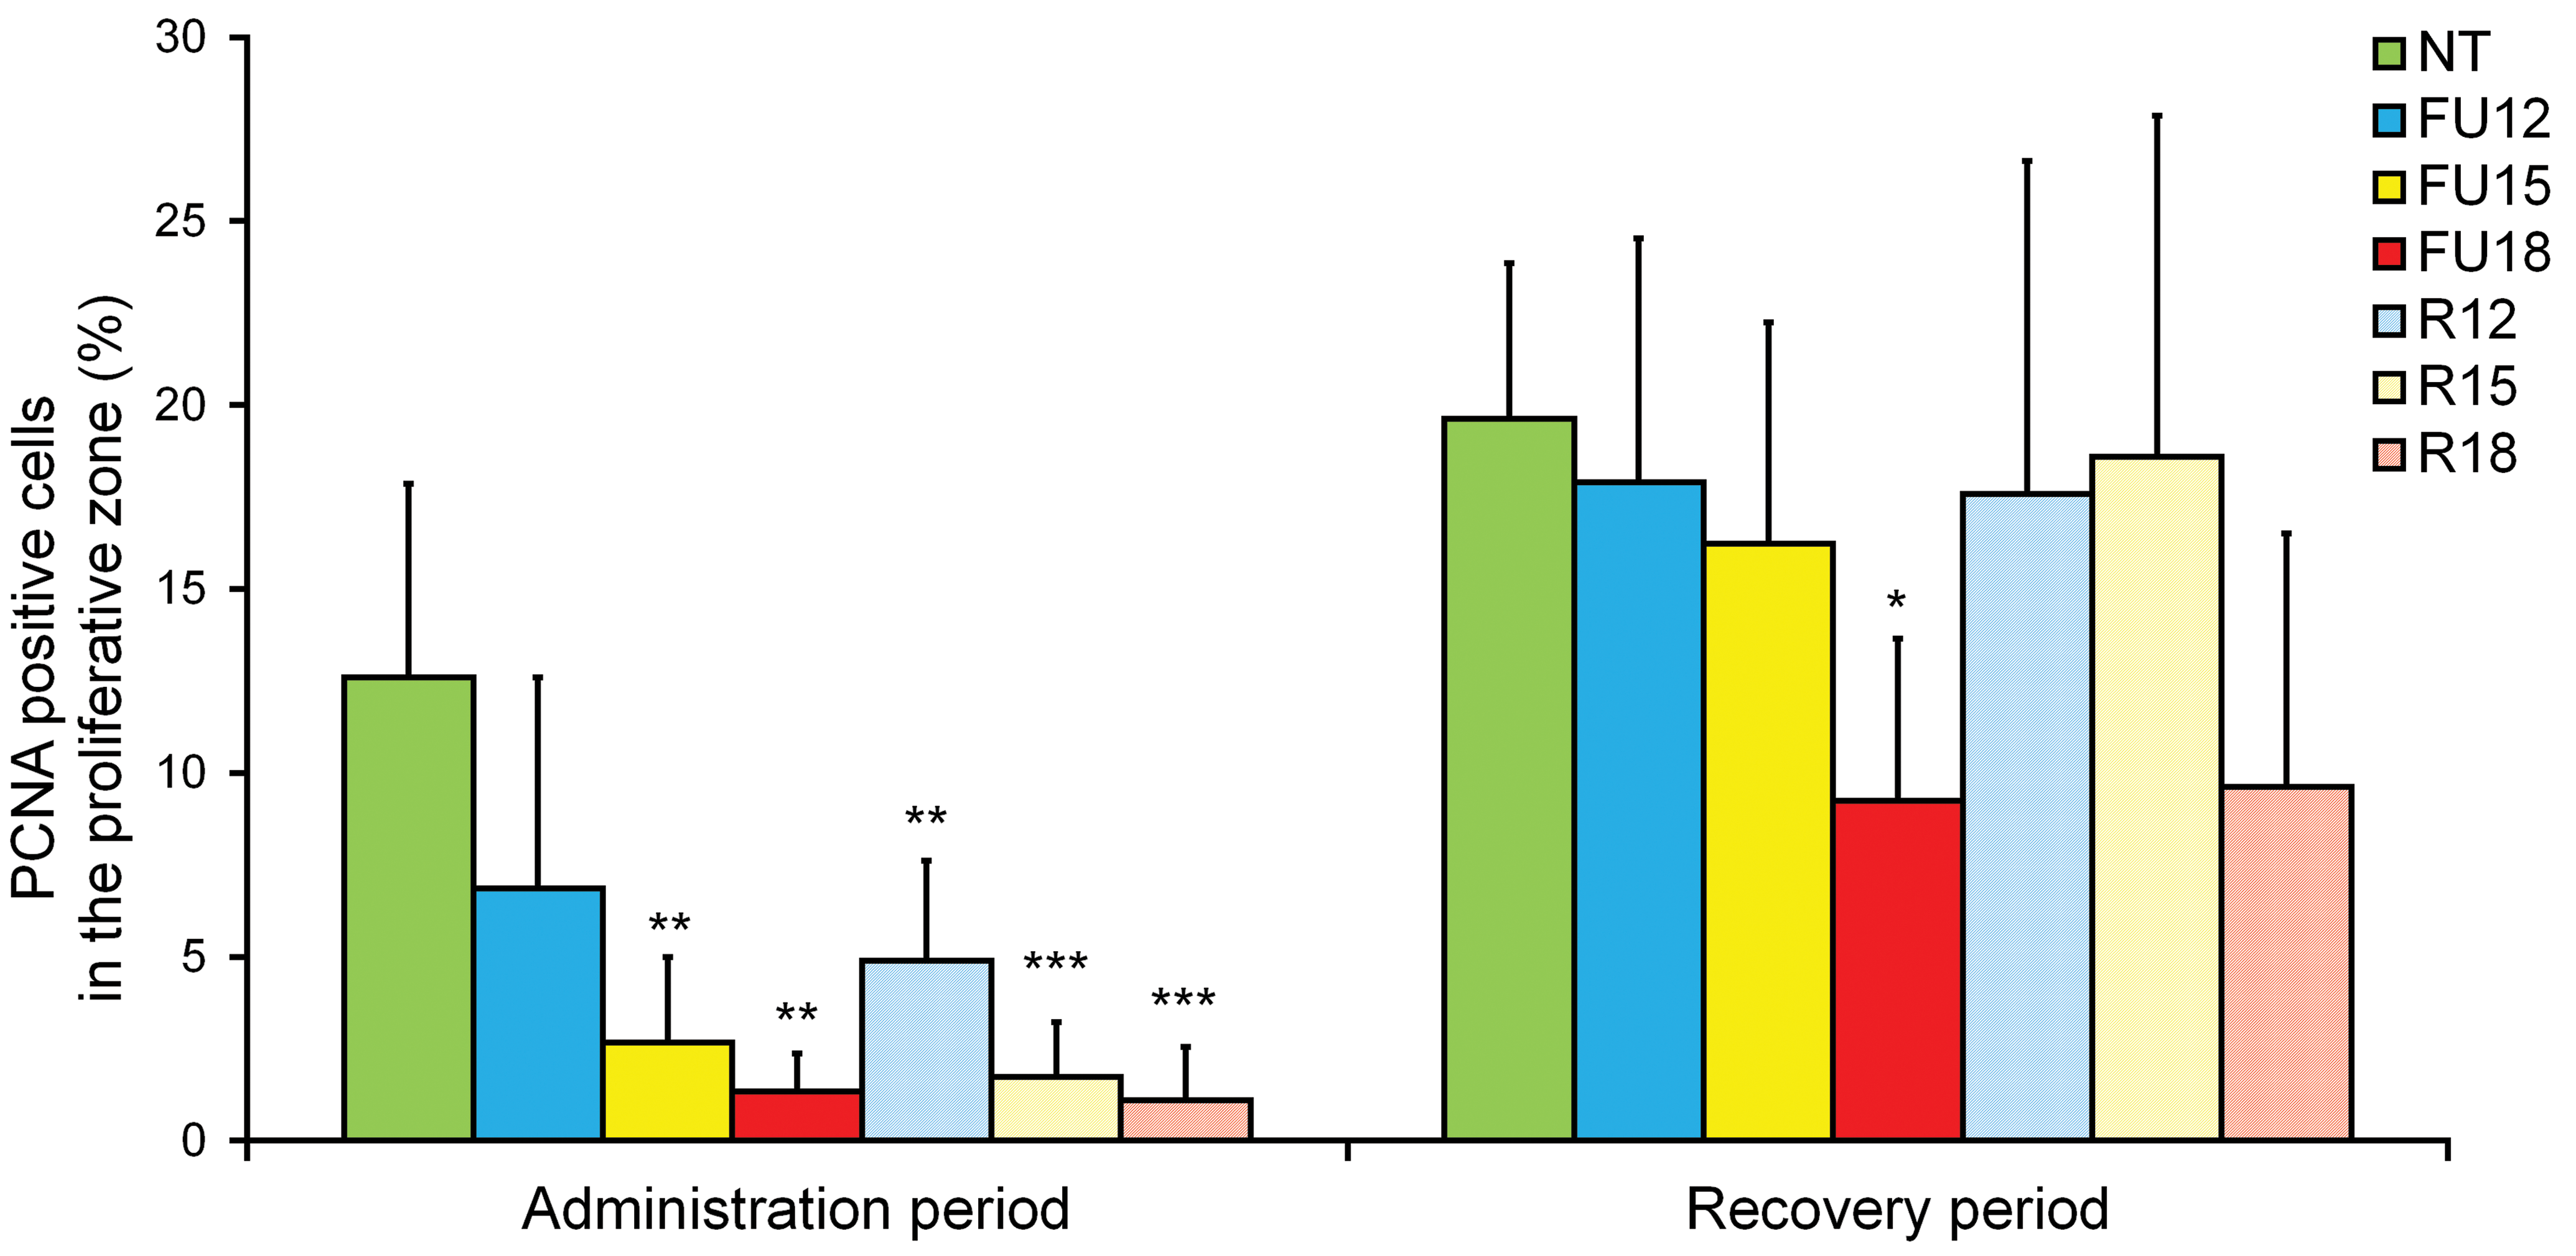
The PCNA-positive cells in the proliferative zone in the NT group, the 5-FU-treated groups (FU12, FU15, and FU18), and the dietary restriction groups (R12, R15, and R18). Data are means ± SD (n = 5–6 in administration period, n = 4–6 in recovery period). Asterisks indicate a statistically significant difference from the NT group (*p < .05; **p < .01; ***p < .001 by multiple comparison test). 5-FU = 5-fluorouracil; NT = nontreated control; PCNA = proliferating cell nuclear antigen.
Discussion
In this study, we evaluated the proximal femoral GP thickness in a 14-day toxicity study to detect whether the effects observed on the GP of young rats were attributable to a direct toxic effect of the drug, a secondary drug effect caused by decreased food consumption, or a combination of the above.
In the 14-day dietary restriction groups, statistically significant decreases in the widths of and the number of chondrocytes in the proliferative zone of the GPs were observed. Specifically, a dietary restriction of 25% to 53% caused (1) a 36% to 44% decrease in the widths of the proliferative zone and (2) a 36% to 50% decrease in the number of chondrocytes in the proliferative zone of the GPs. An immunohistochemical analysis revealed statistically significant decreases in PCNA-positive cells in the proliferative zone in all the dietary restriction groups compared with the NT group, though no remarkable findings were observed in GPs stained with safranin O, which can detect changes in the cartilage extracellular matrix (Yoshida et al. 2014; Hoemann et al. 2012). The proliferative zone is known to produce matrix and to be a site of cell proliferation (Brighton 1987); accordingly, when chondrocyte proliferation decreases, the primary defect is observed in the proliferative zone (Brighton 1987; van Leeuwen et al. 2003). These data suggest that the 14-day dietary restrictions caused statistically significant decreases in the widths of and the number of chondrocytes in the proliferative zone of the GPs, and these changes were induced by the decrease in cellular proliferation of chondrocytes in the proliferative zone of the GPs, whereas the dietary restrictions did not cause any obvious histomorphological changes in the cartilage extracellular matrix.
Regarding the effect of decreased food consumption on the GP, many factors related to malnutrition and linear growth, such as insulin-like growth factor 1, thyroid hormone, gonadotropins, corticosterone, hypoxia-inducible factor α, vascular endothelial growth factor, vitamin D, and sex hormones, have been reported (Even-Zohar et al. 2008; Gat-Yablonski and Phillip 2015). The relationships between these factors and the changes observed in this study are unclear but warrant further examination.
In the 14-day 5-FU-treated groups, statistically significant decreases in the widths of and the number of chondrocytes in the proliferative zone of the GPs and in the number of PCNA-positive cells in the proliferative zone were observed. These decreases were similar in degree and no statistically significant differences in the GP effects were observed between the 5-FU-treated groups and the groups with matched dietary restrictions for most parameters. However, the femurs in two-fifths of the animals in the high-dose 5-FU treatment group (FU18 group) exhibited reductions in cartilage extracellular matrix as shown by their decreased stainability with safranin O from the mineralizing zone to the metaphyses. This change in the cartilage extracellular matrix was the only difference detected between the 5-FU-treated groups and the dietary restriction groups. 5-FU is known to cause DNA damage and cell death and to inhibit proliferation, including chondrocytes (Longley, Harkin, and Johnston 2003; Xian et al. 2004, 2006), and a single intraperitoneal injection of 150 mg/kg of 5-FU can reduce both the number of chondrocytes and the zonal widths of the proliferative zones in 7-week-old rats via apoptosis and the suppression of cell proliferation in the proliferative zone (Xian et al. 2004, 2006). The changes observed in the proliferative zone in this study resembled the changes reported in these references, except for the lack of findings of single-cell necrosis (pyknotic nuclei) in the chondrocytes of the GP, osteoblasts, or osteoclasts (Xian et al. 2004, 2006). However, the changes observed in the 5-FU treatment group in this study were considered to be mainly related to the decrease in food consumption since similar changes were observed in the 14-day dietary restriction groups in this study. The qualitative spectrum of toxicity is known to change dramatically when 5-FU is used in different doses, mode of administration, and schedules (Macdonald 1999), and this characteristic of 5-FU was considered to be the reason why some results in this study and Xian’s study were different. In Xian’s study, doses were higher and parenteral. A decreased safranin O stainability from the mineralizing zone to the metaphyses was observed in two-fifths of the animals in the FU18 group, and this change was considered to be the only direct effect of 5-FU treatment observed in this study, since 5-FU is known to affect GAG synthesis (Young et al. 1994).
We also evaluated the femoral GPs in a 7-day recovery period to examine the reversibility of changes caused by 14 days of dietary restriction. No statistically significant changes were observed in the widths of or the number of chondrocytes in the proliferative zone of the GPs or in the number of PCNA-positive cells in the proliferative zone in the dietary restriction groups, compared with the NT group, in the recovery period, suggesting reversibility. Similar reversibility was observed in the 5-FU-treated groups. These results revealed the reversibility of the changes in the femoral GPs caused by 14 days of dietary restriction or a decrease in food consumption after 5-FU treatment within a 7-day recovery period. In Farnum’s report, the tibial GP of 4-week-old rats that had fasted for 3 days was able to return to the state of that observed in control littermates after 7 days of regular food intake; this phenomenon was called “catch-up growth” (Farnum et al. 2003). Since the percentage reduction in food intake compared with that in the NT group in all of the 5-FU-treated groups and dietary restriction groups in the recovery period was lower than that in the administration period, nutritionally induced catch-up growth was observed in the recovery period, and this catch-up growth caused no remarkable differences in most of the data observed for all the groups in this study.
Importantly, no remarkable differences in the histomorphological features of the GP were observed between the 5-FU-treated groups and the groups with matched dietary restrictions for most parameters, with the exception of a decrease in the cartilage extracellular matrix noted only in a 5-FU-treated group. These results suggested that most of the changes observed in the GPs after 14 days of treatment with 5-FU were likely induced by the reduction in food intake, rather than direct drug toxicity, even though 5-FU is known to affect the GP directly at higher single doses.
Several reports have demonstrated the effect of dietary restriction, fasting, or malnutrition on GPs, and these reports have shown nonconclusive results. Food restriction or fasting causes a decrease in GP widths, and some studies have reported that food restriction or fasting affected (1) the proliferative zone (Brighton 1987; van Leeuwen et al. 2003) or (2) the hypertrophic zone to a greater extent than the proliferative zone (Heinrichs et al. 1997) but did not affect the ratio between the proliferative and hypertrophic zones (Even-Zohar et al. 2008). However, the results of these reports are difficult to apply as explanations for the changes in toxicity studies because the results differed from study to study, probably because of differences in animal age, study duration, level of food restriction, and the sites assessed. For this reason, we believe that our findings will be useful to determine whether the observed changes in the GPs in 14-day toxicity studies are attributable to a direct effect of drug toxicity or a secondary effect of decreased food consumption when some changes in GPs are observed histologically. Moreover, histomorphometry and additional histopathological evaluations using tissue slides stained with safranin O might be useful in such studies, since histomorphometry can be used to obtain detailed findings and safranin O staining can enable changes in the cartilage extracellular matrix to be visualized.
Our conclusions were obtained using the sections of proximal femurs from 8- to 9-week-old young adult rats at the study termination, and detecting reductions in the thickness of the GP using standard histopathological evaluations of HE-stained slides cannot be sufficient in rats of this age because of the high rate of endochondral ossification (Fossey et al. 2016; Fukuda and Matsuoka 1979; Roach et al. 2003). Therefore, additional examinations using 4- to 5-week-old rats, corresponding to a period of rapid growth (Roach et al. 2003), and/or examinations of proximal tibias in which a decreased thickness of the GP is commonly reported (Farnum et al. 2003; Fossey et al. 2016; Noguchi et al. 2011; van Leeuwen et al. 2003; Xian et al. 2004, 2006) are further needed to confirm the present findings.
In conclusion, we showed that dietary restrictions for 14 days caused statistically significant decreases in the widths of and the number of chondrocytes in the proliferative zones of femoral GPs and also the number of PCNA-positive cells in the proliferative zone in rats. Similar changes were also observed in the 5-FU-treated groups in this study; thus, the changes observed in the 5-FU-treated groups were thought to have been mainly caused by the dietary restrictions, rather than drug toxicity, even though 5-FU is known to affect the GP directly at higher single doses. The effect of decreased food consumption should be taken into consideration when either of these histomorphometric parameters in the proliferative zones of femoral GPs decreases after treatment with drugs that are expected to inhibit bone proliferation, such as antitumor agents, because decreased food consumption itself can affect the femoral GPs.
Footnotes
Author Contributions
Authors contributed to conception or design (CN, FA, HM); data acquisition, analysis, or interpretation (CN, KM, YN, MS); drafting the manuscript (CN); and critically revising the manuscript (CN, KM, YN, FA, HM, MS). All authors gave final approval and agreed to be accountable for all aspects of work in ensuring that questions relating to the accuracy or integrity of any part of the work are appropriately investigated and resolved.
Declaration of Conflicting Interests
The author(s) declared no potential, real, or perceived conflicts of interest with respect to the research, authorship, and/or publication of this article.
Funding
The author(s) received no financial support for the research, authorship, and/or publication of this article.