
Abstract
Bone is a unique tissue with turnover, metabolic, and cellular activities that vary through development to aging and with a mineralized matrix in which the current state and the history of a bone coexist. Qualitative histopathology often lacks sensitivity to detect changes in bone formation, mineralization and resorption, which often requires chronic dosing to result in structural changes such as variation in bone mass and geometry. A large panel of modalities can be used to fully analyze the health of the skeleton, including biomarker evaluation in serum or urine, imaging techniques ranging from radiology to computed tomography, biomechanical testing, and undecalcified tissue processing with bone histomorphometry. The use of clinically relevant biomarkers provides an important noninvasive, sensitive, rapid, and real-time tool to monitor bone activity at the whole skeleton level when conducting safety assessments in a preclinical setting. Imaging modalities also allow in vivo longitudinal assessments with a powerful, noninvasive and clinically translatable tools to monitor drug effects. Different imaging modalities are used in the preclinical studies to evaluate the bone tissues: standard radiography, dual-energy X-ray absorptiometry, peripheral quantitative computed tomography (pQCT), micro-computed tomography, and high-resolution pQCT. Bone histomorphometry is an important tool that provides sensitive evaluation to detect effects of test articles on bone resorption, formation, mineralization, remodeling rates and growth to address a potential target- or class-related theoretical bone liability. Ultimately, the measurement of bone mechanical properties in pharmaceutical testing is critical to understand the potential effects of that pharmaceutical on bone health and fracture risk. Important considerations are required for including these different techniques in toxicology rodents and nonrodent studies, to actually integrate these into safety assessment.
There are numerous drugs that can affect bones, positively or negatively, and that require specific assessments in preclinical studies. Although, in most cases, qualitative histopathology has sufficient sensitivity to detect pathological changes, the standard microscopic evaluation of decalcified hematoxylin- and eosin-stained bone section is not a very sensitive technique to evaluate changes in bone mass and geometry. A large panel of tools are available for bone assessment in preclinical studies, biomarkers, osteodensitometry, histomorphometry, and biomechanics. From a regulatory point of view, there are some specific indications in the Food and Drug Administration (FDA 2016) osteoporosis guidance and also for the nonclinical testing in juvenile animals (FDA guidance document [Nonclinical Safety Evaluation of Pediatric Drug Products 2006]). Many drug candidates are destined for use in an adult population in which longitudinal skeletal growth has ceased, although toxicology studies generally are conducted in young and skeletally immature animals. If children are included as an intended patient population, skeletal changes observed in nonclinical studies performed using immature animals become much more important for risk assessment. In such cases, juvenile studies in very young animals may be conducted purposely in addition to other standard nonclinical safety studies. Preclinical efficacy and toxicology research focuses not only on the effects of drug candidates with an intended target of improving musculoskeletal function but also on the detection of deleterious responses in bone associated with therapeutics intended for other applications. Characterizing structural, compositional, and mechanical properties and their interactions can provide valuable information regarding the functional responses of bone tissue to stimuli and therapeutics. Several modalities can be used to fully analyze the skeleton in preclinical safety, including biomarker evaluation of serum or urine, various imaging techniques, bone histomorphometry, and biomechanical testing. Many clinical techniques such as radiology, osteodensitometry, computed tomography (CT), and the measurement of biomarkers are increasingly being used in preclinical drug development as well as being incorporated into clinical trials when bone has been identified as a potentially affected tissue. Biochemical markers of bone turnover (or bone turnover markers [BTMs]) along with hormones and clinical biochemistry parameters provide a rapid and reliable in vivo assessment of overall skeletal metabolic activity. While imaging techniques such as dual-energy X-ray absorptiometry (DXA), peripheral quantitative computed tomography (pQCT), and micro-computed tomography (micro-CT) are sensitive methods to provide quantitative assessment of bone mass and structure, these techniques do not explain the cellular or tissue-level mechanisms that lead to a bone mass imbalance or altered microstructure. In addition, long-term dosing may be required for structural changes to manifest as a consequence of test article-related effects on bone matrix. Histomorphometry is an essential and sensitive ex vivo tool to assess the cellular activity and mineralization in the various bone compartments, to provide mechanistic insight into the effects of a test article on the bone, and to explain structural changes identified by histopathology or imaging. Biomechanical testing provides essential assessment of bone strength, which is used to predict the potential impact on fracture risk. It is important to understand the techniques, their applications, and limitations, in order to fully integrate the generated end points in the interpretation in preclinical studies. This overview provides a review of the regulatory requirement, biochemical markers of bone turnover, main skeletal imaging techniques, histomorphometry, biomechanical testing and important considerations for applications of these techniques in toxicology rodent and nonrodent studies, and the challenges of GLP validation.
Regulatory Status
Nonclinical evaluation of drugs intended for osteoporosis treatment should follow specific regulatory requirements (FDA, Draft Guidance June 2016) that highlight the importance to assess bone quality through the measurement of bone strength, which is determined by both bone mass and structure, with evaluation of biochemical markers of bone resorption and formation, DXA and pQCT, static and dynamic histomorphometry, and biomechanical testing. Similar requirements exist in Europe (European Medicines Agency [EMA]: Guideline on the evaluation of medical products in the treatment of primary osteoporosis 2006) and Japan (MHLW: Guidelines on Clinical Evaluation of Drugs to Treat Osteoporosis 1999). There is no specific guidance for integration of these techniques in toxicology studies (for compounds intended to treat non-osteoporosis diseases); however, these specific end points generated by these techniques are often requested by regulatory authorities when a concern is raised from previous studies, conducted with the compound under test or a member of its class. For pediatric indications, the FDA guidance document (Nonclinical Safety Evaluation of Pediatric Drug Products 2006) mentioned that organ systems of concern can include the skeleton and/or the skeletal growth, including measurement of overall growth (e.g., body weight, growth velocity per unit time, and tibial length). Similar requirements exist in Europe (EMA: Nonclinical Testing in Juvenile Animals on Human Pharmaceuticals for Pediatric Indications 2008) and Japan (Nonclinical Safety Study in Juvenile Animals for Pediatric Drugs 2012). In several instances when a specific concern is raised, additional requests may be brought forward to study skeletal development and maturation in vivo with bone density, biochemical markers of bone turnover, and bone lengths with radiology; to evaluate ex vivo the bone mass and density (bone mineral content [BMC] and bone mineral density [BMD]) and bone biomechanical properties; and to conduct a focused evaluation on specific components of the skeleton such as the growth plates and dentition. There are numerous pharmaceuticals with liabilities for skeletal maintenance or development. Some of the most common ones are listed in Table 1.
Partial List of Compounds with Known Effects on Bone.
Note: PPAR Ɣ = peroxisome proliferator-activated receptor Ɣ.
Biochemical Markers of Bone Turnover
Analysis of BTMs has improved significantly over the last decade. Bone marker immunoassays are noninvasive, simple, specific, and sensitive tools to assess bone metabolism. BTMs represent an important component of nonclinical studies to assess any adverse effects or pharmacological action of compounds on bone metabolism.
Fibrils of collagen I have nonhelical C- and N-terminal ends (telopeptides) bonding to the helical areas of adjacent fibrils by pyridinium cross-links. Bone formation markers include bone-specific alkaline phosphatase (ALP), which leaks from the osteoblast plasma membrane; osteocalcin (OC), a bone matrix protein produced by osteoblasts; and procollagen type I telopeptides (which are cleaved during collagen I formation). The bone resorption marker assays detect the deoxypyridinoline (DPD) cross-links or the N- or C-terminal telopeptide fragments of collagen type I, released during osteoclastic bone resorption (Figure 1). During bone turnover, these markers enter the circulation, with some also appearing in urine. They therefore are sampled and measured easily using minimally invasive procedures. Collagen type I is also present in other tissues such as skin, dentin, cornea, vessels, fibrocartilage, and tendons, but the collagen type I turnover rate in nonskeletal tissues is much lower than the process occurring in bone; therefore, nonskeletal collagen type I metabolism contributes very little to the breakdown products in the circulation.
Schematic diagram of bone turnover illustrating the generation of various bone biomarkers for resorptive and formative processes. Reproduced with permission from Gunson, Gropp, and Varela (2013).
Global bone metabolism assessed by bone markers in blood or in urine represents the cumulative results of all modeling and remodeling bone sites. BTMs provide a dynamic real-time assessment of skeletal metabolism. Due to the coupling of bone formation and resorption, it is recommended that a panel of bone markers be evaluated to fully characterize the skeletal status with respect to these two competing physiologic processes. Such panels typically include at least two markers of bone formation and two markers of bone resorption.
Markers of Bone Formation
Markers of bone formation assess either osteoblastic synthetic activity or postrelease metabolism of procollagen. ALP is a ubiquitous enzyme associated with the plasma membrane of cells. In bone, it is produced by osteoblasts and plays an important role in osteoid formation and mineralization. The total ALP pool in serum consists of several isoforms, which originate from various tissues; in adults, the serum pool is derived mainly from the liver and the bone isoforms. The bone-specific isoenzyme has a higher specificity to osteoblastic activity than does the total ALP value. However, in the absence of intercurrent liver disease, total ALP can be used as a surrogate marker for bone-specific ALP, especially in rodents for which no immunoassays are commercially available for the bone isoenzyme. For immunoassays of bone ALP isoenzymes, some cross-reactivity exists between the bone variant and isoforms from other tissues.
OC is the most abundant noncollagenous protein present in the bone matrix. It is a small hydroxyapatite-binding protein synthesized by osteoblasts. OC in the circulation may originate from newly synthetized OC generated during bone formation and also from OC released from the matrix during bone resorption; therefore, OC is regarded as a marker of bone turnover, influenced by both bone synthesis and resorption. This protein degrades rapidly in vivo and ex vivo. The intact protein and several OC fragments coexist in the circulation. The mid-fragment (mid-OC) has been reported to be more stable than intact OC.
Type I collagen is synthesized by osteoblasts as a large precursor protein termed procollagen I. Amino (N-) and carboxy (C-) terminal extension peptides are removed from procollagen type I during extracellular collagen maturation prior to incorporation of type I collagen into the bone matrix. The two procollagen peptides are termed aminoterminal type I procollagen propeptide (PINP) and carboxyterminal type I procollagen propeptide (PICP). PINP appears to be the more sensitive marker of bone formation in most species compared to PICP.
Markers of Bone Resorption
Bone resorption markers mainly reflect collagen degradation. Collagen degradation products involving the cross-link site are considered to be the best indices for assessing bone resorption. The hydroxypyridinium cross-links of collagen, such as DPD, are frequently used; pyridinoline (PYR) has also been used as a resorption marker. These are formed during the extracellular maturation of fibrillar collagen and are released upon the degradation of the matrix from various skeletal tissues. DPD is found in bone and dentin only, while PYR is present in cartilage, tendons, ligaments, and blood vessels. Approximately 60% of circulating DPD is bound to protein, and the remaining 40% is free in the plasma. Immunoassays are currently used to measure the free forms (especially for urinary DPD). Type I collagen telopeptide for the amino (NTx-I) and carboxyl (CTx-I) termini are also released upon degradation of type I collagen by osteoclasts. PYR cross-linked carboxyterminal telopeptide of type I collagen is used much less often used than CTx-I or NTx-I, but it is generated by the direct action of matrix metalloproteinases and therefore may be a useful marker in malignant bone disease. These small proteins related to type I collagen are highly bone-specific measures of collagen turnover because osteoclasts are not active in the degradation of other type I collagen-containing tissues, making these biomarkers excellent indicators of bone resorption. Tartrate-resistant acid phosphatase (TRACP) is an enzyme that is expressed by activated (bone resorbing) osteoclasts but also by inflammatory macrophages and dendritic cells. Vesicles containing TRACP secrete their acidic contents into resorption lacuna. This environment optimizes the activity of cathepsin K, an osteoclast enzyme required to initiate degradation of the organic bone matrix. Two TRACP forms circulate in blood, the 5a isoform derived from macrophages and dendritic cells and the 5b variant derived from osteoclasts. TRACP-5b is specific for osteoclasts and is a quantitative marker of osteoclast numbers and collective activity.
The pattern of response of the different markers will depend on the mechanism of action of the drug or the model assessed. The effect of ovariectomy (OVX) is characterized by an important increase in bone markers illustrating the high bone turnover (Smith et al. 2003). With bisphosphonate such as ibandronate, a decrease in bone marker concentrations is observed. With bisphosphonates, differences in formation and resorption markers behavior are observed with higher and earlier variations in bone resorption markers because of the mode of action of these compounds (Smith et al. 2003). As the opposite, anabolic agents such as parathyroid hormone (PTH) increase formation markers greater than resorption markers and greater than the OVX controls (Fox, Miller, Newman, Turner, et al. 2007).
Serum calcium levels are regulated closely by homeostatic control mechanisms and thus usually are within normal range, unless there is a serious disturbance in the homeostatic mechanisms. Since half of the serum calcium is bound to protein, unbound ionized calcium (Ca++) should be measured or total serum calcium concentrations should be corrected for serum protein levels. Elevations in serum protein or pH increase the protein-bound fraction of calcium and can produce a false hypercalcemia or can mask a true hypocalcemia. Serum phosphorus levels fluctuate more readily than does the serum calcium concentration, with phosphorus levels varying based on dietary intake, release from bone, and urinary excretion. Elevated phosphorus levels temporarily depress serum calcium and lead to PTH secretion. Additional parameters such as hormones related to calcium metabolism (e.g., calcitonin, PTH, and 1,25-dihydroxyvitamin D3) are also important parameters to characterize the effect of treatment, depending on the pharmacology of the tested compound.
The use of analytical methods for bone biomarkers in different species requires careful consideration of cross-reactivity and specificity and thus draws attention to the need for suitable validation procedures. Interpretation of bone markers must take into account the multiple sources of variability for these markers. Sources of preanalytical and analytical variability include the marker and the measurement method as well as animal-specific attributes such as species, strain, age, gender, intercurrent disease, and physiological status (e.g., fasting vs. fed, stage of the estrous/menstrual cycle, and diurnal variation). The storage conditions for samples and the type of assays also must be considered as potential sources of variation. The collection of blood during nonclinical studies should be performed under standardized conditions across all subjects, preferably in the morning (before 10:00 a.m.), as there are marked circadian variations in biomarker concentrations (Szulc, Bauer, and Eastell 2013).
Skeletal Imaging
Imaging sciences have incredibly advanced during the last decades from two-dimension to three-dimension techniques and from anatomical to quantitative applications, and many techniques, such as CT, have become indispensable. The applications of in vivo translational imaging are now extending further into drug discovery and development and have the potential to considerably accelerate the process, reduce the cost, significantly affect the drug development process, and comply with the 3Rs (replacement, reduction, and refinement) as noninvasive techniques. It is important to understand the technologies, their applications, and limitations. BMD can be evaluated in vivo or ex vivo using DXA and/or pQCT or by micro-CT. Finite element analysis (FEA) of CT scans even allows prediction of bone strength, reaching another level in noninvasive bone assessment.
In vivo Standard Radiology
Radiology remains an essential tool of skeletal evaluation and provides a simple and commonly available technology, although it requires a skilled and experienced veterinarian or veterinary radiologist. It is a straightforward mean for examining the size, shape, and overall density of the entire bony skeleton or large subdivisions thereof, in a stereotypical orientation. Radiographs can help to define whether or not a lesion causing clinical signs of local lameness is actually part of a systemic disease process. Radiological diagnosis can effectively support histological diagnosis and often is helpful in pinpointing the bone locations with abnormalities that should be examined histologically.
Radiography is the method of choice to scan the entire skeleton in vivo of small animals over the course of the study and before scheduled termination to detect any lesions at skeletal sites that are not routinely harvested and that would not have been detected otherwise. Radiographic data are of particular importance for carcinogenicity studies (Jolette et al. 2006; Jolette et al. 2017; Figure 2) but also are warranted in subchronic and chronic nonclinical studies when direct or indirect effects on bone tissue are suspected. In large animals, pretreatment radiographs will show any preexisting bone lesions. Radiographs also can be performed ex vivo on skeletal segments. High-resolution cabinet radiography systems constitute an additional tool for imaging mice in vivo or excised small segments or carcasses at necropsy. Such benchtop units allow magnification of up to fivefold for the evaluation of specific skeletal regions in rodents.
Occult bone production detected radiologically in the axial skeleton of a rat (A, black arrows) and corresponding microscopic findings (B) of an occult osteosarcoma affecting the last cervical vertebral body and spinous process, which compresses the spinal cord, hematoxylin, and eosin. Reproduced with permission from Gunson, Gropp, and Varela (2013).
Longitudinal evaluations of skeletal development and growth plate assessment are keys in juvenile toxicology studies. Serial radiographs obtained at intervals in growing animals provide an accurate record from which to measure bone growth in rodents (Pouliot et al. 2013) and nonrodents (Boyce et al. 2014) and assess epiphyseal closure. A calibrated measuring device is included in the radiograph digital system to facilitate measurements. Measurements of long bones (femur and/or tibia, length, and diameter) and the spine (lumbar vertebrae) provide a good estimation of the skeletal growth. Other sites can be included if specific targets are known. Precise anatomical landmarks need to be defined for measurements to obtain reproducible results (reproducibility with coefficient of variation below 2%). Physeal closure occurs at different ages depending on the species, sex, and bone site due to different patterns of development and growth (Varela 2017). The sequence of growth plate closure is generally similar in mammals (Geiger et al. 2014). The physis of the tibial crest and distal ulna is generally the latest to close. In rodents, the physis does not close until old age at certain sites such as the distal femur, proximal tibia, distal radius, and ulna; however, growth stops and the physes become inactive after 6 to 7 months (Walker and Kember 1972; Roach et al. 2003; Martin, Ritman, and Turner 2003). Bone formation and bridges forming in the physis prevent any further growth even if the physis is present. The rapid phase of growth occurs before 3 months of age.
Osteodensitometry—DXA
DXA is a well-established technology for osteodensitometry in humans and animals (FDA 2016). It is widely used in clinical trials and preclinical studies because it is the approved diagnostic tool for osteoporosis, the radiation dose is low, the precision is good, it is relatively inexpensive and available, and scan times are short. Despite the development of new technologies, DXA remains one of the main osteodensitometry techniques because of its role in the diagnosis of osteoporosis, fracture risk assessment, and monitoring treatment response in humans (ISCD 2015; NOF 2014; Blake, Adams, and Bishop 2013). DXA allows a two-dimensional (2-D) measurement of apparent areal bone mineral density (aBMD in grams per square centimeter). The attenuation of two different photon energy X-ray beams is measured. Machines are calibrated based on two materials of defined composition, one mineral (hydroxyapatite, Ca5(PO4)3 OH) and a homogeneous soft tissue of a set area adjacent to the bone area. The bone mapping is performed by edge detection within the region of interest (ROI), defining the bone area in square centimeter (except for the whole body for which the total body area is measured). Each pixel BMD is average to calculate the aBMD, then the BMC is calculated, measuring the total hydroxyapatite, Ca5(PO4)3 OH, mass in the bone ROI. It provides an assessment of bone mass and density at the entire skeleton level (whole body) and large areas of the skeleton at clinical relevant sites (i.e., lumbar vertebrae, femur, proximal femur, distal femur, distal radius, and proximal tibia; Figure 3), but DXA does not distinguish between cortical and trabecular bone. Whole body and regional scans are also used to study body composition (whole body and regional body) by measuring lean and fat mass (Schoeller et al. 2005).
Dual-energy X-ray absorptiometry scan images of the rat whole body (A), lumbar spine (L1–L4; B), and proximal femur/hip (C) in nonhuman primates. Body mass density is obtained for the entire skeleton or specific regions. Positioning of the animals, placement and size of region of interest, and analysis mode are key elements for precise and standardize procedures. Modified with permission from Varela. (2017).
In preclinical studies, in vivo DXA is a good tool for prediction of clinical trial outcome (Smith, Varela, and Jolette 2011; Fox, Miller, Newman, Turner, 2007, Fox, Miller, Newman, Recker, et al. 2007; Ominsky et al. 2011; Kumar et al. 2013). Longitudinal assessment in anesthetized animals from baseline allows a powerful evaluation of individual changes over time, especially in nonrodent species. In preclinical studies, standardized procedures and good precision of machines and qualified operators are very important. Precision errors (typically 1–2% coefficient of variation) are very small in laboratory animals and comparable to human studies (Shepherd et al. 2006; ISCD 2015). Accuracy errors that may impact individual scans in humans (Blake and Fogelman 2008) have less relevance in controlled longitudinal preclinical studies unless changes in body weight and/or body composition occur over time or versus controls. However, the limitations and disadvantages of DXA as an investigational tool are well known: the 2-D projection of a three-dimensional (3-D) structure (effect of bone size and shape), the inability to make geometrical evaluations and to discriminate effects upon the trabecular and cortical bone compartments. Furthermore, DXA does not take into account the effects of body size and composition on the BMD measurement and is unable to differentiate low bone mass due to osteomalacia or osteoporosis (Bolotin 2007). In juvenile populations, interpretation of results should take into account the effects of bone size and shape; the lower DXA BMD values observed in animals with growth retardation may only reflect smaller bones rather than a true effect on BMD (Binkovitz and Henwood 2007). The conversion of X-ray attenuation to BMD values depends on quantity and composition of bone marrow and surrounding soft tissues (Blake and Fogelman 2008; Yu et al. 2012). Interpretation of data should take into account the normal variability in bone measures especially in nonrodents, the gender, age, species and strain, and body composition.
In preclinical toxicology studies, DXA is an easy and effective technique to monitor the response to treatment, either positive or negative effects on bone mass, for compounds such as corticosteroids, vitamin A and retinoic acids (Rohde and DeLuca 2003), peroxisome proliferator-activated receptor-Ɣ (PPAR Ɣ) agonist (Lazarenko et al. 2007; Kumar et al. 2013; Figure 4), and Fibroblast Growth Factor 21. The proton-pump inhibitors, such as omeprazole, reduced bone density as measured by DXA in animals (Cui et al. 2001) and humans (Bahtiri et al. 2016). Fluoxetine decreases BMD in juvenile mice and is known to increase fracture risk in humans (Vestergaard, Rejnmark, and Mosekilde 2008).
Changes over time (as percentage change from baseline) in bone mineral content (BMC, left) and bone mineral density (BMD, right) for lumbar spine and humerus as measured by dual-energy X-ray absorptiometry during the treatment phase in rats administered different doses of rosiglitazone, a PPAR Ɣ agonist. Changes in bone parameters associated with RSG administration are reversible on treatment cessation or preventable by coadministration with an antiresorptive agent, Alendronate. Significantly different from OVX group value: *p ≤ .05. Modified from Kumar et al. (2013). OVX = ovariectomized, PPAR Ɣ = peroxisome proliferator-activated receptor Ɣ, RSG = rosiglitazone.
In juvenile toxicology studies, DXA allows to evaluate bone size in two dimensions and bone mass. aBMD increases with height and weight during skeletal growth in young animals. DXA does not measure the true volumetric bone density but a part of the bone size and mass. Bone size is important to assess skeletal growth and development in juvenile toxicology studies (de Mello et al. 2012; Pouliot et al. 2013). Adjustment for weight, height, and bone area and size can be done to further discriminate changes in body size and overall growth versus a direct effect on bone.
Despite the known limitations of DXA, correlation with bone strength is very good and it remains an important densitometry tool to measure the entire skeleton or large segment of it.
Osteodensitometry—pQCT
pQCT is frequently used in preclinical studies and clinical trials to complement DXA measurements. DXA scanning permits evaluations of the entire body and large areas of the skeleton, whereas pQCT scans provide information from a single (or multiple) slice(s) of bone at specific skeletal areas, normally the proximal tibia and distal radius. It allows the separation of the trabecular and cortical regions for compartment-specific measurements and as well the analysis of geometric parameters (typically at the diaphysis). As a 3-D CT technique, pQCT scans measure a true volumetric BMD and geometric measurements include periosteal circumference, endocortical circumference, and cortical thickness. The ability to analyze the trabecular bone compartment and quantify bone geometry increases the sensitivity of in vivo monitoring, allowing differentiation of treatment-induced changes in the cortical and trabecular compartments, treatment effects on cortical thickness and density. Analysis is routinely undertaken at the proximal tibia and distal radius, which are the locations also evaluated in humans. Reference phantoms are scanned as quality controls. Typical single-slice pQCT X-ray tubes have 0.2 to 0.8 or 1-mm slice thickness in plane pixel sizes of 100 to 300 μm. BMD and other parameters are measured at the metaphysis (at a specific percentage of the total bone length, mostly trabecular) and at a more diaphyseal location (cortical site). As with any other CT technology, the partial volume effect is important to consider (Zemel, et al. 2008) to avoid any underestimation of density measurement. Specific scan settings, placement of the slice, the volume of interest, and parameters of analysis are crucial for sound evaluation. pQCT is less affected by size, but it is sensitive to bone marrow changes and the amount of fat in the marrow cavity (Glüer and Genant 1989). pQCT may not provide the complete answer because it is not possible to distinguish low bone organ density from low tissue mineralization (e.g., in rickets).
pQCT is largely used in preclinical studies to evaluate the effect of bone agents on bone mass and geometry (Smith, Varela, and Jolette 2011; Fox, Miller, Newman, Turner, et al. 2007, Fox, Miller, Newman, Recker, et al. 2007; Ominsky et al. 2011). The techniques have also been used to study a variety of test article-related effects on bone such as corticosteroids (Ferretti et al. 1995) and PPAR Ɣ agonists (Kumar et al. 2013) or when test compounds are given at doses which result in exaggerated pharmacology impacting the skeleton (Boyce et al. 2014; Figures 5 and 6).

Representative peripheral quantitative computed tomography scans of the lumbar vertebra (A), femur distal metaphysis (B), and diaphysis (C), in control (first column) and in utero denosumab-exposed cynomolgus monkey infants at birth day (BD) 1 (second column). At BD1, bone mass was increased at the distal femur metaphysis and lumbar vertebra in the denosumab-exposed group (note the denser aspect of the trabecular compartment, white and/or blue, the increased femoral metaphysis cross-sectional area, reflecting the metaphyseal flaring that occurred with denosumab exposure). At the femur diaphysis, the thickness of the cortex was increased in association with a marked decrease in endosteal circumference, but the cortical density was decreased (due to the presence of primary spongiosa in the marrow canal). Color scale ranging from 0 to 700 mg/cm3 of hydroxyapatite illustrates bone mineral density on the scans. Modified with permission from Boyce et al. (2014).
Representative peripheral quantitative computed tomography images of femoral metaphysis (left) and correlative histology findings of collateral distal femur (right) from male rats at 0 (A, B), 3 (C, D), and 50 (E, F) mg/kg of Romosozumab, a humanized immunoglobulin G2 monoclonal antisclerostin antibody. The metaphyseal transverse slice was obtained at a position 15% of the total femur length proximal to the distal end of the femur. Color scale ranging from 0 to 700 mg/cm3 of hydroxyapatite illustrates bone mineral density on the scans. Modified with permission from Chouinard et al. (2016).
In juvenile toxicology studies, pQCT provides an important asset to assess skeletal growth and development in measuring bone size and geometry and bone mass accrual (Pouliot et al. 2013; Boyce et al. 2014; Figure 6).
Micro-CT and HR-pQCT
Skeletal imaging has passed to the 21st century with the development of high-resolution micro-CT. Compared to pQCT, micro-CT provides an enhanced resolution because of a microfocus X-ray tube and therefore can provide volumetric measurements of bone microstructure (trabecular architecture: relative bone volume, trabecular number, trabecular surface area, trabecular thickness, and trabecular separation), cortical porosity and geometry, and the volumetric/apparent and tissue BMD for both cortical and trabecular bone compartments (Bouxsein et al. 2010). Some of these static parameters have been historically measured in 2-D with histomorphometry, but micro-CT gives a unique opportunity to evaluate an entire volume with additional architectural parameters (trabeculae shape, plate-like or rod-like, connectivity, and the degree of anisotropy of the bone meshwork). For BMD assessment, calibration using an appropriate phantom of known density is required to convert pixel brightness values on the CT image to a measure of mineral density (typically milligram per cubic centimeter of calcium hydroxyapatite). Thus, micro-CT is a powerful new tool to assess changes in bone microarchitecture in 3-D over relatively large regions and provides a greater sensitivity than is possible with conventional 2-D static histomorphometry (Figure 7). In vivo, micro-CT allows precise measurements of bone mass and architecture (Boyd et al. 2006). Scanning is rapid, allowing high throughput of specimens. In proof-of-concept studies, trabecular architecture or cortical porosity parameters can be reported quickly for more timely strategic decision-making in early drug development and also provide key translational information for bone quality assessment in later stage development (Fox et al. 2008). Additionally, evaluation of bone tissue mineral density (TMD) can provide important information on the mineralization processes and bone biomechanics (Kazakia et al. 2008).
Comparison of static histomorphometry (left column, modified Goldner’s trichrome stain) with high-resolution micro-computed tomography (micro-CT) in two (2-D, middle column) or three (3-D, right column) dimensions as tools for assessing bone microarchitecture in Sprague-Dawley rats. Relative to an age-matched sham control animal (A), an osteopenic male rat due to orchidectomy (B) has fewer trabeculae in both 2-D and 3-D representations. Note the similarities of the trabecular representations for histomorphometry and 2-D micro-CT of the proximal tibia (coronal orientation). Reproduced with permission from Gunson, Gropp, and Varela (2013).
Recently, a multislice HR-pQCT or Xtreme CT device has been marketed for clinical research. This in vivo micro-CT scanner allows fast scanning time while reaching an isotropic voxel size and slice thickness of 30 μm (82 μm used in humans), sufficient to depict microarchitecture assessment over time in large animals. Measurements are obtained at the distal radius or the distal tibia within a large region of 10 mm length approximately depending on the scan setting. The precision of densitometric variables is high (MacNeil and Boyd 2008), except for cortical porosity due to the minimal voxel size reached. Cortical porosity and TMD can be biased by partial volume effects. In drug development, HR-pQCT has been used to assess efficacy and safety; antisclerostin antibody was shown to improve bone mass and strength while maintaining bone quality in nonhuman primate (NHP; Ominsky et al. 2017). HR-pQCT also provided bone liability information; decreases in bone mass and related bone strength were reported with exemestane, an oral steroid aromatase inhibitor (Cheung et al. 2012). CT and micro-CT allow to reach another level in bone noninvasive assessment with FEA used to predict biomechanical strength of the bone. As in clinical studies, FEA developed from CT images of bones are useful in preclinical rodent studies assessing treatment effects on bone strength in rodents (Nyman et al. 2015) and in NHPs (Jayakar et al. 2012; Cabal et al. 2013).
Histomorphometry
Bone histomorphometry is an important tool for assessing changes in bone tissue, such as bone formation, mineralization, and resorption, and to characterize the mechanisms by which a test article acts on bone. Bone histomorphometry provides valuable information about bone structure, bone formation, bone resorption, bone mineralization, and bone modeling and remodeling activity. Bone histomorphometry nomenclature has been standardized (Parfitt et al. 1987; Dempster et al. 2013).
Decalcification precludes the evaluation of osteoid and fluorochrome labels, consequently undecalcified plastic-embedded sections are required for bone histomorphometry (Erben et al. 2017). After fixation for few days (2–4 days) in 10% neutral-buffered formalin, the specimens need to be transferred in 40% to 70% ethanol because the latter fixation preserves fluorochrome labels. Otherwise, the bone mineral and associated fluorochrome labels will eventually leach out into the formaldehyde-based fixative. Bone embedding is best carried out in methyl methacrylate. This is a time-consuming process, but it allows to consistently prepare the high-quality undecalcified histologic sections that are needed for histomorphometry. For cancellous bone evaluation, consecutively stained and unstained sections, typically 5 to 7 µm thick and cut with a rotary or sledge microtome, are prepared. The Goldner’s trichrome method is preferred as general purpose stain in most species. For rodents, the von Kossa method counterstained with McNeal’s tetrachrome is a commonly used alternative stain. For cortical bone evaluation, 20- to 80-µm thick microground unstained cross sections are generally measured; alternatively, measurements may also be drawn from lightly stained toluidine blue or Stevenel’s blue sections.
The size and location of the ROI to quantify the cancellous bone should be chosen with care. Standard sites in rats and nonrodent species are the proximal tibial metaphysis and lumbar vertebral bodies. In mice, typical sites are the distal femoral metaphysis and the lumbar vertebral bodies. The amount of bone measured depends on the species, age, sex, and bone site. For example, while all trabecular bone in a rat vertebra may be measured, only a few (but larger) regions of a vertebra from a large animal are evaluated. The area examined may range from a few square millimeter (in a mouse) to upward of 30 mm2 (in NHP). Structural parameters are directly measured such as total tissue area, bone area, and bone surface (Figure 8). Several parameters that describe the shape and/or connectivity of bone are calculated from these primary measurements (Dempster et al. 2013; Erben and Glosmann 2012). Calculation of trabecular number, trabecular thickness, and trabecular separation from 2-D images assumes that the bone structure is a series of parallel plates (Parfitt et al. 1987), which may differ from direct micro-CT 3-D directly derived architectural measurements. For cortical bone, the standard site is the tibial shaft proximal to the insertion of the fibula in rat, the mid-shaft femur in mice, and mid-shaft of femur, tibia, radius, and/or rib in monkeys. Evaluations of the endocortex and periosteum are conducted as separate analysis in all species. In addition, the intracortical compartment is analyzed separately in nonrodent species. Structural parameters, cross-sectional area, cortical area, marrow area, cortical thickness, and number and area of intracortical pores can be directly measured by histomorphometry (Figure 9). The relative values for cortical and marrow areas, in percentage, and intracortical pore area can be derived from the primary parameters.
Cancellous bone histomorphometry: selected structural parameters measured in the central secondary spongiosa of the proximal tibia in a cynomogus monkey. The area confined within the closed rectangle is used for measurements (A). The bone area (red overlay) is shown in (B), and segmented perimeters of osteoblasts (pink line), osteoid (yellow lines), osteoclast (green line), and quiescent or resting perimeter (blue lines) are indicated in (C). Osteoid area and osteoid widths are traced in D. Modified Goldner’s trichrome stain.

Ground and unstained transverse sections of ribs used for dynamic histomorphometry of cortical bone from aged female Macaca fascicularis that were labeled in vivo with tetracycline 15 and 5 day prior to biopsy sampling. The effects of ovariectomy (B) compared to sham operation (A) include an increased Haversian porosity with increased tetracycline (yellow) labeling at both Haversian and endocortical surfaces. Modified from Ominsky et al. (2011, figure 2).
Dynamic bone histomorphometry is critical to assess bone turnover and mineralization in trabecular or cortical bone. Fluorochrome labels are calcium chelators that can be administered during a study if effects upon bone formation are suspected. In nonclinical studies, injectable fluorochromes, including calcein green (routinely) and alizarin complexone (red), are more frequently used than tetracyclines. Injections of fluorochrome label are usually performed on at least 2 occasions prior to bone harvesting. For cancellous bone evaluation, a 10-day interval (15 and 5 days before bone sampling) and a 5-day interval (8 and 3 days before bone sampling) between injections are best suited for the adult NHP and rat, respectively (Erben R. G. 2003). The quantification of fluorochrome label perimeters allows to calculate the mineralizing surface (MS/BS), which has a higher sensitivity to assess bone formation compared to osteoblast-derived parameters. MS/BS is the percentage of bone surfaces covered in double and/or single labels, calculated either using the double-labeled perimeter or the double-labeled perimeter plus the half of the single-labeled perimeter, and expressed as the percentage of bone surfaces covered with labels. Measurement of the average distance between two labels divided by the number of days between administrations of the two fluorochromes allows to calculate the mineral apposition rate (MAR). The quantification of MS/BS and MAR allows calculation of the bone formation rate, a key parameter to quantify bone formation. Using undecalcified sections, osteoid can be measured for average width, relative area, and perimeter relative to the total bone perimeter. These values are important to diagnose a mineralization defect (Figures 10 and 11).
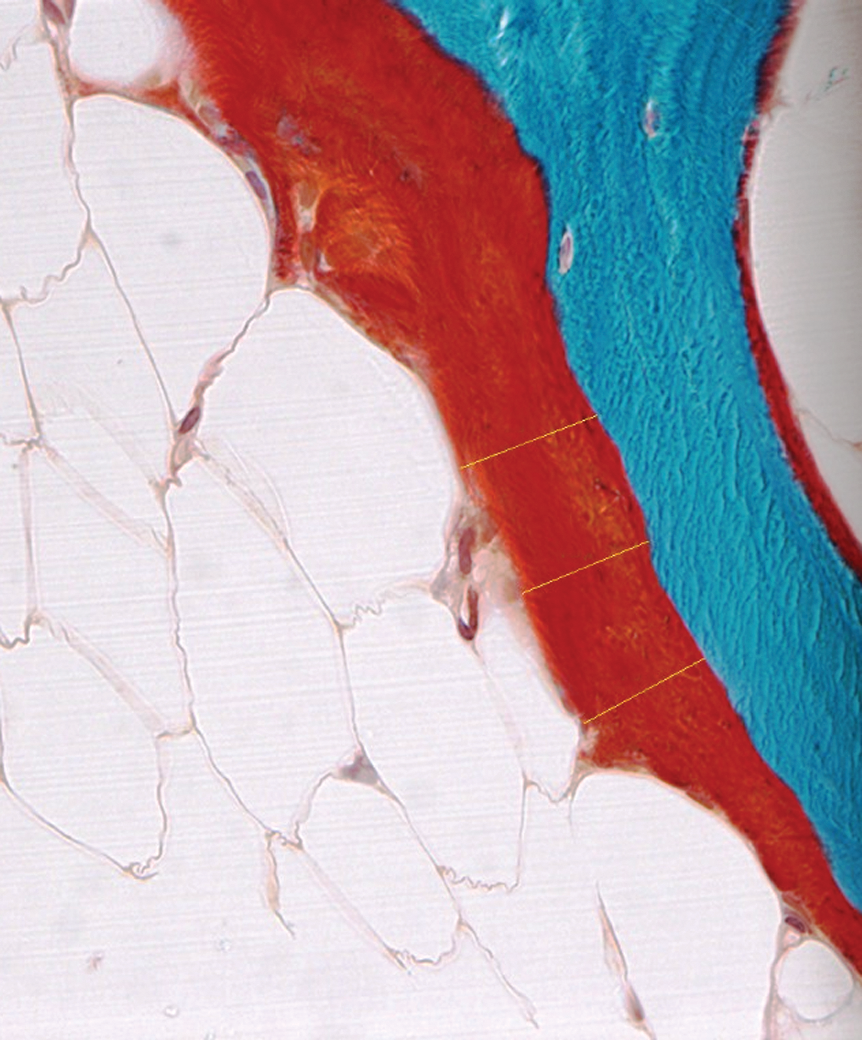
Tibial cancellous bone from a cynomolgus monkey. Defective mineralization is best assessed with an undecalcified section such as this one stained with the modified Goldner’s trichrome method. Note the thick osteoid seam, which stains red, particularly on the left side of the trabecula and some tracings (yellow lines) to measure the osteoid widths.
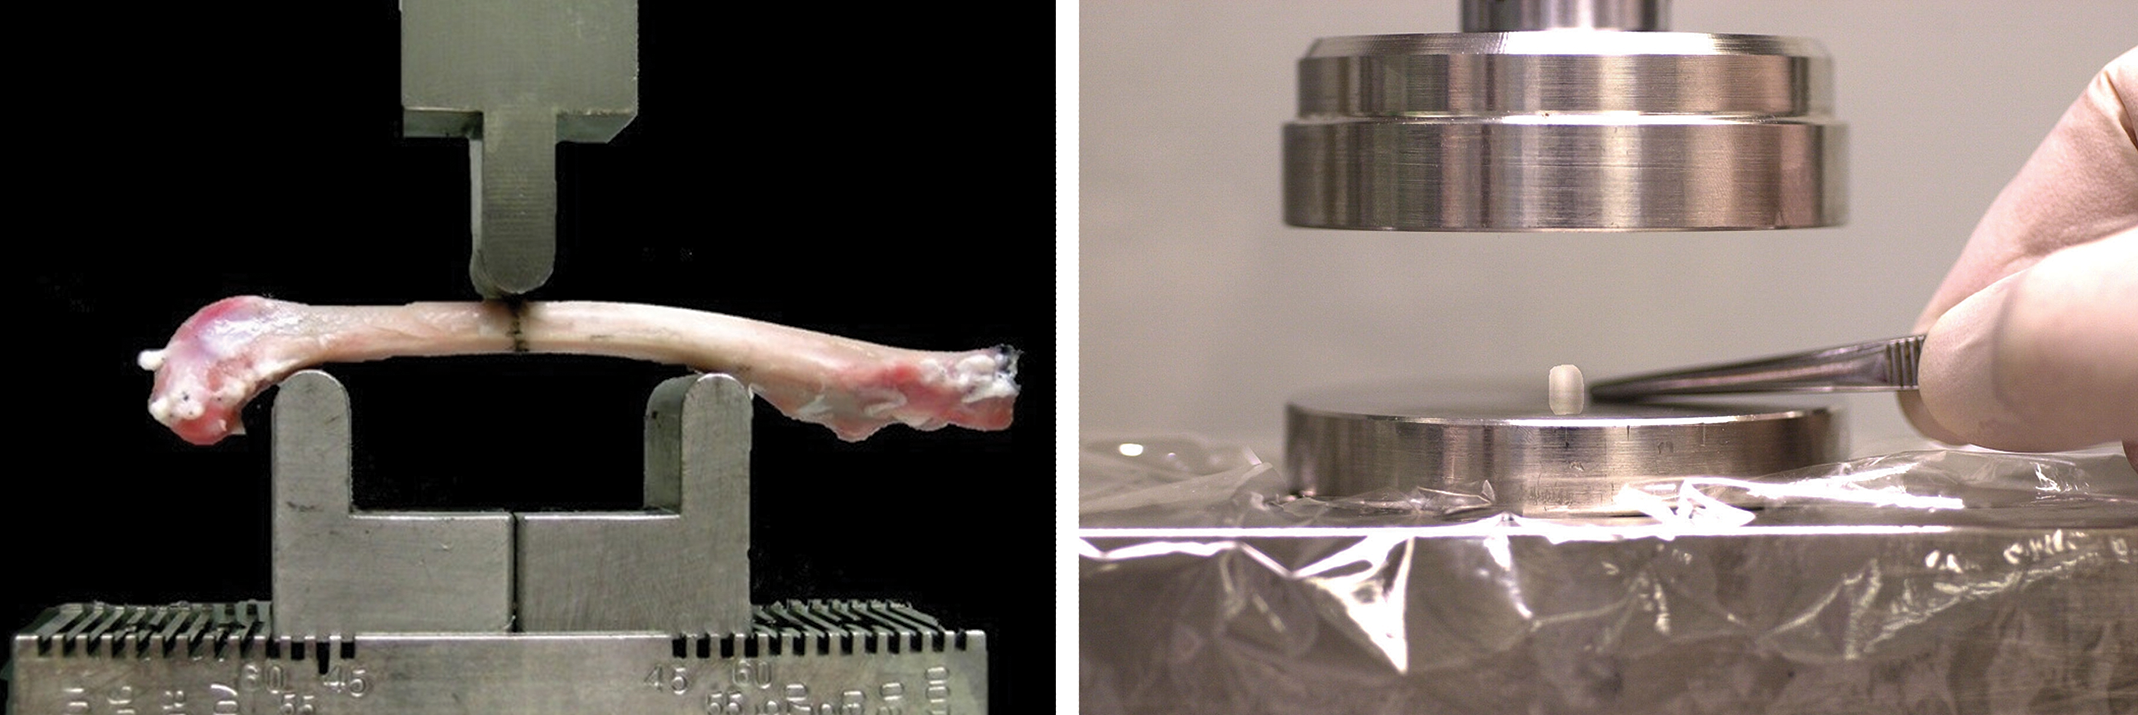
Biomechanical testing showing the general test fixture for nonhuman primate long bone 3-point bending (left panel) and test setup for rat vertebral body compression (right panel). Specimens are positioned such that bone rests in contact with and as level as possible on the lower span supports. Load is applied through the upper testing nose at a constant axial displacement rate.
Other parameters commonly evaluated on stained undecalcified sections include osteoclast numbers and/or surfaces and/or erosion surface. Porosity is an additional parameter evaluated by measuring the relative area of pores in the cortical bone compartment and expressed as percentage of cortical bone area.
Many other parameters may be derived including some that are related to the kinetics of bone remodeling, longitudinal bone growth, and epiphyseal plate thickness. For details, the interested reader is referred to another publication that reviews the application of bone histomorphometry in the context of safety assessment (Erben et al. 2017)
Biomechanical Testing
Bone strength constitutes a critical end point in skeletal assessment, serving as the gold standard of bone quality (Turner 2002). Biomechanical testing of bone constitutes the unique opportunity to evaluate the functional impact of alterations in bone turnover, bone mass, and bone geometry. Correlations between biomechanical measurements and bone densitometry parameters provide important insights into the effects of drug treatment on bone quality.
The mechanical competency of a bone depends on multiple factors. These include the direction and magnitude of forces applied, the bone geometry (dimension and shape), and its material properties. Destructive static tests, where the force is applied slowly and gradually until the bone breaks, are most commonly used for animal models and drug testing. To study basic physiology, exercise, and orthopedic applications, dynamic tests are a more common choice. For dynamic testing, the force commonly is applied quickly (as on impact), but fatigue testing (in which cyclic loads as a function of time are applied) also can be useful. Biomechanical strength testing of long bones (in 3- or 4-point bending or in torsion about the long axis), the femoral neck (via shear), and vertebrae (by compression; Turner and Burr 1993) can be performed to evaluate whether or not treatment has affected any of the properties that define bone strength (Figure 12). Four-point bending and torsion testing are frequently used for fracture healing studies. In compression, an axial and vertical force is applied homogeneously on parallel surfaces of a specimen of cylindrical shape and a length of up to twice its width. Bending tests are the most common and simple tests for long bones. In these methods, the extremities of a specimen are laid on two metallic supports and a progressive vertical force is applied in its center via one or two other points. In four-point bending, stresses are more evenly distributed over the length of the specimen. The proximal femur is tested with the femoral neck shear testing, where the vertical force is applied on the top of the femoral head. Positioning of the femoral shaft vertically (i.e., in a single-legged stance) can be achieved with a special fixture or by embedding the distal aspect of the specimen in a hard medium, like methyl methacrylate. Basically, testing machines have two vertical aligned parts with one part moving at a chosen speed, applying a force to a specimen for which the displacement is recorded until the bone fails. The load transmitted through the specimen until failure is recorded by a transducer interposed in the system, the load cell. Software derives the displacement versus force curves, generating for most biological specimens a typical curve profile (Figure 12).
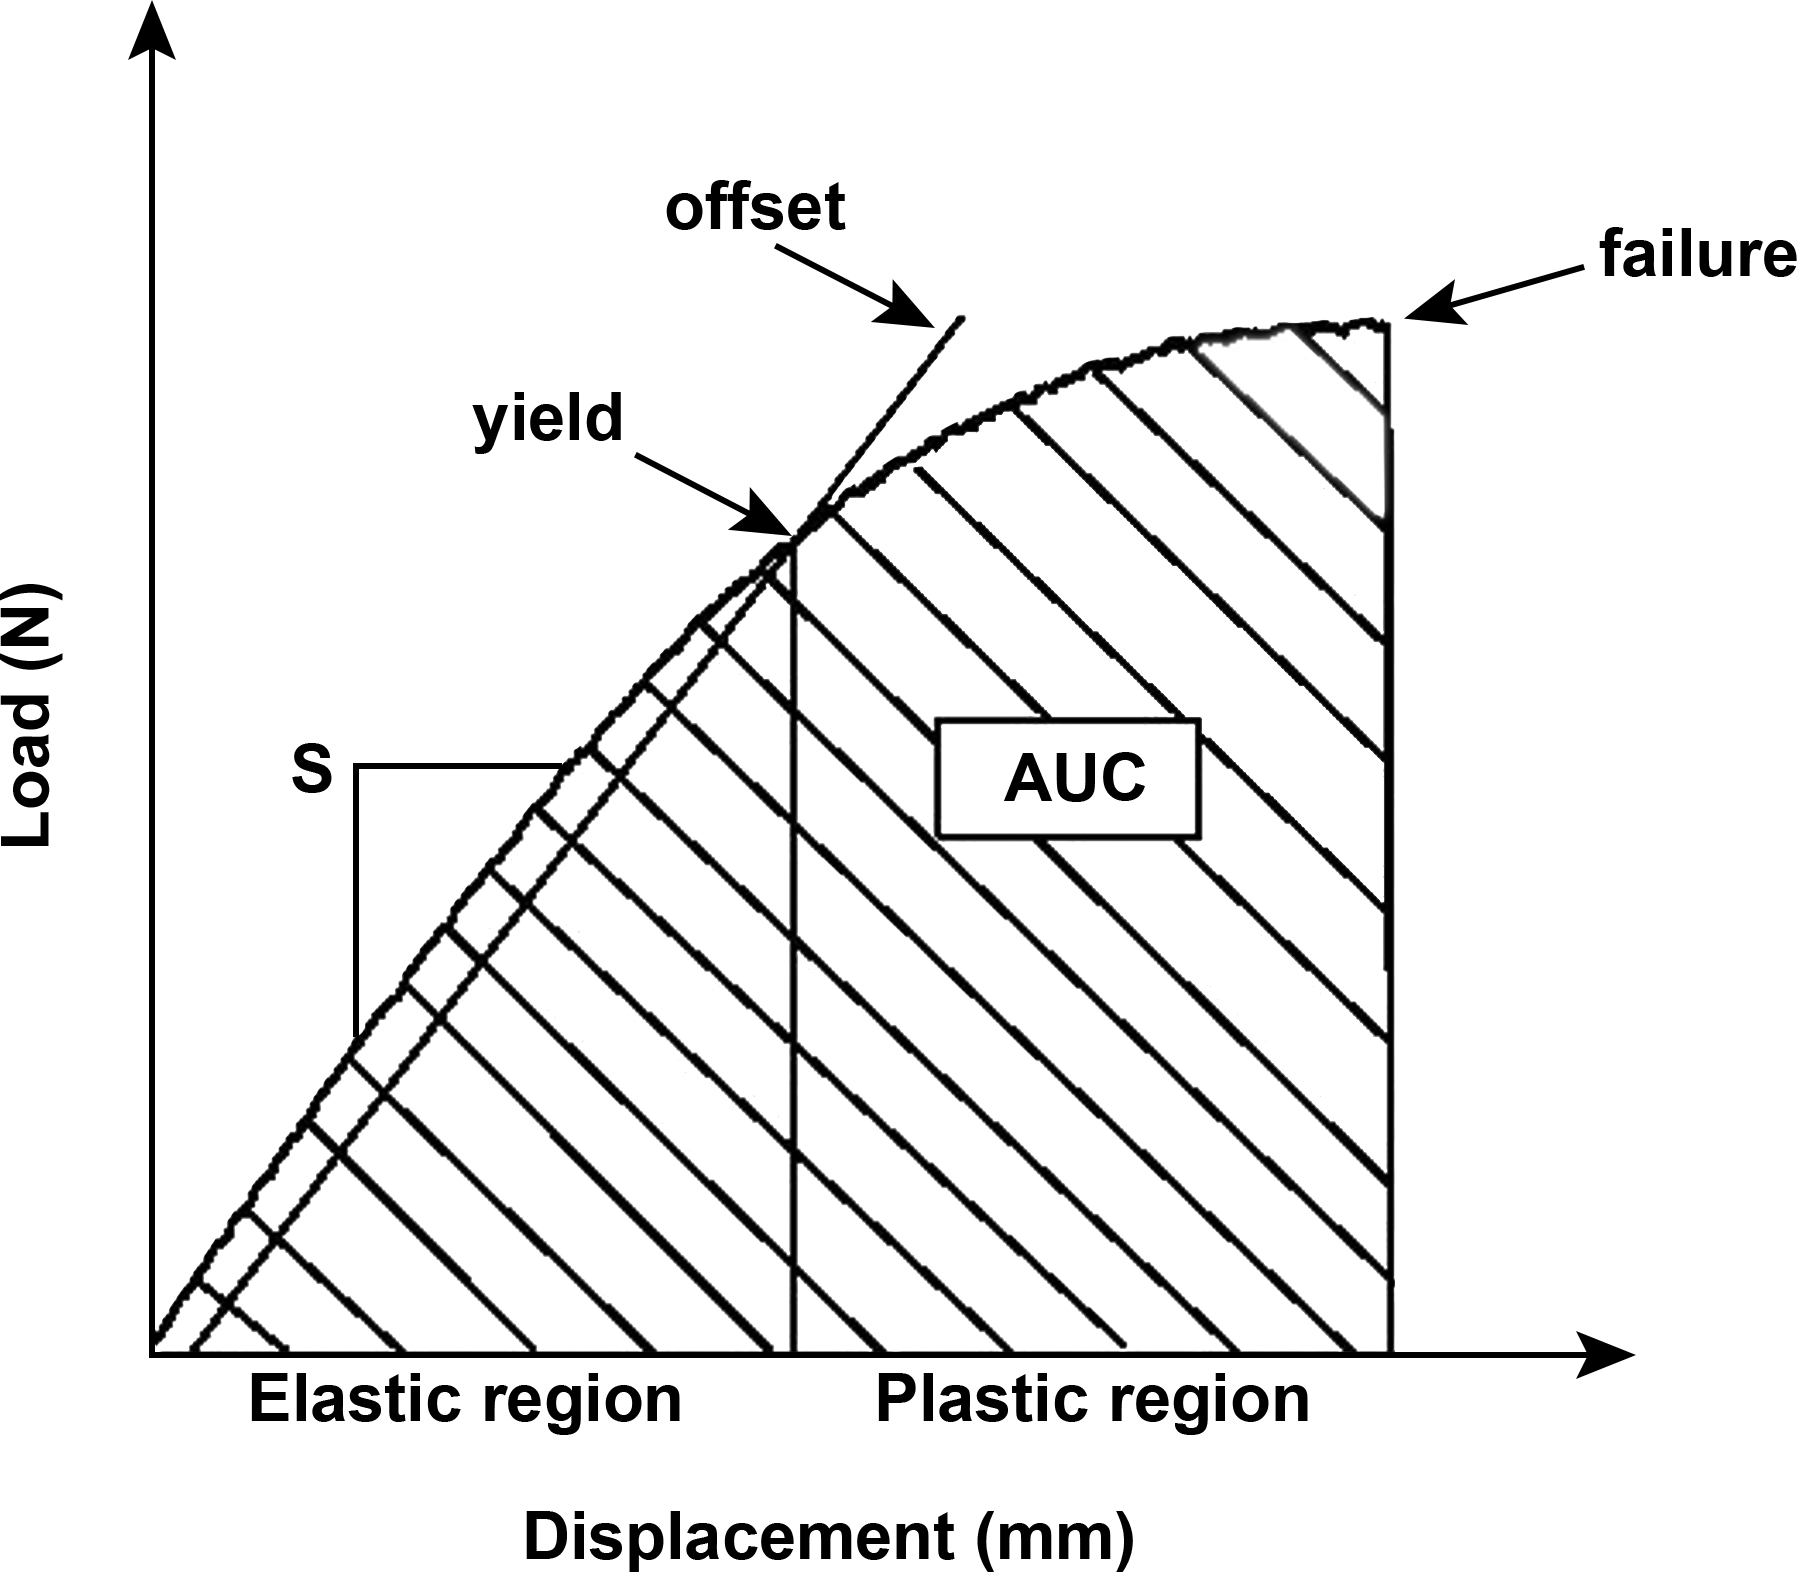
Theoretical load/displacement curves from biomechanical testing of bone specimens. The initial linear region (lower left) is called the elastic region because of the linear correspondence between the displacement and the force. In this phase, if the load is removed, the specimen will resume its initial shape due to the inherent elastic properties of the material. The slope of the curve in the elastic region defines the stiffness (S). The plastic region is defined by the inflection (yield) point where withdrawal of a heavy load results in incomplete restoration of the initial shape due to permanent damage to the specimen. The yield point can be defined as the point where the curve becomes nonlinear or by an offset method using a line parallel to the linear portion of the curve that is offset by .03 to .2% strain. The failure is the load that causes the specimen to break, while the area under the curve represents the cumulative amount of energy required to elicit failure. Load in newton (N). Reproduced with permission from Gunson, Gropp, and Varela (2013).
End points include the force to failure (or peak load), stiffness (extrinsic rigidity of the specimen), and the cumulative energy required to break a bone (area under the curve [AUC]). Data are normalized for bone size, and calculations of parameters independent of the size of the specimens can be made using the cross-sectional moment of inertia obtained by pQCT scans: ultimate stress, modulus (intrinsic rigidity of the material when data are corrected for the specimen size), and toughness (a property relating material characteristics to energy absorption, i.e., the AUC corrected for the size of the specimen). Testing of machined cortical (milled cortical beams) or trabecular (vertebral core) specimens from large animals permits specific measurements of intrinsic material properties of trabecular and cortical bone. For these prepared bone specimens, variation due to geometry is excluded as the milling produces samples of the same shape and size for all subjects. Changes in intrinsic properties may reflect an effect of treatment on bone quality. Interindividual variability requires having a sufficient number of specimens per group to detect meaningful differences with these tests. Usually, ten (for rodents) to fifteen (for large animals) animals/sex/group are sufficient to detect differences. However, potent drug effects have been distinguished from controls with as few as 3 animals/sex/group.
Bone specimens dedicated to biomechanical testing typically are collected at necropsy and, without fixation, are retained intact and frozen at −20°C until testing. Before testing, specimens are thawed in at 4°C and then maintained at room temperature and kept hydrated at all times. Drying and fixation methods with alcohol and formaldehyde should be avoided as they alter the biomechanical properties of bone, although this can be controlled by bone rehydration before testing as long as all bones from a study are treated in the same way. After alcohol fixation, all bones from the same experiment can be rehydrated in saline over a few hours. Standardized methodology is critical: machine maintenance, quality control, fixture engineering, load cell capacity, test speed, and positioning of the bone with specific and constant orientation. In general, specimens subjected to biomechanical testing are not reused for other analyses.
Protocol Considerations
Study Duration
Bone densitometry (DXA or/and pQCT) measurements can be included easily in most toxicity study designs of 28 days duration or longer in rodents and 3 months duration or longer for large animals, and during the recovery phase. Implementing these technologies into a Good Laboratory Practice environment requires rigorous testing, validation, and documentation to ensure the reproducibility of data. Standardized reproducible procedures and instrument precision are key for rigorous studies. Imaging facilities need to establish and enforce corrective action thresholds that trigger a call for service, maintain service logs, and comply with government inspections, radiation surveys, and regulatory requirements (ISCD 2015). Densitometry measurements can be performed longitudinally in vivo as well as on excised bones ex vivo. For short-term studies, ex vivo assessment may be sufficient to perform an initial skeletal evaluation, especially in rodents. Pretreatment data are of importance for interpreting densitometry data, especially for large animal studies. Typically for monitoring individual animals an adequate interval of time, 1 month in rodents and 3 months in NHP is required between measurements (examples of studies using these scan intervals can be found in Varela, Chouinard, Lesage, Guldberg, et al. 2017; Varela, Chouinard, Lesage, Smith, et al. 2017; Ominsky et al. 2017), unless particularly large changes in BMD are expected (as used in a proof-of-concept study reported by Ominsky et al. 2010). Scanning interval will depend on the duration of the bone turnover cycle in the species of interest. In Humans, the bone cycle varies between 16 and 26 weeks, 2 to 3 cycles per year (Eriksen 2010); in rats, approximately 6 weeks, 8 cycles per year (Baron, Tross, and Vignery 1984); and in NHP, approximately 10 weeks, 5 cycles per year (Schock, Noyes, and Villanueva 1972).
Loss or gain in bone mass, alterations in bone geometry, and ultimately shifts in biomechanical properties are cumulative, so important changes that may be detected later reflect the net adjustments in bone metabolism that occurred over the entire study period. For juvenile toxicity studies, pQCT is of particular interest for in vivo growth evaluations over time, as the evolving geometry of developing bone can be assessed readily with this technique. Different end points are often used in combination or applied using a tiered approach. For a tier-based approach to work efficiently, provision is made in the protocol to retain serum or/and urine as well as frozen and fixed samples of specific bones for possible future densitometric and/or biomechanical and/or histomorphometric assessments. In these cases, additional analyses will be conducted depending on initial in vivo results from bone markers alone or from bone markers combined with in vivo DXA and/or pQCT readings.
Conclusion
In conclusion, a large toolbox is available to assess the bone tissue in preclinical studies, both in adult and in juvenile animals. The toolbox includes simple in vivo noninvasive and translational techniques using biomarkers and imaging, to histomorphometry specifically to quantify the bone machinery (cells and dynamics) and biomechanical testing to ultimately assess the bone strength. Biochemical markers of bone turnover provide a noninvasive, real-time, rapid, and sensitive clinically translatable tool that can be used to discriminate effects of a compound on the skeleton. Markers provide mechanistic insight during drug development and are often used as a screening tool to determine whether more in-depth analyses of bone are required. In a chronic setting, analysis of samples can be performed on multiple occasions, providing important information on the time course of any effects. In vivo imaging represents a powerful and translational tool to assess toxicity to bone. Adverse effects of drugs on the skeleton can result in decreases in bone mass or geometry and ultimately affect bone strength. Bone histomorphometry is one of the many tools that can be employed to understand the cellular mechanisms responsible for test article-related structural changes in the bone or to prospectively address a potential target- or class-related theoretical bone liability. The methods of bone histomorphometry are sensitive, detecting effects of test articles on bone resorption, formation, mineralization, remodeling rates, and growth. Ultimately, bone strength can be evaluated by biomechanical testing to assess the potential impact on fracture risk.
Footnotes
Author Contributions
Authors contributed to conception or design (AV); data acquisition, analysis, or interpretation (AV, JJ); drafting the manuscript (AV); and critically revising the manuscript (JJ). All authors gave final approval and agreed to be accountable for all aspects of work in ensuring that questions relating to the accuracy or integrity of any part of the work are appropriately investigated and resolved.
Declaration of Conflicting Interests
The author(s) declared no potential, real, or perceived conflicts of interest with respect to the research, authorship, and/or publication of this article.
Funding
The author(s) received no financial support for the research, authorship, and/or publication of this article.