
Abstract
There was a significant increase in the incidence of retinal degeneration in F344/N rats chronically exposed to Kava kava extract (KKE) in National Toxicology Program (NTP) bioassay. A retrospective evaluation of these rat retinas indicated a similar spatial and morphological alteration as seen in light-induced retinal degeneration in albino rats. Therefore, it was hypothesized that KKE has a potential to exacerbate the light-induced retinal degeneration. To investigate the early mechanism of retinal degeneration, we conducted a 90-day F344/N rat KKE gavage study at doses of 0 and 1.0 g/kg (dose which induced retinal degeneration in the 2-year NTP rat KKE bioassay). The morphological evaluation indicated reduced number of phagosomes in the retinal pigment epithelium (RPE) of the superior retina. Transcriptomic alterations related to retinal epithelial homeostasis and melatoninergic signaling were observed in microarray analysis. Phagocytosis of photoreceptor outer segment by the underlying RPE is essential to maintain the homeostasis of the photoreceptor layer and is regulated by melatonin signaling. Therefore, reduced photoreceptor outer segment disc shedding and subsequent lower number of phagosomes in the RPE and alterations in the melatonin pathway may have contributed to the increased incidences of retinal degeneration observed in F344/N rats in the 2-year KKE bioassay.
Keywords
Kava kava extract (KKE) derived from the root of the tropical shrub Piper methysticum was originally used for ceremonial beverages in the South Pacific and is currently used as a herbal alternative to antianxiety drugs (National Toxicology Program [NTP] 2012). In the 2-year NTP KKE gavage bioassay in F344/N rats, in addition to a dose-related increase in the incidences of interstitial cell adenoma in the testis, there was a dose-related increase in the incidence of retinal degeneration in both sexes (Table 1). The degeneration consisted of a thinning and loss of the external retinal layers, such as the photoreceptors and external nuclear layers, with a decreased cellularity and disorganization of the remaining retinal layers (NTP 2012). A retrospective evaluation of rat retinas from the 2-year NTP KKE bioassay indicated the distribution and morphology of retinal degeneration was similar to the changes observed in light-induced retinal degeneration reported in albino rats (Yamashita et al. 2016). Therefore, it was hypothesized that KKE has the potential to exacerbate the light-induced retinal degeneration.
Frequency of Retinal Degeneration in Male and Female F344/N Rats Treated with Kava Kava Extract by Gavage for Two Years (Yamashita et al. 2016).a
Note: Trend test under control column; pairwise test under dose group columns.
a The incidence of retinal degeneration was significantly increased in a treatment-related fashion in both sexes.
b Fifty animals per group were initially assigned to each study; however, some animals were excluded from the assessment because of improper specimen handling, postmortem autolysis, or due to early deaths.
* p < .05.
** p < .01.
*** p < .001.
At least three different mechanisms leading to the exacerbation of light-induced retinal degeneration in long-term rat toxicity studies have been hypothesized: (1) pupillary dilation, (2) taurine deficiency, and (3) reduction of phagocytosis of photoreceptor outer segment by the underlying retinal pigment epithelium (RPE). Clonidine causes pupillary dilation, and a causal association was confirmed between increased light intensity and retinal damage (Weisse et al. 1971). Taurine is critical for photoreceptor development and acts as a cytoprotectant against stress-related neuronal damage (Ripps and Shen 2012). Deficiency of taurine is a well-known cause of retinal phototoxicity (Rapp, Thum, and Anderson 1988; Cocker and Lake 1989; Leon, Levick, and Sarossy 1995; Neuringer and Sturman 1987; Imaki et al. 1987). Vigabatrin, a gamma-aminobutyric acid (GABA) transaminase inhibitor, exacerbates light-induced retinal degeneration in albino rats, which can be partially prevented by taurine supplementation (Izumi et al. 2004; European Medicines Agency 1999; Jammoul et al. 2009). The vigabatrin-elicited increase in GABA could explain this observation because GABA is a known competitive inhibitor of the taurine transporter (Lee and Kang 2004). Disc shedding of the outer segments of photoreceptors and the subsequent phagocytosis by RPE is essential to photoreceptor homeostasis (Young and Droz 1968; Kevany and Palczewski 2010). Incomplete digestion of outer segments of photoreceptors in the RPE leads to excessive accumulation of photooxidized products, which is believed to be an underlying cause of degenerative retinal diseases (Kevany and Palczewski 2010). Pramipexole dihydrochloride, a dopamine agonist, induced retinal degeneration in albino rats in a 2-year carcinogenicity study, which was enhanced by light intensity (U.S. Food and Drug Administration [FDA] 2013). Investigative studies demonstrated that pramipexole reduced the rate of disc shedding and subsequent reduction in the number of phagosomes in the RPE, which was associated with enhanced sensitivity to damaging effects of light in albino rats (FDA 1997a). In addition to these three mechanisms, chemicals or drugs that cause phototoxicity can exacerbate light-induced retinal degeneration (Shimoda et al. 1993).
Facilitation of GABAergic transmission and changes in dopamine concentrations in the brain may contribute to the antianxiety and sedative properties of KKE (Singh and Singh 2002). Pupil dilation has also been reported in humans consuming KKE (Garner and Klinger 1985). Since it is suggested that alterations in GABA and dopamine concentration, and pupil dilation are linked to exacerbation of light-induced retinal degeneration, these effects of KKE may contribute to retinal degeneration observed in the 2-year NTP KKE rat study. Here, we conducted a 90-day KKE gavage study in male F344/N rats to examine the effect of KKE exposure on pupil dilation and to evaluate the morphological and transcriptomic alterations.
Materials and Method
Animals
Four-week-old male F344/N rats (n = 34) were purchased from Taconic Farms Inc. (Germantown, NY). Male rats were used in the study since the incidence of retinal degeneration was higher in male rats chronically exposed to KKE in the 2-year NTP bioassay. The rats were housed in cages with bedding (2 rats per cage) in an air-conditioned animal room (temperature, 21–23°C; relative humidity, 40–60%; period of lighting, 7 a.m. to 7 p.m.). Feed and water were available ad libitum. The cage position was rotated once every 2 weeks to minimize a confounding effect of light exposure to the eye. All the rats were treated in accordance with the NIH Animal Care and Use Committee protocols and the Association for Research in Vision and Ophthalmology’s Statement for the Use of Animals in Ophthalmology and Vision Research.
KKE Administration
At 6 weeks of age, the rats were divided into 2 treatment groups (n = 15 rats/group) based on the body weight, so that the mean body weight was comparable among groups and dosed with corn oil (control group) or KKE at 1.0 g/kg in corn oil (KKE 1.0 g/kg group) by gavage once daily for 90 days (week days only, 68 total dosing days). Corn oil (Lot number 2CI0307) used to prepare the vehicle for gavage formulations was obtained from Spectrum (Gardena, CA). KKE (Lot number 9077SDK) was received from the NTP chemistry support services contract at MRI Global (Kansas City, MO).
Pupil Measurement
For predose and 2 to 4 hr postdosing on days 1 and 7, and weeks 4, 8 and 12, a photograph of the right eye was captured using an infrared camera (Outdoor Wireless IP Camera, FI8904W, FOSCAM) with ophthalmic lens (Ocular MaxLight Indirect Diagnostic Lens, 20 Diopter, Ocular Instruments, Inc., Bellevue, WA) under 4 to 5 Lux of environmental light intensity. The diameters of the pupil and limbus corneae were measured using ImageJ version 1.48 (http://imagej.nih.gov/ij/; Figure 1A), and the pupil size was expressed as a ratio of the diameter of the pupil/limbus corneae.
Mean pupil size for each group over the 12 weeks of experimentation (n = 15 for each group). (A) The pupil size was expressed as a ratio of the diameter of the pupil/limbus corneae. (B) There were no statistically significant differences in pupil size between the KKE 1.0 g/kg group and the control group (Student’s t-test). KKE = kava kava extract.
Tissue Collection
On day 91, the rats were humanely euthanized, and the eyes were collected within 1 to 2.5 hr after the onset of light period. The time of eye collection was restricted to this time frame since it is known that the burst of disc shedding follows a circadian rhythm and the number of large packets of outer segment discs (phagosomes) in the RPE peaks between 0.5 and 2.25 hr after the lights are turned on in albino rats (LaVail 1976). Controlling for this important experimental variable allowed for an accurate quantitative analysis of photoreceptor outer segment phagocytosis. The left eye was fixed in a mixture of 0.8% glutaraldehyde and 1.2% paraformaldehyde in 0.1 M Sorenson’s phosphate buffer (pH 7.2) at 4°C for histopathology and transmission electron microscopy (TEM; Bechtold and Smith 2002). The right eye was collected in Tissue-Tek OCT compound (Sakura Finetek USA, Inc., Torrance, CA) on dry ice for laser capture microdissection (MMI CellCut, Haslett, MI). All retinal layers including RPE layer were collected from all regions of the retina including the superior and inferior retina to allow for extraction of sufficient quantity of RNA needed for the microarray study. RNA was immediately isolated from the microdissected retina using RNeasy kit following the manufacturer’s protocol (Qiagen, Germantown, MD).
Histopathology/TEM
After fixing the eyes for 3 hr, a sagittal cut was made through the cornea to the posterior aspect of the eye. Following overnight fixation, sections of the retina that are superior and inferior to the optic nerve (1 mm from the optic nerve) were collected and processed for TEM. The processed retinal samples were embedded in epoxy resin and polymerized into blocks. These blocks were trimmed, thick sectioned (a section ≤ 700 nm), and subsequently stained with 1% toluidine blue. The thick sections were examined by light microscopy, and 2 blocks/retinal sample were chosen to be thin sectioned (a section ≤ 90 nm) and placed on a 100-mesh copper grid, which were subsequently stained with uranyl acetate and lead citrate. Additionally, the toluidine blue stained–thick sections were used to measure the thickness of both the superior and inferior retinal layers as well as to perform a quantitative analysis of photoreceptor outer segment phagocytosis. The thickness of various retinal layers was measured as follows. The thickness of the inner plexiform layer (IPL) was regarded as the distance between the ganglion cell layer (GCL) and the inner nuclear layer (INL) containing synapses. The thickness of the INL was regarded as the distance between the IPL and the outer plexiform layer (OPL) containing cell bodies. The thickness of the OPL was regarded as the distance between the INL and the outer nuclear layer (ONL) containing synapses. The thickness of the ONL was regarded as the distance between the innermost and outermost extents of the layer, excluding photoreceptor segments. The thickness of the photoreceptor segment layer (PSL) was regarded as the distance between the outermost limit of the photoreceptor nuclei and the tip of the segments. The thickness of the retina (R) was regarded as the distance between the GCL and the apical surface of the RPE. The means of the 5 values were used as the individual data (n = 4–12 for each group). Photoreceptor outer segment phagocytosis was quantitated by examining the sections under an oil-immersion objective lens (100×), and the number of discrete phagosomes (≥0.75 µm diameter) in the RPE cell somas and their processes were counted (LaVail 1976). Mean number of phagosomes in four 110 µm lengths of the RPE was used as the individual data (n = 8 for each group), and superior and inferior retinas were separately examined. Thin sections for each retina were examined on an FEI Tecnai Bio Twin 120 kV TEM. Representative digital TEM images were taken for each sample confirming the presence of phagosomes in the outer segments of the RPE.
Gene Expression Analysis
DNA microarray analysis was conducted using the Affymetrix GeneChip® Rat Genome 230 2.0 Array (Affymetrix, Santa Clara, CA) following the manufacturer’s protocol. Total RNA was amplified as directed in the WT-Ovation Pico RNA Amplification System (NuGEN Technologies, Inc., San Carlos, CA) protocol and labeled with biotin following the Encore Biotin Module (NuGEN Technologies, Inc.). Gene expression data were normalized across all samples using the robust multiarray analysis (RMA) procedure (Gautier et al. 2004). Microarray data quality was evaluated using image reconstruction, signal intensity histograms, and boxplots. RMA-normalized data (one expression measure per probe set per array) were used for identifying differentially expressed genes using pairwise analyses. Pairwise comparisons for each probe set were made between the retinas from the KKE 1.0 g/kg group and the control group using a bootstrap t-test that controls the false discovery rate (Guo, Sarkar, and Peddada 2010). Statistical calculations were performed in the ORIOGEN version 4.01 software package using 10,000 bootstrap samples (Peddada et al. 2005). Differentially expressed probe sets were analyzed using Ingenuity Pathway Analysis (IPA; Redwood City, CA). Quantitative real time-polymerase chain reaction (QRT-PCR) was used to validate DNA microarray results. QRT-PCR was performed using TaqMan® Gene Expression Assays (Life technologies, Carlsbad, CA) on the ABI PRISM 7900HT Sequence Detection System (Applied Biosystems, Foster City, CA). β-actin was used as the endogenous control for normalization of gene expression levels.
Statistics
For the evaluation of pupil size, number of phagosomes, and thickness of layers in the retina, the data were expressed as the mean ± standard deviation, and Student’s t-test was performed. The differences were considered significant at p < .05.
Results
Pupil Measurement
There were no statistically significant differences in pupil size between the KKE 1.0 g/kg group and the control group throughout the dosing period (Figure 1B). Decreasing trends of pupil size and the individual variations were noted both in the control and in the KKE 1.0 g/kg groups at week 4 of dosing and after, which could be attributable to age.
Quantitative Analysis of Photoreceptor Outer Segment Phagocytosis
Representative transverse sections of the retina in the control group and KKE 1.0 g/kg groups were shown in Figure 2A. The number of phagosomes ≥0.75 µm diameter in the RPE in the superior retina was significantly decreased in KKE 1.0 g/kg group compared to the control group (Figure 2B, p = .023). In the inferior retina, there was no statistically significant difference in the number of phagosomes (Figure 2B). Representative TEM image of phagosomes of photoreceptor outer segments in the RPE soma and process from a control rat is shown in Figure 2C.
Quantitative analysis of photoreceptor outer segment phagocytosis. (A) Representative photomicrographs of transverse sections of the retina in the control group and KKE 1.0 g/kg group taken under oil immersion at 1000×. Reduced number of phagosomes (discrete dark-blue bodies) in the RPE in the superior retina from KKE 1.0 g/kg treated rat. (B) Mean number of phagosomes ≥.75 µm diameter in four 110 µm lengths of the RPE from superior and inferior retinas (mean ± SD, n = 8 for each group). The number of phagosomes in the superior retina was significantly decreased in KKE 1.0 g/kg group compared to the control group (*p < .05, Student’s t-test). (C) Representative TEM image of phagosomes (arrowhead) of photoreceptor outer segments in the RPE soma and the processes from a control rat. CH = choroid, KKE = kava kava extract, PSL = photoreceptor segment layer, RPE = retinal pigment epithelium, SD = standard deviation, TEM = transmission electron microscopy.
Thickness of Retinal Layers and Histopathologic Evaluation by Light Microscopy
There were no changes in the mean thickness of retinal layers (total retina, IPL, INL, OPL, ONL, and PSL) between the KKE 1.0 g/kg group and the control group (Figure 3). The decreased thickness of the retinal layers observed after chronic exposure to KKE at the 2-year time point was not observed in the current 90-day study.
The mean thickness (µm) of layers in the retina (mean ± SD, n = 4–12 for each group). There were no changes in the KKE 1.0 g/kg group compared with the control group at any layer (Student’s t-test). No retinal degeneration lesions as seen at the 2-year time point were observed in the 90-day study. INL = inner nuclear layer, IPL = inner plexiform layer, ONL = outer nuclear layer, OPL = outer plexiform layer, PSL = photoreceptor segment layer, R = retina.
Gene Expression Analysis
Principal component analysis of global retinal gene expression profiles demonstrated a nearly distinct clustering of control (red) and KKE 1.0 g/kg samples (Figure 4A). When the differentially expressed genes in KKE 1.0 g/kg group were compared to the control group, 10 transcripts (8 transcripts were mapped to genes using IPA) were differentially altered in KKE 1.0 g/kg group using a false discovery rate of 5% (Figure 4B, Table 2). DNA microarray results were validated by QRT-PCR.
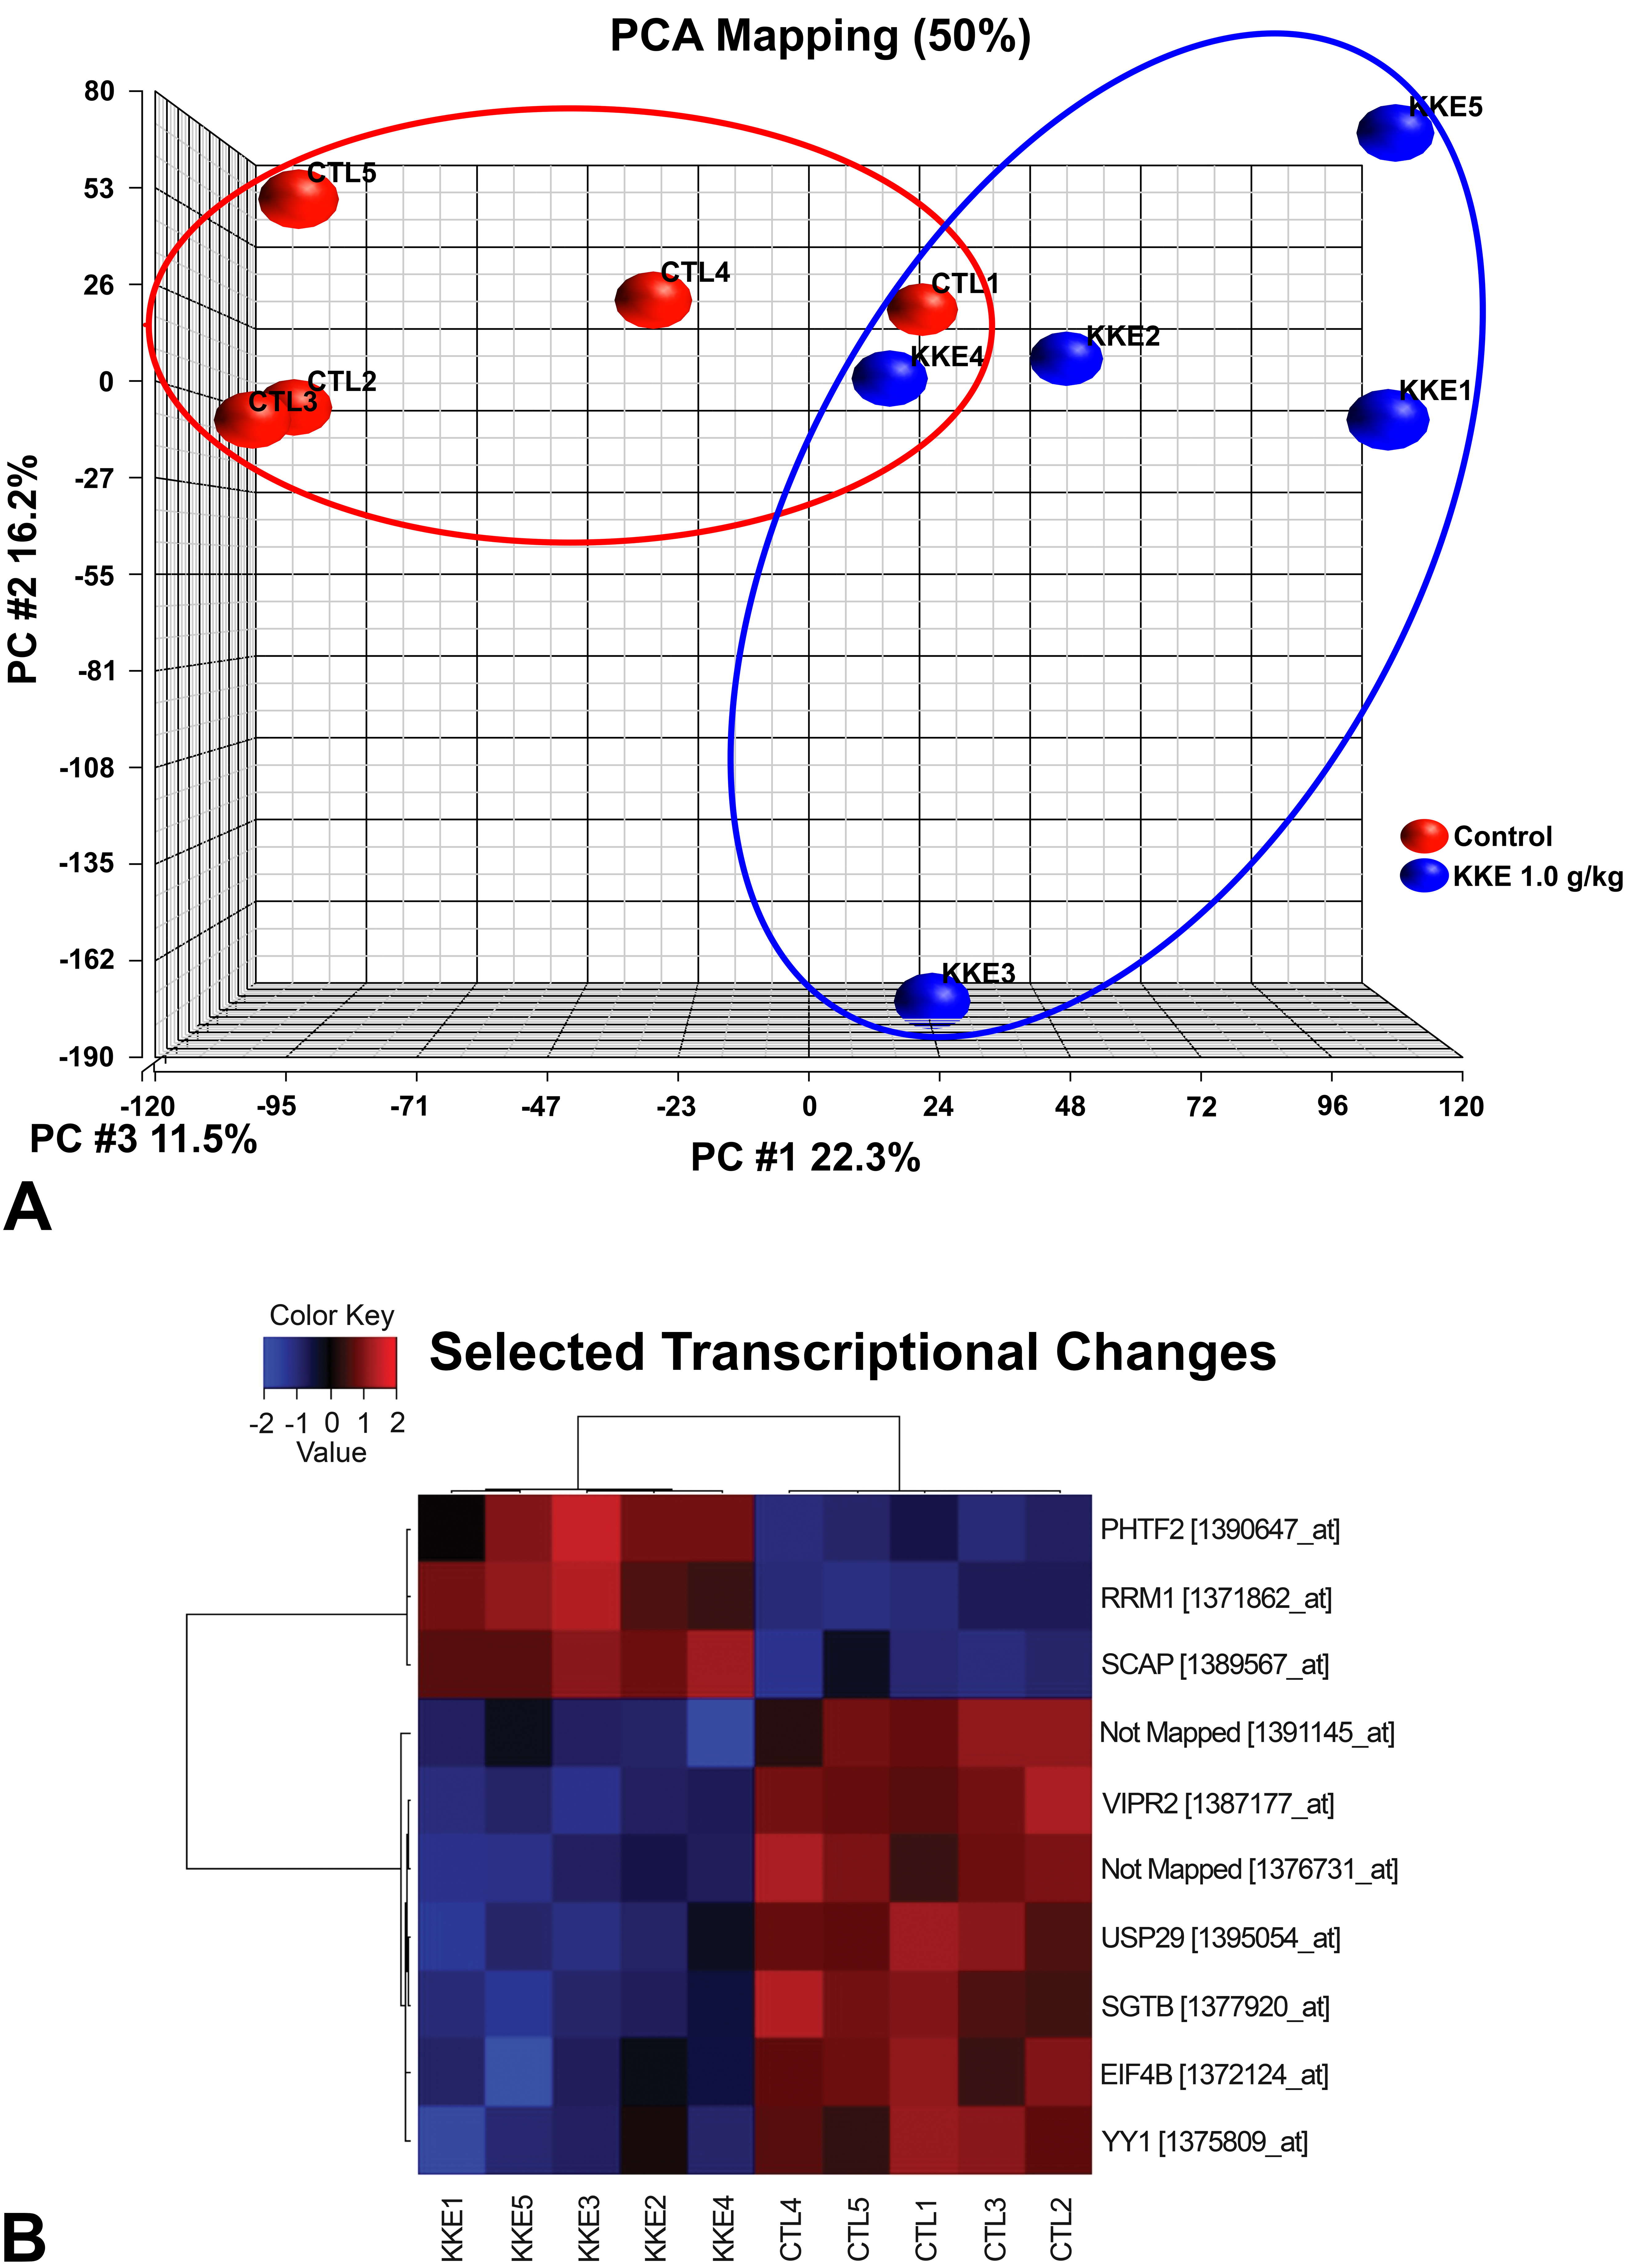
Gene expression analysis. (A) Principal component analysis (PCA) of global gene expression profiles on the retinas from control (red) and KKE 1.0 g/kg (blue) samples demonstrated a nearly distinct clustering. (B) Heat map of differentially expressed 10 transcripts between KKE 1.0 g/kg and control groups using a false discovery rate of 5%. Red, high expression; blue, low expression; KKE = kava kava extract, CTL = control.
Differentially Expressed Genes in KKE 1.0 g/kg Group Compared to Control Group.a
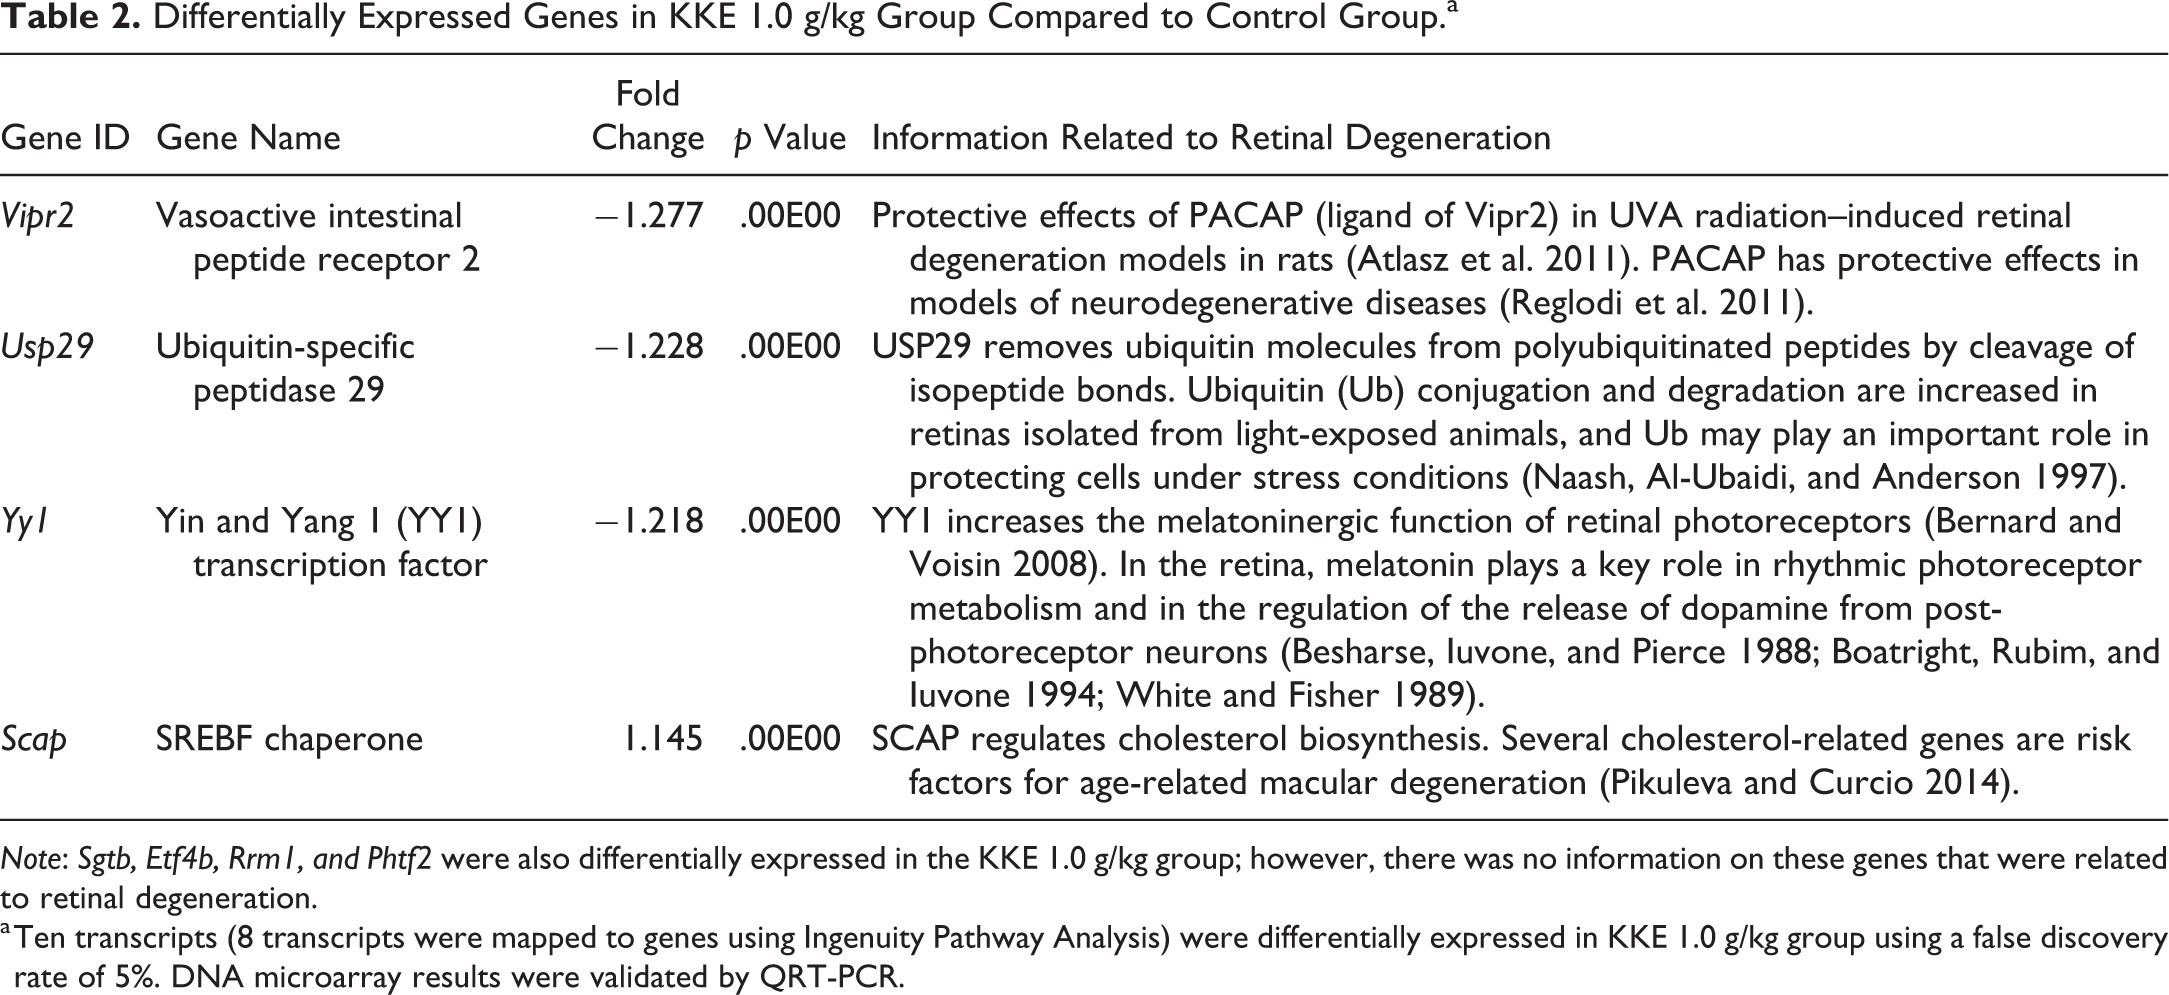
Note: Sgtb, Etf4b, Rrm1, and Phtf2 were also differentially expressed in the KKE 1.0 g/kg group; however, there was no information on these genes that were related to retinal degeneration.
a Ten transcripts (8 transcripts were mapped to genes using Ingenuity Pathway Analysis) were differentially expressed in KKE 1.0 g/kg group using a false discovery rate of 5%. DNA microarray results were validated by QRT-PCR.
Discussion
In this study, there was reduced phagocytosis of photoreceptor outer segments in the RPE of the superior retina but not in the inferior retina, due to a decrease in phagosomes as seen at light microscopic level (Figure 2A–C). Disc shedding from the outer photoreceptor layer and subsequent phagocytosis by the RPE is essential to photoreceptor homeostasis (Young and Droz 1968; Kevany and Palczewski 2010). Photoreceptor cells undergo a daily renewal process wherein about 10% of their volume is shed and phagocytosed by adjacent RPE cells to prevent the toxic effects of accumulated photooxidative products in the outer photoreceptor layer. In addition, the efficient recycling of disc material including docosahexaenoic acid and other fatty acids through a short feedback loop from the phagosomes to the interphotoreceptor matrix is essential for disc biogenesis (Giusto et al. 2000). Therefore, it was considered that the reduced numbers of phagosomes in the RPE reflect a reduction in disc shedding and a delayed renewal of outer photoreceptor segment that may have enhanced the sensitivity to light-induced retinal degeneration found in long-term bioassays in albino rats. However, further studies are necessary to fully understand the pathogenesis of retinal degeneration found in the 2-year NTP KKE bioassay. Pramipexole dihydrochloride, a dopamine agonist, induces retinal degeneration in albino rats by reducing the rate of phagocytosis, and its severity is increased by enhanced light intensity (FDA 1997a, 2013). A retrospective evaluation of rat retinas from the 2-year NTP KKE bioassay indicated that chronic KKE exposure exacerbated light-induced retinal degeneration since the frequency of retinal degeneration was increased in a dose-dependent manner and the distribution and morphology (but not severity) of retinal degeneration was similar to the changes observed in light-induced retinal degeneration reported in albino rats (Yamashita et al. 2016). In this study, phagocytosis of photoreceptor outer segment was decreased only in the superior retina, which is more sensitive to light damage than the inferior retina (Tanito et al. 2008). Therefore, these results support the proposed mechanism that sensitivity to the damaging effects of light might be enhanced by the KKE-induced decrease in disc shedding of photoreceptor outer segment with subsequent reduction in phagocytosis by RPE and recycling of the disc material and resulted in an increase in the incidence of retinal degeneration in the 2-year NTP KKE rat study as was seen with pramipexole.
KKE-induced exacerbation of light-induced retinal degeneration seems to be specific to albino rats since retinal degeneration was not observed in the 2-year pigmented B6C3F1/N mouse study and similar changes have not been reported in humans. Similarly, in the pramipexole study, retinal degeneration (degeneration and loss of photoreceptor cells) was induced only in albino rats in the 2-year carcinogenicity study due to drug-induced reduction in the rate of photoreceptor outer segment phagocytosis, and similar retinal changes have not been reported in pigmented animals including rats and monkeys, and humans (FDA 2013). Since melanin in the eye absorbs light and a significant amount of light escapes the absorption by photoreceptor cells (Hu, Simon, and Sarna 2008), pigmented animals and humans are likely to be less susceptible to the effect of drugs that reduce the rate of photoreceptor outer segment phagocytosis. On the other hand, pramipexole did not induce retinal degeneration in Chbb: NMRI albino mice in the 2-year carcinogenicity study (FDA 1997b). Since wide range of sensitivities to light-induced retinal degeneration is known in albino mice (LaVail, Gorrin, and Repaci 1987; LaVail, Gorrin, Repaci, Thomas, et al. 1987) as well as in albino rats (Borges, Edward, and Tso 1990), the susceptibility to drug-induced exacerbation of light-induced retinal degeneration may also be related to strain and/or species differences.
In addition to the possibility that the effect of KKE on the retina is specific to albino rats, the dose level of 1.0 g/kg used in this rat study is largely higher (more than 30-fold) than human equivalent dose for herbal supplement (Ulbricht et al. 2005) based on the body surface area conversion (FDA 2005). Therefore, the risk of retinal toxicity resulting from KKE exposure may be low in humans. However, the potential significance of this effect in humans cannot be disregarded because retinal disc shedding is a universal mechanism in vertebrates, and drug-induced disruption of photoreceptor outer segment phagocytosis may negatively affect retinal health in people where exposure to the blue light from screens (that reduces melatonin levels) from various electronic devices is increasing for both professional and leisurely activities.
Global gene expression profiles demonstrated a nearly distinct clustering of control and KKE 1.0 g/kg samples in the PCA (Figure 4A), and 10 transcripts were differentially expressed in KKE 1.0 g/kg group compared to vehicle control group (Figure 4B, Table 2). The transcript Yin and Yang 1 (Yy1) was downregulated in the KKE 1.0 g/kg group compared to the control group and is known to increase the melatoninergic function of retinal photoreceptors (Bernard and Voisin 2008). In the retina, melatonin plays a key role in the regulation of the dopamine release from post-photoreceptor neurons and rod outer segment disc shedding under the influence of the circadian rhythm (Besharse, Iuvone, and Pierce 1988; Boatright, Rubim, and Iuvone 1994; White and Fisher 1989). Therefore, the molecular alteration found in this study could be related to KKE-induced decrease in disc shedding. While there appears to be a role for modulation of melatonin in reduced disc shedding in KKE-exacerbated light-induced retinal degeneration, further studies are necessary to fully understand the pathogenesis of this lesion.
Besides Yy1, the transcripts vasoactive intestinal peptide receptor 2 (Vipr2) and ubiquitin-specific peptidase 29 (Usp29) were downregulated, and Scap (sterol-regulatory element-binding transcription factor [SREBF] chaperone) was upregulated in the KKE 1.0 g/kg group. Pituitary adenylate cyclase-activating polypeptide (PACAP), the ligand of VIPR2, is known to have protective effects in UVA radiation–induced retinal degeneration models in rats (Atlasz et al. 2011) and in models of neurodegenerative diseases (Reglodi et al. 2011). USP29 removes ubiquitin molecules from polyubiquitinated peptides by cleavage of isopeptide bonds. Ubiquitin conjugation and degradation are increased in retinas isolated from light-exposed animals, and Ubiquitin may play an important role in the protection of retina from light stress (Naash, Al-Ubaidi, and Anderson 1997). Several cholesterol-related genes including Scap that regulates of cholesterol biosynthesis are known to be risk factors for age-related macular degeneration (Pikuleva and Curcio 2014). Therefore, these genes may also relate to the KKE-exacerbated light-induced retinal degeneration, but how these alterations in gene expression precisely contribute to KKE-exacerbated light-induced retinal degeneration still remain to be clarified.
In this study, the global gene expression was evaluated from the pooled samples from the superior and inferior retina since we could not obtain sufficient RNA (1 µg) needed for the microarray experiment from superior and inferior retina separately. It would have been interesting and important to correlate the gene expression changes with the decreased number of phagosomes in the superior retina.
It has been reported that drinking kava increased pupillary diameter in a controlled case study in humans (Singh and Singh 2002), and pupillary dilation exacerbates light-induced retinal degeneration in long-term studies in albino rats (Weisse et al. 1971). However, in this study, KKE had no effect on pupillary diameter throughout the dosing period (Figure 1B). Therefore, it was confirmed that the effect on pupillary dilation was not related to the mechanism of exacerbation of light-induced retinal degeneration in the 2-year NTP KKE rat study.
It has also been reported that kava possesses phototoxicity mediated by free radicals under UVA light (Xia et al. 2012). Wavelength in the UVA band has little propagation into the eye beyond the lens; therefore, only drugs or chemicals with significant visible (VIS) wavelength absorption represent a likely phototoxic risk to the retina. The VIS wavelength absorption of KKE is unclear, but alterations in the genes related to oxidative stress were not observed in KKE 1.0 g/kg group in the DNA microarray analysis.
In summary, KKE at 1.0 g/kg reduced the number of phagosomes in the RPE of the superior retina as a result of reduced disc shedding in the photoreceptor outer segment and caused transcriptomic alterations related to melatoninergic signaling in the retinal photoreceptors. Phagocytosis of photoreceptor outer segment is essential to maintain the homeostasis of the photoreceptor layer and is regulated by melatonin signaling. These data suggest that the cumulative effects associated with reduced number of phagosomes in the RPE might have potentially compromised the efficient recycling of the disc material as well as alterations in the melatonin pathway might have contributed to the increased incidences of retinal degeneration in KKE-exposed F344/N rats after 2-year repeat dose exposure.
Footnotes
Authors’ Note
This work was done by Dr. Haruhiro Yamashita in the Molecular Pathology Group at the National Toxicology Program, NIEHS while he was on a sabbatical leave from Taisho Pharmaceutical Co. Ltd., Saitama, Japan.
Acknowledgment
The authors would like to thank the Cellular and Molecular Pathology Branch, NIEHS Microarray Core, Pathology Support Core and the Special Techniques Group for their technical assistance on this project. The authors would also like to express their appreciation to Ms. Beth Mahler for formatting the images for publication in this manuscript. The authors would like to acknowledge the thorough review and suggestions provided by the reviewers of this manuscript.
Author Contributions
Authors contributed to conception or design (HY, MH, RS, AP); data acquisition, analysis, or interpretation (HY, MH, KS, SP, KG, DS, CC, YW, JF, MB, SW, RS, AP); drafting the manuscript (HY, AP); and critically revising the manuscript (HY, MH, KS, SP, KG, DS, CC, YW, JF, MB, SW, RS, AP). All authors gave final approval and agreed to be accountable for all aspects of work in ensuring that questions relating to the accuracy or integrity of any part of the work are appropriately investigated and resolved.
Declaration of Conflicting Interests
The author(s) declared no potential, real, or perceived conflicts of interest with respect to the research, authorship, and/or publication of this article.
Funding
The author(s) disclosed receipt of the following financial support for the research, authorship, and/or publication of this article: This project was funded by DNTP and DIR, NIEHS.