
Abstract
Nanotoxicity studies are greatly needed to advance nanomedical technologies into clinical practice. We assessed the toxic effects of a single intravenous exposure to commercially available gold nanoparticles (GNPs) in mice and rats. Fifteen-nm GNPs were purchased and independently characterized. Animals were exposed to either 1,000 mg GNPs/kg body weight (GNP group) or phosphate-buffered saline. Subsets of animals were euthanized and samples collected at 1, 7, 14, 21, and 28 days postexposure. Independent characterization demonstrated that the physicochemical properties of the purchased GNPs were in good agreement with the information provided by the supplier. Mice exposed to GNPs developed granulomas in the liver and transiently increased serum levels of the pro-inflammatory cytokine interleukin-18. No such alterations were found in rats. While there was no fatality in mice post-GNP exposure, a number of the rats died within hours of GNP administration. Differences in GNP biodistribution and excretion were also detected between the two species, with rats having a higher relative accumulation of GNPs in spleen and greater fecal excretion. In conclusion, GNPs have the ability to incite a robust macrophage response in mice, and there are important species-specific differences in their biodistribution, excretion, and potential for toxicity.
Materials in the nanoscale acquire unique properties that are not present in bulk material of identical composition. These properties can be highly useful and carry the potential of having great impact on key areas of science and technology including food science, pharmacology, and medicine (Sadauskas et al. 2009; Morais et al. 2012; Oberdörster, Stone, and Donaldson 2007). The rapid development of nanotechnology brings a subsequent increase in generation and usage of engineered nanoparticles and therefore increased risk of exposure and toxicity (Sadauskas et al. 2009; Balasubramanian et al. 2010). Most nanotoxicity research has focused on accidental exposures (Fischer and Chan 2007), but usage of nanomaterials in the medical field necessitates intentional administration of significant doses by different routes including intravenous (IV) injections (Oberdörster, Oberdörster, and Oberdörster 2005; Oostingh et al. 2011; Donaldson 2006). Unfortunately, the safety of nanomaterials remains largely unknown or incompletely understood (Kumar, Zhang, and Liang 2013). This is currently the most critical issue obstructing the advance of nanomedical technology into clinical practice (Maojo et al. 2012; Resnik and Tinkle 2007).
Gold nanoparticles (GNPs) are one of the top candidates for biomedical uses, mainly due to their high stability and biocompatibility when compared to other nanomaterials (Sperling et al. 2008). They are easy to synthesize and characterize, and they can be conjugated with multiple chemicals and biological molecules to create biocompatible, targeted, and controlled diagnostic, treatment, and delivery systems (Kumar, Zhang, and Liang 2013; Chen et al. 2013; Wang, Zhu, and Li 2012). However, determining the fate of GNPs after they have fulfilled their medical purpose and the potential threats they pose to human and environmental health is critical (Nystrom and Fadeel 2012). Currently, there is controversy and inconsistency regarding their potential for toxicity, with some studies supporting their safety and others reporting toxicity in vitro and in vivo. The main source of disagreement comes from the great diversity in experimental design among the different research groups, making true comparison rarely possible (Dykman and Khlebtsov 2011; Khlebtsov and Dykman 2011).
The purpose of our research was to identify and describe the health effects of a single IV exposure to commercially available GNPs in two animal models: BALB/c mice and F344 rats. The reason IV administration was chosen as the route of delivery was twofold: (1) to simulate medical applications currently being investigated such as the use of GNPs as contrast agents, drug carriers, and photothermal agents; and (2) to study the potentially serious medical complications such as those observed in a recent study in which IV administration resulted in GNPs accumulating throughout the body and inducing liver enzyme elevations (suggesting hepatotoxicity) in a rodent model (Bednarski et al. 2015). We elected to assess the toxicity of commercially available GNPs, in order to more closely mimic how such nanomaterials would presumably be procured for clinical applications. For quality assurance purposes, as commercially available GNPs may degrade during storage or may vary from one lot to the next from the same producer (Maynard, Warheit, and Philbert 2011; Park and Grassian 2010), we chose to characterize the GNPs and compare our results against the published specifications of the manufacturer.
To our knowledge, the inclusion of two distinct animal species in parallel experiments to assess GNP toxicity has never been reported. This fulfills two relevant objectives: firstly, it allows the detection of potential species-specific reactions to GNP exposure. While mice and rats are phylogenetically similar, large differences in response to toxic compounds may occur and warrant investigation (Eaton and Gilbert 2008). Mice and rats are by far the most common animal models used for toxicity assessment of GNPs. This is relevant to the second objective: to facilitate comparison of the results and conclusions from the present study to previously published in vivo experiments on GNP toxicity.
Materials and Method
GNPs
Nominal 15-nm GNPs were purchased (AuroVist™-15 nm, Nanoprobes, Yaphank, NY) and characterized. AuroVist-15 nm GNPs were chosen for this study due to their expected high biocompatibility. The product is described as having a median lethal dose (LD50) > 5,000 mg/kg, low osmolality, and viscosity similar to water, even at high concentrations (Nanoprobes 2011). A Philips EM420 Transmission Electron Microscope (TEM, Philips, Somerset, NJ) operating at 120 kV was used to determine the gold core size distribution and shape. Micrographs were analyzed using ImageJ 1.48v (National Institutes of Health, Bethesda, MD). Dynamic light scattering (DLS) and electrophoretic mobility measurements were performed on a Zetasizer NanoZS (Malvern Instruments, Westborough, MA) particle analyzer to determine GNP hydrodynamic diameter distributions and zeta potential values, as well as agglomeration state. The method of cumulants was employed to determine the average hydrodynamic diameter of the particles (Z ave). The Smoluchowski approximation was used to obtain zeta potential values of the particles. Additionally, Raman spectroscopy was used to identify the GNP coating agent by comparing GNPs of known coating properties with the purchased GNPs. Briefly, citrate-coated GNPs were prepared as described by Turkevich, Stevenson, and Hillier (1951), and thiolated polyethylene glycol (PEG) with a molecular weight of 5,000 Da was purchased from Nanocs (New York, NY). A 1 mM PEG solution was prepared and frozen until further use. PEG-coated GNPs (PEG-GNPs) were prepared by mixing 30 μl of the 1 mM PEG solution with 100 μl of the citrate-coated GNP suspension. Raman spectroscopy experiments were performed on a WITec Alpha500R Raman Spectrometer (WITec, Knoxville, TN) with a 10× microscope objective, 300 gr/mm grating, and 785-nm laser. Sample volumes of 2 μl of PEG, independently produced PEG-GNPs, and the purchased GNPs were applied to aluminum foil–covered glass slides and then allowed to dry in a fume hood. Raman spectra were collected from dried samples with a 5-mW laser power, 1-sec integration time, and 10 accumulations. The graph background subtraction tool of the WITec Project software v.2.10 was used to remove the fluorescent background signal from the collected spectra.
Animals and Exposure
All experiments were performed in accordance with the guiding principles in the use of animals in toxicology and were previously approved by the Institutional Animal Care and Use Committee and the Environmental Health and Safety Services at Virginia Tech. Female BALB/c mice (Harlan Sprague Dawley, Inc., Dublin, VA) 5 to 6 weeks old and female F344 rats (Charles River Laboratories, Wilmington, MA) 5 to 6 weeks old were purchased and maintained at 22 ± 1°C, 40% to 60% humidity, and 12:12-hr light:dark cycle, with standard rodent diet (Harlan Teklad Global Diet 2018, Madison, WI) and water ad libitum. Following an acclimation period of 1 week, animals were randomly divided in two groups: “GNP” or “phosphate-buffered saline (PBS).” The GNP group received a single injection of GNPs suspended in PBS in the tail vein at a dose of 1,000 mg/kg (volumes injected were 0.1 ml per mouse and 0.6 m1 per rat approximately). The PBS group received an equivalent volume of PBS and was considered the control group. All animals were sedated prior to GNP or PBS injection to reduce the risk of extravascular GNP administration, using 5 mg/kg diazepam administered via intraperitoneal (IP) injection. After the injections, animals were closely monitored until fully recovered from sedation. Groups of animals (5–6 mice and 3–4 rats per group) were euthanized via CO2 asphyxiation followed by thoracotomy, necropsied, and samples collected at 1, 7, 14, 21, and 28 days postexposure. Additionally, behavior was monitored daily by veterinarians (subjective evaluation of posture, locomotion, awareness of surroundings, reaction to stimulus, and stress indicators such as barbering and diarrhea), and body weight was recorded weekly. The samples collected at each time point were feces, urine, blood, heart, aorta, trachea, thyroid gland, esophagus, thymus, lungs, liver, spleen, gastrointestinal tract (stomach, duodenum, and cecum), pancreas, kidneys, adrenal glands, bladder, uterus, ovaries, abdominal fat, lymph nodes (thoracic and abdominal), skin, hind limbs, and head.
The dose selected for this study, 1,000 mg/kg, is considered appropriate by the federal agencies for nonclinical toxicity studies in rodents (U.S. Department of Health and Human Services, Food and Drug Administration, Center for Drug Evaluation and Research, and Center for Biologics Evaluation and Research 2010). The specific GNPs used for this experiment are described as highly biocompatible, and the dose used is significantly lower than the reported LD50 (>5,000 mg/kg). Also, studies exposing animals to almost threefold higher concentrations of GNPs from the same company, but 1.9 nm in size, reported no clinical signs of illness (Hainfeld et al. 2006; Hainfeld, Slatkin, and Smilowitz 2004). A high dose was selected in order to increase the probability of obtaining statistically valid results from a limited number of animals, although it may exceed the potential level of human exposure. This needs to be considered especially when extrapolating from high dose to low dose and across species, and results and conclusions of this study should be analyzed within this context.
Biochemical Parameters
In order to evaluate biochemical parameters, blood was collected from the animals via cardiac puncture under deep anesthesia with isoflurane, allowed to clot for 30 min to 1 hr at room temperature, and centrifuged at 2,000 rpm for 20 min. The serum was collected in aliquots and analyzed immediately or stored at −80°C for further use.
Malondialdehyde (MDA), interferon gamma (IFN-γ), and interleukin-18 (IL-18)
Oxidative stress and inflammation have been suggested as potential mechanisms of GNP toxicity (J. J. Li et al. 2010; Oberdörster, Oberdörster, and Oberdörster 2005; Du et al. 2012). Macrophages actively internalize and accumulate GNPs (Hirn et al. 2011; W. S. Cho et al. 2010; Dragoni et al. 2012), and there is extremely poor clearance, so evaluation of the activation (or inhibition; Leroy et al. 2011) of macrophages and chronic inflammation involving these immune cells is of high relevance when characterizing GNP toxicity. Enzyme-linked immunosorbent assay (ELISA) kits were used to determine serum levels of MDA in rats (Uscn Life Science Inc., Wuhan, China), IFN-γ in mice (OriGene, Rockville, MD), and IL-18 in mice (Medical & Biological Laboratories Co., Ltd., Woburn, MA). MDA is an extremely reactive by-product of lipid peroxidation by free radicals and reactive oxygen species (ROS). It is known to form highly genotoxic complexes with macromolecules such as proteins and DNA (J. J. Li et al. 2010), and it has been measured as a marker of oxidative stress in nanotoxicology (J. J. Li et al. 2010; Pan, Bartneck, and Jahnen-Dechent 2012). IFN-γ is a pro-inflammatory cytokine with significant immunostimulatory and immunomodulatory effects on both innate and acquired immunities and is especially important for classical activation of macrophages. IL-18 (also known as IFN-γ inducing factor) is a pro-inflammatory cytokine produced almost exclusively by macrophages. It is involved in chronic inflammation, autoimmune diseases, cancer, and infectious diseases, contributing to host defenses (cell-mediated immunity) and inflammation (Gracie, Robertson, and McInnes 2003).
Serum was thawed and analyzed with the corresponding ELISA kit, following the manufacturer’s instructions. All standards, samples, and controls were run in duplicate. The absorbance was measured at 450 nm immediately after finishing each protocol, using a spectrophotometer and accompanying software (SpectraMax 250 and SoftMax Pro software, Molecular Devices, Sunnyvale, CA). Amount of protein was calculated using the best-fit curve equation for each ELISA, comparing the mean absorbance of each sample to the standard curve. For all ELISAs, protein levels of GNP groups were compared to corresponding PBS groups.
Biochemical profiles
Serum levels of glucose, urea nitrogen, creatinine, phosphorus, calcium, total protein, albumin, globulin, alanine transaminase (ALT), aspartate transaminase (AST), alkaline phosphatase, γ-glutamyl transpeptidase, total, direct, and indirect bilirubin, cholesterol, sodium, potassium, chloride, CO2, and anion gap were measured as indicators of health and organ function. Presence or absence of lipemia, icterus, and hemolysis was also evaluated. Fresh serum was submitted to the Virginia–Maryland College of Veterinary Medicine (VMCVM) Clinical Pathology Laboratory for analysis with an AU480 chemical analyzer. This technique requires a minimum of 300 μl of serum, so some mouse samples were pooled (2 mice per sample) in order to provide sufficient serum. At each time point, GNP and PBS groups were compared.
Histopathology
Tissue samples collected during necropsy were stored in 10% neutral-buffered formalin. For light microscopic examination, tissues were trimmed and submitted to the VMCVM Histology Laboratory for routine histologic processing and special stains (Oil Red O, periodic acid–Schiff with and without diastase, Masson’s trichrome, Prussian blue, and Hall’s stain for the assessment of lipids, glycogen, fibrosis, iron hemosiderin, and bile, respectively). Tissue samples containing bone were placed in decalcifying solution (Enhanced Decalcification Formulation, StatLab Medical Products, McKinney, TX) for 24 to 48 hr, prior to submission to the Histology Laboratory. Macroscopic and microscopic morphologies of tissues from GNP animals were compared to corresponding PBS animals.
Immunohistochemistry—von Willebrand Factor
In order to assess GNP accumulation in endothelial cells as well as alterations in cell morphology, paraffin-embedded tissues were submitted to the Connecticut Veterinary Medical Diagnostic Laboratory for immunohistochemical staining with von Willebrand Factor antibody (Dako, Carpinteria, CA), a marker of endothelial cells. Stained slides were evaluated via light microscopy.
Scanning Electron Microscopy with Energy Dispersive X-ray Spectroscopy (SEM-EDX)
Samples of mice and rat liver and spleen were analyzed by SEM-EDX to visualize and confirm GNP accumulation within tissues. Samples were fixed and stored in a mixture of 5% glutaraldehyde, 4.4% formaldehyde, and 2.75% picric acid in 0.005 M sodium cacodylate and were submitted to the VMCVM Morphology Laboratory for SEM processing. For GNP visualization and elemental determination, processed samples were taken to the Institute of Critical Technology and Applied Science (ICTAS) Nanoscale Characterization and Fabrication Laboratory where they were sputter coated with carbon (carbon was used as an alternative coating to avoid interference of a gold coating with elemental determination of GNPs within tissues) and examined using a FEI Quanta 600 FEG Environmental Scanning Electronic Microscope equipped with Bruker EDX with a Silicon Drifted Detector (FEI, Hillsboro, OR).
Atomic Absorption Spectrometry
For quantitative assessment of GNP excretion and tissue accumulation, frozen samples of urine and feces, as well as samples of liver and brain fixed in 10% neutral-buffered formalin, were submitted to the VMCVM Toxicology Laboratory. Samples were homogenized, subjected to nitric acid/perchloric acid digestion, and analyzed with a Varian SpectrAA 220FS Atomic Absorption Spectrometer for measurement of gold content (Gold Ultra Hollow Cathode lamp, 242.8-nm wavelength, 1.0-nm slit width, background correction on). Gold concentrations in samples of GNP groups were compared to PBS groups.
Statistical Analysis
Statistical analysis was performed only when data from at least 3 samples from different animals were available. Results were analyzed via one-way analysis of variance, Student’s t-test, Tukey’s honest significant difference test, and logistic modeling as appropriate, using JMP® Pro 10.0.2 (SAS Institute Inc., Cary, NC). Data were considered statistically significant if p < .05 and are reported as mean ± standard error of the mean except when indicated, with n denoting the sample size.
Results
Characterization of GNPs
The mean diameter of the GNP’s gold core was determined by TEM to be 13.09 nm with a standard deviation of 7.89 nm (n = 300). The GNP cores were roughly spherical, but were relatively polydisperse, as shown by the high standard deviation. Figure 1A and 1B shows the size distribution histogram determined by image analysis of collected micrographs, as well as one representative micrograph. Online Supplemental Table 1 gives the summary statistics for TEM. Regarding DLS analysis, the Z ave determined via the method of cumulants was 42.64 nm with a standard deviation of 0.15 nm. The gold core diameter was considerably smaller than the DLS-determined hydrodynamic diameter. This difference is a good indication of the presence of a thick polymer coating around the gold core. The polydispersity index was 0.154 with a standard deviation of 0.005. Detailed data and statistics of the DLS analysis are summarized in Online Supplemental Table 2. The DLS results indicated that the GNP hydrodynamic diameters were relatively monodisperse, and the particles were not agglomerated. The GNPs had a mean zeta potential of −34.43 mV with a standard deviation of 2.71 mV. Detailed data and statistics of the electrophoretic mobility analysis used to determine zeta potential are summarized in Online Supplemental Table 3. Raman spectroscopy was used to identify the nature of the surface coating used to stabilize the purchased GNPs. PEG was the main candidate as a likely coating material because of its superior capacity for stabilizing GNPs and its common use in biomedicine (Levin et al. 2006). The Raman spectra of PEG, PEG-GNPs (synthesized by our group), and the purchased GNPs are shown in Figure 1C. Differences between PEG and PEG-GNP spectra (e.g., peak broadening and frequency shifts) are attributable to the less ordered structure of the PEG coating relative to pure PEG (Maxfield and Shepherd 1975; Chrissopoulou et al. 2011). The purchased GNPs and PEG-GNPs exhibited close resemblance in the bands corresponding to CH2 rocking (810 and 845 cm−1), twisting (1,240 and 1,280 cm−1), and bending (1,440 and 1,470 cm−1) modes, which implied that the unknown coating material was either PEG or another polymer with a structure and conformation similar to PEG. The peaks at 1,060 and 1,137 cm−1, which are due to the C–O–C stretching mode with a contribution from the CH2 rocking mode at 1,060 cm−1, were weak in the spectrum of the purchased GNPs. Also, an additional sharp peak appeared at 1,090 cm−1. A decrease in Raman intensity in this region and a shift toward 1,090 cm−1 were also evident in the Raman spectra of PEG-silicate nanocomposites reported by Chrissopoulou et al. (2011); therefore, the 1,000 to 1,170 cm−1 region of the Raman spectrum of the purchased GNPs is consistent with the conclusion that the unknown coating is PEG.
Gold nanoparticle characterization. (A) Gold core size distribution histogram of purchased GNPs, as determined by analysis of TEM micrographs with ImageJ software. The mean diameter was 13.09 ± 7.89 nm (standard deviation; n = 300). (B) A representative TEM micrograph of purchased GNPs (scale bar = 50 nm). (C) Raman spectra of purchased GNPs (top), independently produced polyethylene glycol GNPs (middle), and PEG (bottom). Spectra are normalized and offset for clarity. GNPs = gold nanoparticles, TEM = transmission electron microscope, PEG = polyethylene glycol.
Toxicological Profile, Excretion, and Bioaccumulation
Three of the 19 rats exposed to GNPs died unexpectedly within 24 hr of GNP administration. Necropsy of the deceased animals did not reveal a definitive cause of death; due to the advanced state of decomposition, organs were not collected for histopathologic evaluation. No deaths were registered in rats exposed to PBS or mice exposed to GNPs or PBS. No alterations in behavior, body weight (Online Supplemental Figure 1A and 1B), MDA, IFN-γ, or any of the parameters measured in biomedical profiles were found in any of the animals. Grossly, a remarkable change of color was observed in all GNP-exposed animals. As shown in Online Supplemental Figure 1C, a red-black darkening of the blood vessels was evident in GNP groups immediately after the IV injection, and this had extended into the skin and internal tissues by 24 hr. By one week postexposure, the color had shifted from red to a dark purple-gray that persisted through the end of the study. GNPs could also be directly observed in serum up to 7 days postexposure (Online Supplemental Figure 1D).
Low concentrations of gold were detected in urine up to 7 days post-GNP exposure (Figure 2A), with similar levels for mice and rats. This data supported previous studies, which demonstrated primary excretion of GNPs through the kidneys following IV administration, with no overt renal toxicity noted (Naz et al. 2016). In feces, concentrations of gold were higher than in urine, but still low overall. Gold could be measured in mice feces up to 14 days postexposure and in rat feces up to 28 days postexposure, with consistently higher levels in rats when compared to mice (Figure 2B). In liver, gold content significantly increased between 1 and 7 days post-GNP exposure in mice and rats and remained high in both species through the end of the study (Figure 2C). Low concentrations of gold were also detected in brain homogenate of GNP-exposed mice and rats (Figure 2D). Gold levels were higher in rat brain 1 and 7 days postexposure compared to mouse brain and decreased in rats by day 14. After this time, concentrations of gold in mice and rat brain were similar and stayed low through the end of the study (Figure 2D).
Gold quantification. Gold concentration in (A) urine, (B) feces, (C) liver, and (D) brain of mice and rats exposed to PBS or GNPs was measured via atomic absorption spectrometry (n = 1–3). The inset in (B) depicts concentrations of gold in feces between 14 and 28 days postexposure, which are indistinguishable in the main graph. GNPs = gold nanoparticles, PBS = phosphate-buffered saline.
From all the biochemical parameters assessed, the only significant difference between PBS- and GNP-exposed animals was found in mouse serum levels of IL-18. Seven days postexposure, IL-18 was significantly higher in GNP-exposed mice when compared to their PBS-exposed counterparts (p < .05, Figure 3). However, serum levels of this cytokine decreased to similar levels as the control group by day 14 and registered no further increases through the end of the study.
Mouse serum interleukin-18. Serum levels of Interleukin-18 in PBS- and GNP-exposed mice were measured via enzyme-linked immunosorbent assay. Data are mean ± standard error of the mean. *p < .05 when comparing GNP and PBS groups at equivalent time points (n = 4). GNP = gold nanoparticle, PBS = phosphate-buffered saline.
Histological Examination
GNPs accumulated in all tissues examined, predominantly within the mononuclear phagocyte system (also called the reticuloendothelial system). The greatest accumulations were observed in liver and spleen. In liver, GNPs accumulated mainly in Kupffer cells, with seemingly equivalent levels for mice (Figure 4) and rats (Figure 5). Nevertheless, by 14 days postexposure, macrophages (Kupffer cells and potentially newly arrived macrophages from circulating monocytes) in the livers of mice had formed microgranulomas (macrophage clusters containing multinucleated giant cells, arrowheads in Figure 4). This was not observed in rat liver where most GNP-containing Kupffer cells stayed individualized (Figure 5). In spleen, GNP-containing macrophages were restricted, for the most part, to the red pulp, with markedly higher accumulation in rats when compared to mice (Figure 6).
Gold nanoparticles in mouse liver. Representative images of mouse liver of (A) PBS-exposed and GNP-exposed animals (B) 1 day, (C) 7 days, (D) 14 days, (E) 21 days, and (F) 28 days postexposure (hematoxylin and eosin stain). Note GNP-containing cells (arrows) as well as microgranulomas with multinucleated giant cells (arrowheads). GNP = gold nanoparticle, PBS = phosphate-buffered saline.
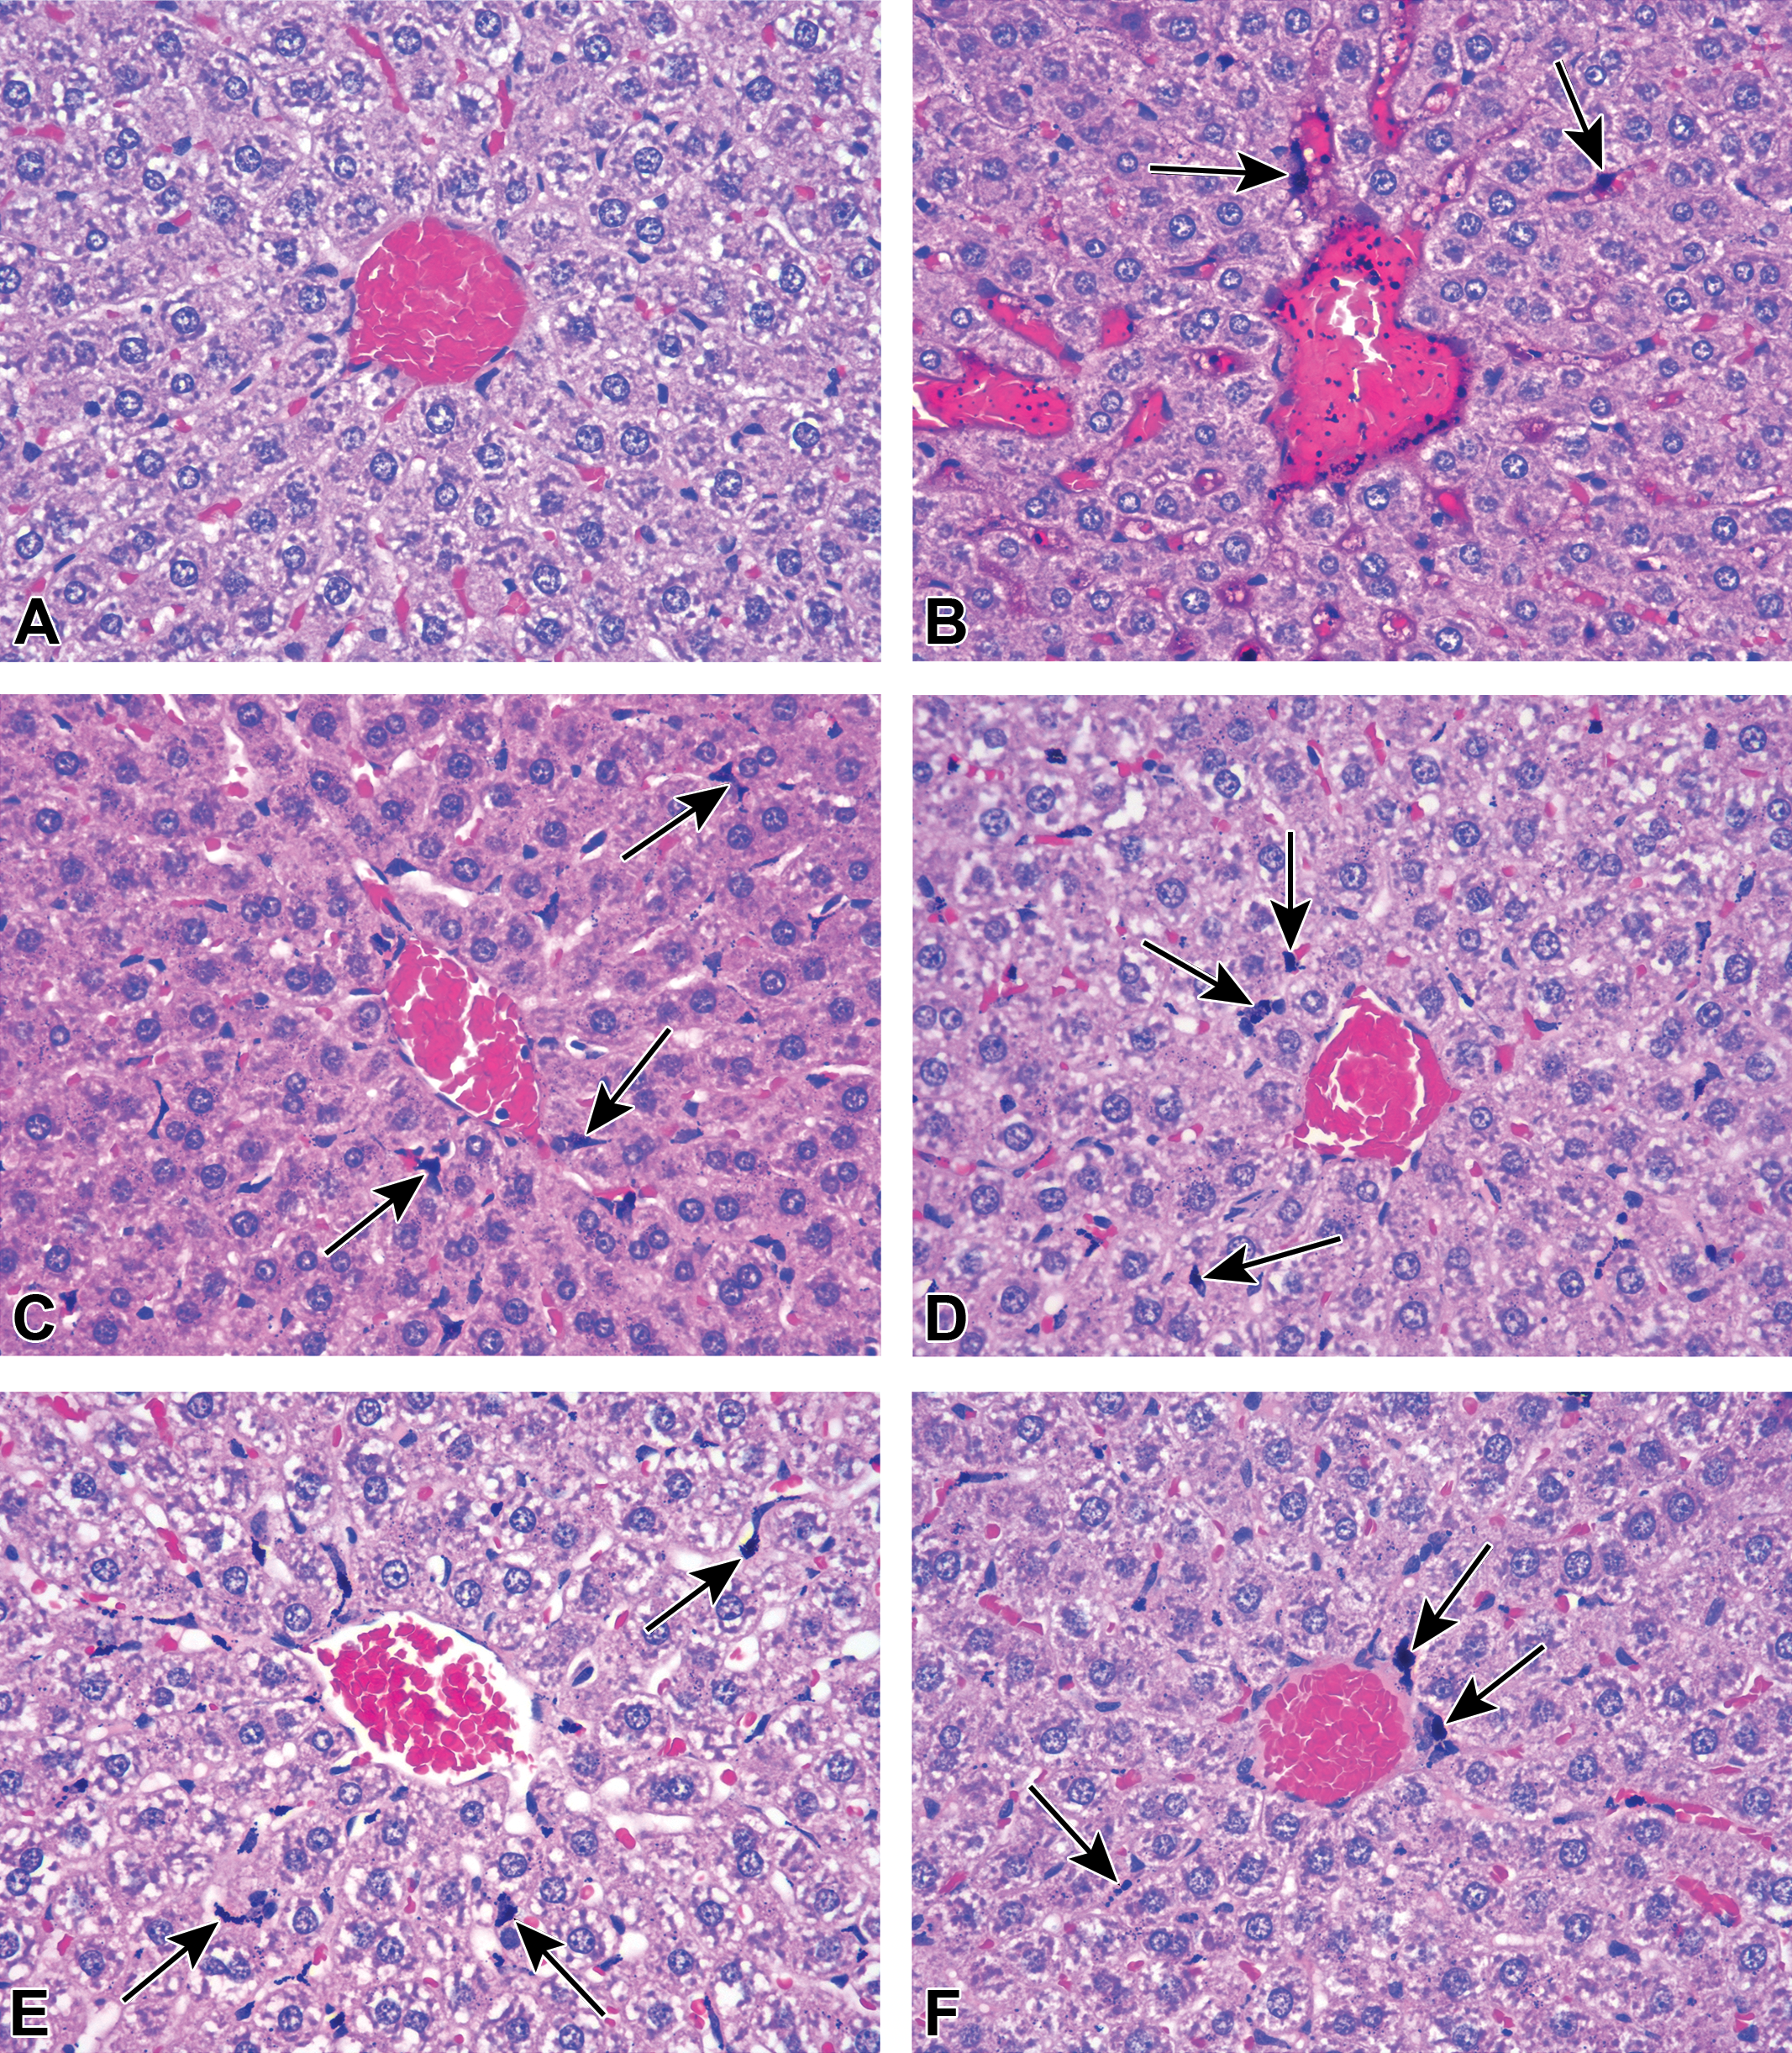
Gold nanoparticles in rat liver. Representative images of rat liver of (A) PBS-exposed and GNP-exposed animals (B) 1 day, (C) 7 days, (D) 14 days, (E) 21 days, and (F) 28 days postexposure (hematoxylin and eosin stain). Note GNPs within blood vessels 1 day post-GNP exposure (B) and GNP-containing cells (arrows). GNP = gold nanoparticle, PBS = phosphate-buffered saline.
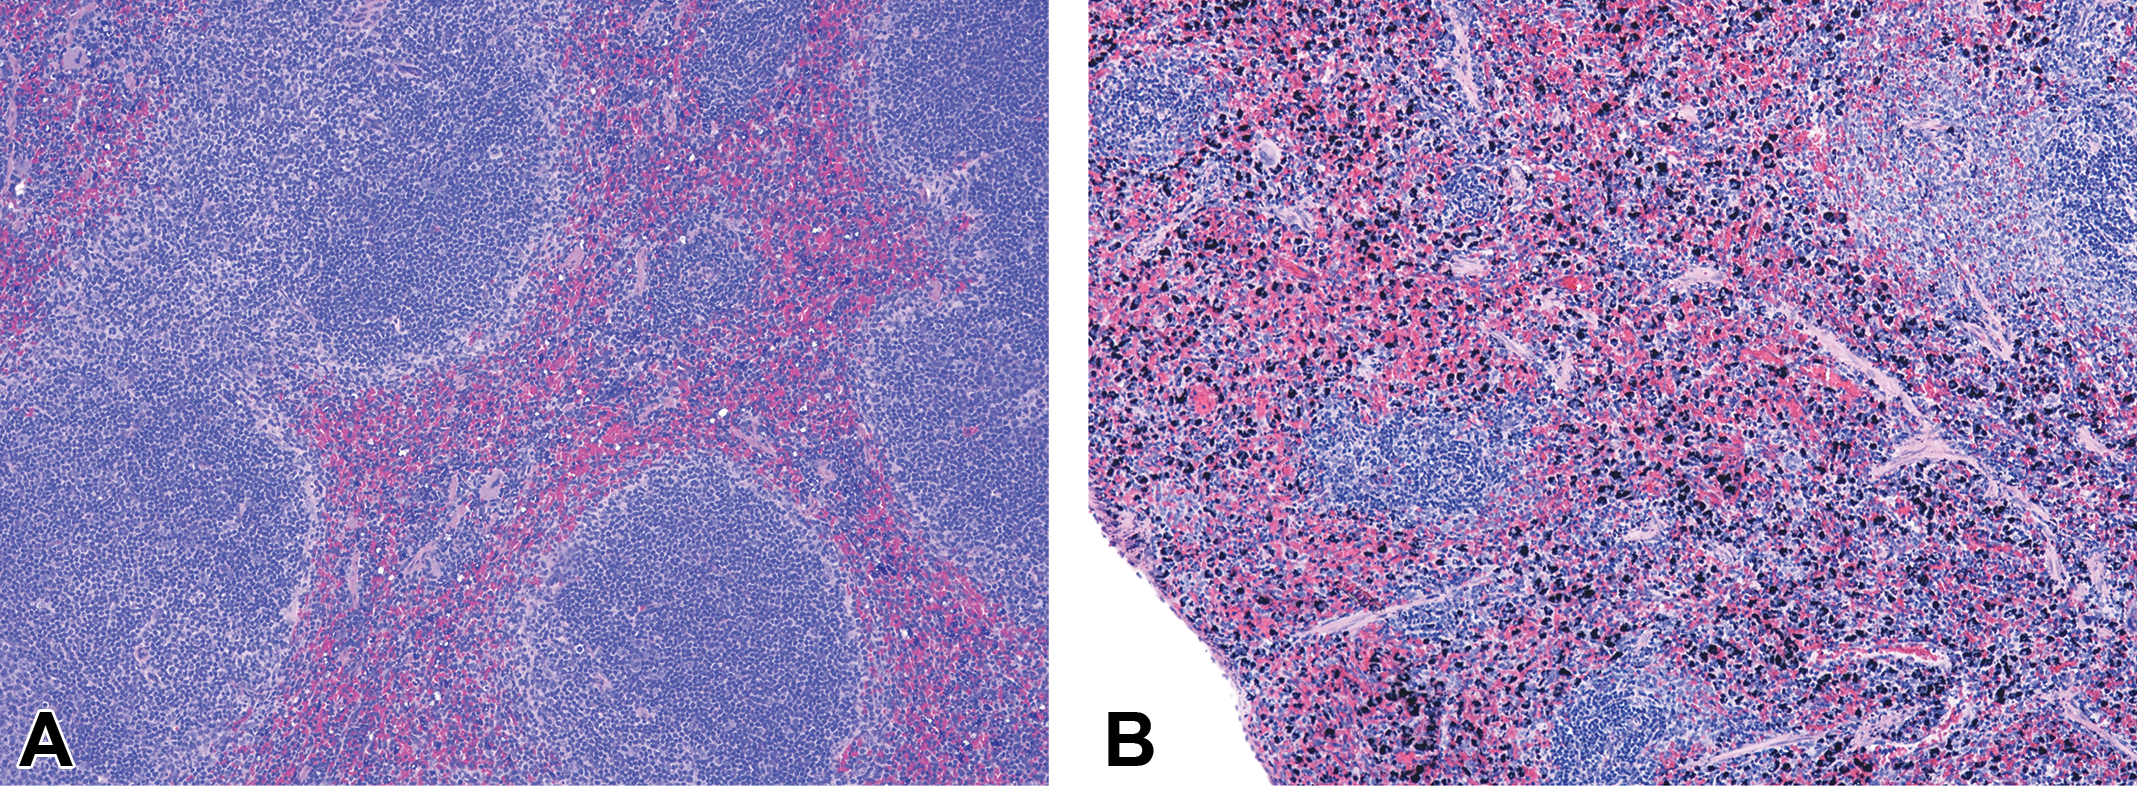
Gold nanoparticles in spleen. Representative images of (A) mouse spleen and (B) rat spleen 7 days post-GNP exposure (hematoxylin and eosin stain). Note the higher number of GNP-containing cells in rat spleen versus mouse spleen. GNP = gold nanoparticle.
Online Supplemental Figure 2 illustrates GNP accumulation in other tissues and cell types, namely, endothelial cells, brain, skin, spindle/mesenchymal cells, lung, ovary, and bone marrow. It was determined that accumulation of GNPs in tissues was responsible for the observed change in color. In general, 1 day postexposure, GNPs could be observed in blood and some tissue macrophages. By day 7, most tissue macrophages showed GNP accumulation. Interestingly, trace amounts of particles could also be observed throughout the parenchyma of diverse tissues including liver, uterus, adrenal gland, and lung. Online Supplemental Figure 3 depicts GNP-containing hepatocytes, and Online Supplemental Figure 2F illustrates GNPs throughout the pulmonary interstitium, as examples. Upon subjective evaluation, it appears the amount of GNPs distributed throughout tissue parenchyma decreased by days 21 and 28 postexposure, while tissue macrophages appeared more laden with GNPs over time. Also, this transient localization of GNPs within tissue parenchyma was more evident in rats than in mice.
Elemental Analysis of Tissues
GNPs were identified within tissues via elemental analysis with SEM-EDX. Gold is a dense material; therefore, it is seen as bright spots in SEM imaging under backscattered mode (Figure 7B). Elemental analysis via EDX demonstrated that these bright agglomerates correspond to gold (Figure 7C). Gold was absent in PBS-exposed tissues (Figure 7A).
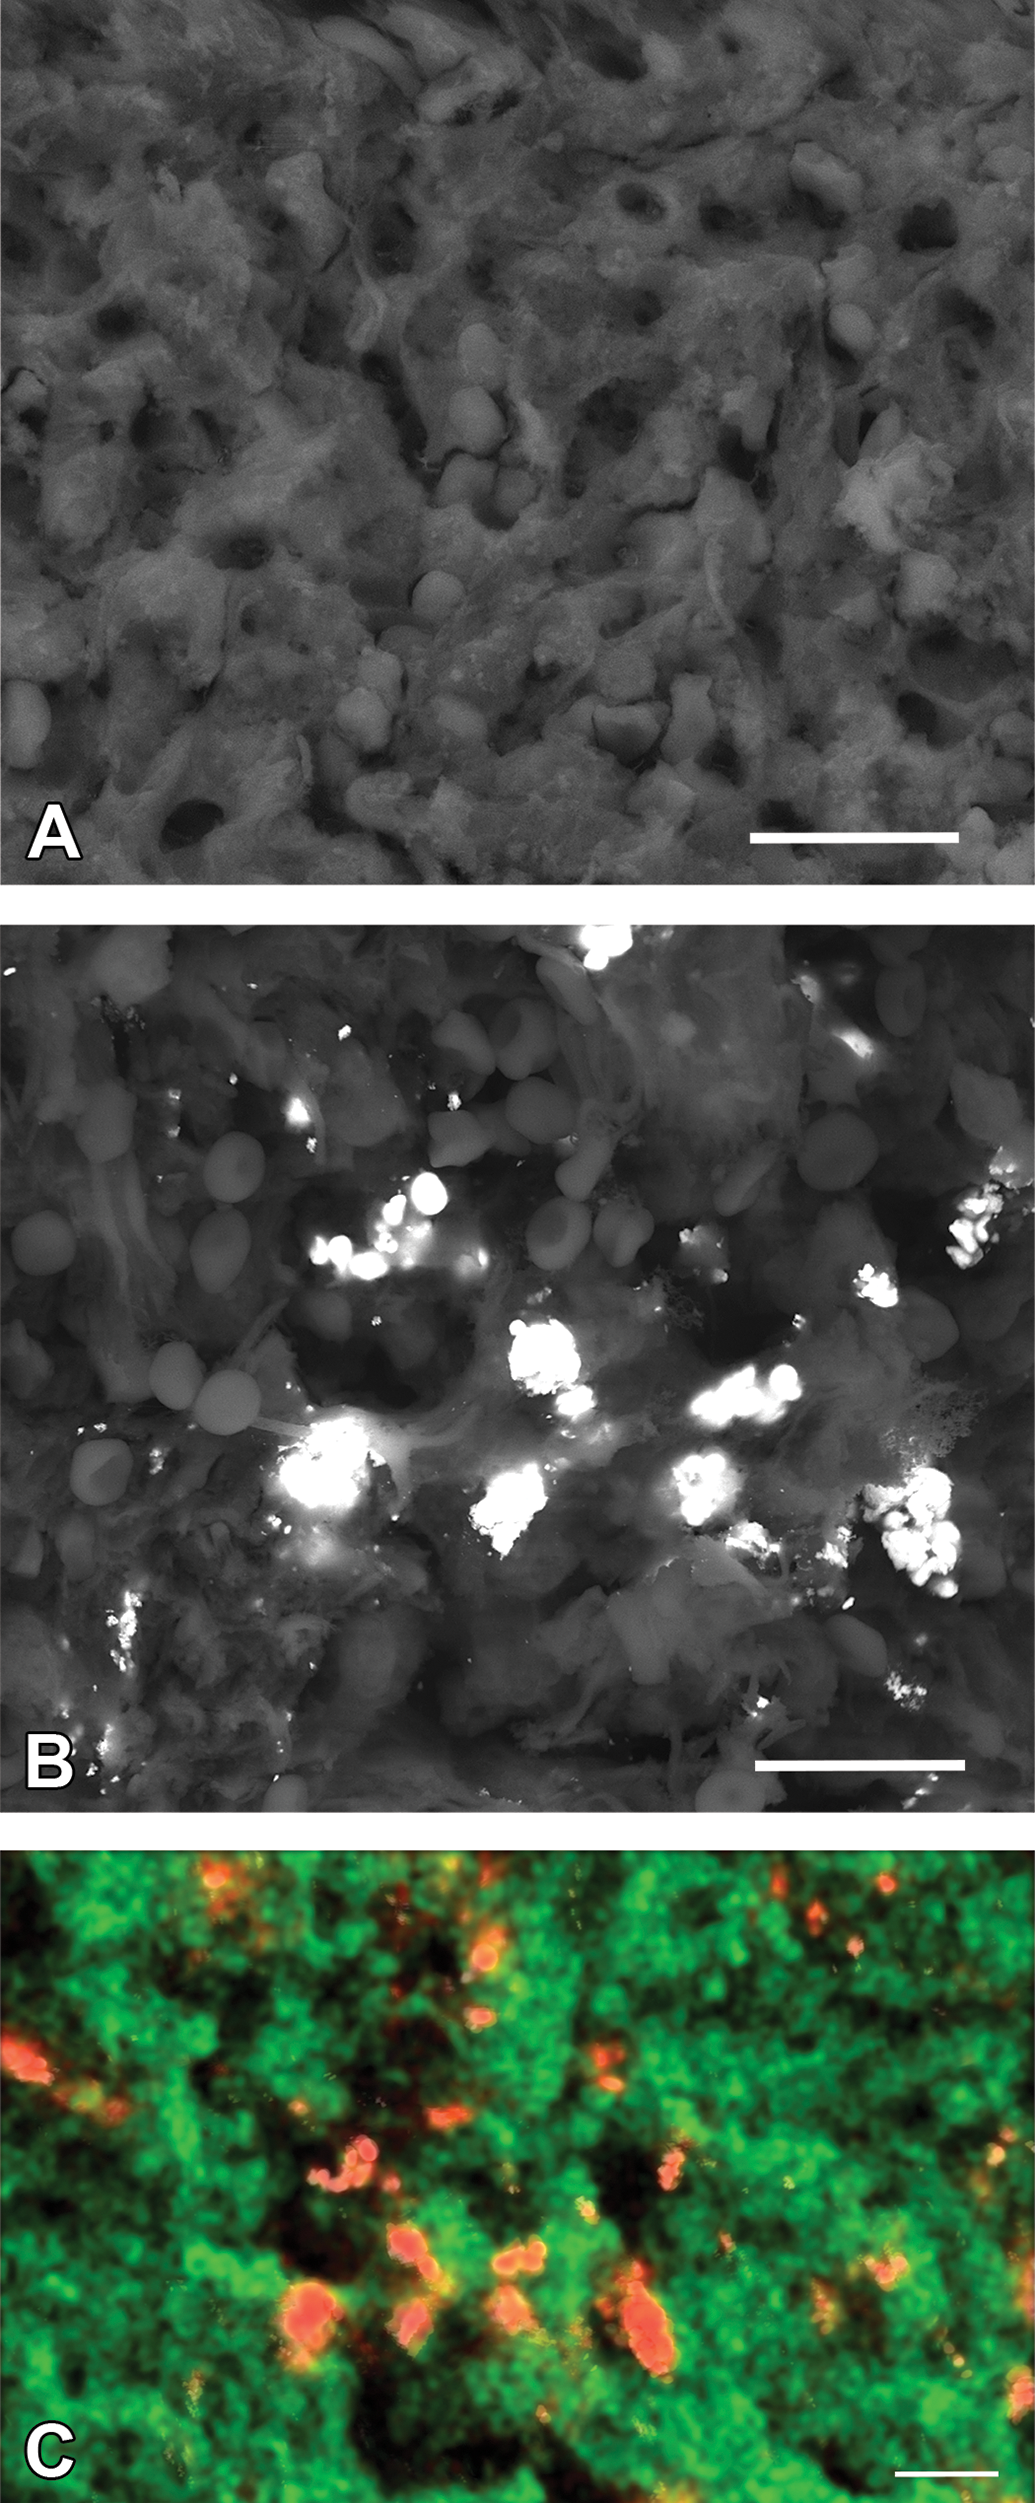
Elemental analysis of rat spleen. Representative SEM micrographs of rat spleen 28 days post- (A) PBS or (B) GNP exposure. Agglomerates of GNPs are seen as bright spots in GNP-exposed spleen. (C) Representative illustration of scanning electron microscopy with energy dispersive X-ray spectroscopy elemental analysis of rat spleen 28 days post-GNP exposure. Gold is shown in red, and carbon is shown in green, for reference. Scale bars = 10 μm. GNP = gold nanoparticle, SEM = scanning electron microscopy.
Discussion
Independent characterization of purchased GNPs demonstrated that, in general, physicochemical characteristics were in accordance with the information provided by the manufacturer; the shape was roughly spherical and the average size of the gold core was 13.09 nm, close to the advertised 15 nm. The relatively high variability detected in gold core size was expected, as industrial production of nanomaterials is likely to aim for size ranges more than for a strict size, as long as the product maintains its functionality. Hydrodynamic size, however, showed little variability. It is possible that the manufacturer’s synthesis technique yields relatively polydisperse gold cores, but after PEGylation, they might have applied a size-exclusion technique to ensure the final overall size of the GNPs was relatively monodisperse. The zeta potential deviation was rather wide, meaning that the individual zeta potential value for each particle in the GNP suspension varied significantly. This is consistent with high variability of gold:PEG ratio across the particles. GNPs prior to PEGylation are generally negatively charged, due to the use of citrate as stabilizing agent during synthesis, which is negatively charged (E. C. Cho et al. 2009a). PEG, in contrast, is generally neutral (Breton et al. 2013). Coating of GNPs with PEG has an insulating effect that lowers the zeta potential magnitude. Therefore, if the gold:PEG ratio varies across the particles, it could give rise to corresponding variations in zeta potential.
Our animal studies indicate that mice have a superior ability over rats to recognize nanoparticles and mount a robust macrophage response. This is supported by the formation of hepatic microgranulomas and the transient increase in IL-18 in GNP-exposed mice. Of note is the lack of differences between treatment groups of mice and rats in serum biochemical profile (e.g., glucose, urea nitrogen, creatinine, ALT, and AST), suggesting that GNPs do not cause any substantial metabolic, renal, or hepatic injury or dysfunction. These findings stand in contrast to previous studies in which mice exposed to a significantly lower dose (0.85 mg/kg IV) of 13-nm PEGylated GNPs had a transient increase (1 and 7 days postexposure) in indicators of oxidative stress and liver damage, even though they did not find treatment-related histologic abnormalities (W. S. Cho et al. 2010). Another study reported acute toxicity in mice after IV exposure to 13-nm PEG-GNPs (0.85 and 4.26 mg/kg), with acute liver inflammation and apoptosis (W. S. Cho et al. 2009b). Regarding rats, the authors have yet to find studies investigating the effects of IV exposure to PEGylated GNPs. Khan et al. (2013) evaluated changes in the expression of inflammatory cytokines in rat liver and kidney after single or repeated IP exposure to 10- and 50-nm citrate-coated GNPs (0.022 mg/kg daily for 1 or 5 days). They found a significant increase in the expression of pro-inflammatory cytokines in both organs after a single GNP exposure but normal expression after repeated exposures. Contrary to our results, in which no evidence of oxidative stress was found in GNP-exposed rats, a study by Siddiqi et al. (2012) demonstrated the generation of oxidative stress and impairment of antioxidant enzymes in rat brain after repeated IP exposure to 20-nm citrate-coated GNPs (0.02 mg/kg daily for 3 days). Another group reported DNA damage in the cerebral cortex of adult rats after acute (0.07 mg/kg) and chronic (same dose daily for 28 days) IP administration of 10- and 30-nm citrate-coated GNPs, with chronic exposure causing greater damage (Cardoso et al. 2014).
The observed change in color of GNP-exposed tissues can be explained by the accumulation and agglomeration of particles. GNP solutions are usually red, but this color shifts to blue-purple in response to close proximity of the particles (Kumar, Boruah, and Liang 2011), that is, agglomeration. This particularity can be used to track GNPs within tissues and to determine their agglomeration state. In our study, immediately after the GNP injection, a dark red discoloration was observed in blood and subsequently (1 day postinjection) in most tissues, which is consistent with the presence of nonagglomerated GNPs (Paciotti et al. 2004). The subsequent change in color to dark blue-purple by day 7 postexposure is consistent with GNP destabilization, agglomeration, and deposition within the tissues (Paciotti et al. 2004). This was further confirmed by the observation of GNP agglomerates within tissues via SEM (Figure 7). The integrity of the PEG coating after cellular uptake of the GNPs and its role in the intracellular destabilization and agglomeration of particles remains to be determined.
Concerning biodistribution, rats showed higher GNP accumulation in spleen than mice, and higher gold concentration was measured in rat brain 1 and 7 days postexposure as compared to mouse brain. This is consistent with an observation made by Khlebtsov and Dykman (2011) when comparing the studies by De Jong et al. (2008) and Sonavane, Tomoda, and Makino (2008), which investigated GNP biodistribution in rats and mice, respectively. They drew attention to the fact that the proportion of GNPs accumulated in rat spleen (De Jong et al. 2008) was notably higher than in mouse spleen (Sonavane, Tomoda, and Makino 2008). They also observed that relative blood levels of GNPs 1 day postexposure were higher in rats (De Jong et al. 2008) than in mice (Sonavane, Tomoda, and Makino 2008). We believe this explains the higher gold concentration measured in rat brain at earlier time points in our study, when compared to mouse brain. Blood within tissue samples is known to contribute to the nanoparticle content of the tissue (Yokel, Grulke, and MacPhail 2013). Since no attempts were made to remove the blood from tissues before gold measurements, and since the overall concentration of gold in brain was very low, it is possible that higher blood concentrations of gold in rats influenced the measurements in brain. This hypothesis is supported by the fact that GNPs were largely removed from the blood stream by 14 days postexposure (Online Supplemental Figure 1D), which coincides with the time gold concentration in rat brain decreased to similar levels than mouse brain (Figure 2D). Alternatively, this finding may indicate that GNPs are able to permeate endothelial tight junctions of the blood–brain barrier, as suggested by C.-H. Li et al. (2015). Regarding excretion, we detected very low concentration of GNPs in urine and slightly higher concentration in feces, with greater fecal excretion in rats compared to mice. Our results are in agreement with a previously published report by W. S. Cho et al. (2010), in which excretion of 13-nm PEGylated GNPs in mouse urine and bile was detected up to 7 days post-IV exposure to 0.85 mg/kg. Balasubramanian et al. (2010) demonstrated urinary and fecal excretion of 20-nm citrate-coated GNPs only up to 7 days post-IV exposure in rats, at a dose of 0.01 mg/kg. The difference with our results could be due to the significantly higher dose we administered, as well as the potential influence of the coating agent in GNP fecal excretion.
Our results demonstrate that the main cell types that internalize and accumulate GNPs are primarily tissue macrophages and secondarily vascular endothelial cells, but GNPs were also visualized within other cell types such as hepatocytes and alveolar cells. These results are in agreement with a study by Dragoni et al. (2012), in which they demonstrated GNP uptake by rat Kupffer cells, endothelial cells, and hepatocytes after IP exposure to 10 mg/kg of polyvinylpymolidone-coated 5-nm GNPs. Contrarily, other studies (W. S. Cho et al. 2010; W. S. Cho et al. 2009b, Hwang et al. 2012) found PEG-GNP accumulation exclusively in mouse Kupffer cells and macrophages, using IV doses up to 5 mg/kg. The lower doses used in the latter studies are probably the reason of the restricted detection of GNPs in cell types other than macrophages.
Finally, the sudden deaths observed in GNP-exposed rats suggest a species-specific sensitivity to GNP acute toxicity. It has been stated that nanoparticle aggregation following the systemic administration can lead to capillary occlusion and subsequent organ damage (Thakor et al. 2011). It is well known that the brain is extremely sensitive to hypoxia/ischemia, and we found higher levels of gold in rat brain when compared to mice brain at early time points; therefore, it is possible that the high levels of GNPs in the rat brain contributed to brain ischemia and sudden deaths. However, no publications support this hypothesis, and the cause of death of the rats could not be determined. Further research is needed in order to elucidate the significance of this finding.
In conclusion, our findings demonstrate differences between mice and rats regarding biodistribution, excretion, and pathophysiologic response to IV exposure to PEGylated GNPs. The deleterious effects documented here should be viewed in light of the dose administered. The use of nanoparticles in the biomedical field may yield benefits that outweigh potential harm; however, this study highlights the need for judicious use of such technology including further studies on species-specific differences in reactions and sensitivities.
Supplemental Material
Supplemental Material, DS1A_TPX_10.1177_0192623318770608 - Gold Nanoparticle Toxicity in Mice and Rats: Species Differences
Supplemental Material, DS1A_TPX_10.1177_0192623318770608 for Gold Nanoparticle Toxicity in Mice and Rats: Species Differences by Javiera Bahamonde, Bonnie Brenseke, Matthew Y. Chan, Ronald D. Kent, Peter J. Vikesland, and M. Renee Prater in Toxicologic Pathology
Supplemental Material
Supplemental Material, DS1B_TPX_10.1177_0192623318770608 - Gold Nanoparticle Toxicity in Mice and Rats: Species Differences
Supplemental Material, DS1B_TPX_10.1177_0192623318770608 for Gold Nanoparticle Toxicity in Mice and Rats: Species Differences by Javiera Bahamonde, Bonnie Brenseke, Matthew Y. Chan, Ronald D. Kent, Peter J. Vikesland, and M. Renee Prater in Toxicologic Pathology
Supplemental Material
Supplemental Material, DS1C_TPX_10.1177_0192623318770608 - Gold Nanoparticle Toxicity in Mice and Rats: Species Differences
Supplemental Material, DS1C_TPX_10.1177_0192623318770608 for Gold Nanoparticle Toxicity in Mice and Rats: Species Differences by Javiera Bahamonde, Bonnie Brenseke, Matthew Y. Chan, Ronald D. Kent, Peter J. Vikesland, and M. Renee Prater in Toxicologic Pathology
Supplemental Material
Supplemental Material, DS1D_TPX_10.1177_0192623318770608 - Gold Nanoparticle Toxicity in Mice and Rats: Species Differences
Supplemental Material, DS1D_TPX_10.1177_0192623318770608 for Gold Nanoparticle Toxicity in Mice and Rats: Species Differences by Javiera Bahamonde, Bonnie Brenseke, Matthew Y. Chan, Ronald D. Kent, Peter J. Vikesland, and M. Renee Prater in Toxicologic Pathology
Supplemental Material
Supplemental Material, DS2A_TPX_10.1177_0192623318770608 - Gold Nanoparticle Toxicity in Mice and Rats: Species Differences
Supplemental Material, DS2A_TPX_10.1177_0192623318770608 for Gold Nanoparticle Toxicity in Mice and Rats: Species Differences by Javiera Bahamonde, Bonnie Brenseke, Matthew Y. Chan, Ronald D. Kent, Peter J. Vikesland, and M. Renee Prater in Toxicologic Pathology
Supplemental Material
Supplemental Material, DS2B_TPX_10.1177_0192623318770608 - Gold Nanoparticle Toxicity in Mice and Rats: Species Differences
Supplemental Material, DS2B_TPX_10.1177_0192623318770608 for Gold Nanoparticle Toxicity in Mice and Rats: Species Differences by Javiera Bahamonde, Bonnie Brenseke, Matthew Y. Chan, Ronald D. Kent, Peter J. Vikesland, and M. Renee Prater in Toxicologic Pathology
Supplemental Material
Supplemental Material, DS2C_TPX_10.1177_0192623318770608 - Gold Nanoparticle Toxicity in Mice and Rats: Species Differences
Supplemental Material, DS2C_TPX_10.1177_0192623318770608 for Gold Nanoparticle Toxicity in Mice and Rats: Species Differences by Javiera Bahamonde, Bonnie Brenseke, Matthew Y. Chan, Ronald D. Kent, Peter J. Vikesland, and M. Renee Prater in Toxicologic Pathology
Supplemental Material
Supplemental Material, DS2D_TPX_10.1177_0192623318770608 - Gold Nanoparticle Toxicity in Mice and Rats: Species Differences
Supplemental Material, DS2D_TPX_10.1177_0192623318770608 for Gold Nanoparticle Toxicity in Mice and Rats: Species Differences by Javiera Bahamonde, Bonnie Brenseke, Matthew Y. Chan, Ronald D. Kent, Peter J. Vikesland, and M. Renee Prater in Toxicologic Pathology
Supplemental Material
Supplemental Material, DS2E_TPX_10.1177_0192623318770608 - Gold Nanoparticle Toxicity in Mice and Rats: Species Differences
Supplemental Material, DS2E_TPX_10.1177_0192623318770608 for Gold Nanoparticle Toxicity in Mice and Rats: Species Differences by Javiera Bahamonde, Bonnie Brenseke, Matthew Y. Chan, Ronald D. Kent, Peter J. Vikesland, and M. Renee Prater in Toxicologic Pathology
Supplemental Material
Supplemental Material, DS2F_TPX_10.1177_0192623318770608 - Gold Nanoparticle Toxicity in Mice and Rats: Species Differences
Supplemental Material, DS2F_TPX_10.1177_0192623318770608 for Gold Nanoparticle Toxicity in Mice and Rats: Species Differences by Javiera Bahamonde, Bonnie Brenseke, Matthew Y. Chan, Ronald D. Kent, Peter J. Vikesland, and M. Renee Prater in Toxicologic Pathology
Supplemental Material
Supplemental Material, DS2G_TPX_10.1177_0192623318770608 - Gold Nanoparticle Toxicity in Mice and Rats: Species Differences
Supplemental Material, DS2G_TPX_10.1177_0192623318770608 for Gold Nanoparticle Toxicity in Mice and Rats: Species Differences by Javiera Bahamonde, Bonnie Brenseke, Matthew Y. Chan, Ronald D. Kent, Peter J. Vikesland, and M. Renee Prater in Toxicologic Pathology
Supplemental Material
Supplemental Material, DS2H_TPX_10.1177_0192623318770608 - Gold Nanoparticle Toxicity in Mice and Rats: Species Differences
Supplemental Material, DS2H_TPX_10.1177_0192623318770608 for Gold Nanoparticle Toxicity in Mice and Rats: Species Differences by Javiera Bahamonde, Bonnie Brenseke, Matthew Y. Chan, Ronald D. Kent, Peter J. Vikesland, and M. Renee Prater in Toxicologic Pathology
Supplemental Material
Supplemental Material, DS3_TPX_10.1177_0192623318770608 - Gold Nanoparticle Toxicity in Mice and Rats: Species Differences
Supplemental Material, DS3_TPX_10.1177_0192623318770608 for Gold Nanoparticle Toxicity in Mice and Rats: Species Differences by Javiera Bahamonde, Bonnie Brenseke, Matthew Y. Chan, Ronald D. Kent, Peter J. Vikesland, and M. Renee Prater in Toxicologic Pathology
Supplemental Material
Supplemental Material, DS4_TPX_10.1177_0192623318770608 - Gold Nanoparticle Toxicity in Mice and Rats: Species Differences
Supplemental Material, DS4_TPX_10.1177_0192623318770608 for Gold Nanoparticle Toxicity in Mice and Rats: Species Differences by Javiera Bahamonde, Bonnie Brenseke, Matthew Y. Chan, Ronald D. Kent, Peter J. Vikesland, and M. Renee Prater in Toxicologic Pathology
Supplemental Material
Supplemental Material, DS5_TPX_10.1177_0192623318770608 - Gold Nanoparticle Toxicity in Mice and Rats: Species Differences
Supplemental Material, DS5_TPX_10.1177_0192623318770608 for Gold Nanoparticle Toxicity in Mice and Rats: Species Differences by Javiera Bahamonde, Bonnie Brenseke, Matthew Y. Chan, Ronald D. Kent, Peter J. Vikesland, and M. Renee Prater in Toxicologic Pathology
Footnotes
Authors’ Note
Both Javiera Bahamonde and Bonnie Brenseke contributed equally to the study.
Acknowledgments
The authors would like to thank Betsy Midkiff, Marlice Vonck, Jenn Rudd, Barbara Wheeler, Kathy Lowe, and Geraldine Magnin-Bissel for their technical assistance, Ana María Ortega for her statistical assistance, and Stephen McCartney from the ICTAS Nanoscale Characterization and Fabrication Laboratory for his assistance with SEM-EDX.
Author Contributions
Authors contributed to conception or design (JB, BB, MC, PV, MP); data acquisition, analysis, or interpretation (JB, BB, MC, RK, PV, MP); drafting the manuscript (JB, BB); and critically revising the manuscript (JB, BB, MC, RK, PV, MP). All authors gave final approval and agreed to be accountable for all aspects of work in ensuring that questions relating to the accuracy or integrity of any part of the work are appropriately investigated and resolved.
Declaration of Conflicting Interests
The authors declared no potential conflicts of interest with respect to the research, authorship, and/or publication of this article.
Funding
The author(s) disclosed receipt of the following financial support for the research, authorship, and/or publication of this article: This work was supported by the Institute of Critical Technology and Applied Science (ICTAS) at Virginia Tech and the Edward Via College of Osteopathic Medicine.
Supplemental Material
Supplementary material for this article is available online.
References
Supplementary Material
Please find the following supplemental material available below.
For Open Access articles published under a Creative Commons License, all supplemental material carries the same license as the article it is associated with.
For non-Open Access articles published, all supplemental material carries a non-exclusive license, and permission requests for re-use of supplemental material or any part of supplemental material shall be sent directly to the copyright owner as specified in the copyright notice associated with the article.