
Abstract
The 2017 annual National Toxicology Program Satellite Symposium, entitled “Pathology Potpourri,” was held in Montreal, Quebec, Canada at the Society of Toxicologic Pathology’s 36th annual meeting. The goal of this symposium was to present and discuss challenging diagnostic pathology and/or nomenclature issues. This article presents summaries of the speakers’ talks along with select images that were used by the audience for voting and discussion. Various lesions and other topics covered during the symposium included renal papillary degeneration in perinatally exposed animals, an atriocaval mesothelioma, an unusual presentation of an alveolar–bronchiolar carcinoma, a paraganglioma of the organ of Zuckerkandl (also called an extra-adrenal pheochromocytoma), the use of human muscle samples to illustrate the challenges of manual scoring of fluorescent staining, intertubular spermatocytic seminomas, medical device pathology assessment and discussion of the approval process, collagen-induced arthritis, incisor denticles, ameloblast degeneration and poorly mineralized enamel matrix, connective tissue paragangliomas, microcystin-LR toxicity, perivascular mast cells in the forebrain thalamus unrelated to treatment, and 2 cases that provided a review of the International Harmonization of Nomenclature and Diagnostic Criteria (INHAND) bone nomenclature and recommended application of the terminology in routine nonclinical toxicity studies.
Keywords
The National Toxicology Program (NTP) Satellite Symposium is a 1-day meeting that has traditionally been held in conjunction with the annual Society of Toxicologic Pathology (STP) meeting (Adams et al. 2011; Bach et al. 2010; Boorman et al. 2012; Elmore et al. 2014; Elmore et al. 2015; Elmore et al. 2016; Elmore et al. 2017). The objective of this annual symposium is to provide continuing education on interpreting histopathology slides. This includes the presentation and discussion of diagnostically difficult, interesting, or rare lesions, or challenging nomenclature issues. The session is interactive in that each speaker presents images for audience voting via wireless keypads. Once the votes are tallied, the results are displayed for all to view. The speaker generally provides a preferred diagnosis and some additional background information, after which lively and constructive discussion ensues.
The theme of the 2017 Symposium was “Pathology Potpourri,” which allowed for a variety of topics to be presented. The format for this year’s symposium included a mixture of various unusual, rare, or interesting rodent spontaneous and treatment-related lesions as well as updates on manual scoring, medical device pathology, and recommended musculoskeletal nomenclature. Tissues included kidney, heart, lung, organ of Zuckerkandl, skeletal muscle, testes, bone, teeth, liver, and brain. The challenges of evaluating fluorescent staining using a manual scoring paradigm were discussed. Cognitive and visual traps that can influence the manual estimation of cell numbers or the perception of staining intensity in general were shown to demonstrate how such issues can have an effect on the evaluation of fluorescently labeled sections and manual scoring in general. A discussion of medical device pathology assessment was illustrated with a medical device implantation study where 2 different articles were implanted in the epaxial skeletal muscle of a New Zealand white rabbit with an overview of microscopic factors listed for evaluation in the International Organization for Standardization (ISO) 10993-6 guidance as well as the regulatory approval process. Investigative studies were presented to demonstrate the presence of mast cells in the rat brain independent of treatment, sex, and strain. Finally, a presentation was given on behalf of the International Harmonization of Nomenclature and Diagnostic Criteria (INHAND) Musculoskeletal Organ Working Group that reviewed the INHAND bone nomenclature and recommended terminology for routine nonclinical toxicity studies. The recommendation for descriptive nomenclature was emphasized. This article provides synopses of all presentations including the diagnostic or nomenclature issues, a selection of images presented for voting and discussion, voting choices, voting results, and major discussion points. Due to space constraints, not all of the images presented for voting are included in the synopses.
Renal Papillary (and Pelvic) Perplexities
Dr. Torrie A. Crabbs (Experimental Pathology Laboratories, Inc., [EPL] Research Triangle Park [RTP], NC) started the day by presenting 2 renal cases that highlighted findings in the pelvis or papillary region of Harlan Sprague Dawley (HSD) rats from NTP 2-year carcinogenicity and toxicity bioassays.
The first case presentation was from a terminal sacrifice mid-dose male HSD rat with no clinical signs or clinicopathologic abnormalities. At necropsy, a cyst was noted in the right kidney; representative photomicrographs of this unilateral finding were presented to the audience (Figure 1A–D). Microscopically, the lesion was characterized by a large, infiltrative mass that dilated the pelvis and extended into the ureter and perirenal tissues. The mass was composed of moderately to densely packed round to polygonal cells, with little to no collagenous stroma. In some areas, the cells resembled normal lipocytes with a clear central vacuole and a peripheral nucleus; while in others, the cells were spindyloid to polygonal with rare intracytoplasmic vacuoles. There was marked proliferation of the overlying urothelium and frequent nests and islands of urothelium were entrapped within the larger mesenchymal mass (Figure 1D).
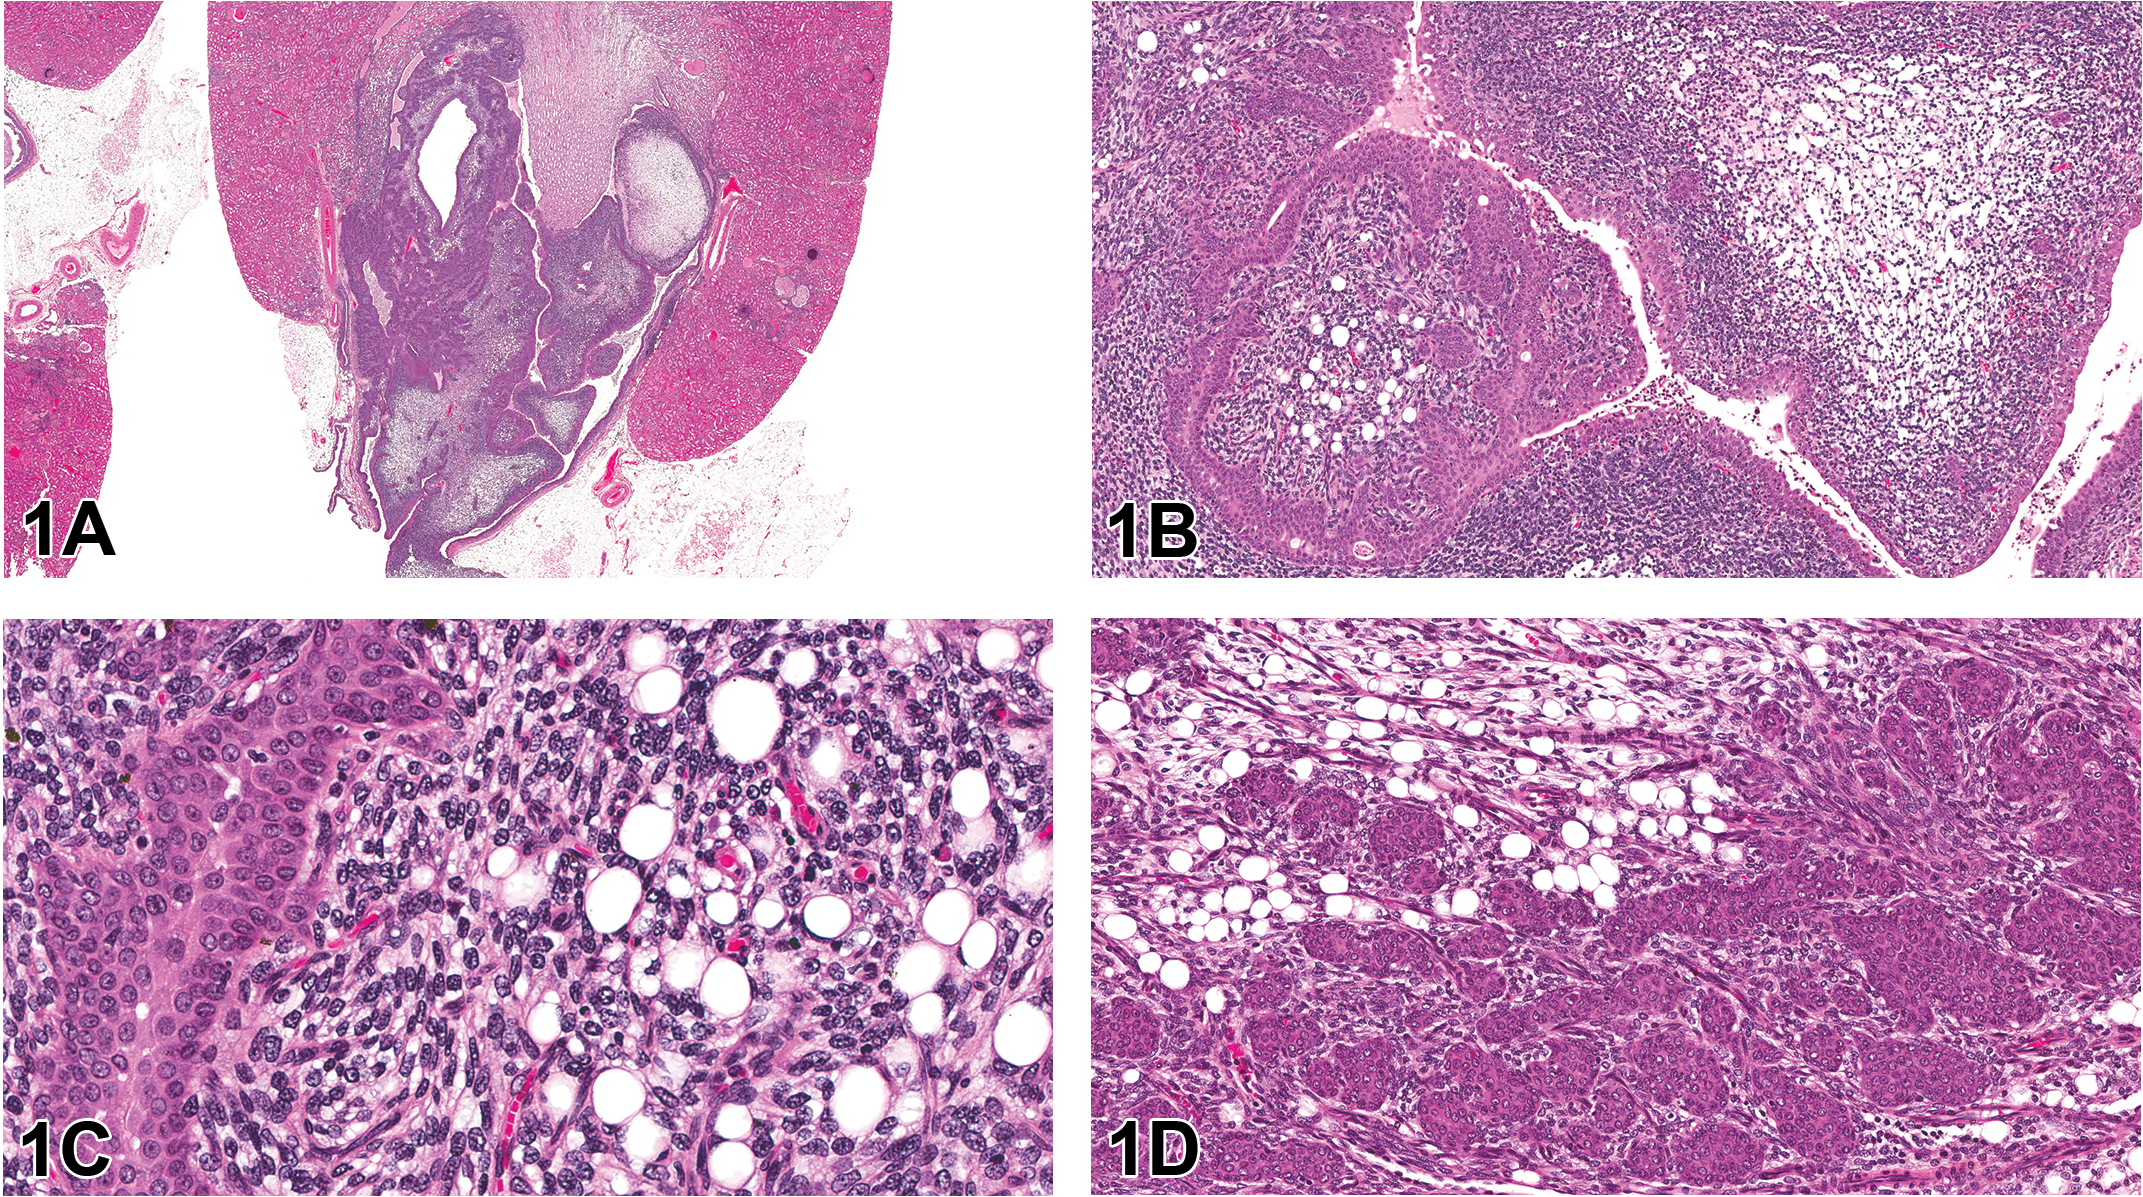
Renal tumor from a 2-year-old Harlan Sprague Dawley (HSD) male mid-dose rat presented in case 1. Figure A shows a low-magnification image of the infiltrative unilateral renal tumor that distends the pelvis and extends into the ureter and perirenal tissues. Higher magnifications of the neoplasm (B, C) show that, in some areas, the mass is composed of moderately to densely packed round to polygonal cells that resemble normal lipocytes, while in other areas, the cells are more spindyloid to polygonal with rare intracytoplasmic vacuoles. There is marked proliferation of the overlying urothelium and frequent nests and islands of urothelium entrapped within the larger mesenchymal mass (D). Hematoxylin and eosin (H&E).
The audience was asked to vote on both the mesenchymal and epithelial/urothelial components of the lesion. The voting choices, with audience poll results listed in parentheses, were as follows: renal mesenchymal tumor (RMT) and urothelial hyperplasia (32%), RMT and urothelial carcinoma (21%), liposarcoma and urothelial hyperplasia (14%), liposarcoma and urothelial carcinoma (14%), lipoma and urothelial hyperplasia (3%), lipoma and urothelial carcinoma (5%), renal sarcoma and urothelial hyperplasia (5%), renal sarcoma and urothelial carcinoma (5%), and other (1%). Due to time constraints, differentiation between urothelial hyperplasia and neoplasia was unable to be discussed, but Dr. Crabbs informed the audience the consensus of the NTP Pathology Working Group (PWG) was that the urothelial proliferation in this animal was nonneoplastic and extremely typical of the type and extent of urothelial hyperplasia that commonly occurs secondary to any space occupying mass affecting the renal pelvis. With regard to the mesenchymal component of the mass, the audience predominately voted for RMT. While RMT was discussed as a potential differential diagnosis at the NTP PWG, the consensus diagnosis of the PWG was that of liposarcoma.
During the presentation, the similarities and differences between each of the 4 main differential diagnoses (RMT, lipoma, liposarcoma, and renal sarcoma) were reviewed; a summary of these features is presented in Table 1. Particular attention was given to differentiating liposarcoma from RMT. Both are infiltrative tumors that tend to originate in the outer stripe of the outer medulla. Both are composed of heterogeneous cell populations; however, cellular differentiation in liposarcomas exclusively occurs along the fat cell line. In contrast, RMTs are composed of a spectrum of connective tissue cells, predominately spindle cells, stellate cells, and smooth muscle cells but also less commonly, rhabdomyoblasts, striated muscle cells, cartilage, osteoid, and/or hemangiosarcomatous areas. Reticulin and abundant collagen deposition are key features of an RMT, while neither is present in significant amounts in liposarcomas. Preexisting renal tubules are often sequestered in both tumors; however, in RMTs, the tubular structures tend to survive and/or become hyperplastic, whereas in liposarcomas, the entrapped structures tend to become cystic or atrophic with a thickened basement membrane.
Summary of Similarities and Differences between the 4 Main Renal Tumor Types.
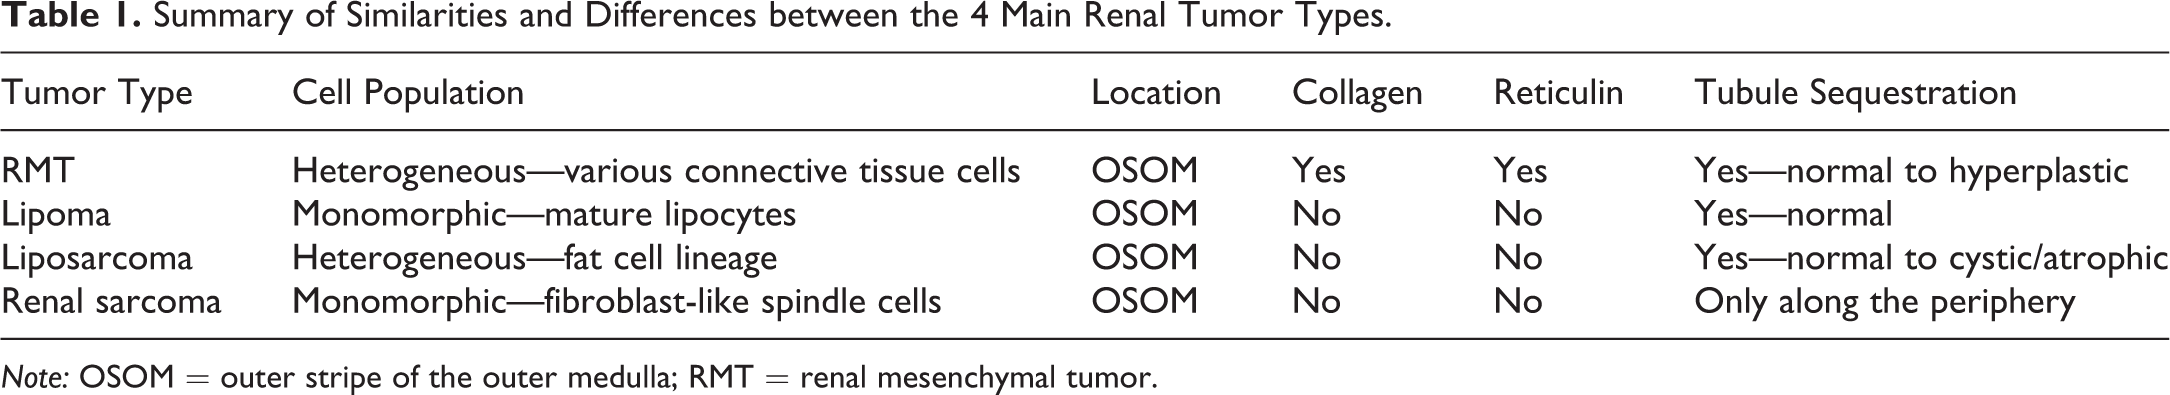
Note: OSOM = outer stripe of the outer medulla; RMT = renal mesenchymal tumor.
The second case presentation was from a terminal sacrifice high-dose male HSD rat involved in a dosed-feed perinatal exposure study (i.e., animals were fed 1 of 4 concentrations of the compound or vehicle feed from gestation day 6 to 2 years postweaning). There were no clinical signs or macroscopic abnormalities. Histologically, there was bilateral involvement of the renal papillae, which was characterized by marked dilation and/or distortion of the collecting ducts and moderate to marked expansion of the interstitium by pale eosinophilic to fibrillary amphophilic material. The affected ducts were lined by thin, attenuated epithelial cells. Pyknotic nuclei were occasionally noted, and there were regions of hemorrhage. The audience was shown representative photomicrographs of these changes (Figure 1E–H). The voting choices and results were as follows: edema (54.1%), increased extracellular matrix (28.7%), degeneration (6.4%), rarefaction (4.5%), unremarkable (3.8%), and necrosis (2.5%).
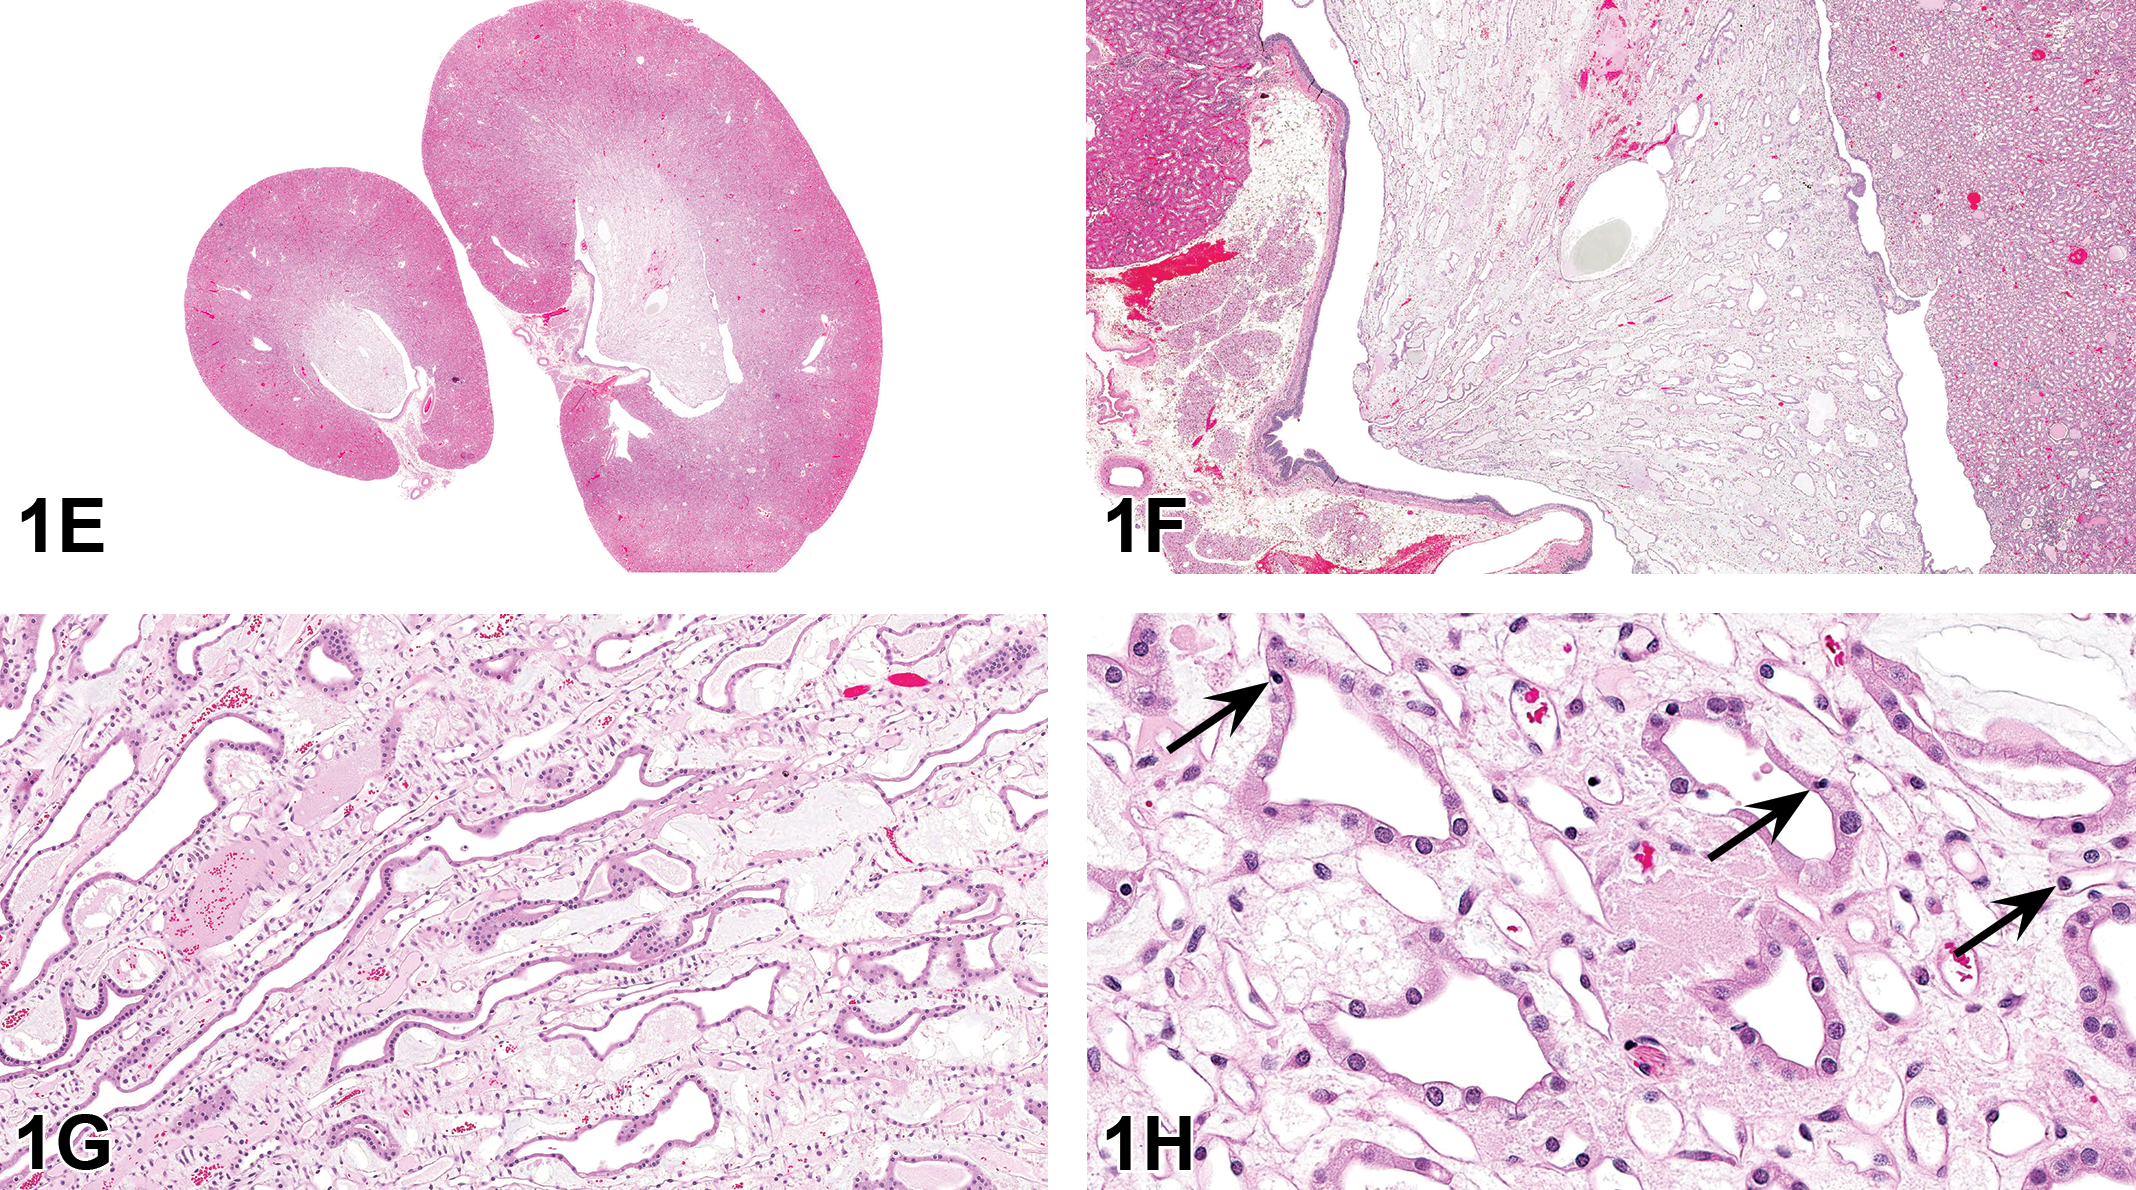
Renal papillary changes from the high-dose male HSD rat presented in case 2. The low-magnification image shows that the papillae are bilaterally and diffusely expanded (E). Higher magnifications demonstrate that the expansion is due to marked dilation and/or distortion of the collecting ducts and increased amounts of pale eosinophilic to fibrillary amphophilic interstitial material (F, G). Figure H demonstrates that the affected ducts are lined by thin, attenuated epithelial cells, and pyknotic nuclei are occasionally present (arrows).
It was noted that this finding was not discovered until the peer review process and was pharmacologically unexpected. The changes were recorded by the peer review pathologist as edema (interstitium) and degeneration (renal tubules); however, this compound is still on study and has yet to be reviewed by a PWG. Therefore, suggestions and guidance from the audience were welcomed.
In an effort to further characterize the papillary changes, kidney sections were stained with periodic acid Schiff (PAS) and Alcian blue. PAS demonstrated that the basement membrane of vascular structures, in addition to the renal tubules in the cortex and outer medulla, was intact. However, there was an abrupt loss of PAS staining of the renal tubules at the junction of the outer and inner medulla. The interstitial material stained positively for Alcian blue, a special stain for glycosaminoglycans.
This was an exposure-related finding that was bilaterally present in the papillae of the majority of perinatally exposed high-dose males (78%) and females (74%). Interestingly, the finding was not present in any males or females from the companion study. In the companion study, HSD rats were dosed-fed identical concentrations of the compound but did not begin exposure until 6 to 8 weeks of age. Thus, it is presumed that the renal changes in the perinatally exposed rats represent a perinatal nephrotoxicity that targeted the collecting ducts and directly or indirectly interfered with their proper development. The basement membrane is structurally less rigid during early development; therefore, there is an increased tendency for tubular dilation to occur secondary to epithelial dropout.
In response to audience members’ questions concerning the distribution and bilateral involvement of the finding, Dr. Crabbs stated that the finding uniformly affected the papillae and that the finding was always bilateral. One audience member suggested using fluorescence imaging to evaluate whether there was a lymphatic component to the changes.
Dr. Crabbs concluded her presentation by stressing 3 important take-home points garnered from this study: (1) perinatal/juvenile toxicity studies are extremely important, as they can demonstrate toxicities not detected during traditional routine studies; (2) identifying histologic changes is often easier than interpreting them, as knowledge of organ development, physiology, and anatomy, in addition to pharmacologic activity of the compound and its metabolites, is often required; and (3) peer reviews are critical—even the very best pathologists can miss important findings.
Straight from the Heart
Dr. Ramesh Kovi (EPL) presented a rare and interesting neoplasm involving the right atrium of the heart in a rat. The other pathologists involved in the review of this case included the study pathologist from the National Center for Toxicologic Research (NCTR), the quality assurance (QA) pathologist from EPL, and the PWG pathologists from the National Institute of Environmental Health Sciences (NIEHS) and the NTP. Dr. Kyathanahalli Janardhan (Integrated Laboratory Systems [ILS], RTP, NC) provided immunohistochemistry (IHC) oversight for this study.
An NCTR male Sprague Dawley (SD) rat from a 1-year subchronic oral gavage study had a right atrial mass. There were no treatment-related findings in either the 1-year subchronic or 2-year chronic studies for this compound. Low- and high-magnification histomicrographs of the heart revealed an unencapsulated, expansile neoplastic mass involving the right atrial wall (Figure 2A–D) were presented. The tumor was composed of variably sized glandular structures lined by a single layer of nonciliated cuboidal to columnar epithelium, supported by a moderate amount of fibrovascular stroma. The lumens were often filled with an eosinophilic amorphous secretory material admixed with large numbers of pigment-laden macrophages, neutrophils, lymphocytes, plasma cells, cellular debris, and hemoglobin crystals. The voting choices and results were as follows: metastatic adenocarcinoma (12%), rhabdomyosarcoma (10%), chemodectoma (17%), hemangiosarcoma (39%), mesothelioma (15%), schwannoma (5%), and other (2%). Dr. Kovi briefly discussed each of these possibilities and then described the morphological features of atriocaval mesothelioma as a preferred diagnosis for this case and as previously described by others (Goodal, Christie, and Hurley 1975; Peano et al. 1998).
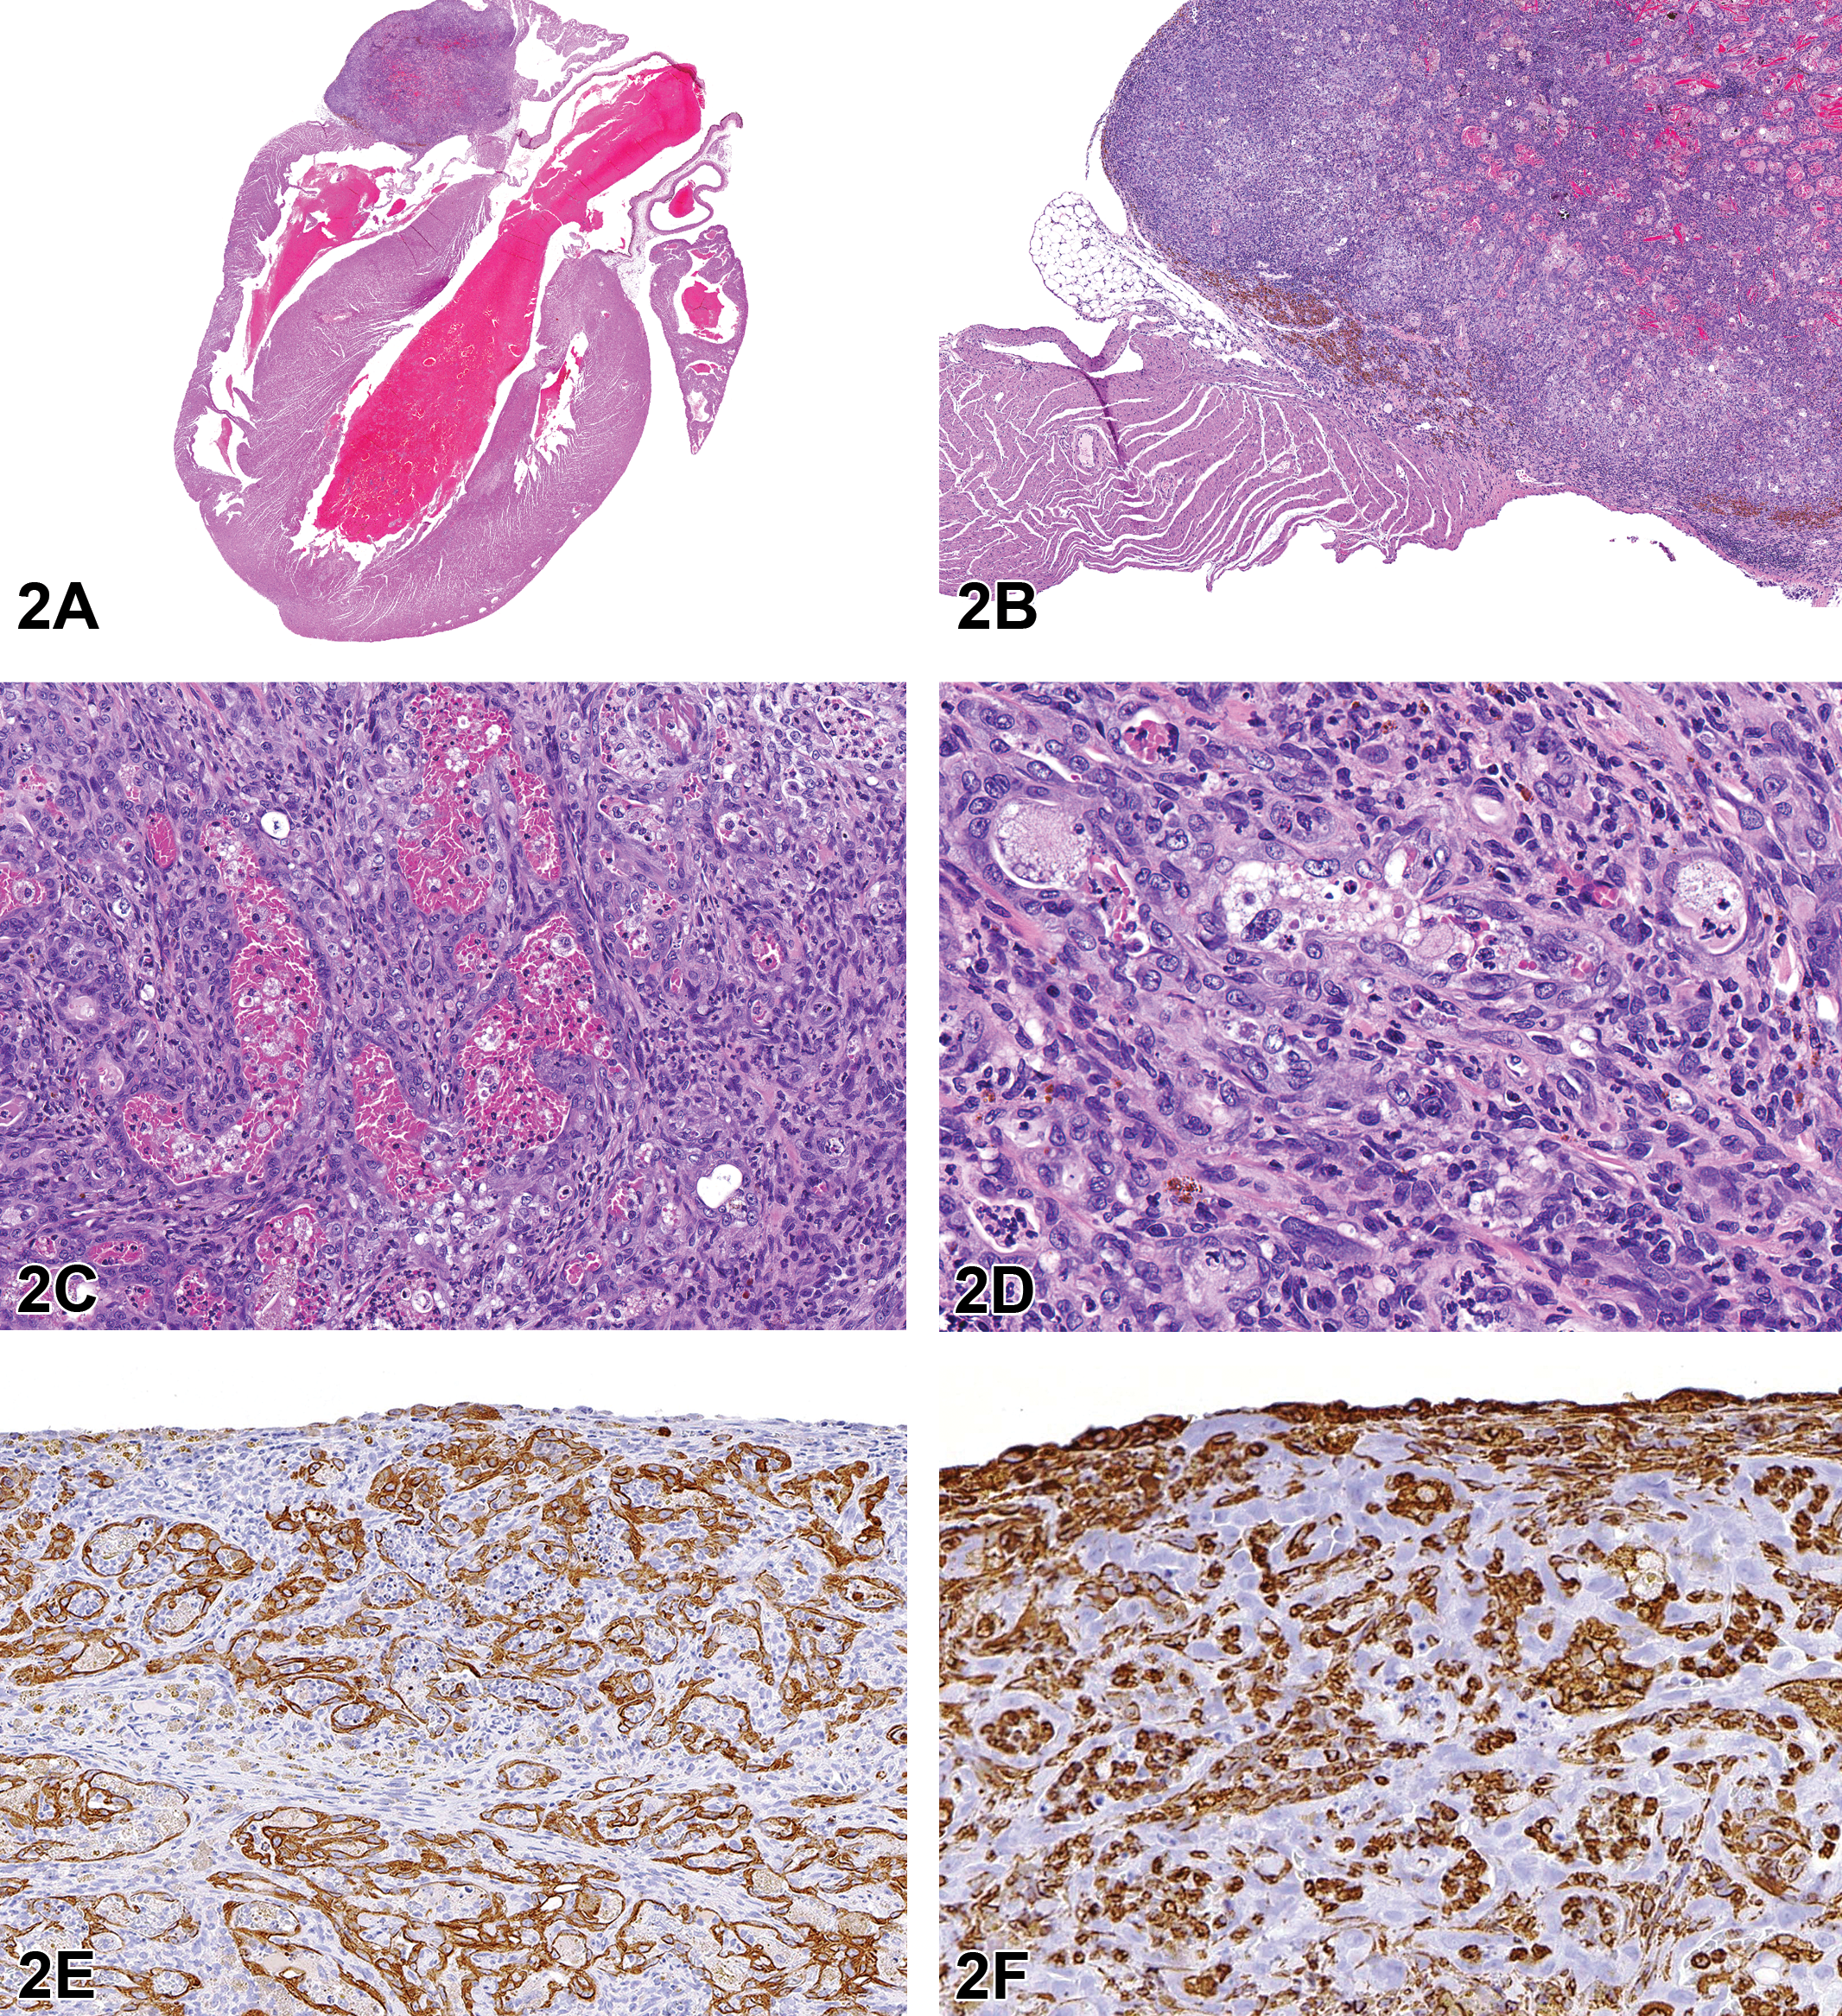
Atriocaval mesothelioma in a male Sprague Dawley (National Center for Toxicologic Research) rat. The right atriocaval mass is composed of glandular structures that are lined by nonciliated cuboidal to columnar epithelium with lumens that are filled with cellular debris admixed with inflammatory infiltrates, extravasated erythrocytes and hemoglobin crystals (A-D, H&E). Neoplastic cells exhibit intracytoplasmic immunoreactivity for cytokeratin (E) and nonneoplastic stromal cells show marked intracytoplasmic reactivity for vimentin (F).
Atriocaval mesothelioma is a rare heart neoplasm with a significantly high incidence in the inbred NZR/Gd male rat compared to other rat strains (Goodal, Christie, and Hurley 1975; Goodall and Doesburg 1981). It was also reported with lower incidences in the Fischer 344 (F344; Alison et al. 1987) and SD rats (Peano et al. 1998). Mesotheliomas in the heart region may involve pericardial, epicardial, and atriocaval locations. Atriocaval mesotheliomas are often distinguished from other primary cardiac neoplasms, such as hemangiosarcoma, by their more invasive nature and their localization at the junction of the right atrium and vena cava (Berridge et al. 2016).
Atriocaval mesotheliomas are located in the outer wall of the right atrium, at the base of the caudal vena cava, or at the base of the interventricular septum. Morphological features include glandular structures lined by nonciliated cuboidal to columnar epithelium, supported by a fine fibrovascular stroma. The lumens are filled with cellular debris admixed with eosinophilic amorphous secretory material, extravasated erythrocytes (hemorrhage), hemoglobin crystals. There is frequent invasion of the adjacent cardiac musculature (Alison et al. 1987; Goodall, Christie, and Hurley 1975; Goodall and Doesburg 1981; Peano et al. 1998). Dual immunoreactivity for cytokeratin (CK; epithelial marker) and vimentin (mesenchymal marker) has been reported for some atriocaval mesotheliomas (Alison et al. 1987; Goodall, Christie, and Hurley 1975; Chandra, Davis, and Carlton 1993). However, in a previously reported atriocaval mesothelioma in a SD rat and in the current case, the tumor cells exhibited immunoreactivity for CK only (Peano et al. 1998).
Of the approximately 500 two-year chronic bioassays/carcinogenicity studies in F344 rats and HSD rats conducted by the NTP, the incidence rate of heart mesothelioma was 0.028% (56 heart mesotheliomas). Of the 56 heart mesotheliomas, 47 were from male rats and 9 were from female rats. No subsite within the heart was recorded for 35 cases, 8 were diagnosed as atriocaval mesothelioma, 6 involved the pericardium, 6 involved the epicardium, and 1 mesothelioma involved all 3 layers (transmural). In contrast to F344 and HSD rat strains, the reported incidence rate of heart mesothelioma in inbred NZR/Gd rats is 12% in males and 3% in females (Goodall, Christie, and Hurley 1975).
The cell of origin for atriocaval mesothelioma in the rat is still unknown, and it is considered a neoplastic transformation of an inclusion of mesothelium or epicardial coelothelium (Mohr 1994). Immunoreactivity for carcinoembryonic antigen, CK, B72.3, and CA19-9 in human atriocaval tumors, suggests that this tumor type is of endodermal origin (Burke et al. 1990; Kawano et al. 1994). Ultrastructural features of human atrioventricular node tumor include flattened or cuboidal cells arranged in tubules, abundant microvilli over the lumen surface, and complex intercellular and tight junctions suggestive of a tumor of mesothelial origin (Goodall, Christie, and Hurley 1975; Fenoglio, Jacobs, and McAllister 1977).
In conclusion, Dr. Kovi stated that an atriocaval tumor should be differentiated from mesothelioma of the pericardial surface, metastatic adenocarcinoma including alveolar–bronchiolar (AB) carcinoma, and primary cardiac hemangiosarcoma based on the location and distinct morphological features of the tumor. Further investigations including immunohistochemical and molecular characterization are required to determine the cell of origin of atriocaval tumors in rat.
Pathology Grab Bag
Dr. Erin M. Quist (EPL) presented 2 interesting cases recently reviewed by a PWG conducted at the NCTR in Jefferson, AR. The presented cases featured lesions from 2 different male SD (NCTR) rats that were part of a perinatal 2-year toxicity/carcinogenicity study in which Dr. Quist was one of the QA pathologists. The author would like to thank Dr. Kyathanahalli Janardhan (ILS) and the IHC Core at the NTP for their assistance, Drs. Greg Olson (NCTR) and Jerry Hardisty (EPL) for their expertise, and Beth Mahler (EPL) and Emily Singletary (EPL) for photographic editing and support.
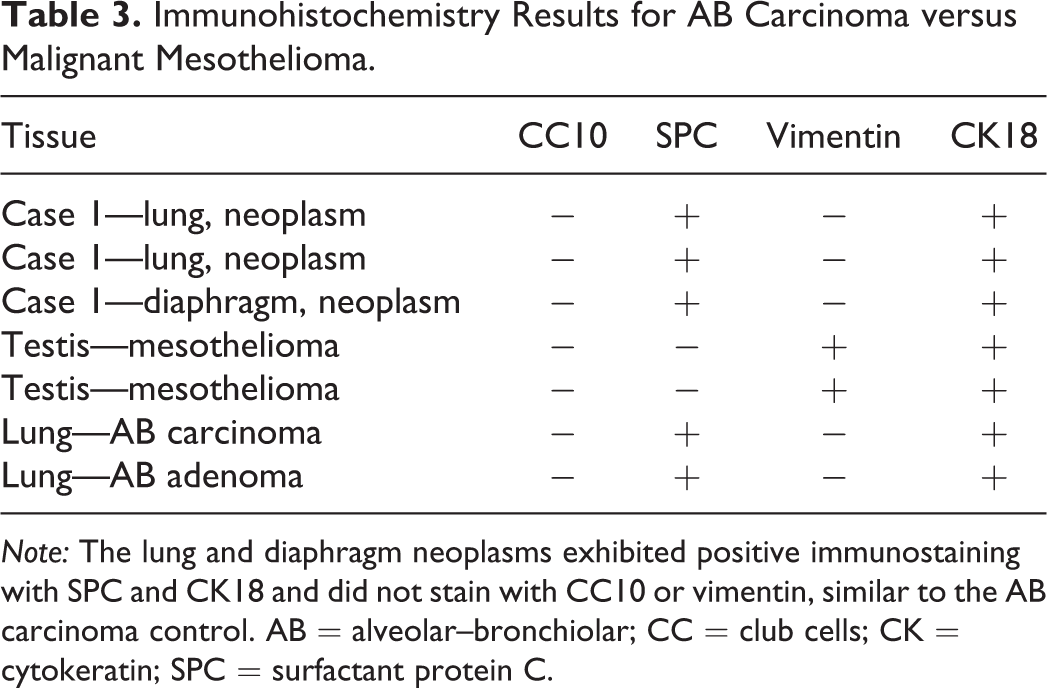
For case 1, a series of photomicrographs were presented to the audience that included both low- and high-power magnifications of an extensive lung tumor involving the pulmonary parenchyma and pleura as well as the diaphragm, pericardium, and rib. While the bulk of the tumor seemed largely confined to the pleural surface (Figure 3A), the cellular morphology of the neoplastic cells closely resembled those of an AB neoplasm with both papillary and alveolar (glandular) growth patterns that also included a large influx of alveolar macrophages within the tumor (Figure 3B, C). The voting choices and results were as follows: mesothelioma, benign (1%), mesothelioma, malignant (72%), AB carcinoma (17%), AB adenoma, multiple (3%), adenocarcinoma (4%), carcinosarcoma (2%), and other (0%). Dr. Quist confessed to the audience that she had hoped for a more even split between the voting results for malignant mesothelioma and AB carcinoma and explained why this case had been brought forward to the PWG. The malignant mesothelioma versus AB carcinoma discussion began with a brief review of a journal article by Howroyd et al. (2009). In the article, the authors describe several neoplasms that, while initially diagnosed as pulmonary AB carcinoma, thymomas, or thoracic mesotheliomas, were later determined to be extrapulmonary AB carcinomas based on immunohistochemical staining. The audience was then presented with a series of image panels depicting the IHC staining characteristics of the neoplasm in question as well as an AB carcinoma and malignant mesothelioma collected from the NTP archives to serve as positive tumor controls (Figure 3D–L). IHC antibodies included club cell protein (CC10), surfactant protein C (SPC; alveolar type II cells), vimentin (mesenchymal cells), and CK18 (epithelial cells) stains (Table 2).
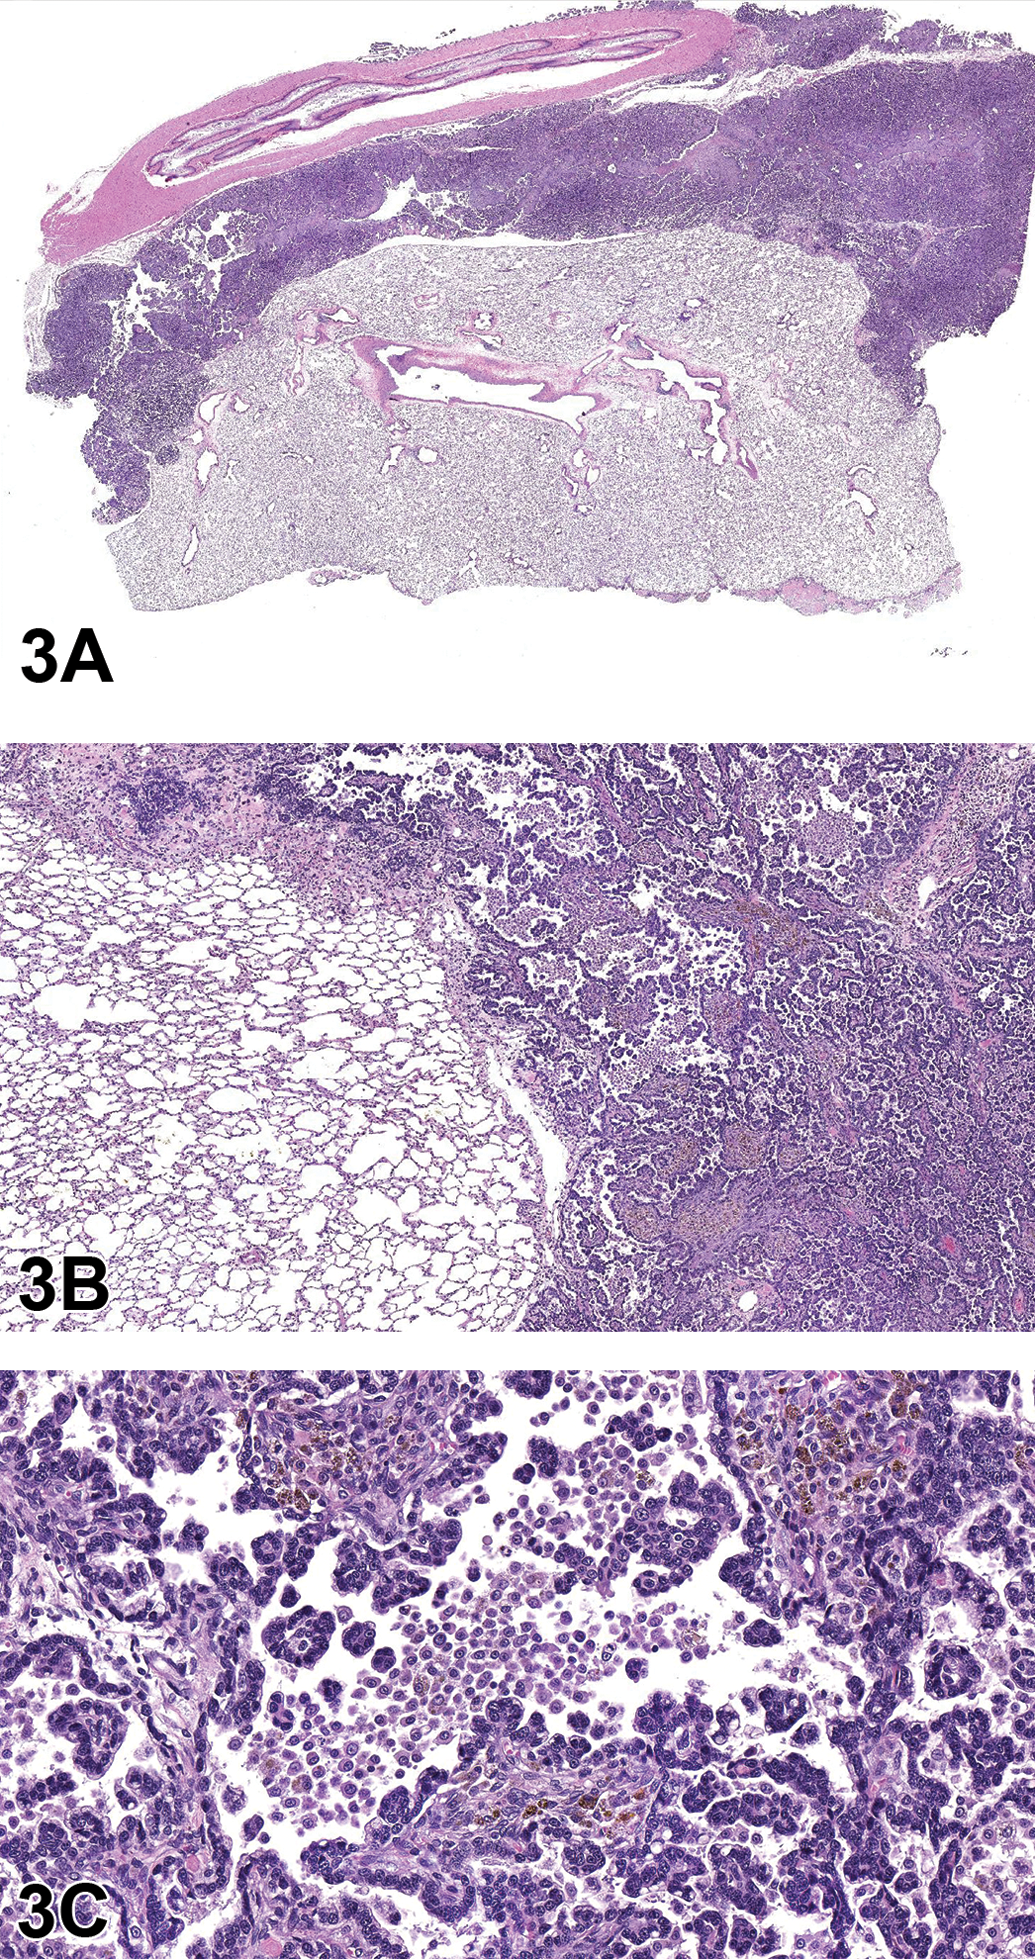
Case 1: Lung neoplasm, National Center for Toxicologic Research (NCTR) Sprague Dawley (SD) rat. (A) An expansile, unencapsulated neoplasm is adhered to the rib and lung pleura, invading and compressing the adjacent lung parenchyma, subgross. (B) The neoplasm is composed of epithelial cells forming alveolar (glandular) and papillary structures supported by moderate fibrous connective tissue stroma. (C) Neoplastic cells are cuboidal to columnar with moderate amounts of eosinophilic cytoplasm and contain a single, centrally to basally located nucleus with stippled chromatin. Note the large influx of macrophages into tumor alveoli. Hematoxylin and eosin (H&E).
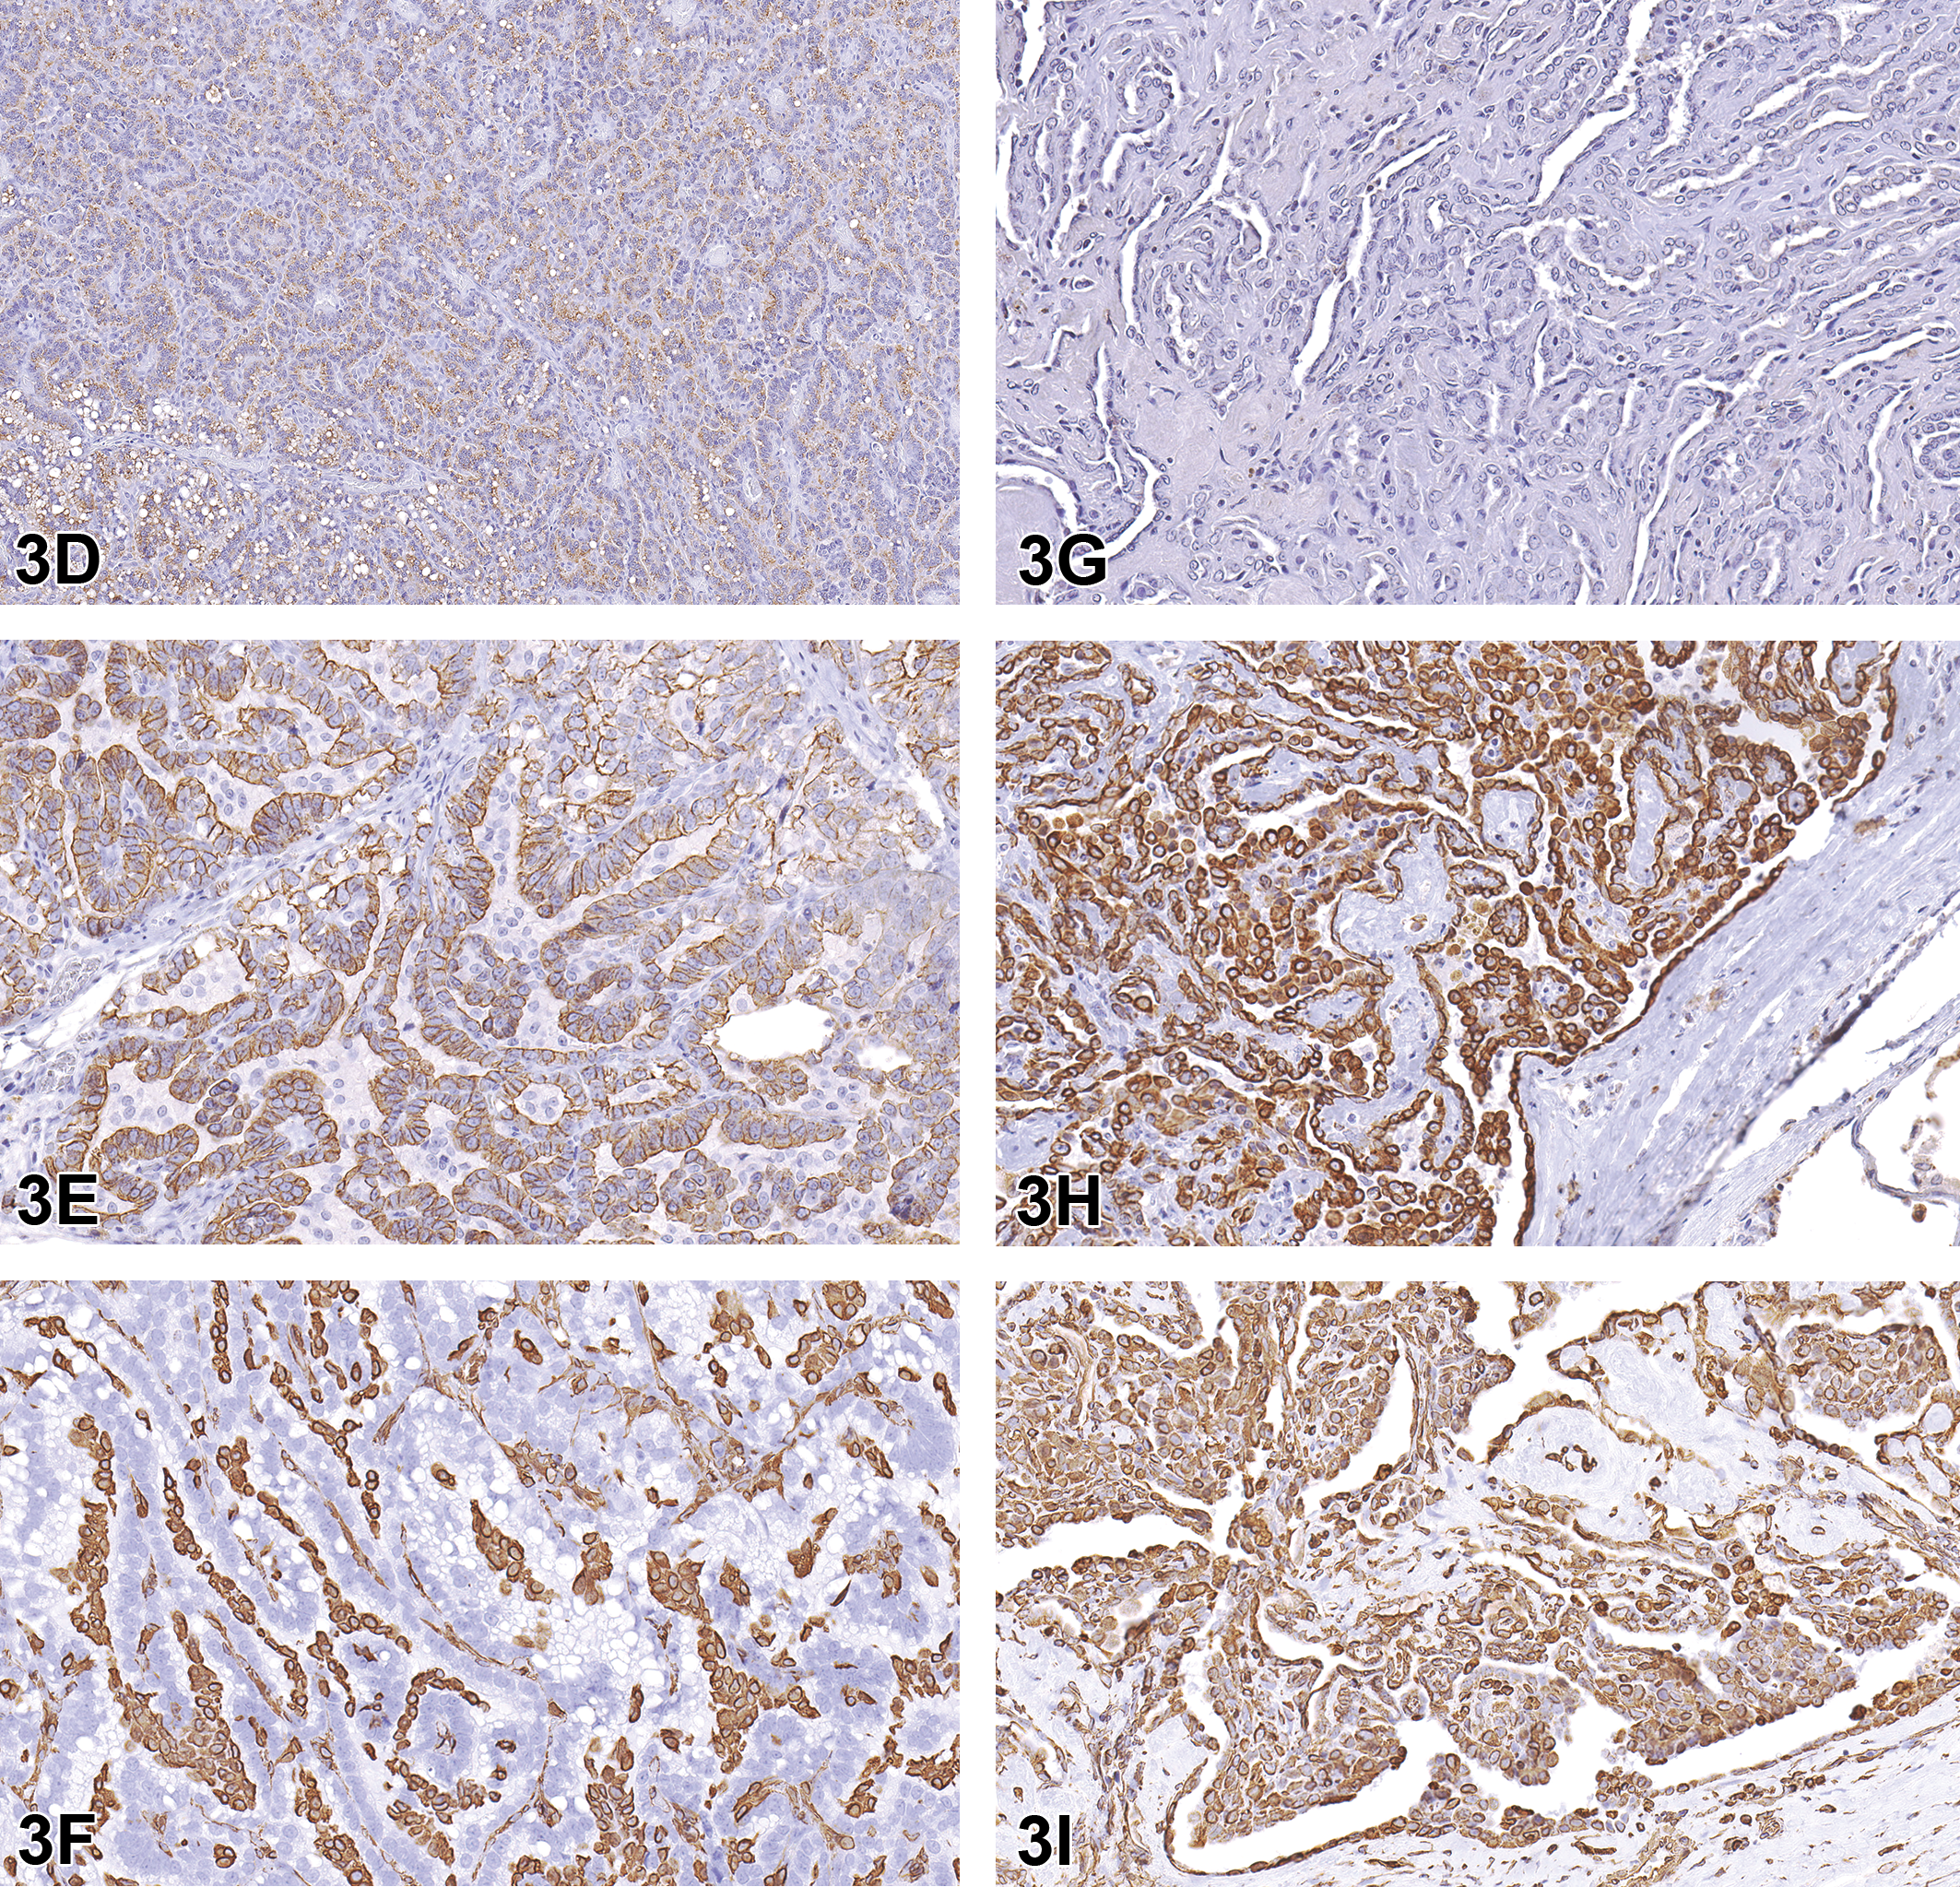
Case 1: Alveolar–bronchiolar (AB) carcinoma from the National Toxicology Program (NTP) archives, SD rat (D–F). Neoplastic cells exhibit positive cytoplasmic staining with surfactant protein C (SPC; D) and cytokeratin 18 (CK18; E) antibodies, while the mesenchymal cells between epithelial cells stain positive with vimentin (F). Malignant mesothelioma of tunica vaginalis, testes and epididymis from the NTP archives, SD rat (G–I). There is no immuno-reactivity observed with SPC immunostaining (G). However, intense cytoplasmic staining is observed with CK18 (H) and vimentin (I) antibodies.
IHC Antibody List for Differentiation of Alveolar–Bronchiolar Carcinoma versus Malignant Mesothelioma.
Note: CC10 = club cell protein 10; CK = cytokeratin; IHC = immunohistochemistry; SPC = surfactant protein C.
The neoplasm exhibited IHC staining characteristics similar to the AB carcinoma control (Figure 3D–F). The majority of neoplastic cells demonstrated positive cytoplasmic staining for SPC and CK18 markers (Figure 3J, K), confirming that the neoplasm was most likely an epithelial tumor arising from type II alveolar cells. The cells lining the pleural surface of the neoplasm appeared to represent a layer of reactive mesothelium, as these cells stained positive with both CK18 and vimentin stains (Figure 3K, L), similar to the malignant mesothelioma control (Figure 3H, I); most of the neoplasm was negative for vimentin (Figure 3L). Based on the IHC profile, Dr. Quist concluded that this tumor should be diagnosed as AB carcinoma (Table 3).
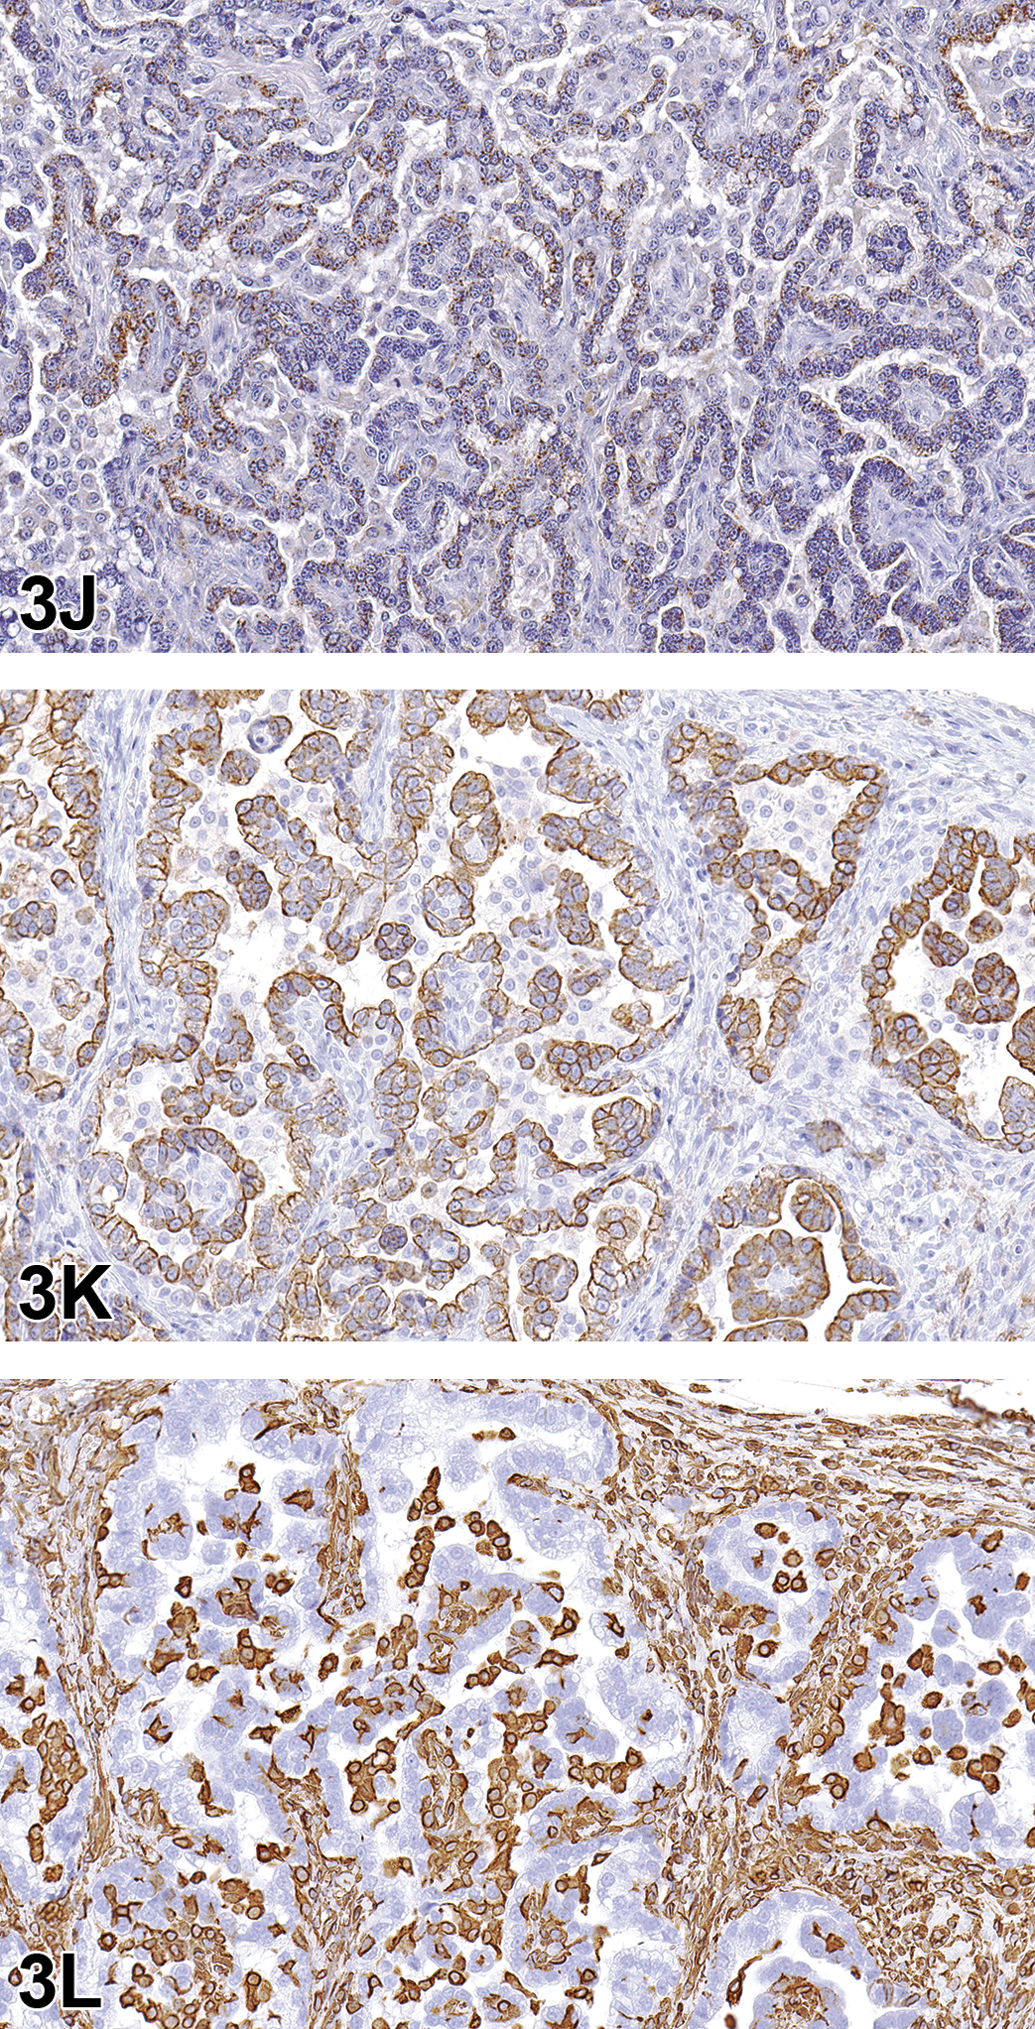
Case 1: Lung neoplasm, NCTR SD (CD) rat. Immunohistochemistry staining patterns of the tumor resemble those of the positive AB carcinoma control (D–F) with positive cytoplasmic staining of neoplastic cells with surfactant protein C (J) and cytokeratin (CK) 18 (K), and staining of mesenchymal cells between epithelial components with vimentin (L).
Immunohistochemistry Results for AB Carcinoma versus Malignant Mesothelioma.
Note: The lung and diaphragm neoplasms exhibited positive immunostaining with SPC and CK18 and did not stain with CC10 or vimentin, similar to the AB carcinoma control. AB = alveolar–bronchiolar; CC = club cells; CK = cytokeratin; SPC = surfactant protein C.
AB carcinomas, now called bronchioloalveolar carcinomas according to the INHAND publication on rodent respiratory lesions (Renne et al. 2009), are the most commonly induced pulmonary malignancies in rodent studies conducted by the NTP (Dixon et al. 2008). While the cell of origin for these types of tumors remains somewhat controversial, the INHAND indicates that AB carcinoma may originate from either club cells (formerly known as Clara cells) or type II alveolar cells but generally arise from type II alveolar cells (Dixon et al. 2008; Renne et al. 2009). These types of tumors typically invade the lung parenchyma as poorly circumscribed, nodular masses that may occupy an entire lung lobe and infiltrate adjacent tissues. However, extrapulmonary AB carcinomas that are largely mediastinal have been reported (Howroyd et al. 2009). The INHAND describes the various growth patterns for AB carcinoma in the rat. These include alveolar (glandular) patterns consisting of cuboidal to columnar cells forming glandular structures; papillary growth patterns with cuboidal to columnar cells forming papillary structures supported by a connective tissue core; tubular patterns with prominent elongated tubules; solid growth patterns composed of tightly arranged round cells with no visible space between; and mixed patterns where multiple patterns are apparent. Marked pleomorphism, areas of squamous metaplasia, or abundant fibrosis (scirrhous response) are additional features that have been described in rats and mice as well as large influxes of macrophages into the tumor and adjacent alveoli, as observed in this case (Renne et al. 2009).
Mesotheliomas arise from pluripotent mesothelial stem cells that line serosal surfaces. Spontaneous mesothelioma is a rare neoplasm in rats with an incidence of 0.2% to 5%. The highest frequencies are reported in the F344 rat strain. Rat mesotheliomas typically occur in aged male rats and originate from the tunica vaginalis, with the potential to spread into the peritoneal cavity via transcoelomic extension or seeding. Primary intrathoracic mesotheliomas are rare (Hall 1990; Boorman et al. 1990; Percy and Barthold 2007; Maronpot et al. 2009; Maronpot et al. 2016; Creasy et al. 2012). To date, 17 studies from the NTP have reported xenobiotic-induced mesotheliomas in F344 rats. The F344 rat is particularly sensitive to developing this tumor type and is the only rat strain reported to develop mesothelioma following xenobiotic exposure by a route other than peritoneal injection (Maronpot et al. 2009; Maronpot et al. 2016). Histologically, mesotheliomas may be difficult to distinguish from mesothelial hyperplasia, as they can range from a single layer of hyperplastic mesothelial cells lining a thin fibrovascular stroma to papillary projections lined by multiple, irregular layers of cuboidal to polygonal cells that form a pavement or stratified pattern (Hall 1990; Boorman et al. 1990; Percy and Barthold 2007; Maronpot et al. 2009; Maronpot et al. 2016; Creasy et al. 2012). Rat mesotheliomas have a classification scheme similar to humans with sarcomatous, epitheliomatous, or mixed types that stain positively with Wilms’ tumor 1 antibody. Ultrastructural features of mesotheliomas include a distinct basal lamina, junctional complexes between mesothelial cells, microvilli, pinocytotic vesicles, abundant cytofilaments, and dilated rough endoplasmic reticulum (Hall 1990; Maronpot et al. 2009; Maronpot et al. 2016).
In the male rat, mesotheliomas of the testis, epididymis, and peritoneum are considered to have originated in the tunica vaginalis. All tunica vaginalis mesotheliomas (TVMs) are deemed malignant, even those confined to the scrotal sac and lacking features of malignancy such as local invasiveness, cytological atypia, and pleomorphism. Proposed mechanisms of actions for both spontaneous and xenobiotic-induced mesotheliomas include endocrine disruption (luteinizing hormone, prolactin, and testosterone), mechanical stress (compression due to testicular tumors), or oxidative stress (asbestos-induced TVM; Maronpot et al. 2009; Maronpot et al. 2016; Creasy et al. 2012).
The case presentation ended with a lively audience discussion in which many attendees expressed their opinions regarding the tumor diagnosis and IHC results. Ultimately, not everyone was convinced that the diagnosis of AB carcinoma was correct.
For case 2, the audience was presented with a series of photomicrographs of an “abdominal mass” that consisted of a well-encapsulated neoplasm composed of polygonal cells arranged in packets (Figure 3M–O). The voting choices and results included pheochromocytoma, benign (23%); pheochromocytoma, malignant (30%); paraganglioma (23%); seminoma, benign (10%); seminoma, malignant (12%); and other (1%). Dr. Quist inferred that the pheochromocytoma diagnosis was “technically correct,” especially given the limited information provided. However, examination of the adrenal glands (Figure 3O) revealed that they were both within normal limits. The lesion was diagnosed at the PWG as a paraganglioma, specifically a paraganglioma of the organ of Zuckerkandl, which was an unfamiliar diagnosis for Dr. Quist and most of the audience members.
Case 2: Paraganglioma of the organ of Zuckerkandl was presented as case 2. Subgross image (M) of abdominal mass recorded at the time of necropsy. The mass resembles a pheochromocytoma (N) composed of finely vacuolated, polygonal cells arranged in discrete packets and supported by fine, fibrovascular stroma. However, the adrenal glands from this animal (O) were unremarkable indicating that this tumor was most likely an “extra-adrenal pheochromocytoma” or, based on location, a “paraganglioma of the organ of Zuckerkandl” H&E.
First described in human fetuses in 1901, the organ of Zuckerkandl refers to a collection of paraganglion cells located near the abdominal aortic bifurcation (Petri et al. 2009; Hall, Yoshitomi, and Boorman 1987; Glenn and Gray 1976). Paragangliomas originate from the sympathetic ganglia, whereas pheochromocytomas arise from the chromaffin cells of the adrenal medulla. Yet, in the human literature, paragangliomas (of the organ of Zuckerkandl) are also called “extra-adrenal” pheochromocytomas, given their similar physiological and chemical behaviors. Both tumor types are associated with clinical signs typical of catecholamine release, such as hypertension, tachycardia, and hyperhidrosis (increased sweating). In addition, both tumors stain positively for chromogranin A and synaptophysin antibodies and are therefore indistinguishable when using IHC techniques.
The audience discussion revealed that most audience members were not familiar with a paraganglioma of the organ of Zuckerkandl or the organ of Zuckerkandl itself. One audience member asked for a recommendation regarding how to enter this particular diagnosis in Standardization for Exchange of Nonclinical Data. After some discussion, it was suggested that this type of lesion, however rare, be entered under the adrenal gland as an “extra-adrenal pheochromocytoma” since the organ of Zuckerkandl would likely be absent from the tissue list.
Flexing Your Muscle: Techniques to Strengthen Muscle Biomarker Assessment
Dr. Famke Aeffner (now Amgen, Inc., South San Francisco, CA) presented work that she was involved in during her tenure at Flagship Biosciences, Inc., in Westminster, CO, a digital image analysis service provider. This presentation aimed at displaying some of the challenges of manual scoring of fluorescent staining, especially in the context of human muscle samples in a clinical trial setting. Tissue image analysis tools were presented that focused on mitigating some of these challenges. Dr. Aeffner would like to thank Alexander Moody, Drs. G. Dave Young, A.J. Milici, and Crystal Faelan from Flagship Biosciences, Inc.; Dr. Steven Moore from the University of Iowa Carven College of Medicine; and Sarepta Therapeutics, Inc., for their contributions to this presentation.
The presentation contained dual-labeled fluorescent images from human frozen muscle biopsies, stemming from patients with confirmed Duchenne muscular dystrophy (DMD) or Becker muscular dystrophy (BMD). Control samples (CTRL) were from confirmed non-DMD/BMD patients. All muscle biopsies were initially obtained for routine diagnostic testing. Residual frozen tissue from these biopsies is part of a tissue and cell culture repository in the University of Iowa’s Paul D. Wellstone Muscular Dystrophy Cooperative Research Center. Biopsies in the repository are approved for research by the University of Iowa Institutional Review Board.
DMD is a severe, X-linked recessive disorder that affects approximately 1 in 3,500 to 5,000 live male births, making it one of the most common recessive disorders in humans (Mendell et al. 2012; Nigro and Piluso 2015; Emery 1991). The causative frame–disrupting mutations of the DMD gene preclude the full translation of its protein product, dystrophin, causing progressive muscle disease (Mah et al. 2016; Mendell et al. 2012). The clinically milder form, BMD, results from an in-frame mutation that allows for the production of a truncated, partially functional dystrophin (Nigro and Piluso 2015; Flanigan et al. 2009; Bushby et al. 1993). BMD is less frequent than DMD, affecting 1 in 11,500 males (Nigro and Piluso 2015; Flanigan et al. 2009; Bushby et al. 1993).
Reliable quantification of dystrophin expression in patient biopsy samples remains challenging, and the field has focused on 5 methods: Western blots, quantitative reverse transcription polymerase chain reaction, mass spectrometry, enzyme-linked immunosorbent assay, and immunostaining (Anthony et al. 2012; Nguyen et al. 1990; Nicholson et al. 1990; Anthony et al. 2014; Brown et al. 2012). To further improve evaluation of immunostaining procedures, several tissue image analysis solutions have been developed to aid in dystrophin quantification (Beekman et al. 2014; Anthony et al. 2014; Taylor et al. 2012).
Slides shown in this presentation were dual labeled with antidystrophin (MANDYS106, clone 2C6, obtained directly from Glenn Morris, Wolfson Centre for Inherited Neuromuscular Disease, Oswestry, UK) and anti-merosin (ab11576, Clone 4H8, Lot GR95776-14; Abcam, Cambridge, MA) antibodies. Slides were scanned at Flagship Biosciences, Inc., utilizing Flagship’s qualified fluorescent scanning workflow involving the 3D HISTECH Pannoramic MIDI fluorescent scanner (PANMIDI; PerkinElmer, Waltham, MA).
Prior to voting, the manual scoring paradigm was discussed. This particular paradigm was used in a previous clinical trial involving DMD patients (Dworzak et al. 2017).
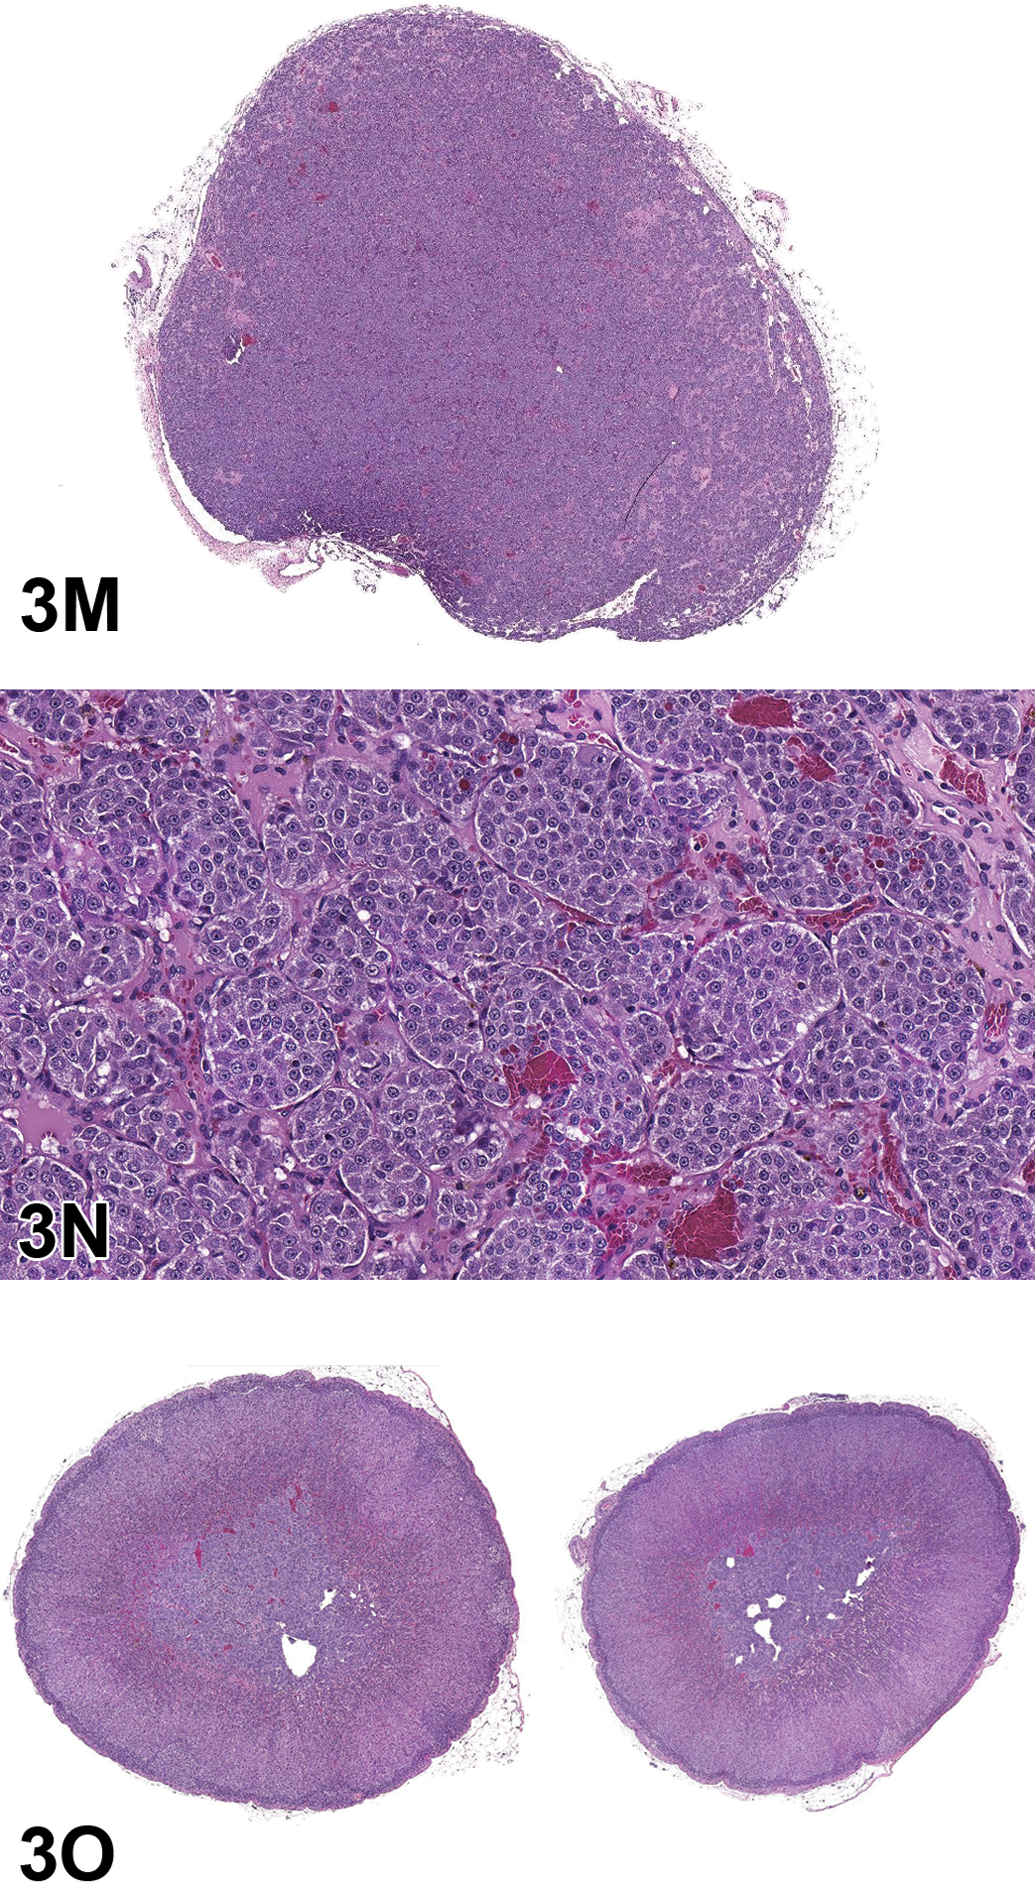
Briefly, for dystrophin labeling, a myofiber is to be identified as a positive myofiber and counted if the labeling intensity is at or above a predefined threshold that is equal to or more than 30% of the individual fiber’s total circumference. Example fibers were shown that displayed staining above and below threshold. One factor that can make manual myofiber scoring difficult is the presence of revertant fibers in disease tissues. These fibers appear individually and in small number, display near-normal dystrophin staining, and can be observed in 40% to 50% of biopsies from patients with DMD (Nicholson et al. 1990; Arechavala-Gomeza, Kinali, Feng, Guglieri, et al. 2010). It is believed that these are due to secondary somatic mutations or naturally occurring alternative splicing of dystrophin premessenger RNA that can restore the reading frame in DMD (Klein et al. 1992; Lu et al. 2000). The challenge that revertant fibers pose is that their strong fluorescent signal can overshadow light staining of adjacent fibers that in direct comparison are strongly devoid of dystrophin signal but that may be staining at or above the predetermined threshold for staining intensity.
The first voting case was an image of dystrophin labeling in a CTRL sample (tetramethylrhodamine [TRITC] channel; Figure 4A), and the audience was asked to vote (per multiple choice) on the percentage of positive fibers present. The voting choices ranged from 0% to 100%. The majority of votes (77%) correctly identified 80% to 100% positive fibers for case 1 (Figure 4B). The second case was from a DMD sample (dystrophin labeling in TRITC channel, Figure 4C), and the audience was again asked to vote on the number of positive fibers present. The voting choices were 0—too few to count and 3, 8, 9, 14, 18, and 22—too many to count. Votes were somewhat evenly distributed among all choices, ranging from 5% to 18% of votes, with no clear majority. The correct answer of 14 positive fibers (Figure 4D) had the same number of votes as the choice of 9 positive fibers (18%). The third case was from a BMD sample (Figure 4E), again showing dystrophin labeling only in the TRITC channel. The voting choices were 0 positive— too few to count and 27, 42, 65, 82, and 116—too many to count. The majority of votes was cast for 27 positive fibers present (35% of votes); however, the next largest voting choice of 42 positive fibers was correct (received 16% of votes; Figure 4F). Interestingly, 25% of votes were cast for “too few to count.” It is of note that the lighting and projection setup in the symposium room was not optimal for display and evaluation of fluorescent images, which likely had an influence on voting results.
Human frozen skeletal muscle samples (3 cases presented). Antidystrophin fluorescent labeling (tetramethylrhodamine [TRITC]; A, C, and E). The first case (A) was a control muscle sample, displaying the TRITC channel only (antidystrophin staining). Overlaid with a digital image analysis markup (B), it shows that 100% of fibers are positive for dystrophin staining. Duchenne muscular dystrophy sample presented as case 2 (C), with digital image analysis markup highlighting 14 positive fibers (D). Becker muscular dystrophy sample presented as case 3 (E), with digital image analysis markup displaying 42 positive fibers (F). Images originally captured at 10× magnification, bars = 70 μm. Markup (B, D, and F): light blue lines = fiber membrane, red center of fiber = positive (membrane dystrophin staining above intensity threshold), and blue center of fiber = negative (membrane dystrophin staining below intensity threshold).
To demonstrate issues that can have an effect on the evaluation of fluorescently labeled muscle sections and manual scoring, Dr. Aeffner briefly reviewed cognitive and visual traps that can influence the estimation of numbers (i.e., of cells or events present on a slide), the perception of staining intensity in general, and specifically, the perception of staining intensity and contrast in the fluorescent setting (Aeffner et al. 2017).
The specific ability of pathologists to estimate numbers or percentages of events on a slide has been previously studied by the College of American Pathologists: pathologists from 197 participating laboratories received 10 images of hematoxylin and eosin (H&E)–stained colonic adenocarcinomas. They were tasked to record the percentage of neoplastic cells present in each image. While the survey demonstrated low interlaboratory precision among pathologists’ scores, mean estimates were somewhat accurate. However, 50% of the evaluated cases had estimates that were different by more than 10% from the percentage of tumor cells present as counted by verified image analysis algorithms (Viray et al. 2013). Another publication studying pathologists’ ability to specifically evaluate non-small cell lung cancer biopsies documented that visual assessment of estimated neoplastic cell concentration regularly overestimates the tumor burden by 10% to 20% (Warth et al. 2012). Other cognitive traps and biases that can have an effect on accuracy and reproducibility of manual pathology scoring results include avoidance of extremes and terminal digit bias (reviewed in Aeffner et al. 2017).
Our flawed perception of staining intensity can be easily demonstrated via optical illusions. The Craik–O’Brien–Cornsweet illusion demonstrates the human’s perception of surfaces based on the optical characteristics of their edges (Fibonacci 2007; Figure 4G). Adjacent objects appear to have a different brightness caused by a variation in staining intensity at the interface only, when in fact these adjacent objects are of the same staining intensity for the majority of the surface (Kurki et al. 2009; Purves, Shimpi, and Lotto 1999; Masuda et al. 2014). This effect is likely at play when it has been reported that the same membranous staining intensity is perceived as being different, depending upon whether it is evaluated next to cytoplasm with staining or devoid of staining (Conway et al. 2008). Readers further interested in this matter are also encouraged to investigate Adelson’s Checker shadow illusion (Albert 2007; Adelson 2001; Aeffner et al. 2017).

Craik–O’Brien–Cornsweet illusion (G) demonstrates the human’s perception of surfaces based on the optical characteristics of their edges (Fibonacci 2007). In this illusion, the brightness change along the edge in the middle influences the perception of both surfaces to the left and right of the middle having different brightness when in fact the majority is of the same brightness. To confirm, cover the middle of the image to see that the majority of the area is the same intensity or shade of gray (Kurki et al. 2009; Purves, Shimpi, and Lotto 1999; Masuda et al. 2014; Aeffner et al. 2017). Herman grid illusion (H) is a display of lateral inhibition (LI), which is a perceived increase of contrast and sharpness (Aaen-Stockdale 2007). Specifically, false gray dots appear at the intersection of the white lines. These are caused by the LI, preventing a lateral spread of the action potential across the retina (Spillmann 1994; Kingdom 2014; Aeffner et al. 2017).
Specifically, during visual evaluation of fluorescent staining, the biological phenomenon of lateral inhibition (LI) can influence the pathologist’s perception. LI is an optical effect arising from neuronal interference in the retina and optical tracts. This is demonstrated in the Hermann grid illusion (Schiller and Carvey 2005; Figure 4H), where LI results in perception of false gray areas at inflection points between interfaces of light and dark areas establishing the grid. The underlying mechanism is such that excited neurons reduce the activity of their neighbors to prevent the spread of action potentials in a lateral direction. This results in an increase in the perceived contrast and sharpness of images at the “cost” of viewing certain things as lighter or darker than they actually are (Spillmann 1994; Kingdom 2014). This ultimately hampers the pathologist’s ability to evaluate staining intensity in an unbiased/unaltered fashion.
Due to these inherent flaws in the manual evaluation of biomarker staining, and the need—specifically in the DMD clinical trial space—to detect subtle changes in biomarkers of disease progression within the tissue context, there has been an increased effort to develop improved digital image analysis techniques. Establishing these digital techniques would allow for rapid assessment of hundreds to thousands of myofibers across entire muscle sections, aiming for an objective assessment of the tissue and each individual fiber.
A number of different image analysis solutions have been published. The majority focus on intensity measurements of individual regions of interest within part of a fiber or of all fibers within single or multiple selected high-power fields (Arechavala-Gomeza, Kinali, Feng, Guglieri, et al. 2010; Kinali et al. 2009; Arechavala-Gomeza, Kinali, Feng, Brown, et al. 2010; Beekman et al. 2014). Several of the published algorithm solutions rely on a dual-staining approach, where the first marker is a general myofiber membrane marker that is utilized to create a membrane mask. This membrane mask defines where the intensity of the target biomarker (here, dystrophin) is quantified, so ensure only proteins expressed at the membrane are evaluated (Beekman et al. 2014). Data generated can include a mean staining intensity (across the slide or fiber by fiber) as well as classification of each individual fiber as positive/negative or 0 to 3+ staining intensity based upon preset staining thresholds. The latter options aim at mimicking manual scoring approaches. The need for a standardized method of dystrophin quantification was previously identified (Muntoni, Meeting Steering, and Network 2010), and as a result, proposed standard operating procedures for quantification of immunofluorescence and western blot analysis were published (Anthony et al. 2014).
Topics brought up by audience members included threshold setting of fluorescent staining, internal autofluorescence, and scanning of immunofluorescent slides. Dr. Aeffner shared that a publication is forthcoming that describes in detail the fluorescent scanning process qualification as well as the validation of a muscle-specific image analysis tool by Flagship that utilized some of the cases shared for voting. Combined, these 2 efforts describe a technique that allows for biomarker-staining quantification on a fiber-by-fiber basis, evaluating the whole slide (not manually selected high-power fields).
In addition, the option of processing data post image analysis was discussed. Although the described manual scoring paradigm was utilized in a clinical trial, it will take retrospective analysis of a larger amount of historical data to establish what the most meaningful scoring paradigm may be for quantification of increased dystrophin expression in relationship to patient response after treatment. Capturing a multitude of data via image analysis allows for postanalysis processing of previously generated data to incorporate new scoring paradigms, (e.g., changing the membrane completeness cutoff, the mean membrane intensity threshold, or newly incorporating roundness and eccentricity measurements of fibers into the digital scoring paradigm).
In conclusion, digital image analysis algorithms can be valuable aids in supporting a pathologist’s assessment. This setup combines the experience of a pathologist with the accurate counting and consistent staining intensity assessment of an automated approach, resulting in more robust, reproducible, and quantitative assessments of biomarker expression in tissue via a semiautomated approach.
Reproduction Deduction
Dr. Susan A. Elmore (NTP, NIEHS, RTP, NC) presented an unusual testicular lesion from 2 male SD (NCTR) rats. These lesions were reviewed by a PWG at the NCTR in Arkansas during the evaluation of a perinatal 2-year toxicity/carcinogenicity study. Dr. Greg Olson (NCTR) was the study pathologist and Dr. Erin Quist (EPL) was the QA pathologist, and members of the PWG included NCTR, NTP, and Food and Drug Administration pathologists. The author would also like to acknowledge Dr. Kyathanahalli Janardhan (ILS, IHC) and the NIEHS IHC Core for their assistance.
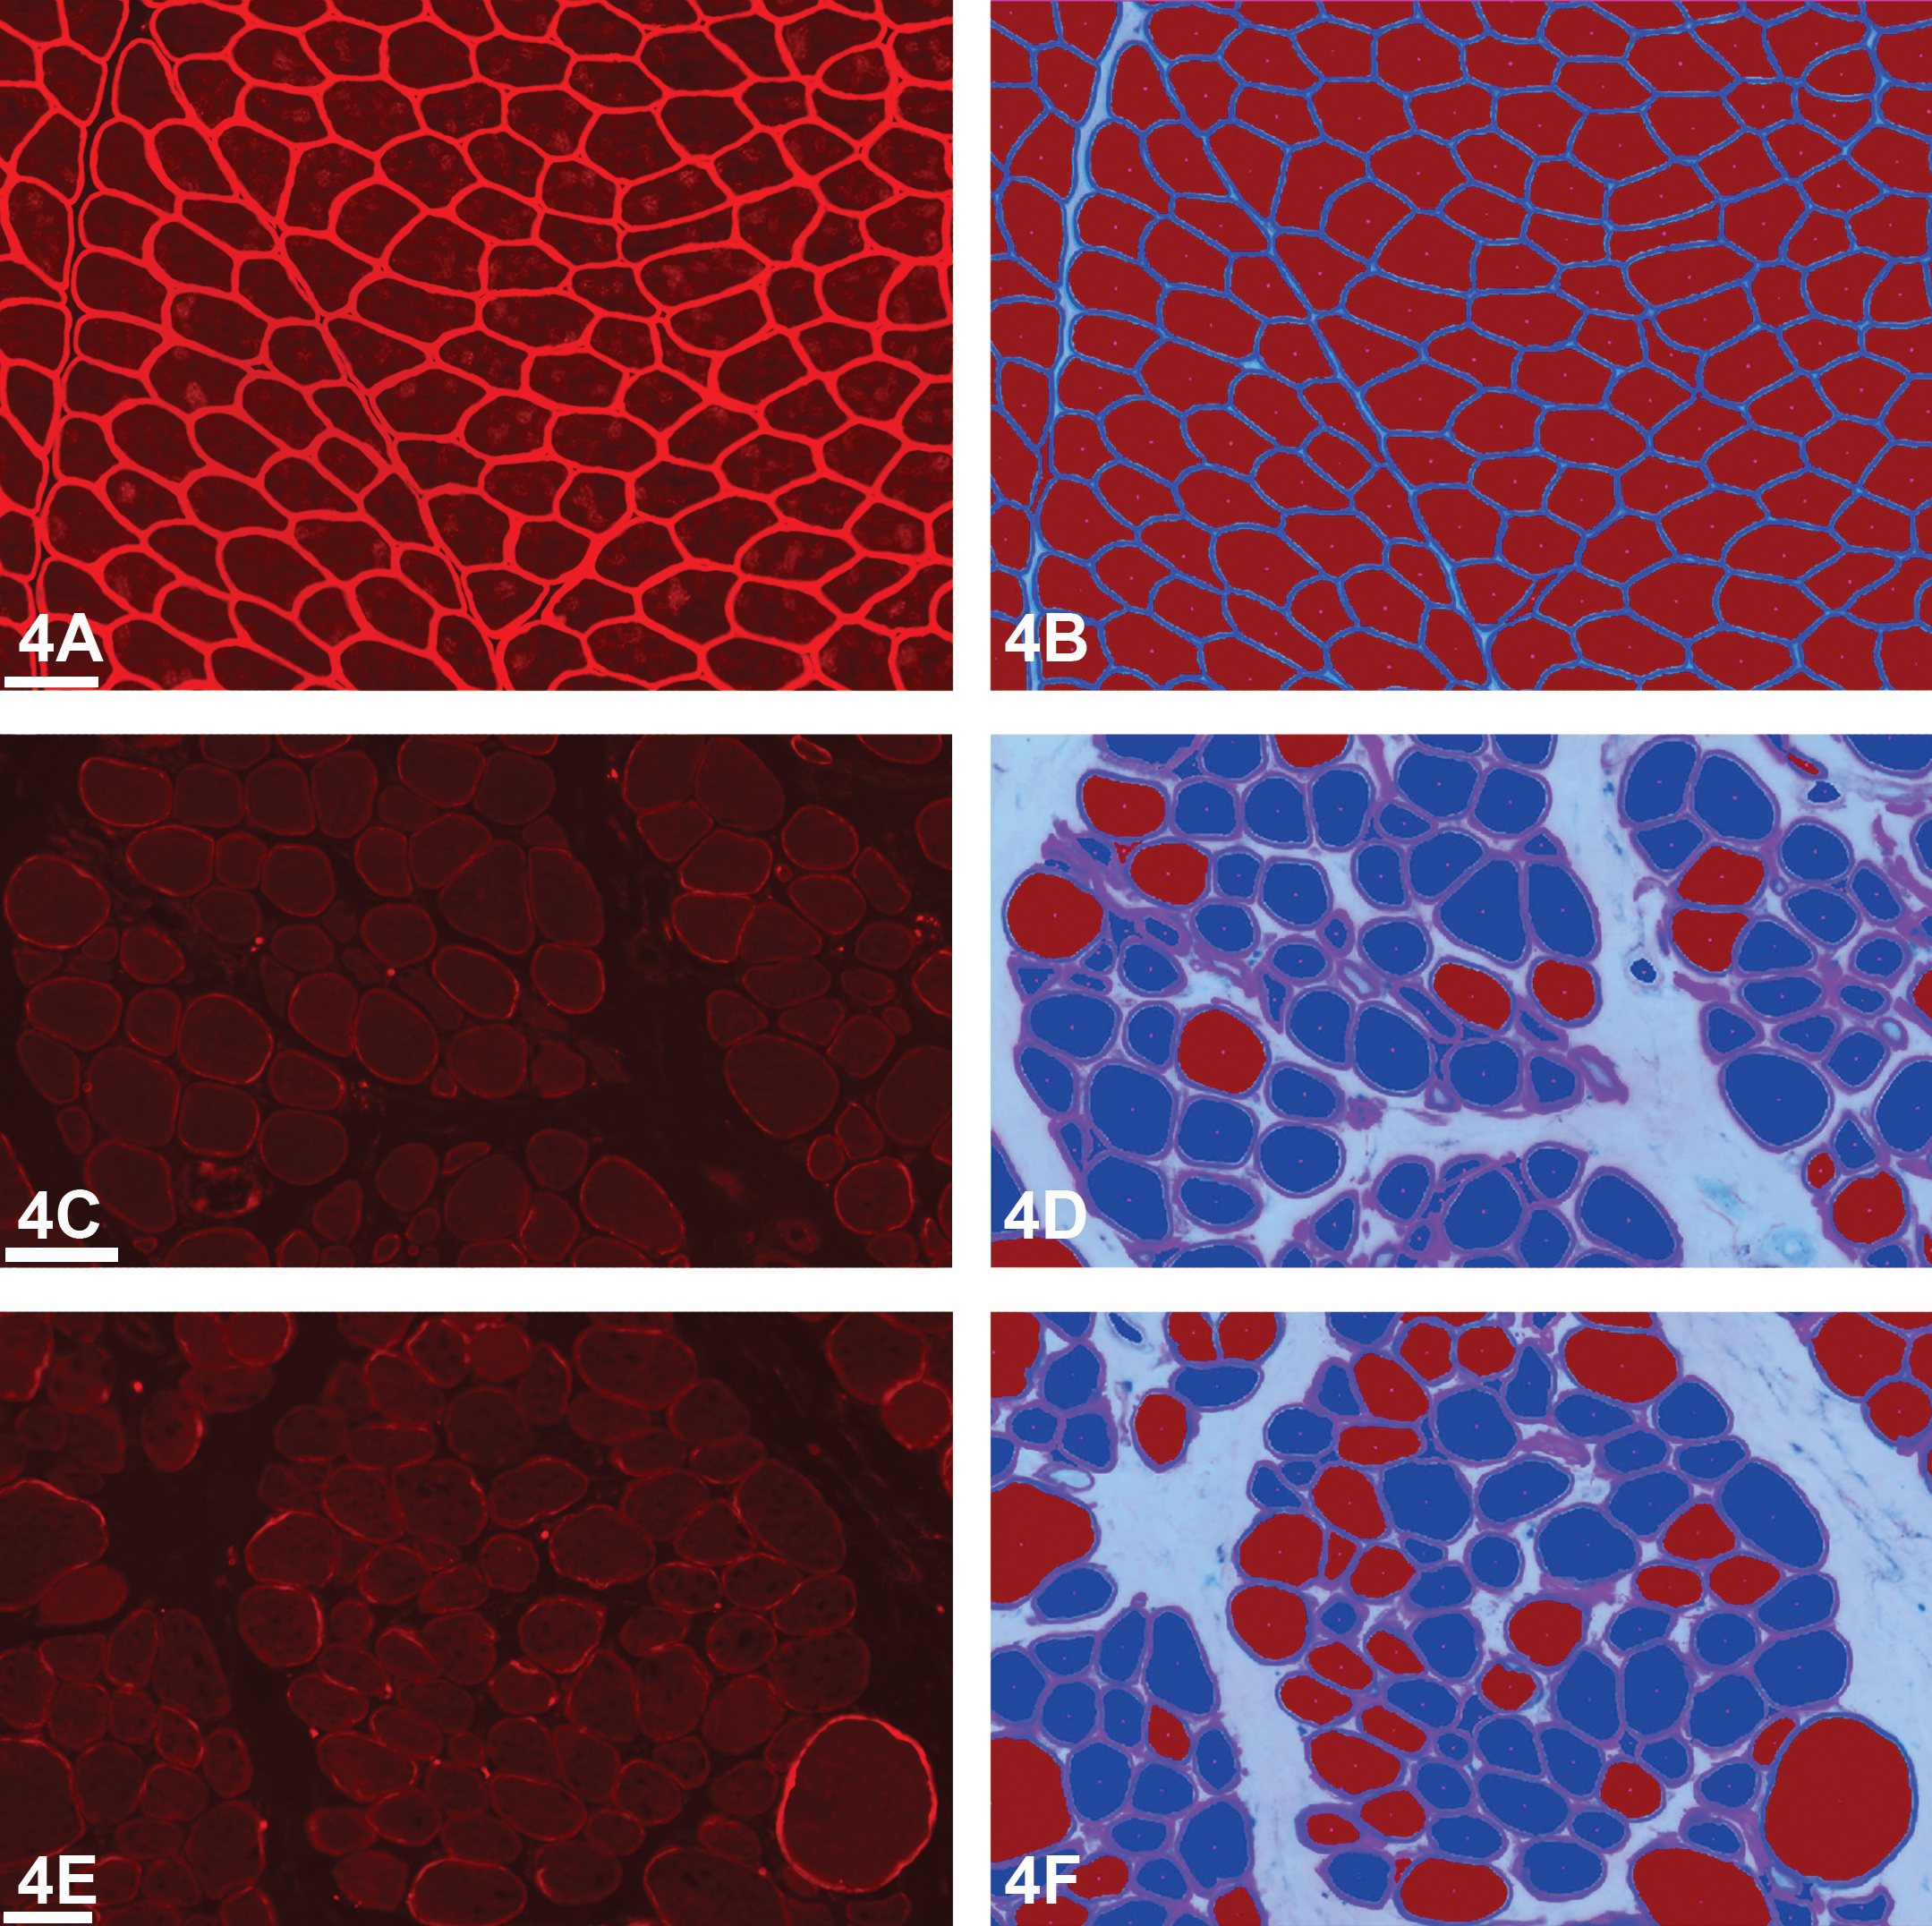
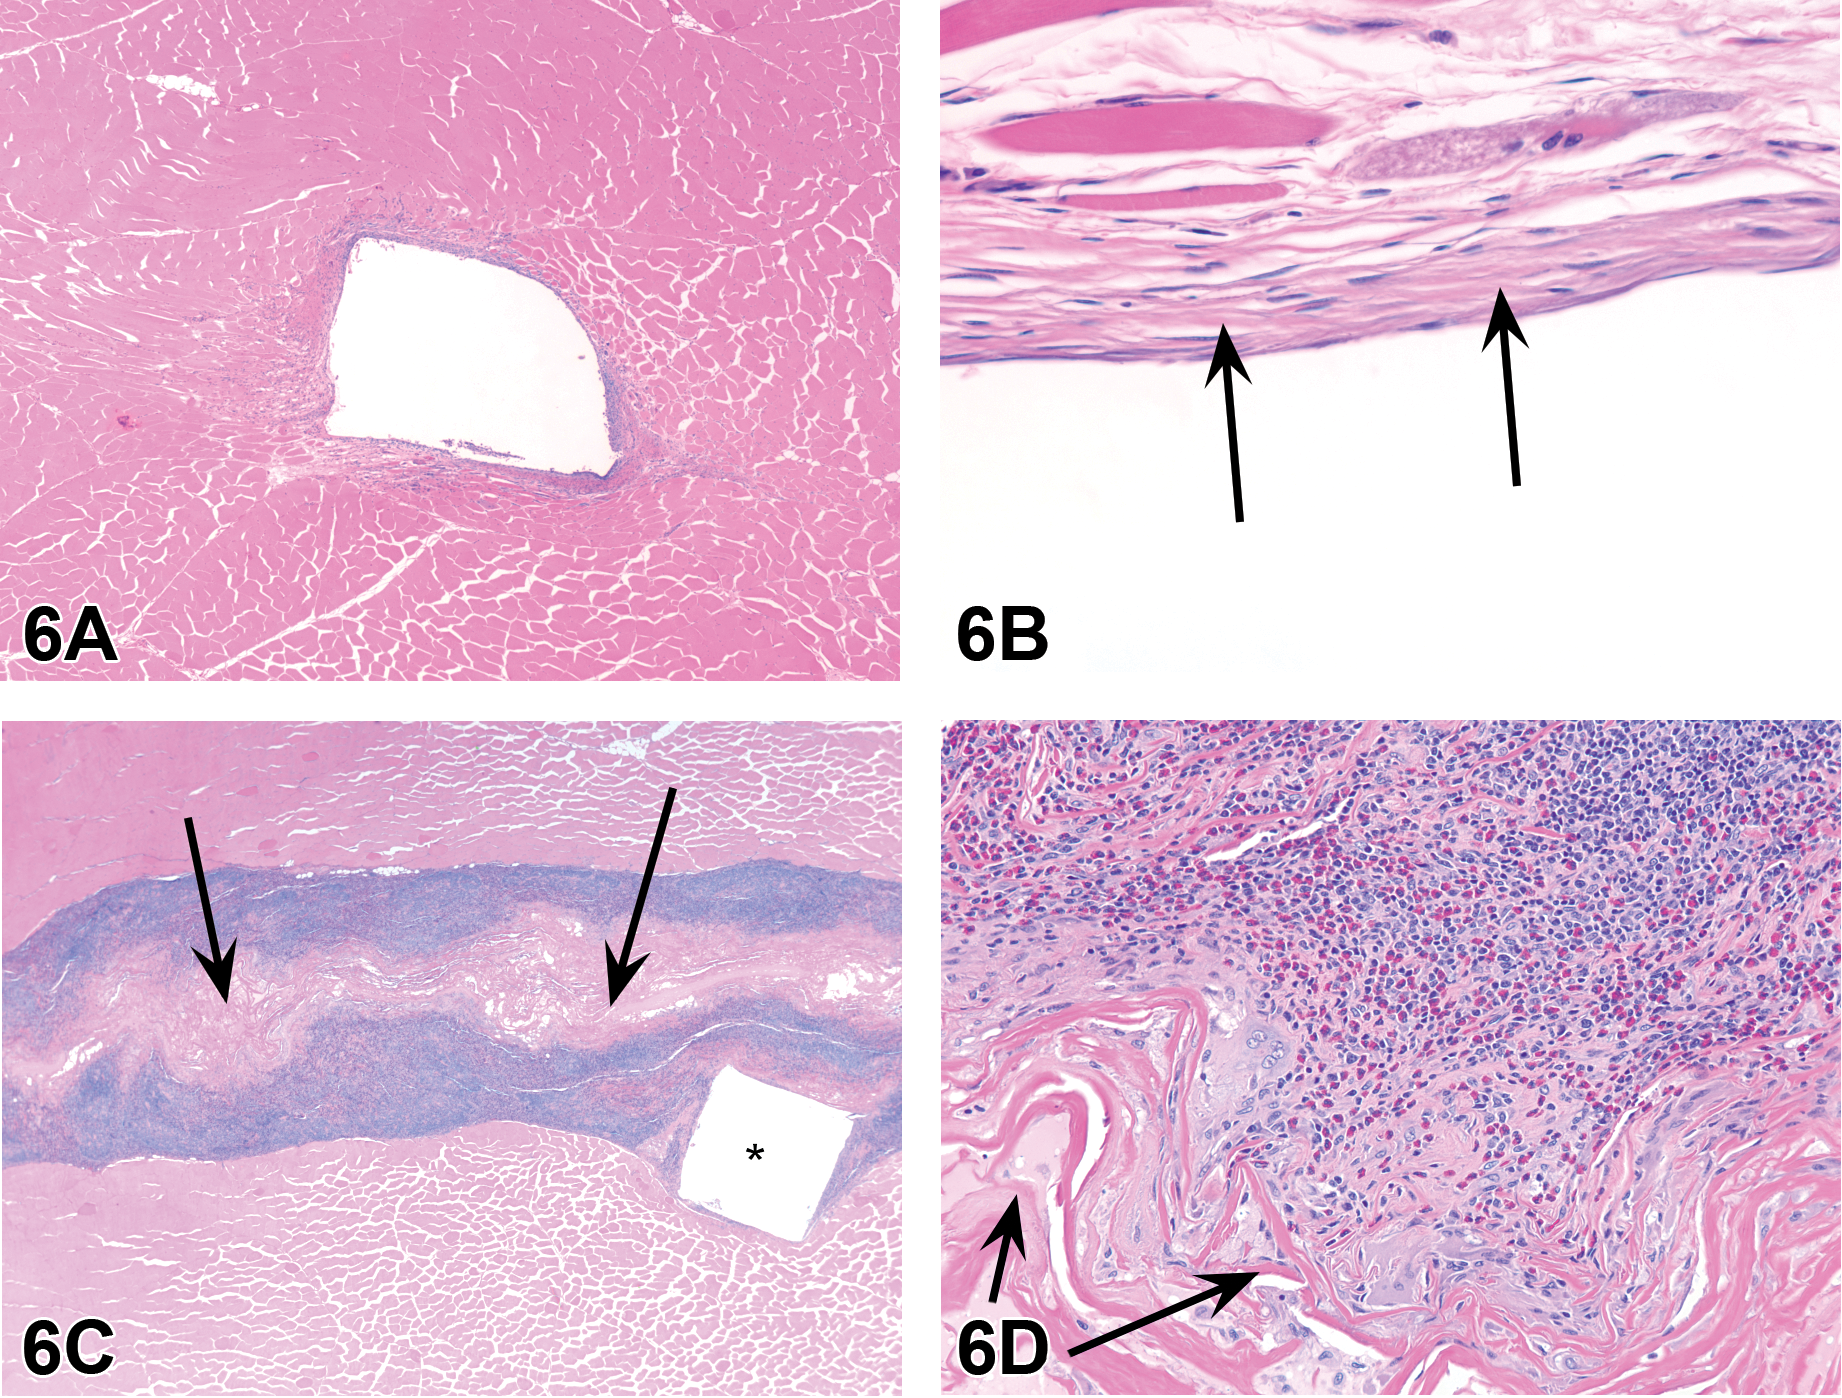
A series of low- to high-magnification images from the 2 unilateral testicular lesions were shown to the audience (Figure 5A–C). The morphology was similar for these 2 lesions. At low magnification, a focal, fairly well demarcated lesion could be seen at the periphery of the testes (Figure 5A). At higher magnification, the lesion could be seen within the interstitium with no evidence of seminiferous tubule or vessel invasion/infiltration (Figure 5B). At the highest magnification, it was evident that this was a neoplasm. The cells were present in dense sheets within the interstitium and were often adhered to the capsular surfaces of the seminiferous tubules (Figure 5C). Cellular features included small, medium and large, round to polygonal cells with marked pleomorphism, hyperchromatic nuclei, prominent nucleoli, and a large nuclear to cytoplasmic ratio. The chromatin pattern was fine to coarse, with some resembling developing spermatocytes. There were also occasional mono- and multinucleated giant cells.
Microscopic features of spermatocytic seminomas in National Center for Toxicologic Research Sprague Dawley rats. Low- (A), mid- (B), and high-magnification (C) images from a spermatocytic seminoma (hematoxylin and eosin [H&E]). The lesion is focal (A), does not invade the seminiferous tubules (B), and is present in dense sheets within the interstitium with cells often adhered to the capsular surfaces of the seminiferous tubules (C). Cellular features include small, medium, and large, round to polygonal cells with marked pleomorphism, hyperchromatic nuclei, prominent nucleoli, and a large nuclear to cytoplasmic ratio (C). Using H&E, the spermatocytic seminoma (C) can easily be distinguished from a classic intratubular seminoma (D), which consists of tubular structures filled with round to polyhedral cells (resembling primitive germ cells), which are mostly uniform in size, with eosinophilic cytoplasm, indistinct cell borders, and numerous mitoses (H&E). A periodic acid Schiff stain (E) can help to better identify the tumor cells within a spermatocytic seminoma that have a coarse and clumped chromatin pattern, resembling developing spermatocytes (arrows).
The voting choices and results were lymphoma (7%), anaplastic seminoma (7%), yolk sac tumor (9%), choriocarcinoma (7%), anaplastic intertubular seminoma (36%), intertubular embryonal carcinoma (16%), and intertubular spermatocytic seminoma (18%). The correct terms were either anaplastic intertubular seminoma or intertubular spermatocytic seminoma. Four animals in this study had this unusual lesion and were shown to the PWG where the preferred diagnosis was intertubular or interstitial seminoma. However, lymphoma was also discussed as a potential diagnosis. This lesion was not considered to be treatment related.
During the course of this investigation, an additional 4 lesions from NCTR SD rats, diagnosed as “seminoma,” were evaluated, and the morphology was identical to the 4 lesions found in this one study. No “classic intratubular seminomas” were identified however one was found from a previous NTP study using F344 rats that we could use for comparison (Figure 3D). There were a total of 8 lesions to evaluate (4 from this study and 4 from prior NCTR studies); there were no metastases nor similar neoplastic cells identified in other organs or tissues. A PAS stain was performed to more fully evaluate the neoplastic cell population and tubular basement membranes. In all cases, the seminiferous tubule basement membranes were intact, and there was no infiltration or invasion of neoplastic cells. The PAS stain highlighted the nuclear chromatin pattern that mimicked the clumped, coarse condensation of chromatin in spermatocytes as they prepare for meiotic division (Figure 5E).
IHC was performed to more thoroughly investigate the nature of these neoplastic lesions. Because lymphoma was a potential diagnosis discussed during the PWG, CD3 (T lymphocyte marker) and Pax5 (B lymphocyte marker) were used as well as C-kit which could identify hematopoietic and other progenitor cells. CD3 showed a strong nonspecific nuclear staining of most cells, and Pax5 had no reaction (data not shown). C-kit showed some faint membrane staining of small clusters of cells (data not shown). These results ruled out lymphoma as a potential diagnosis. We also wanted to determine whether we could differentiate an intertubular seminoma from a classic intratubular seminoma. Placental alkaline phosphatase (PLAP) is a marker for seminoma in human tissues, but it has not been validated for rodent tissues (Bahrami, Ro, and Ayala 2007). The NCTR SD rat intertubular neoplastic lesions were negative for this marker (data not shown), indicating that PLAP is not a useful marker for rodent intertubular seminomas.
Other potential diagnoses that were ruled out based on PAS staining or H&E morphology were yolk sac tumor, choriocarcinoma, and classic seminoma (Creasy et al. 2012). Yolk sac tumors exhibit tumor cells embedded in abundant proteinaceous matrix that stain eosinophilic with H&E or are PAS positive. Choriocarcinoma contains trophoblastic giant cells and cytotrophoblasts. Classic intratubular seminoma (Figure 5D) consists of tubular structures filled with round to polyhedral cells (resembling primitive germ cells) with eosinophilic cytoplasm, indistinct cell borders, and numerous mitoses (Al-Hussain, Bakshi, and Akhtar 2015). None of these morphologies were present in any of the neoplasms evaluated. During the course of this investigation, using 5-micron sections, all tumors were serially sectioned; the classic seminoma morphology was not evident and the neoplastic cells remained confined to the interstitium. Given the PAS and IHC results as well as the morphological characteristics of the tumor cells, it was determined that these 8 tumors (4 from present study and 4 from previous NCTR studies) would be best diagnosed as intertubular seminomas (Kim, Fitzgerald, and De Lalglesia 1985).
Identical tumors in humans were previously diagnosed as “spermatocytic seminomas” in order to distinguish them from the classic intratubular seminomas that originate within the seminiferous tubules and invade the interstitium (Bahrami, Ro, and Ayala 2007). This distinction is important because classic seminomas can be highly malignant whereas the spermatocytic tumors, despite their cellular/nuclear pleomorphism and alarming microscopic appearance, have a benign clinical course and are thus prescribed a very different line of treatment. These tumors also lack any association with “germ cell neoplasia in situ” (seminoma), and the different molecular features are well established. For these reasons, it needed to be defined and diagnosed separately from the classic seminoma, so the new 2016 World Health Organization classification for germ cell neoplasms renamed this neoplasia as “spermatocytic tumor” (Moch et al. 2016).
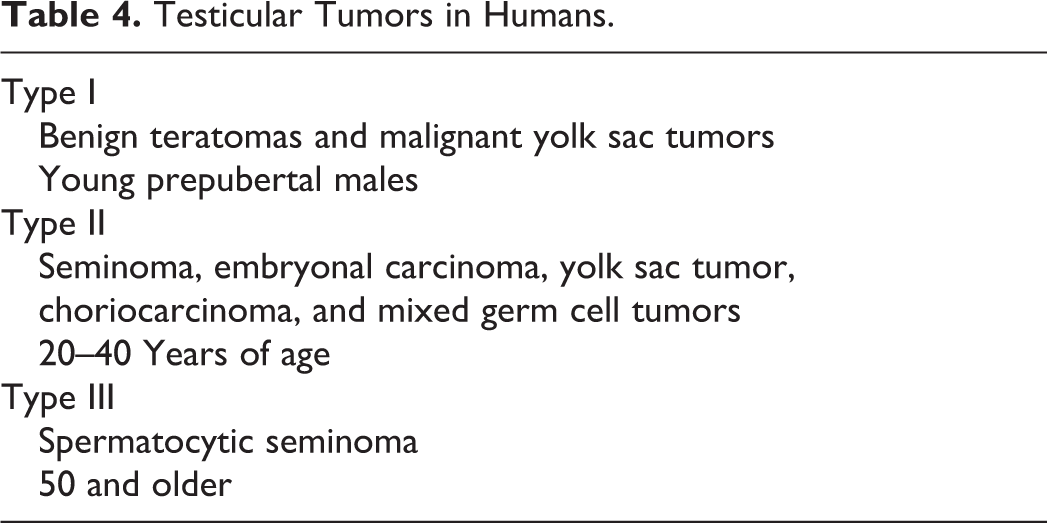
There are 3 general categories of testicular tumors in humans with specific age ranges for each group (Al-Hussain, Bakshi, and Akhtar 2015; Bahrami, Ro, and Ayala 2007; Table 4). Spermatocytic tumors fall into the type III category, mostly seen in men aged 50 years of age and older. They comprise 1% to 2% of all testicular tumors, do not occur in association with other germ cell tumors, and rarely metastasize. The cellular morphology of the human spermatocytic tumor is identical to that seen in the NCTR SD rats: small cells with a large nuclear to cytoplasmic ratio (6–8 um), medium-size cells with prominent nucleoli (15–18 um), large cells (50–100 um), multinucleated cells, some cells with prominent chromatin, and no fibrous septation nor lymphocytic infiltrates. There may be rare tumors with sarcomatoid or rhabdomyosarcomatous differentiation that are generally malignant and may have metastases (Bahrami, Ro, and Ayala 2007). To differentiate the spermatocytic tumors from other testicular tumors in human medicine, a series of immunohistochemical markers can be used and some of these are shown in Table 5. A classic seminoma would be positive for organic cation transporter 4 (OCT4) and D2-40, whereas a spermatocytic tumor would be negative for both (Jones et al. 2004; Miller 2007). Unfortunately, none of the markers listed in Table 5 have been validated for rodent studies.
Testicular Tumors in Humans.
Immunohistochemistry Data of Human Testicular Tumors.
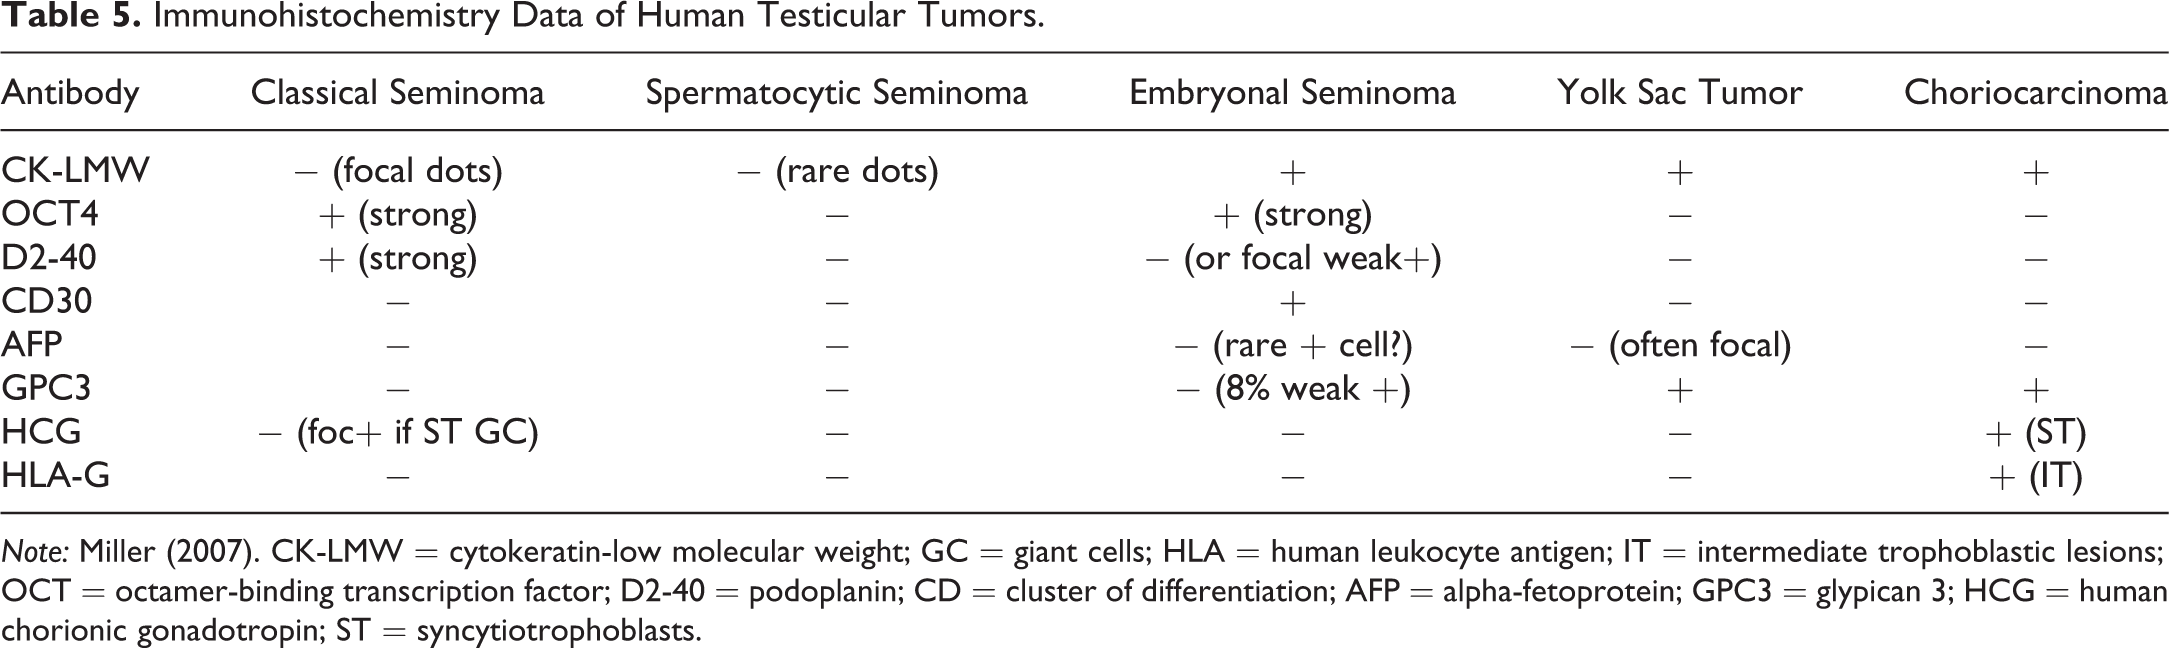
Note: Miller (2007). CK-LMW = cytokeratin-low molecular weight; GC = giant cells; HLA = human leukocyte antigen; IT = intermediate trophoblastic lesions; OCT = octamer-binding transcription factor; D2-40 = podoplanin; CD = cluster of differentiation; AFP = alpha-fetoprotein; GPC3 = glypican 3; HCG = human chorionic gonadotropin; ST = syncytiotrophoblasts.
The etiology of the spermatocytic tumor in man has not been definitively determined but is believed to have a different pathogenesis and separate cell of origin than a classic seminoma (Muller, Skakkebaek, and Parkinson 1987). Seminomas are believed to originate from intratubular carcinoma in situ. Spermatocytic tumors are not considered to be a subtype of seminoma and do not arise from an intratubular germ cell neoplasm. Immunohistochemical and molecular studies support that these tumors are likely to originate in a cell farther along the developmental pathway than those that give rise to the common germ cell tumors. The cell of origin appears to be more differentiated than that of the classic seminoma and is capable of spermatogenesis (Stoop et al. 2001). Cytogenic studies have shown that spermatocytic tumors are either diploid or aneuploidy with loss of chromosome 9 rather than isochromosome 12p, which is seen in other postpubertal germ cell tumors (Oosterhuis and Looijenga 2003; Looijenga et al. 2003; Looijenga et al. 2006). One study indicated that, based on the morphology and immunohistochemical profile, spermatogonial stem cells could be the cell of origin for this tumor (Waheeb and Hofmann 2011). In a different study, it was positive for OCT2, synovial sarcoma X, and sarcoma antigen 1, which point to the type A (dark) reserve spermatogonia as the cell of origin (Lim et al. 2011). Type A (pale) spermatogonia undergo active mitosis and divide to produce type B cells, which in turn divide to give rise to spermatocytes.
There is 1 published report of a spermatocytic seminoma in a specific pathogen-free strain of Wistar Han rat from Charles River (Kim, Fitzgerald, and De La Iglesia 1985). This was a testicular mass in a 2-year-old control rat that infiltrated the interstitial stroma. The cells were round to polyhedral, mono-, bi-, and multinucleated with a single distinct nucleolus and fine reticular chromatin. There was no intratubular involvement, and the authors confirmed the germ cell origin with electron microscopy. Another report describes a morphologically similar tumor in an F344 rat (F344/Crl). In this study, the light microscopic, ultrastructural, and immunohistochemical results supported a diagnosis of spermatocytic seminoma (Nyska et al. 1993).
Spermatocytic tumors have not been previously identified in NTP studies, likely due to the traditional use of the F344 rat. This lesion has not yet been seen in the NTP Wistar Han rat studies nor in the SD rats that are currently used for NTP studies. To date, this neoplasm has only been identified in the NTP/NCTR studies that have used the SD NCTR rats. During audience discussion, no one indicated having seen this neoplasm or making this diagnosis before. It may be useful to distinguish this neoplasm from the classic intratubular seminoma in terms of collecting historical data and performing additional studies to validate markers that have been used successfully in human medicine. For this investigation, it was not possible to perform electron microscopy due to the limited amount of tissue, but this is something that can be considered for future studies. However, the focal nature of the lesion, lack of intratubular involvement, cellular and nuclear pleomorphism, and presence of unique clumped chromatin pattern may be used to identify the spermatocytic tumor using an H&E stain. Scattered cells containing coarse clumped chromatin is one important morphological characteristic that may help to easily identify this tumor as one of germ cell origin because these cells so closely resemble the developing spermatocytes in adjacent tubules (Figure 5F). The veterinary toxicologic pathology community may want to consider using updated terminology such as “spermatocytic seminoma” or “spermatocytic tumor” for this neoplasm in order to distinguish it from the classic intratubular seminoma. It is currently listed as a synonym for a benign seminoma in the INHAND (for lesions in rats and mice) guidance document (Creasy et al. 2012).
Implant Inquisition: Medical Device Pathology Assessment/Approval Process
The next presentation was a combined pathologist/toxicologist talk by Dr. Lyn M. Wancket (North American Science Associates [NAMSA], Northwood, OH) and Dr. Shayne C. Gad (Gad Consulting Services, Raleigh, NC). Dr. Wancket began with images from a medical device local implantation study where 2 different articles were implanted in the epaxial skeletal muscle of an adult male New Zealand white rabbit. The control article was high-density polyethylene (HDPE; Figure 6A, B), and the test article was a membrane that contained xenogeneic collagen (Figure 6C, D). An HDPE location marker was also implanted with the test article (used to macroscopically identify the site at tissue trimming). After 2 weeks, the animal was euthanized, the muscle implant sites were collected, and the sites were routinely processed to produce H&E-stained microscopic sections for evaluation.
Skeletal muscle tissue in an adult male New Zealand white rabbit implanted with test articles. Figure A is a low magnification of a site implanted with a section of high-density polyethylene (HDPE, open white space) that has minimal cellular and soft tissue responses to the implant. A higher magnification of the area (B) shows that the reaction is primarily fibroblasts and minimal collagen deposition. Figure C shows a low magnification of a site implanted with a section of xenogeneic collagen (black arrows) alongside a location marker (HDPE, *); the cellular and soft tissue responses are much more severe than for HDPE alone (A). A higher magnification of the area (D) shows the article (black arrows), and inflammation is composed of numerous giant cells, heterophils, and lymphocytes. Hematoxylin and eosin.
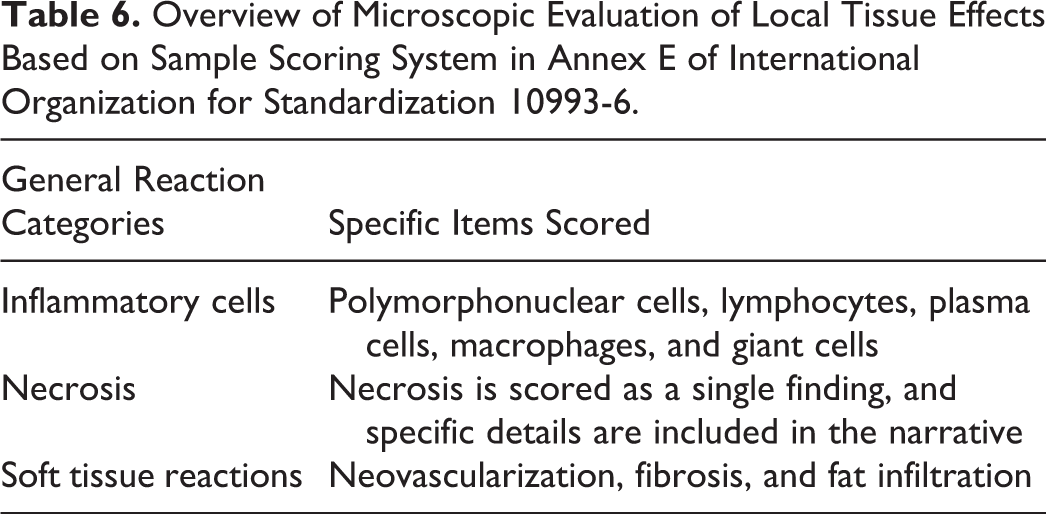
Participants were then shown low- and high-magnification images of each implantation site (Figure 6A–D) and asked to evaluate the local tissue response using criteria from ISO (2016) 10993: Biological Evaluation of Medical Devices—Part 6 Tests for Local Effects after Implantation. The case images were briefly reviewed, and participants were offered 5 voting choices. Four options were the tissue reaction categories listed in the guidance where the difference in tissue reactions between test and control sites could be (1) minimal/no reaction, (2) slight, (3) moderate, or (4) severe. Most participants decided that the test article had caused a moderate or severe reaction compared to the control material. These results mirrored those of the study pathologist who had assigned severe tissue reaction compared to the control article (primarily due to the numerous inflammatory cells in the test article site [Figure 6D]). Relatively few voters (<10%) selected the fifth voting option of “I have never looked at an implant before and am unaware of the guidances that are used for medical devices.” Option 5 was intended to survey how familiar participants were with evaluating medical device local implant sites prior to the session.
Dr. Wancket concluded with a short overview of microscopic factors listed for evaluation in the ISO 10993-6 guidance. Briefly, the presence and severity of inflammatory, necrotic, and/or soft tissue reactions within the implant sites are scored using a semiquantitative system (Table 6). Individual component scores are added together, and a group average is calculated for each article type. The group average for the control article is subtracted from the test article group average, and the resulting difference falls in 1 of 4 tissue reaction categories (Table 7).
Overview of Microscopic Evaluation of Local Tissue Effects Based on Sample Scoring System in Annex E of International Organization for Standardization 10993-6.
Tissue Reaction Ranges for Microscopic Evaluation of Local Tissue Effects Based on Sample Scoring System in Annex E of International Organization for Standardization 10993-6.
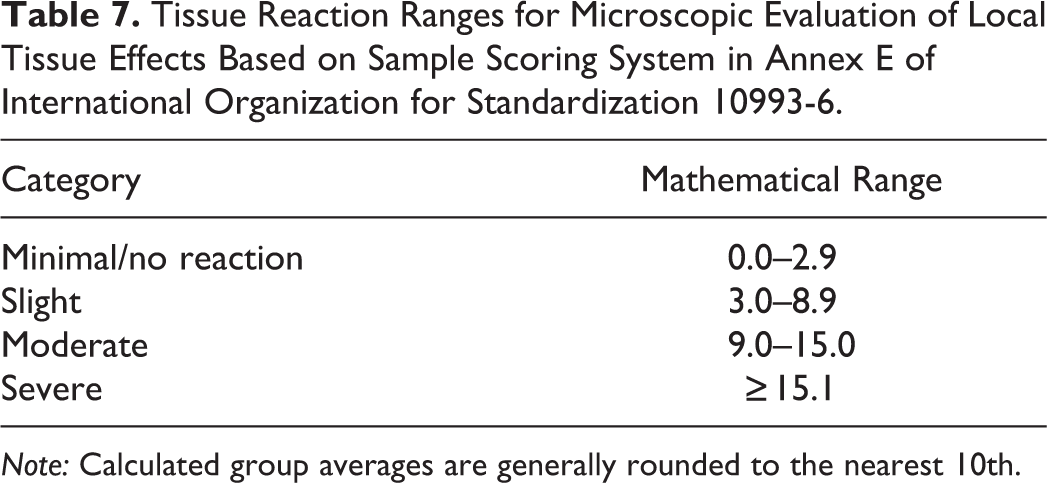
Note: Calculated group averages are generally rounded to the nearest 10th.
Inert control articles like HDPE can be used to detect excess surgical trauma or contamination (if a higher than expected amount of inflammation is seen in an individual study). However, as this case illustrates, large differences in tissue reactions can occur when a test article with a complex structure and composition is compared to a control article with a uniform composition/structure. Sometimes this difference cannot be avoided, since the components that produce a higher inflammatory response may be factors that are required for the intended design/function of a device (e.g., complex structure, ability to be absorbed; Anderson 2001). Therefore, it can be advisable to also include a comparative control (predicate material with a similar composition/shape) to provide context for a higher level of tissue reaction. While a test article may cause a severe tissue reaction compared to a negative control, a product that has minimal/no tissue reaction when compared to an already approved and marketed comparative control may ultimately achieve regulatory approval.
Dr. Gad then presented an overview of the regulatory approval process for medical devices. The medical device industry is globally a third of the size of the pharmaceutical industry in revenues and has followed a different regulatory acceptance path than drugs due to the differences in the nature and use of the products and of potential risks to patients, product life cycles, and economics. Modern device regulatory safety assessment started with U.S. Pharmacopeia guidance for “medicine closures” in the early 1960s. By 1993, the current (but constantly evolving) ISO 10993 preclinical biocompatibility system was established. ISO 10993 sets forth test selection matrices for what must be done before entry into humans depending on nature and duration of patient exposure. All biocompatibility testing (unlike the case with drugs) must be performed prior to any patient exposure.
Most devices are solid entities, but there are also injectable liquids (such as dermal fillers and human leukocyte antigen lubricants for knee joints) and suspensions of particles or liquids (such as metabolics). Until recently, histopathological evaluations were limited to injection site reactions and evaluation of foreign body responses in tissue immediately adjacent to implanted devices. This has changed, as concerns have developed for distal organ/tissue effects resulting from chemical entities transiting from devices to distal organs in the body. Much of the required evaluation of such potential effects is done by modeling, analytical chemistry, and paper risk assessment, but increasingly pathologists are being asked to participate in more complex evaluations. Additionally, in vivo imaging (historically used in clinical medicine to evaluate device placement, functioning, and disorders), having benefited from improved technology, is being called upon to provide in vivo assessments at repeated time points of long-term nonclinical implant and wound healing studies. Devices with long-term internal patient contact can have long-term systemic effects associated with the nature of the texture of the tissue-contacting surface of a device (such as unique lymph tissue tumors associated with rough textured breast implants). As devices continue to contain energy-receiving and energy generation components or be composed of engineered nanoparticles intended to receive specific light frequencies and transmit the resulting heat to specific targeted tissues, the need to employ the thoughtfully applied skills of a pathologist will continue to grow and evolve.
(Re)modeling Bone
Dr. Gail Pearse, GlaxoSmithKline, UK, presented lesions from treated female Lewis rats that were on study for up to 21 days and exhibited swelling of the hindfeet. For case 1, a series of images were shown to the audience for voting including low and high magnifications of longitudinal sections through the hind paw (Figure 7A–H).
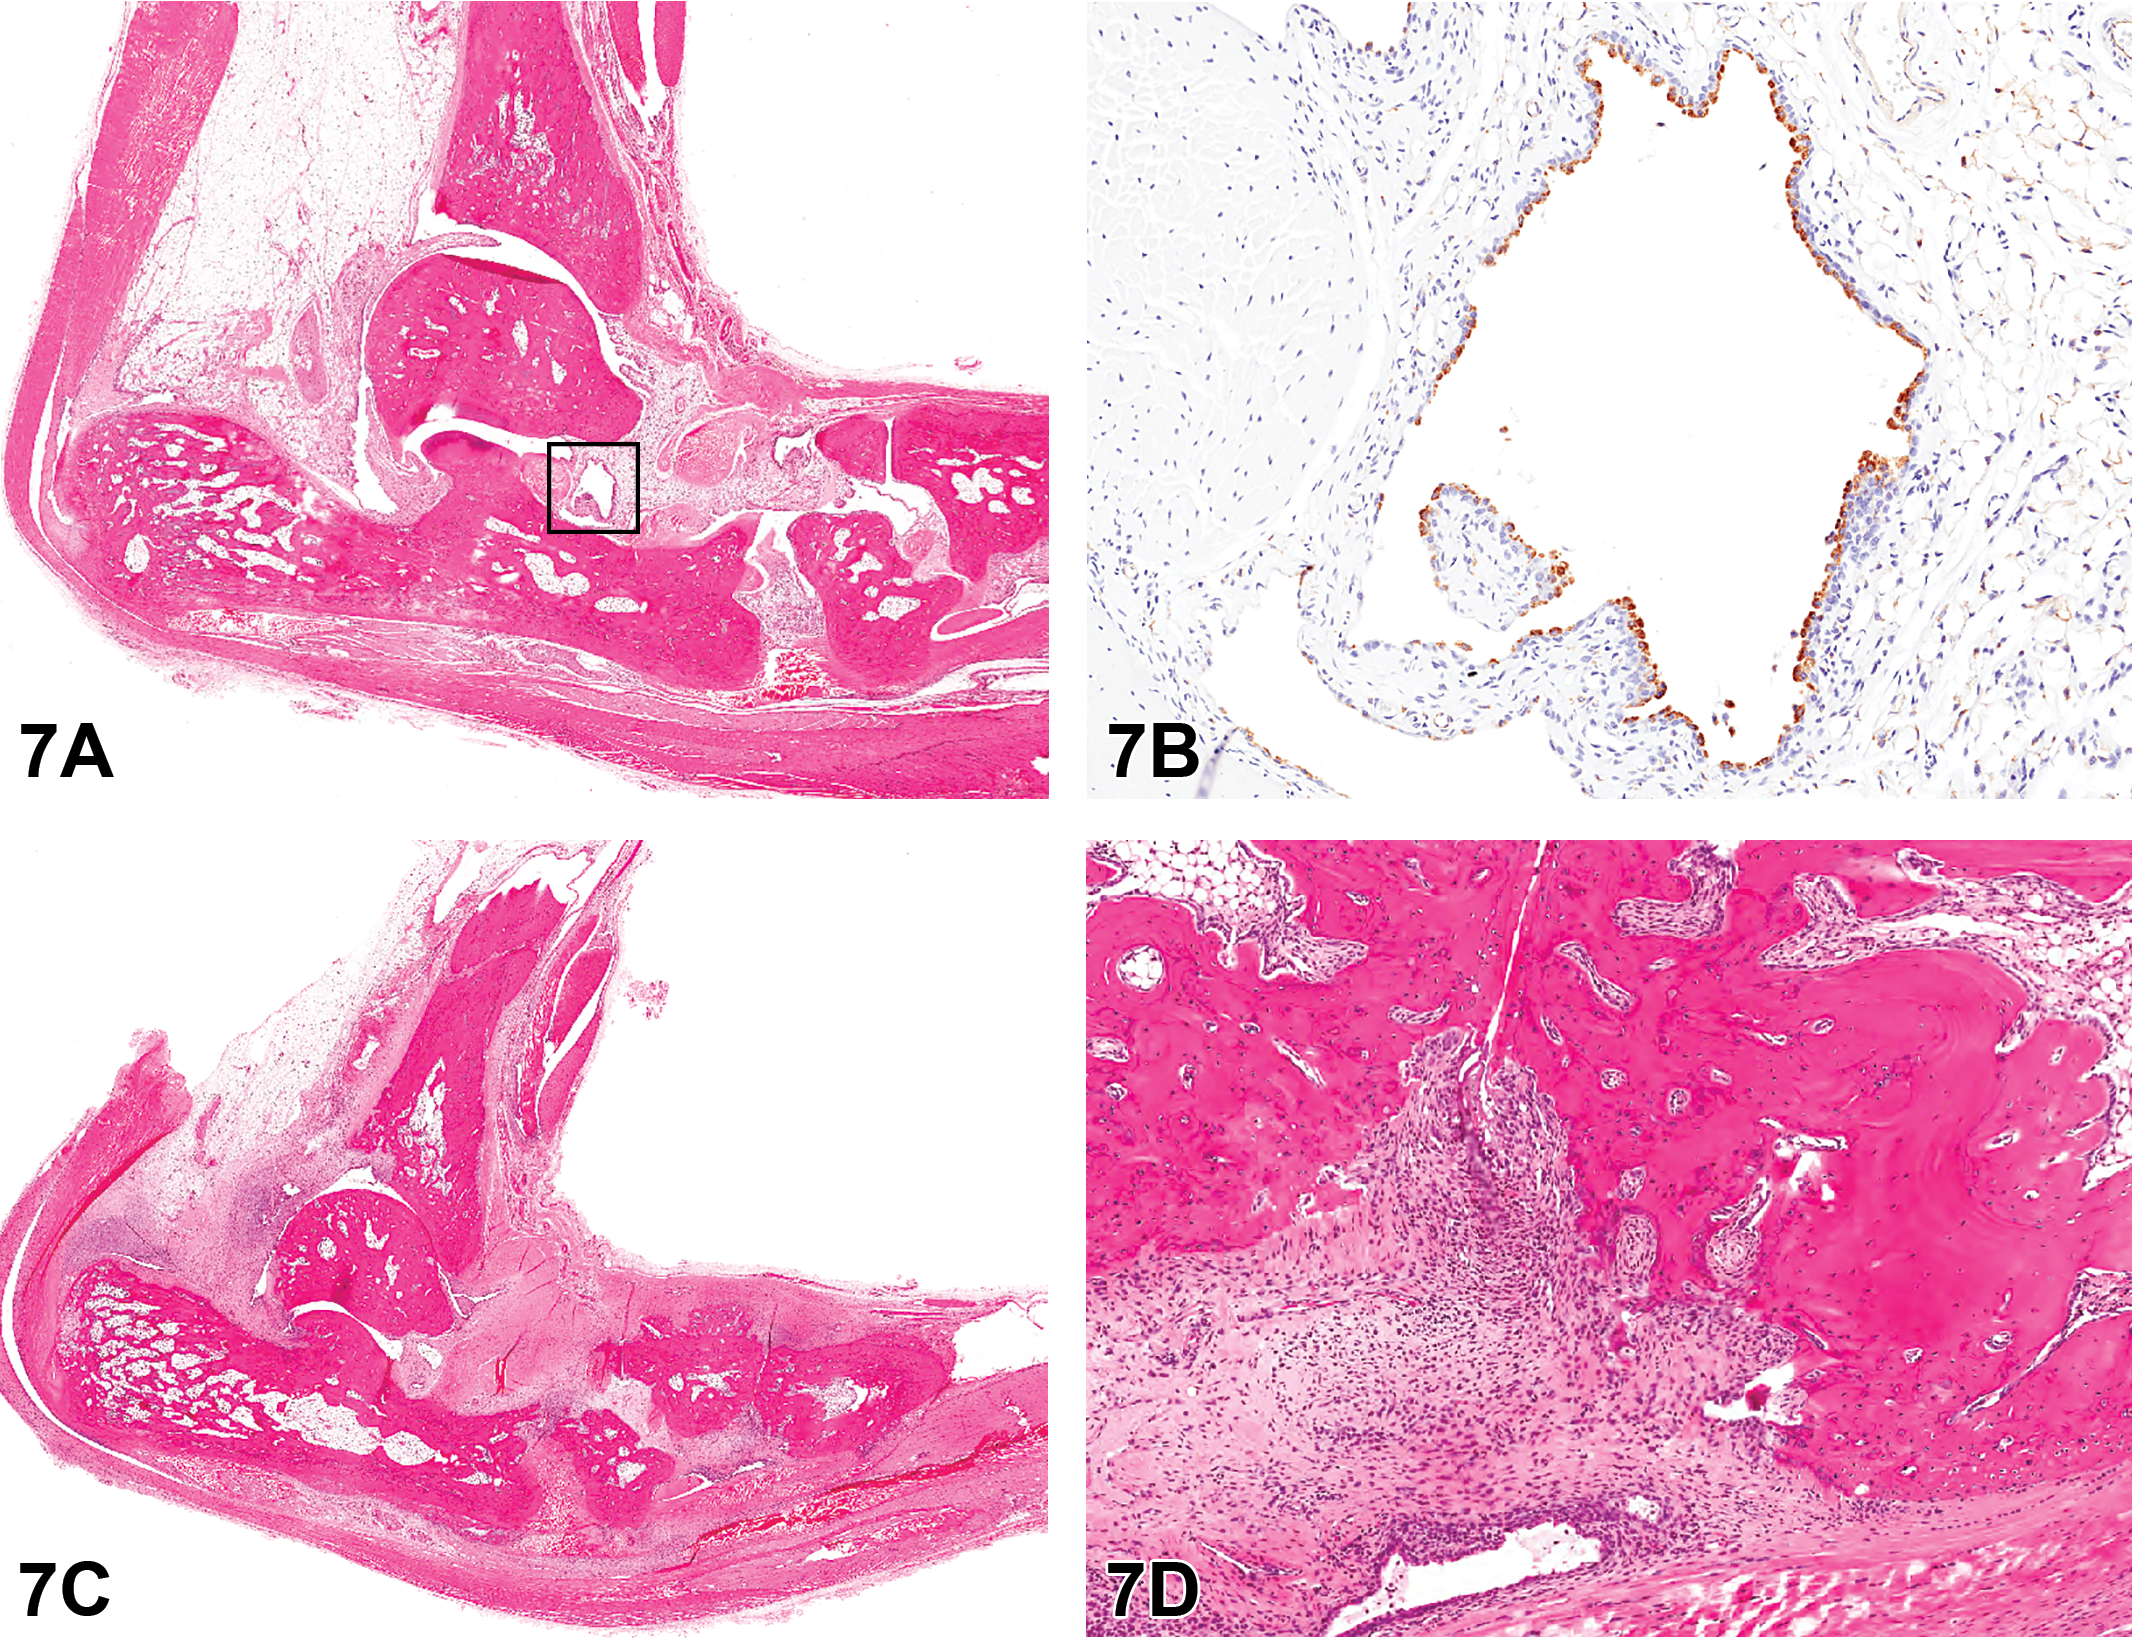
Longitudinal sections of hindfoot from treated female Lewis rats on study for up to 21 days as presented in case 1. Figure A is a low-magnification hematoxylin and eosin (H&E) section showing relationship of bones to each other and joint spaces. Figure B shows a higher magnification of a joint space outline in A, lined by plump synovial cells with strongly positive cytoplasmic immunoreactivity for CD68 on immunohistochemistry. Figures C and D show a more advanced lesion from another animal on the study (H&E). The low-magnification image (C) shows the irregularity of the surface of the smaller bones and expansion of the soft tissue by fibrosis and infiltrates of inflammatory cells. On high power of a joint space (D), the markedly thickened, inflamed synovial tissue has irregularly eroded the periosteal surface of underlying bone (pannus formation).
The voting choices and results were synovial membrane hypertrophy/hyperplasia (2%), inflammatory cell infiltration (0%), fibrosis (1%), bone resorption (2%), new bone/osteophyte formation (8%), all of the above (63%), arthritis (6%), and degenerative joint disease (18%). The 2 best choices favored by the speaker were “all of the above” and arthritis.
Dr. Pearse indicated that, while all of the changes can be identified in the joints, they can be encompassed in the single term “arthritis.” These lesions are examples of the collagen-induced arthritis (CIA) model: the most commonly studied autoimmune model of rheumatoid arthritis (Brand, Latham, and Rosloniec 2007; Townsend 2014). The CIA model is used to assess effectiveness of a drug candidate on disease progression. Intradermal immunization with an emulsion of heterologous type II collagen (porcine or bovine) from articular cartilage and complete Freund’s adjuvant results in a robust T cell and B cell inflammatory response to type II collagen. As in human rheumatoid arthritis, pro-inflammatory cytokines (e.g., tissue necrosis factor-a, interleukin [IL]-1b, and IL-6) are increased, and the inflammatory response leads to skeletal remodeling (Choy 2012; Schett 2008). Within the synovial membrane, type A/macrophage-like synoviocytes and monocytes, recruited from the circulation as part of inflammatory response, differentiate into osteoclasts under the influence of cytokines, particularly receptor activator of nuclear factor κ-B ligand (RANKL), leading to bone erosions. In addition, the type B/fibroblast-like synoviocytes proliferate and secrete matrix metalloproteinases and cathepsins that degrade cartilage and bone tissues, further damaging the joint.
The major morphological differential diagnosis for this lesion is degenerative joint disease where primary chondrocyte dysfunction results in disturbed maintenance of articular cartilage. Initially, articular cartilage is irregular, with loss of basophilia, formation of microfissures, and chondrocytes arranged in clusters. This is followed by gradual loss of cartilage, inflammation, subchondral bone resorption, secondary bone changes, and thickening and ossification of the joint capsule.
The next 3 cases for voting (Cases 2a–c) were from a 1-month toxicity study of SD rats where the treated groups had white discoloration of the incisor teeth. Images shown to the audience for case 2a included a longitudinal section of an incisor tooth with a high-magnification image of a focal lesion (figures not shown).
The voting choices and results were dentin niche (8%), dentin matrix alteration (24%), denticle (8%), background change occasionally seen in controls (11%), denticle and background change (39%), and all of the above (9%). The majority of the audience voted for denticle/background change, and this was the diagnosis preferred by Dr. Pearse.
A denticle is an abnormal, small, tooth-like entity occasionally seen as a background finding in the incisors of rodents (Kuijpers, Van De Kooij, and Slootweg 1996). They can be composed of islands of dentin which may be surrounded by a layer of odontoblasts. The major differential diagnosis would be dentin matrix alteration, which is abnormal dentin produced by odontoblasts (as chosen by 24% of the audience). By contrast, a dentin niche is a developmental defect where there is a focal or multifocal failure of odontoblasts to produce dentin.
For case 2b, one image shown to the audience for voting was a section of tooth with disorganization of the odontoblast layer with focal linear extension through the predentin and dentin layers of the incisor. In another area of the tooth, odontoblasts were multifocally raised by subjacent islands of dentin-like material in the subjacent pulp cavity (figures not shown).
The voting choices and results were denticle (0%), dentin matrix alteration (5%), odontoblast disorganization with disruption of predentin/dentin (29%), denticle and odontoblast disorganization with disruption of predentin/dentin (41%), all of the above (26%), and other (0%). The audience voted for the correct answer of denticle and odontoblast disorganization with disruption of predentin/dentin (Long and Herbert 2002; Weber 2007).
The final case for voting was 2c. One image shown to the audience for voting was a high-power view of the ameloblast layer in a control animal showing the normal regularly arranged single layer of columnar ameloblasts (Figure 7I). Ameloblasts overlay an artifactual space caused by removal of the enamel layer in the process of decalcification of the section. The companion image was the same view in a treated animal showing disorganization, vacuolar degeneration, and loss of ameloblasts, with formation of fluid-filled irregular spaces (Figure 7J). The underlying enamel layer had not been removed by decalcification, but the crosshatch appearance of the uncalcified enamel matrix was visible.
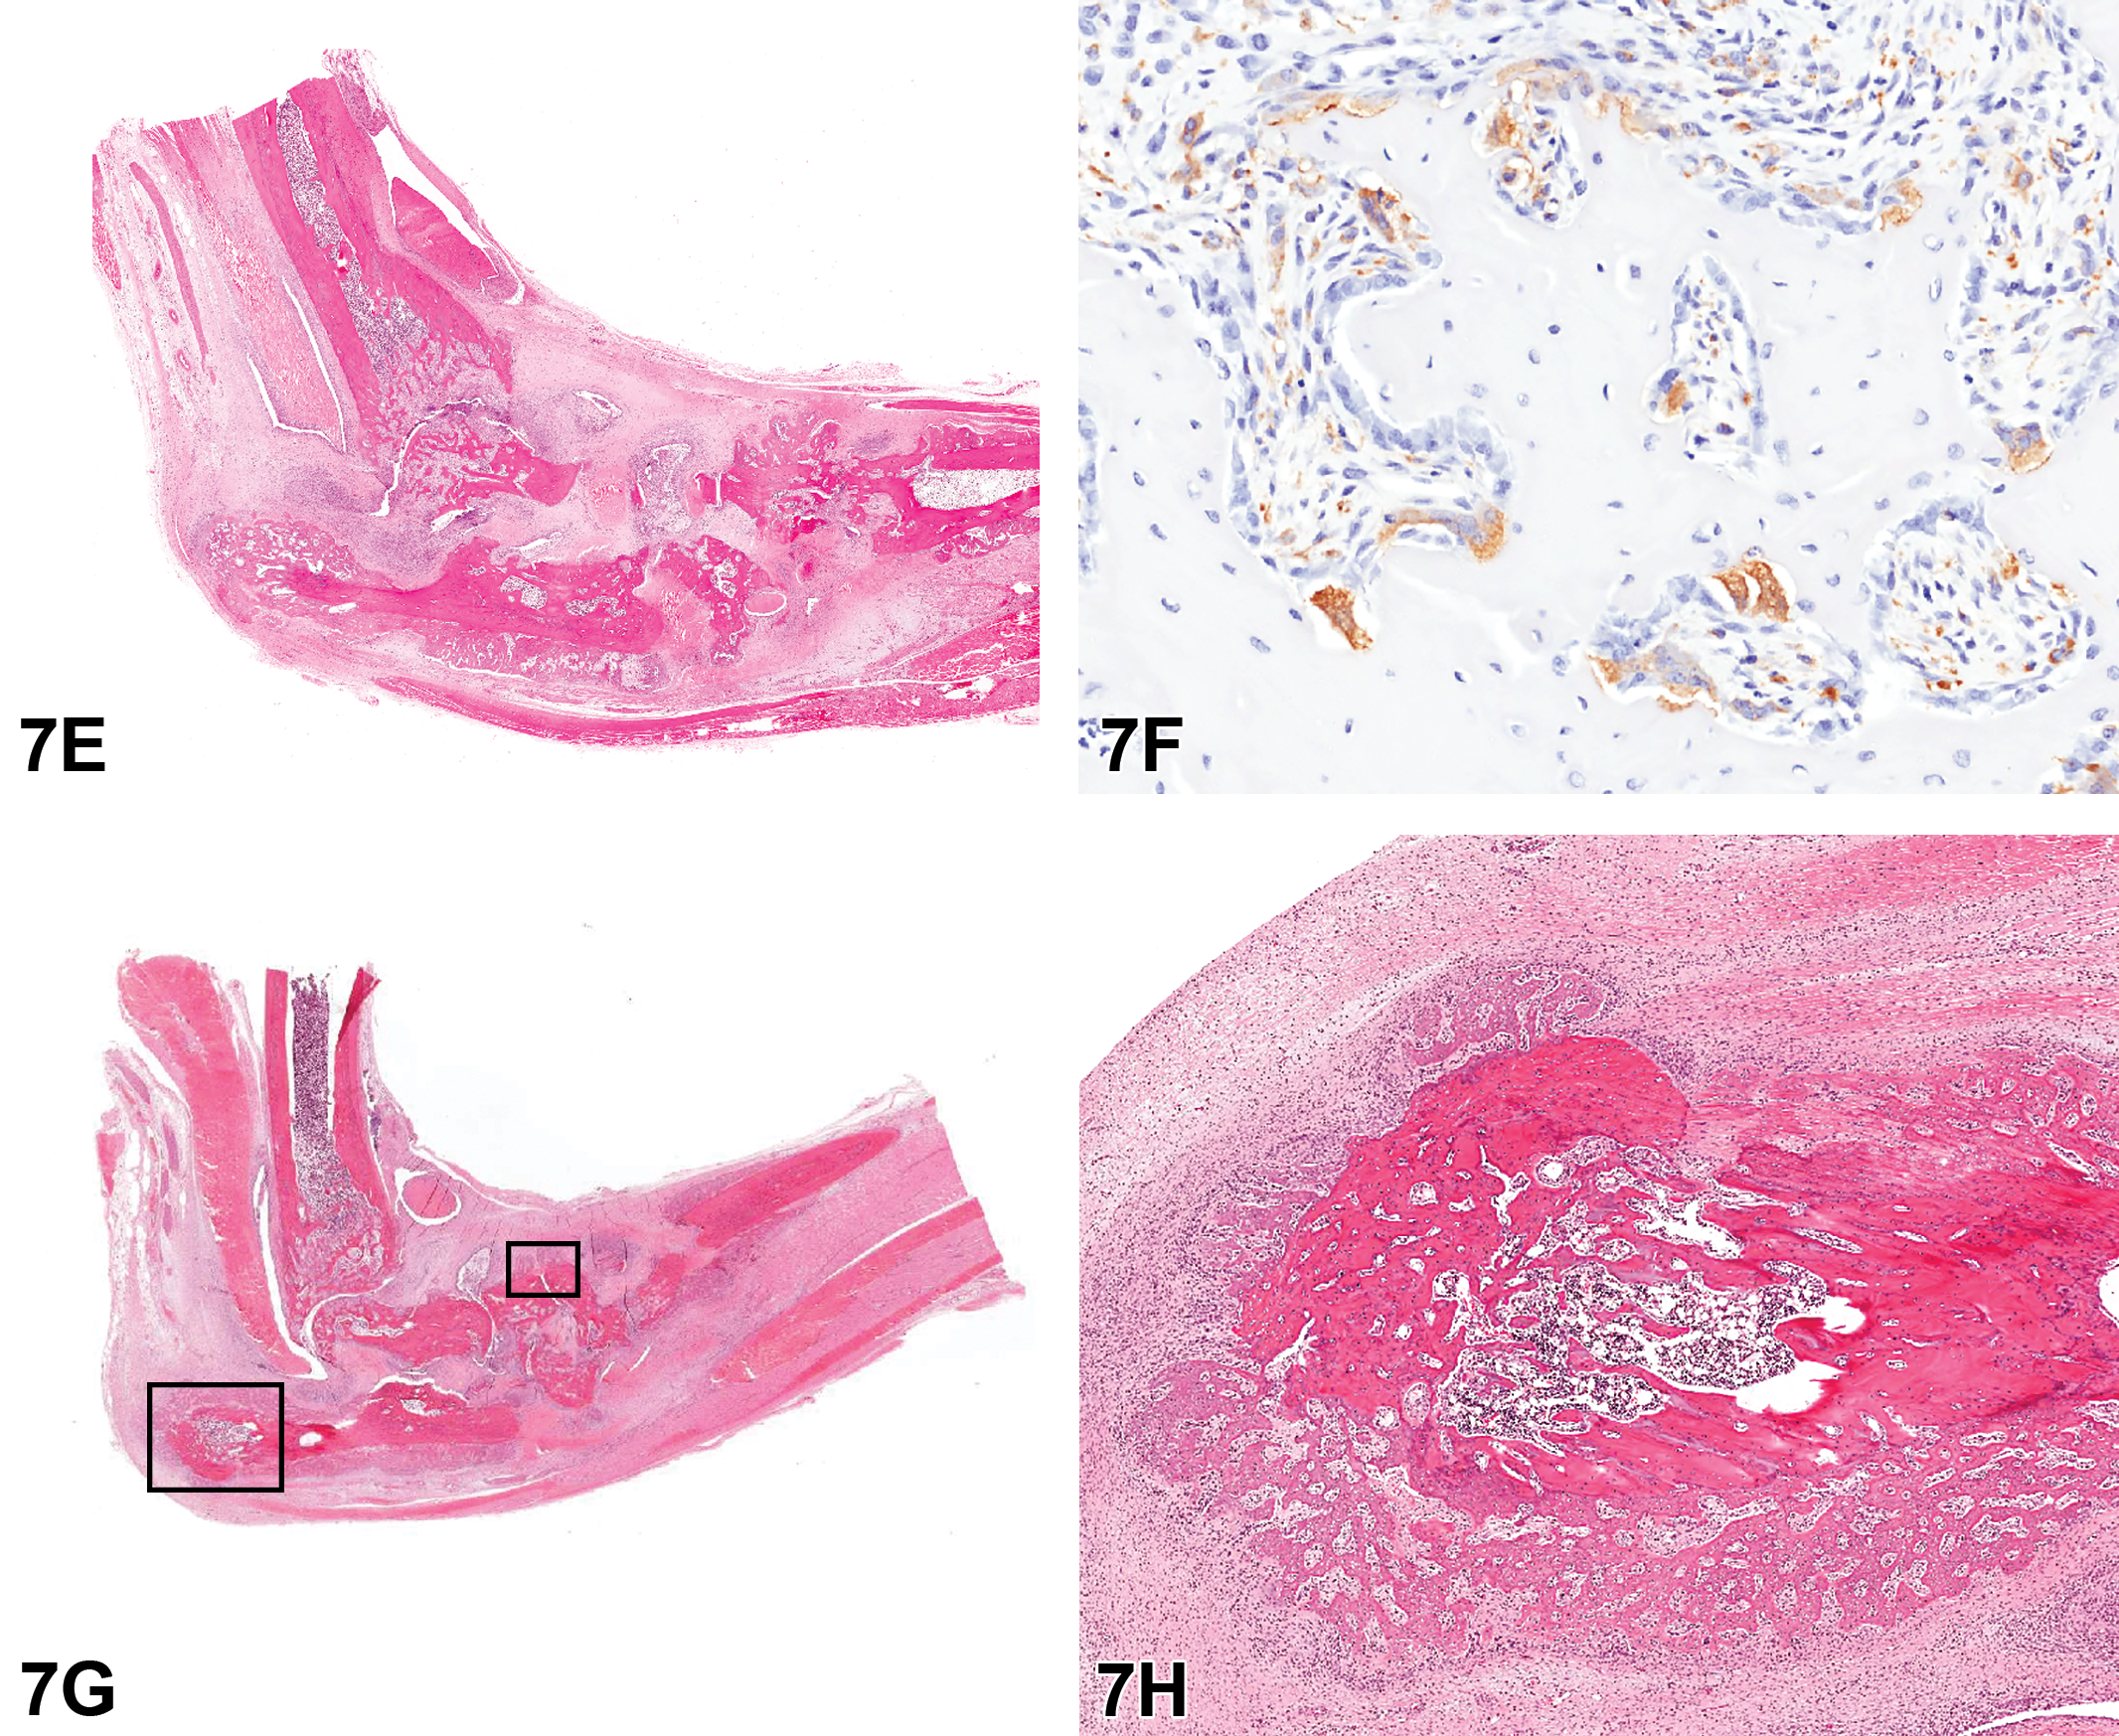
Figure E is an H&E example of a severe lesion with marked soft tissue swelling associated with fibrosis and inflammatory cell infiltrates and extensive bone remodeling with distortion of joint spaces. Figure F is a high-power view of an area of bone remodeling. Trabeculae of bone are lined by large multinucleate osteoclasts with strongly positive cytoplasmic immunoreactivity for CD68. Figure G shows a low power of the hindfoot with areas of new bone formation (outlined). Higher magnification of Figure G shows irregular trabeculae of new bone radiating from the periosteal surface of the calcaneus bone. H&E.
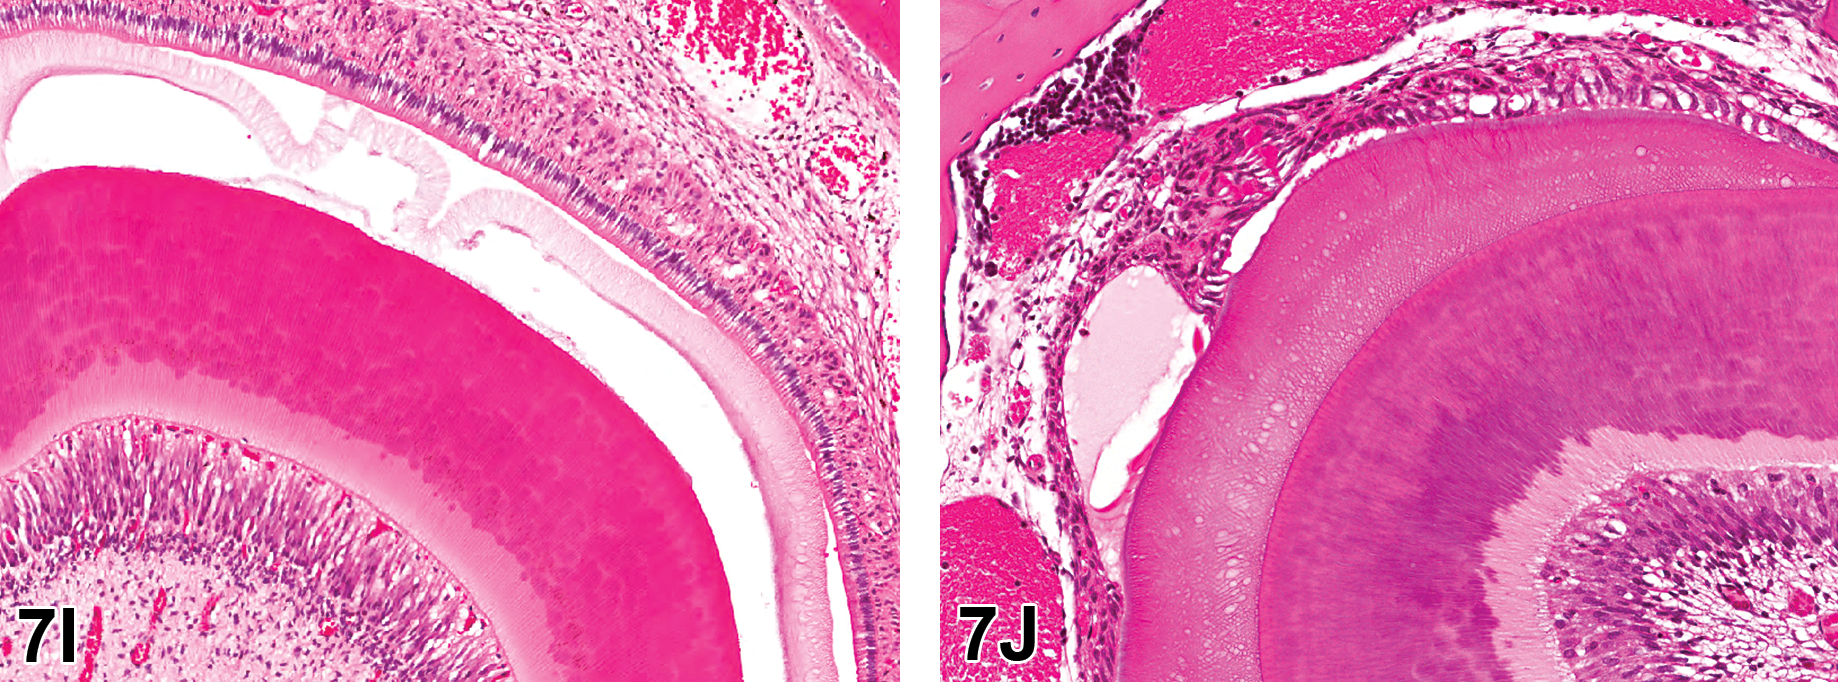
H&E-stained longitudinal sections of incisor teeth from Sprague Dawley rats from a 1-month toxicity study. Treated rats on this study were noted to have white discoloration of the incisor teeth. Figure I is a high-power view of the ameloblast layer in a control animal showing the normal regularly arranged single layer of columnar ameloblasts. Ameloblasts overlay an artifactual space caused by removal of the enamel layer in the process of decalcification of the section. Figure J is the same view in a treated animal showing disorganization, vacuolar degeneration, and loss of ameloblasts, with formation of fluid-filled irregular spaces. The underlying enamel layer had not been removed by decalcification, but the crosshatch appearance of the uncalcified enamel matrix was visible.
The voting choices and results were ameloblast degeneration (22%), enamel necrosis (1%), poorly mineralized enamel matrix (3%), artifact (3%), ameloblast degeneration and poorly mineralized enamel matrix (70%), and other (1%). The majority of the audience voted for ameloblast degeneration and poorly mineralized enamel matrix, which were the correct diagnoses. In these continually growing incisor teeth, there was disruption of the odontoblast and ameloblast layers. Degeneration and loss of ameloblasts resulted in disrupted enamel formation. As enamel is normally yellow in rodents, this disruption caused the white discoloration noted during the study.
Location, Location, Location
Dr. Jessica S. Hoane (Charles River Laboratories, Inc., Durham, NC) presented similar tumors in 2 animals from 2 NTP chronic carcinogenicity bioassays for which she served as study pathologist. Dr. Mark Cesta (NTP, NIEHS) is the NTP pathologist for this study, which is still under review. Dr. Hoane would like to acknowledge Dr. Kyathanahalli Janardhan for his integral contribution to the IHC analysis performed on these tumors and the IHC Core at the NIEHS.
Male and female HSD:SD rats had whole-body exposure to the test compound by both perinatal exposure and also by postweaning exposure for up to 105 weeks. Animal 1 was a terminal sacrifice male. Animal 2 was a female euthanized early at 710 days on study due to the presence of a large subcutaneous mass. Prior to evaluation of the photomicrographs and voting, the audience was informed that tumors of similar appearance were not present in any other tissue in this animal, thereby eliminating the possibility that these tumors represented metastases.
Low-, mid- and high-magnification images of H&E-stained photomicrographs from both cases were shown to the audience (Figure 8A–F). Both tumors were nonencapsulated but well demarcated. Case 1 was located in the mediastinal adipose connective tissue adjacent to the thymus. Case 2 was located in the connective tissue adjacent to the left primary bronchus. Both tumors had similar microscopic appearances and were composed of small clusters or nests of neoplastic polygonal chief cells separated by delicate fibrovascular stroma. The neoplastic cells had round to ovoid centrally located nuclei, typically with finely stippled chromatin and 1 to 2 prominent nucleoli, and moderate amounts of eosinophilic cytoplasm. Mitotic figures were rare. These lesions had the classic “Zellballen” appearance for tumors of neuroendocrine origin, which is a term credited to the German anatomist Alfred Kohn (Tischler and deKrijger 2015).
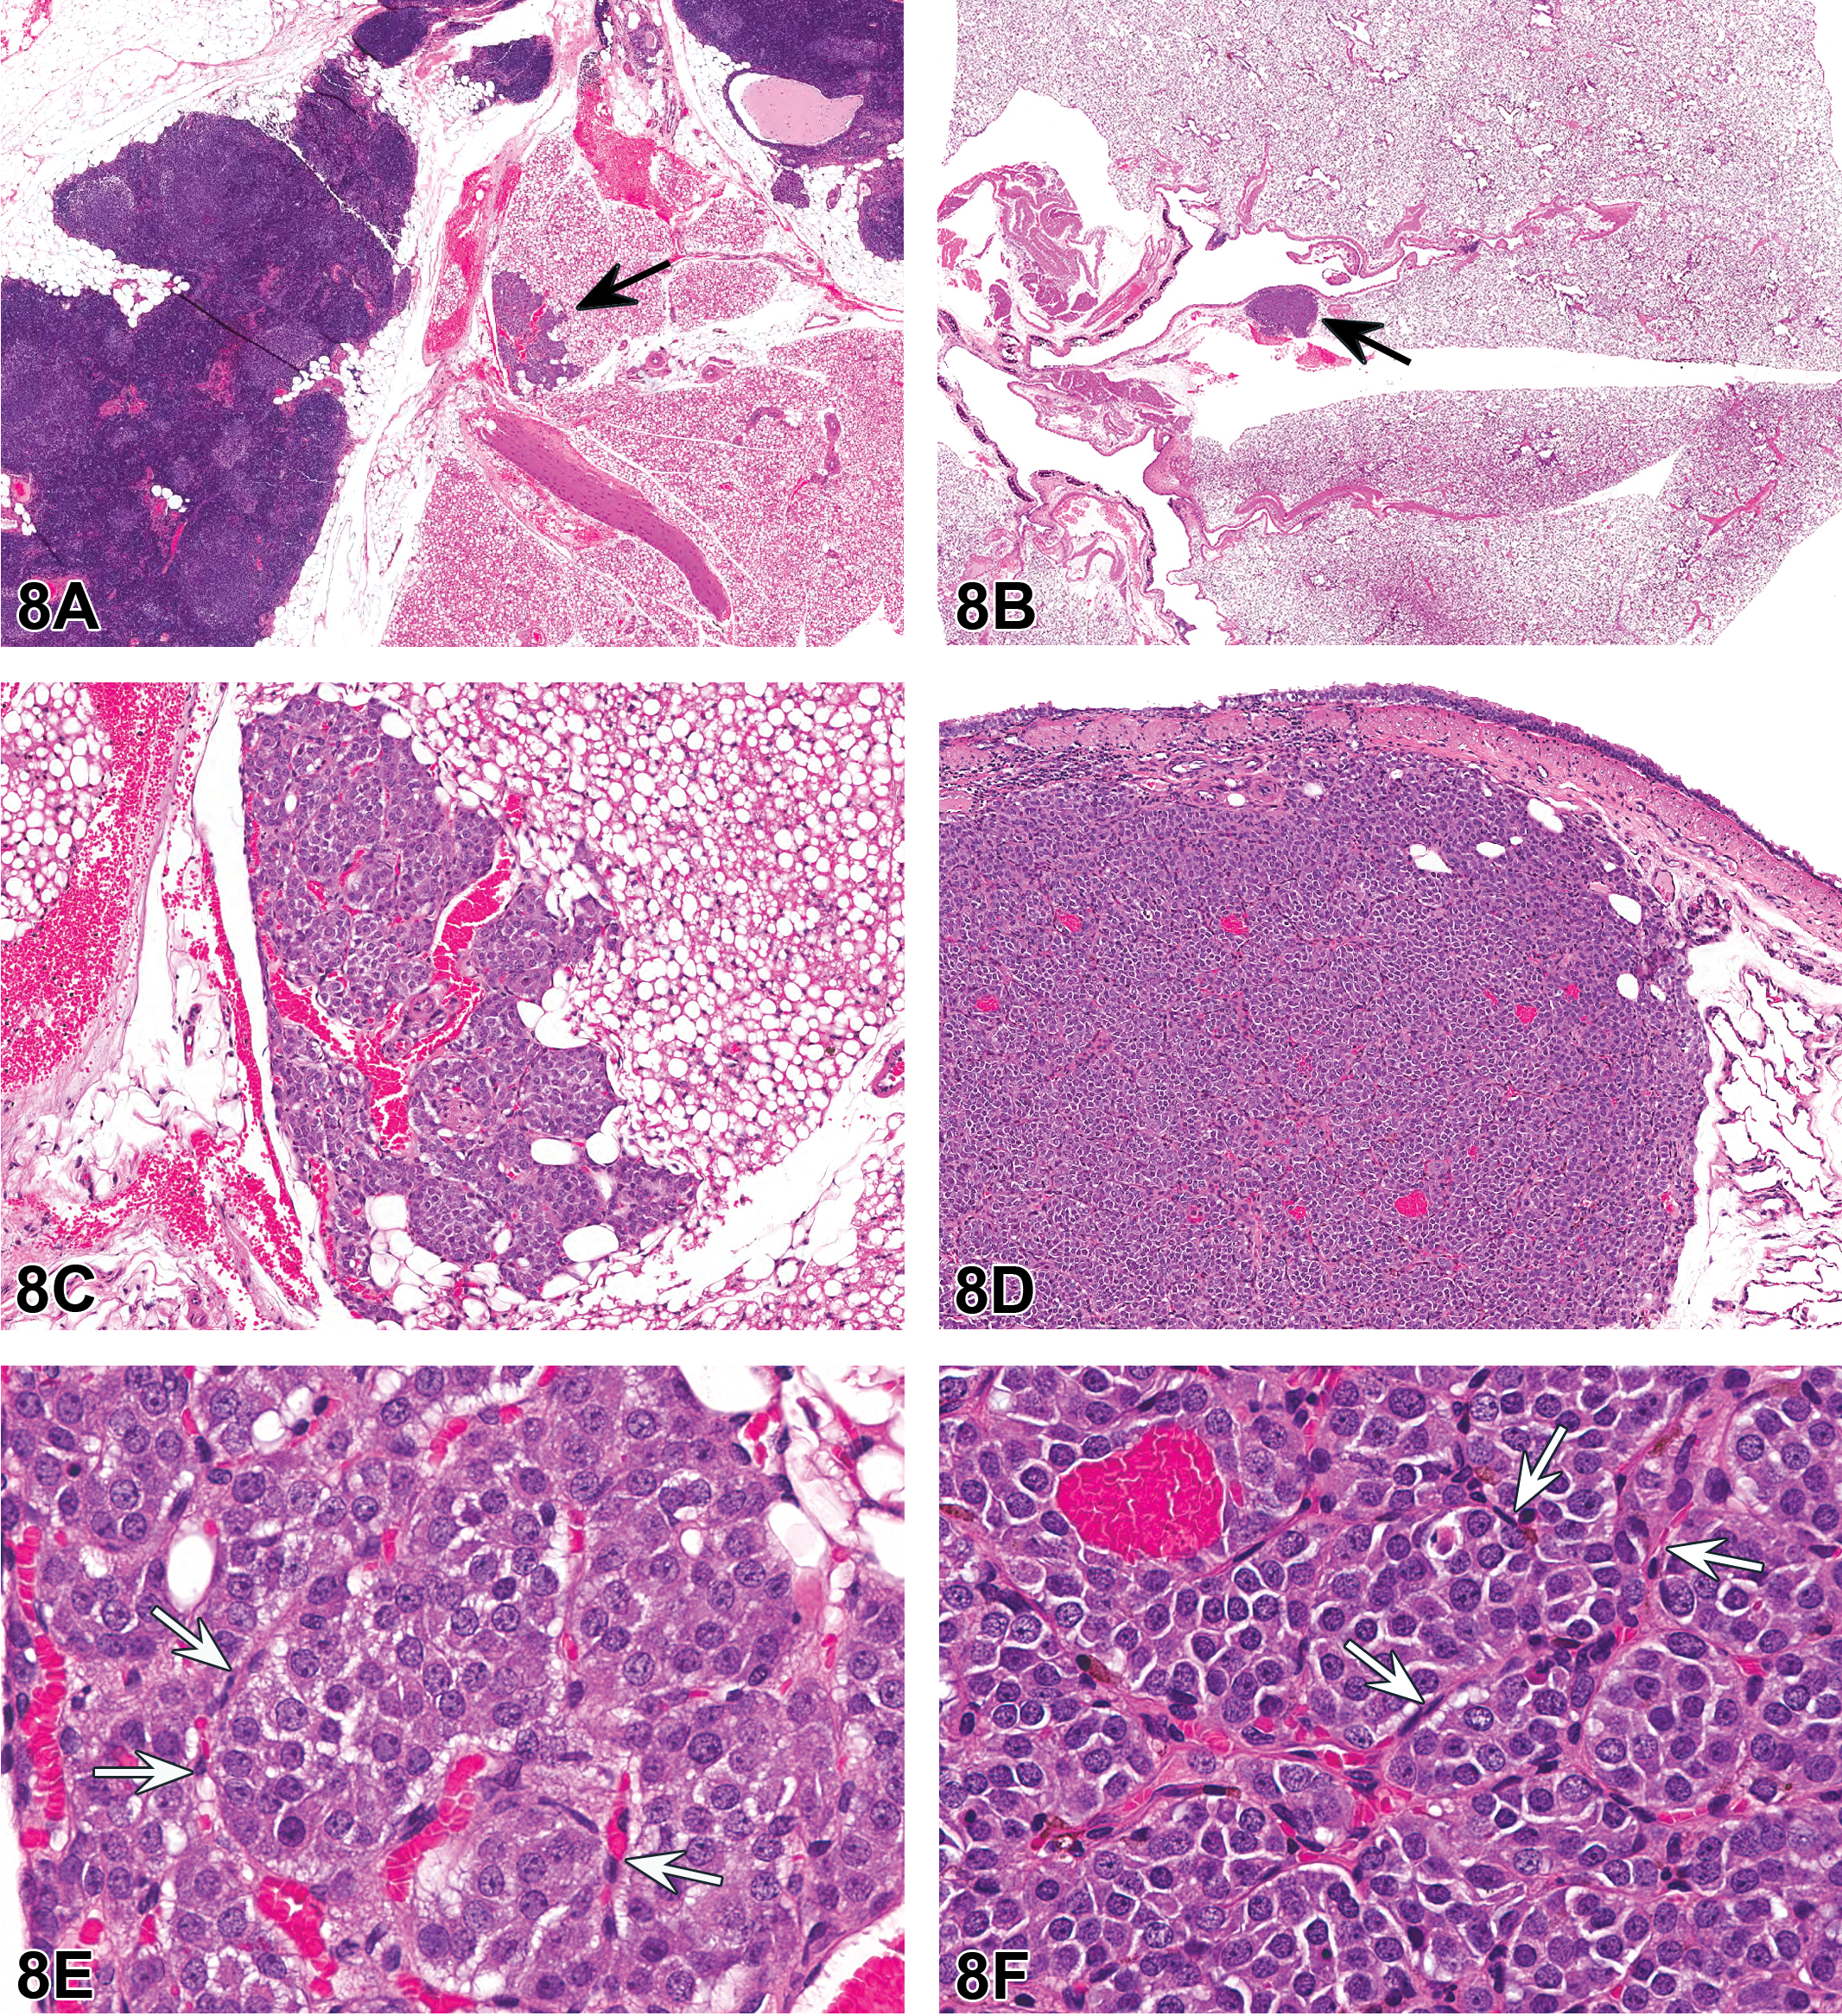
Tumors within the cervical (case 1; A, C, and E) and thoracic (case 2; B, D, and F) mediastinum of a male and female Harlan Sprague Dawley (HSD: SD) rat, respectively, from National Toxicology Program 2-year chronic whole-body exposure carcinogenicity bioassays. The tumors are shown at low (A and B, arrows), mid (C and D), and high (E and F) magnifications. Both tumors are well demarcated from the adjacent adipose connective tissue but nonencapsulated. Both tumors are composed of small clusters or nests of neoplastic polygonal chief cells (“Zellballen”) separated by delicate fibrovascular stroma containing spindyloid sustentacular cells (E and F, arrows). The neoplastic chief cells have round to ovoid centrally located nuclei, typically with finely stippled chromatin and 1 to 2 prominent nucleoli, and moderate amounts of eosinophilic cytoplasm. Mitotic figures are rare. Hematoxylin and eosin (H&E).
The majority of attendees selected the diagnosis of neuroendocrine tumor (57%) based upon evaluation of the H&E-stained sections from cases 1 and 2. The other diagnoses received from 3% to 21% of the votes: paraganglioma (21%), chemodectoma (10%), glomus tumor (5%), carcinoid (5%), and other (3%). The author’s preferred diagnosis for this lesion was “paraganglioma.”
Paraganglia are composed of clusters of cells of neural crest origin and are highly vascular with numerous capillaries (McNicol 2010; Zak and Lawson 1982). They are found within the abdominal and thoracic cavities as well as in the head and neck region (McDonald and Blewett 1981; McNicol 2010; Zak and Lawson 1982). Paraganglia are composed predominantly of polygonal type I chief cells as well as spindyloid type II sustentacular cells (McNicol 2010; Zak and Lawson 1982). Some paraganglia, mainly within the head and neck region, function as chemoreceptors that monitor and respond to changes in blood oxygen, carbon dioxide, and/or acid–base balance (McNicol 2010). Another chemoreceptor paraganglion is located in the region of the aortic arch (aortic body; Zak and Lawson 1982).
There have been a number of previous monikers for paragangliomas including glomus tumor and chemodectoma. The term “glomus tumor” was reportedly originally used by Heller in 1762 (Sajid, Hamilton, and Baker 2007; Zak and Lawson 1982), and this term is no longer in use. The term chemodectoma is too restrictive, as the majority of paragangliomas do not have chemoreceptor function, and too broad, as paraganglia are not the only structures that have chemoreceptor function. Paraganglioma is considered to be more accurate from an ontogenic perspective, as these tumors arise from paraganglia (Davidovic et al. 2005). Carcinoids are neuroendocrine tumors arising within epithelial tissues and are commonly found within the gastrointestinal tract, pancreas, or lung (Kunz 2015). In addition, carcinoids have been reported in the thymus/mediastinal region (Chaer et al. 2002). Carcinoids have multiple patterns of growth, described as insular (organoid), trabecular, glandular, undifferentiated, and mixed (L. A. Johnson et al. 1983). The carcinoid insular pattern would be most similar to but still distinctive from the classic appearance of paragangliomas; however, IHC staining would be expected to differentiate carcinoids and paragangliomas.
Five IHC stains were performed on both tumors to further characterize their cellular origin: synaptophysin, CK, glial fibrillary acidic protein (GFAP), S-100, and tyrosine hydroxylase. Detailed staining protocols for these antibodies are available at the NIEHS IHC website (http://www.niehs.nih.gov/research/resources/protocols/protocols-immuno/index.cfm, last accessed July 16, 2017). The expected and actual IHC results are summarized in Table 8.
Expected and Actual Immunohistochemistry Panel Results.
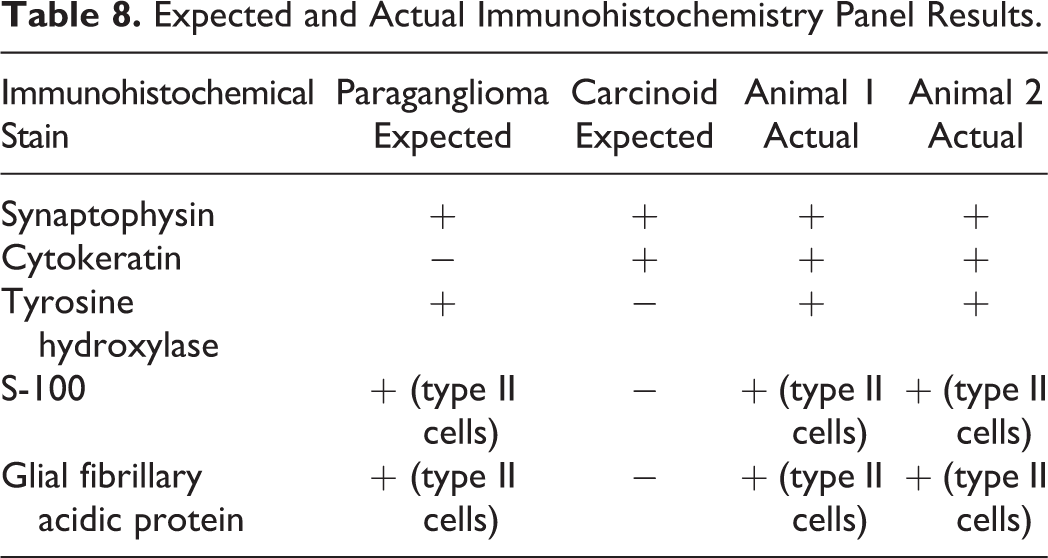
High-magnification images of all IHC results from both tumors were shown to the audience. Both tumors had similar IHC results in that within both tumors, the polygonal chief cells had diffuse, strong cytoplasmic staining for synaptophysin (Figure 8G); diffuse, weak cytoplasmic staining for CK (Figure 8H); and diffuse, variable cytoplasmic staining for tyrosine hydroxylase (Figure 8I, J). For both tumors, there was positive staining of sustentacular cells with both S-100 and GFAP (Figure 8K, L).
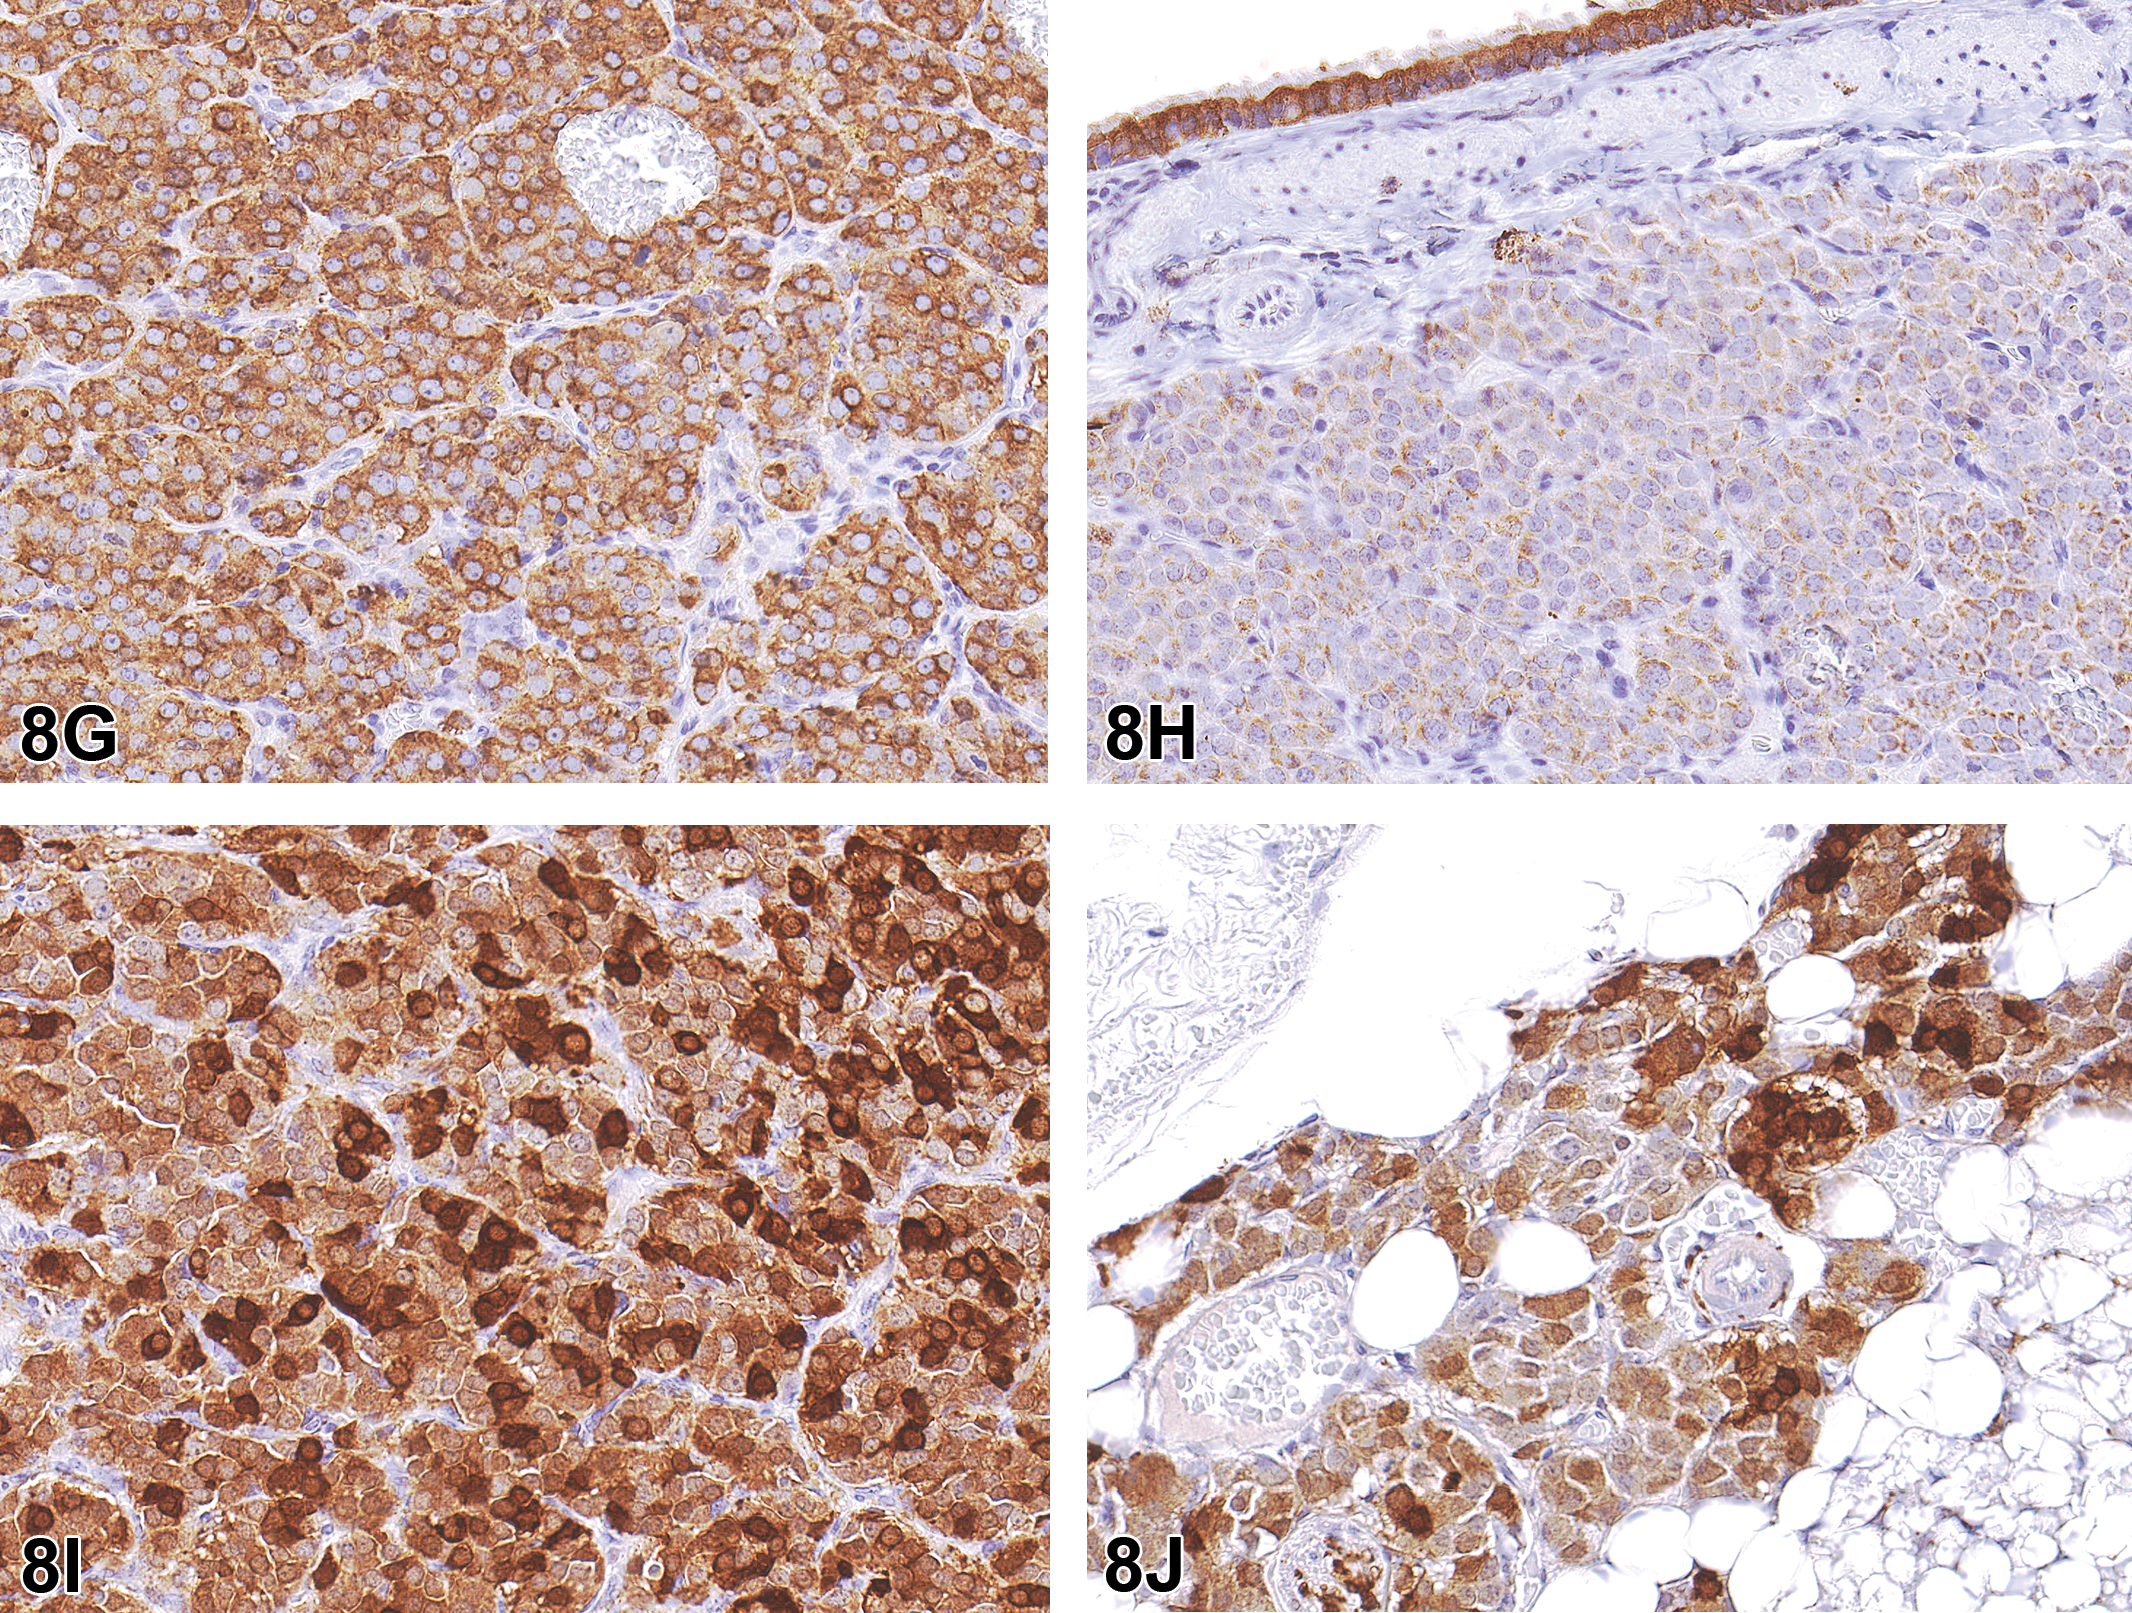
Immunohistochemical evaluation of the tumor from the case 2 female rat, including synaptophysin (G), cytokeratin (CK; H), and tyrosine hydroxylase (I) along with tyrosine hydroxylase from the case 1 male rat (J). The polygonal type I chief cells had diffuse strong cytoplasmic staining for synaptophysin (G) and diffuse weak cytoplasmic staining for CK (H). Tyrosine hydroxylase staining in both the female (I) and male (J) rats was diffuse and of variable intensity.
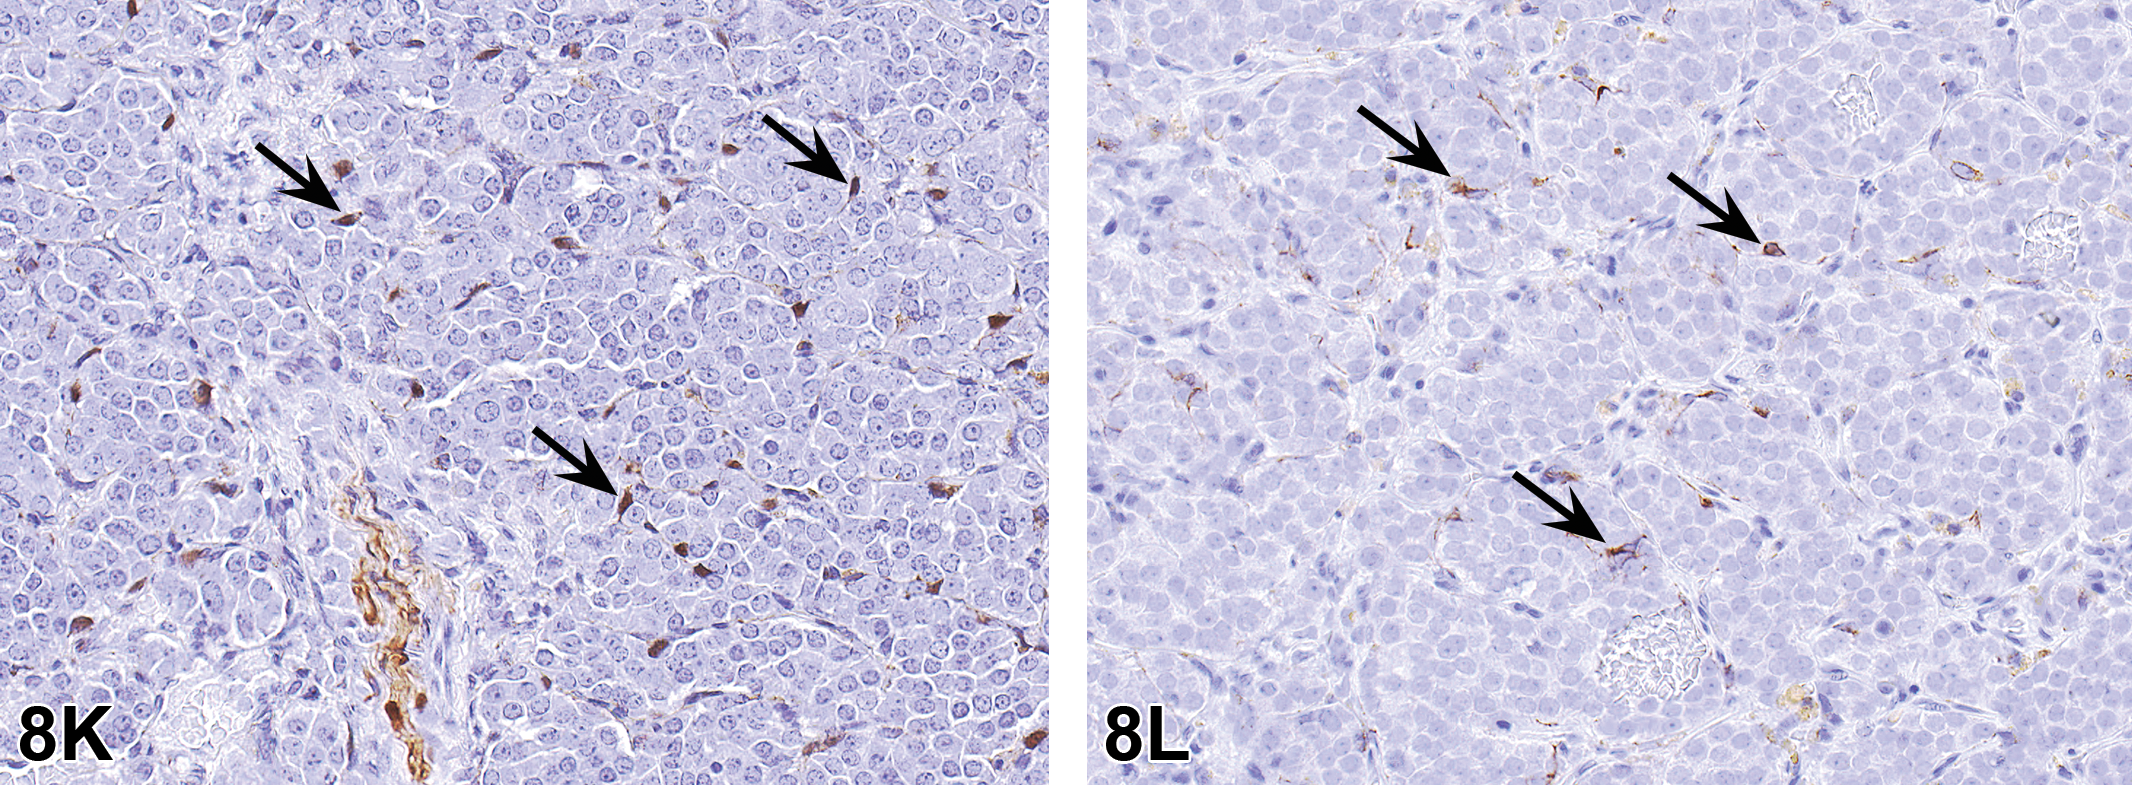
Immunohistochemical evaluation of the tumor from the case 2 female rat including S-100 (K) and glial fibrillary acidic protein (GFAP; L). The spindyloid type II sustentacular cells (arrows) were immunopositive for S-100 (K) and GFAP (L).
The CK positive staining, albeit weak for both of these tumors, was unexpected; however, CK reactivity has been previously reported in paragangliomas (T. L. Johnson et al. 1988). In addition, the positive tyrosine hydroxylase staining provides strong evidence that these tumors were of paraganglia origin, as tyrosine hydroxylase is the enzyme for the rate limiting step in catecholamine synthesis and would only be expected to be present in tissues capable of catecholamine production (Iwase et al. 1994), which does not include neuroendocrine tissue of epithelial origin (Iwase et al. 1994). The presence of S-100 positive type II sustentacular cells was also helpful in confirming the paraganglioma diagnosis (Uchikov et al. 2009).
There is currently no published guidance for the diagnosis of these tumors in laboratory rodents, with the exception of the INHAND publication for the cardiovascular system of the rat and mouse in which the term paraganglioma was recommended for neoplasms of the aortic body paraganglion (Berridge et al. 2016). In 2004, paraganglioma was the World Health Organization (WHO) recommended term for neuroendocrine neoplasms arising within tissues of neural origin (De Lellis et al. 2004). The term paraganglioma is typically prefaced by the site of the tumor, for example, carotid body paraganglioma. Other neuroendocrine tumors are those arising within tissues of epithelial origin which are termed carcinoid or neuroendocrine carcinoma (De Lellis et al. 2004).
There are a handful of prior publications about paragangliomas in rats. There are several case studies describing tumors in 1 or 2 animals (Bhandari 1982; Li et al. 2013; Trevino and Nessmith 1972), and a comprehensive review of paragangliomas, focusing on F344/N rats from the NTP and National Cancer Institute programs (Hall, Yoshitomi, and Boorman 1987). Key points from the Hall et al. paper are that paragangliomas are uncommon in most strains of rats, and there is a male predominance (Hall, Yoshitomi, and Boorman 1987). From analysis of the data presented, the majority of the tumors were found in animals >100 weeks of age.
There was a brief discussion of the pathophysiology of paragangliomas. At least 40% of paragangliomas are of hereditary origin, and numerous genes associated with susceptibility of developing these tumors have been identified (Pacak and Wimalawansa 2015; Tischler and deKrijger 2015). An increase in paragangliomas arising from chemoreceptors such as the carotid body has been recognized in humans with medical conditions resulting in chronic hypoxia, for example, chronic obstructive pulmonary disease and those living at high altitudes (Sajid, Hamilton, and Baker 2007). In addition, aortic body paragangliomas, often diagnosed as chemodectomas, are most commonly seen in brachycephalic breeds of dogs (Hayes 1975; Yates, Lester, and Mills 1980)
Although the audience’s preferred diagnosis of neuroendocrine tumor is technically correct, the presenter found this term to be too broad and preferred the diagnosis of paraganglioma for the tumors from both animals. Paraganglia and neuroendocrine cells within epithelial tissue are both of neuroendocrine origin; however, the biologic functions of these 2 distinct cell populations are different, and thus neoplasms arising from these cell populations would also be expected to have different, and clinically significant, biological behavior. There are reports that paragangliomas may be endocrinologically active in humans, potentially resulting in syndromic manifestations (Pacak and Wimalawansa 2015; Tischler and deKrijger 2015), and carcinoids can also be hormonally active, resulting in clinical disease (Kunz 2015). Therefore, distinguishing neuroendocrine tumors arising within epithelium from those arising from paraganglia would be important with regard to treatment and prognosis.
I Just Can’t Go on Dying Like This
Dr. Wanda M. Haschek of the University of Illinois College of Veterinary Medicine, Urbana, IL, presented histopathology of liver from high-dose male C57BL/6j mice on a subchronic study. Mice were dosed by oral gavage, 5 days/week, for 4, 8, or 13 weeks. The principal investigator on the microcystin-LR (MCLR) study was Dr. Wilson Rumbeiha, Iowa State University, while Dr. Wanda Haschek provided pathology support.
Light microscopic images (paraffin sections stained with H&E) of the liver were presented, with the following voting choices and results: (1) hepatitis (0%); (2) hepatocellular hypertrophy (1%); (3) necrosis and cellular infiltrate (12%); (4) hepatocellular dissociation and apoptosis (1%); (5) karyocytomegaly and multinucleation, hepatocellular (4%); (6) 2 and 3 (19%); (7) 3, 4, and 5 (61%); (8) other (1%); and (9) I don’t know (1%). The speaker agreed with the majority consensus of multiple lesion descriptors in choice 7.
Mice were treated with MCLR, a hepatotoxic cyanobacterial toxin, in order to identify novel biomarkers of MCLR toxicity and correlate these with pathologic changes. Hepatic lesions were, in general, dose and time dependent, although individual variability was present. At the highest dose, severe hepatotoxicity was present at both 4 and 8 weeks based on liver weights, histopathology, and aminotransferase activity.
Hepatic lesions were characterized by hepatocyte disassociation, cell death (both necrosis and apoptosis), and cellular infiltrates consisting of mononuclear cells and a few neutrophils (Figure 9A–D). Lesions were primarily centrilobular. Regenerative changes in the same sections consisted of abnormal mitoses, karyocytomegaly, and multinucleation of hepatocytes (Figure 9B–D). Most of these changes had resolved by 13 weeks (Figure 9D). Hepatic regeneration with apparent tolerance to continued MCLR exposure was observed.
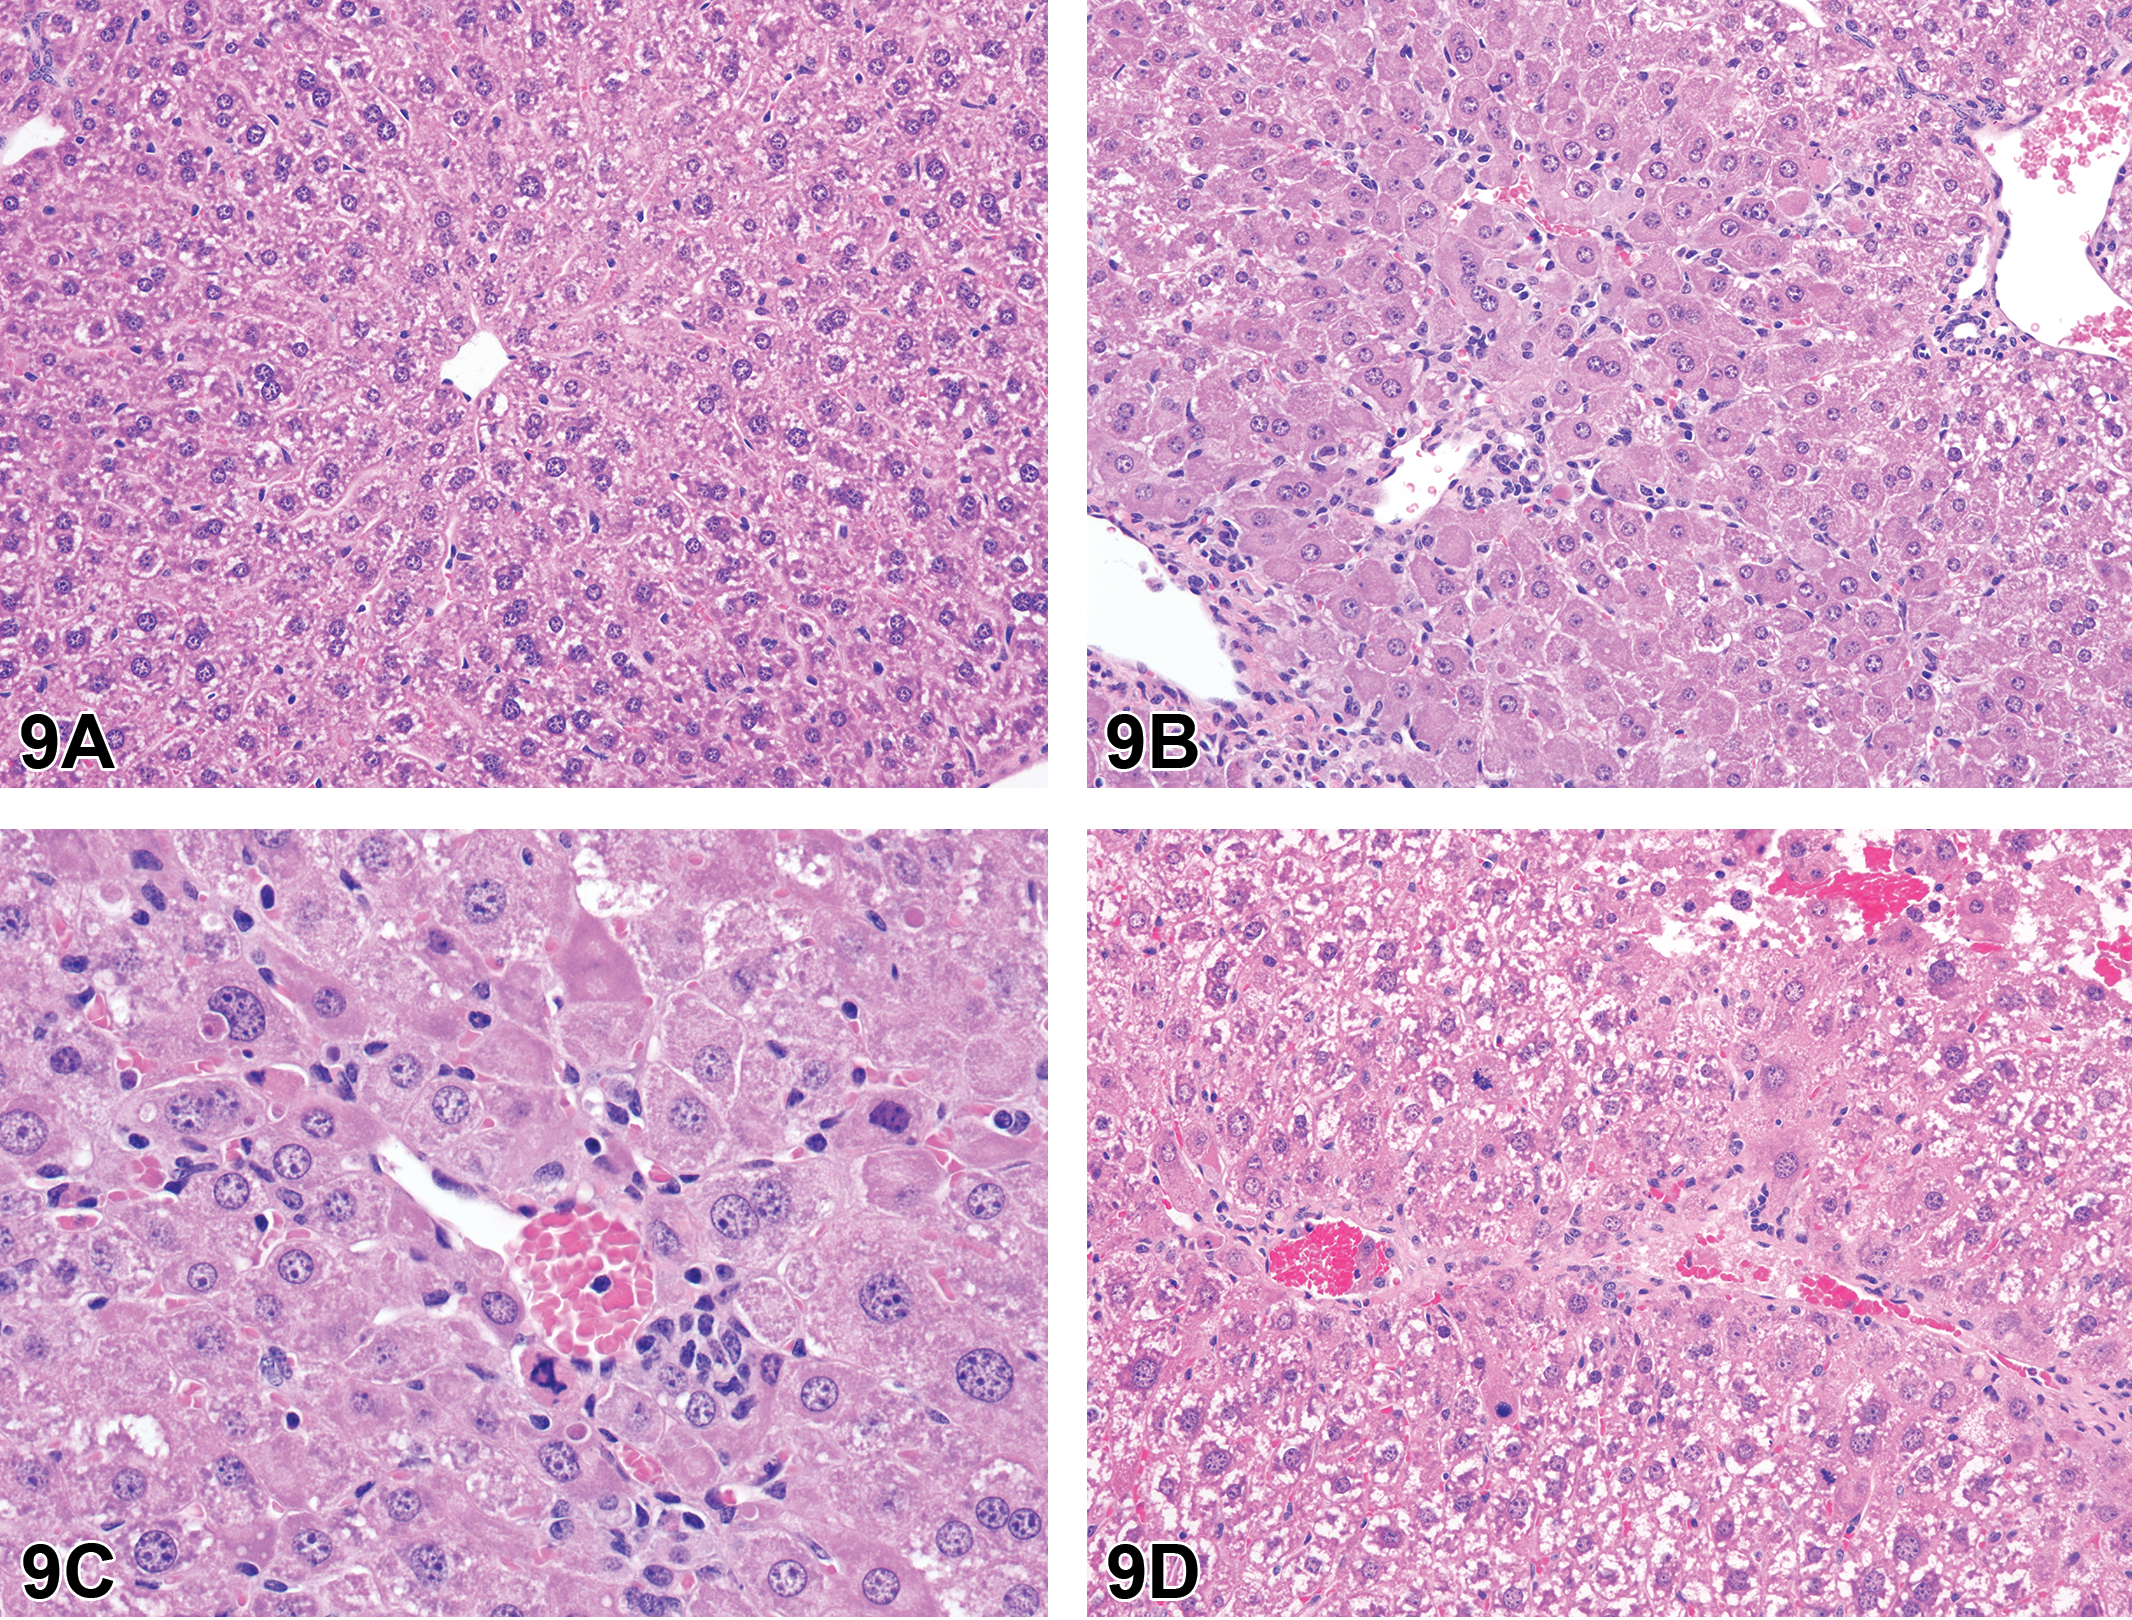
Liver from male C57BL/6j mice, control (A), or treated with microcystin-LR (MCLR, B-D). (B) After 4 weeks of MCLR treatment, there is hepatocyte dissociation, multinucleation and karyocytomegaly, and loss of hepatocytes. Cellular infiltration by mononuclear cells and a few neutrophils is also present. (C) After 8 weeks of MCLR treatment, hepatocyte apoptosis, apoptotic bodies, and karyocytomegaly are prominent. (D) After 13 weeks of MCLR treatment, there is almost complete regeneration, however, cell proliferation continues with some abnormal mitoses, mild cellular infiltrates, and hepatocellular cytoplasmic alteration.
Necrosis, apoptosis, and karyocytomegaly have been described previously with acute and subacute MCLR toxicity (Hooser et al. 1989; Guzman and Solter 2002). Dissociation of hepatocytes appears to be a unique lesion related to microtubule damage. Megalocytosis and karyomegaly have been described with xenobiotics such as pyrrolizidine alkaloids, aflatoxins, vidarabine, 2-methylimidazole, and nitrosamines (Haschek, Wallig, and Rosseaux 2010). These changes should not be confused with polyploidy that occurs in mice, with severity depending on age and strain (Thoolen et al. 2010).
MCLR, a common waterborne toxin produced by freshwater harmful algal blooms (HABs), adversely affects the health of humans and animals, including pets, livestock, and wildlife, as well as the ecosystem and the economy. For example, in 2014, 400,000 people in Toledo, OH, were without drinking water for 3 days due to MCLR contamination of the water supply intake from Lake Erie. HAB events are increasing in frequency around the globe largely due to climate change and nutrient pollution. MCLR is an Environmental Protection Agency (EPA) high-priority drinking water contaminant and has been selected by the NTP for toxicity/carcinogenicity studies due to public health concerns. The WHO recommends 1 µg/L as the safe allowable MCLR limit in drinking water based on the no observed adverse effect level for mouse liver histopathologic damage.
Hepatotoxicity is the major acute effect of MCLR (Hooser et al. 1989). Acute hepatic failure followed by death or chronic liver disease was reported in hemodialysis patients with chronic renal disease in Brazil following MCLR contamination of the water (Carmichael et al. 2001). Pets, mainly dogs, livestock, and wildlife have died following exposure to contaminated water and to contaminated mussels in the case of California otters (Miller et al. 2010; Hilborn and Beasley 2015). There are meager data on subchronic and chronic effects, but MCLR may play a role in hepatic cancer either via genotoxicity or tumor promotion (Zegura 2016).
MCLR is transported by an organic anion transporting polypeptide system (Oatp1b2, a bile acid transporter) through the plasma membrane into hepatocytes where it binds to and inhibits type 1a and 2a protein phosphatases (PP1/PP2) leading to hyperphosphorylation of cellular proteins and a cascade of events that results in cytotoxicity and possibly genotoxicity (Chen and Xie 2016). Oxidative damage also plays a role in MCLR toxicity. Cytoskeletal disruption leads to hepatocyte dissociation and interferes with normal cell division resulting in duplication of nuclear material in the absence of cytokinesis, resulting in karyocytomegaly, multinucleation, and abnormal mitoses (Hooser et al. 1991; Chen and Xie 2016).
Comments during the discussion included MCLR contamination as a potential problem for contract research organizations (CROs) and other animal facilities that rely on local water supplies due to potential shutdown of the water supplies and contamination. It was also pointed out that Amanita phalloides induces similar lesions.
Mast Cells in the Brain: Let’s Keep an Open Mind
Dr. Dinesh S. Bangari of Sanofi Genzyme, Framingham, MA, presented findings from his investigative studies on the presence of mast cells in the rat brain. Dr. Bangari would like to acknowledge his colleagues at Sanofi Genzyme who collaborated on this investigation. Special thanks to Jennifer Johnson; Errin Roberts; Tanya Walker; Emily LaCasse; Sue Ryan; Linda Suarez; Jim Murray; Rob Resnick; Sandra Dinocca; and Drs. Patrick Finn, Sheila Macri, Kuldeep Singh, and Beth Thurberg for their help and support in these studies.
The main study was a non-good laboratory practice (non-GLP) investigative toxicology study to evaluate acute effects of a lymphocyte targeting monoclonal antibody in SD and Long Evans rats. As a surrogate to the human-specific clinical candidate, rat-specific antibody (antibody X [Ab X]) was administered intravenously at 25 mg/kg in 5 male and 5 female rats of each stock. Similar cohorts injected with the vehicle served as study controls. No clinical abnormalities were observed, and rats were euthanized at 24 hr post injection. At necropsy, there were no macroscopic findings. Whole nonperfused brains were collected in 10% neutral buffered formalin, fixed for 48 to 72 hr, and routinely processed. From each rat brain, 5 coronal sections were obtained for histopathologic evaluation. These sections represented olfactory bulb and forebrain (section 1); cortex, hippocampus, and thalamus (section 2); midbrain (section 3); cerebellum, pons, and cranial brain stem (section 4); and caudal brainstem (section 5).
High-magnification photomicrographs of the thalamus regions in H&E-stained brain sections (section 2) representing both sexes, both stocks, and both vehicles and Ab X–treated cohorts were shown to the audience for voting. These images contained neuropil and associated blood vessels. Large round cells with granular basophilic cytoplasm and central nuclei were present either singly (Figure 10A–D) or in very small clusters (Figure 10C) around blood vessels. The audience was polled for their preferred diagnosis of this histologic change. Voting choices and audience responses were perivascular inflammation, minimal (4%); mast cell infiltration (5%); perivascular mast cell infiltration, minimal to mild (45%); mastocytosis (1%); within normal limits (42%); and none of the above (3%). Similar to the most popular audience choice, Dr. Bangari’s original diagnosis was “perivascular mast cell infiltration, minimal.” The second most popular choice, “within normal limits,” was favored by almost as many audience participants. This set the stage for the subsequent presentation and follow-up discussion.
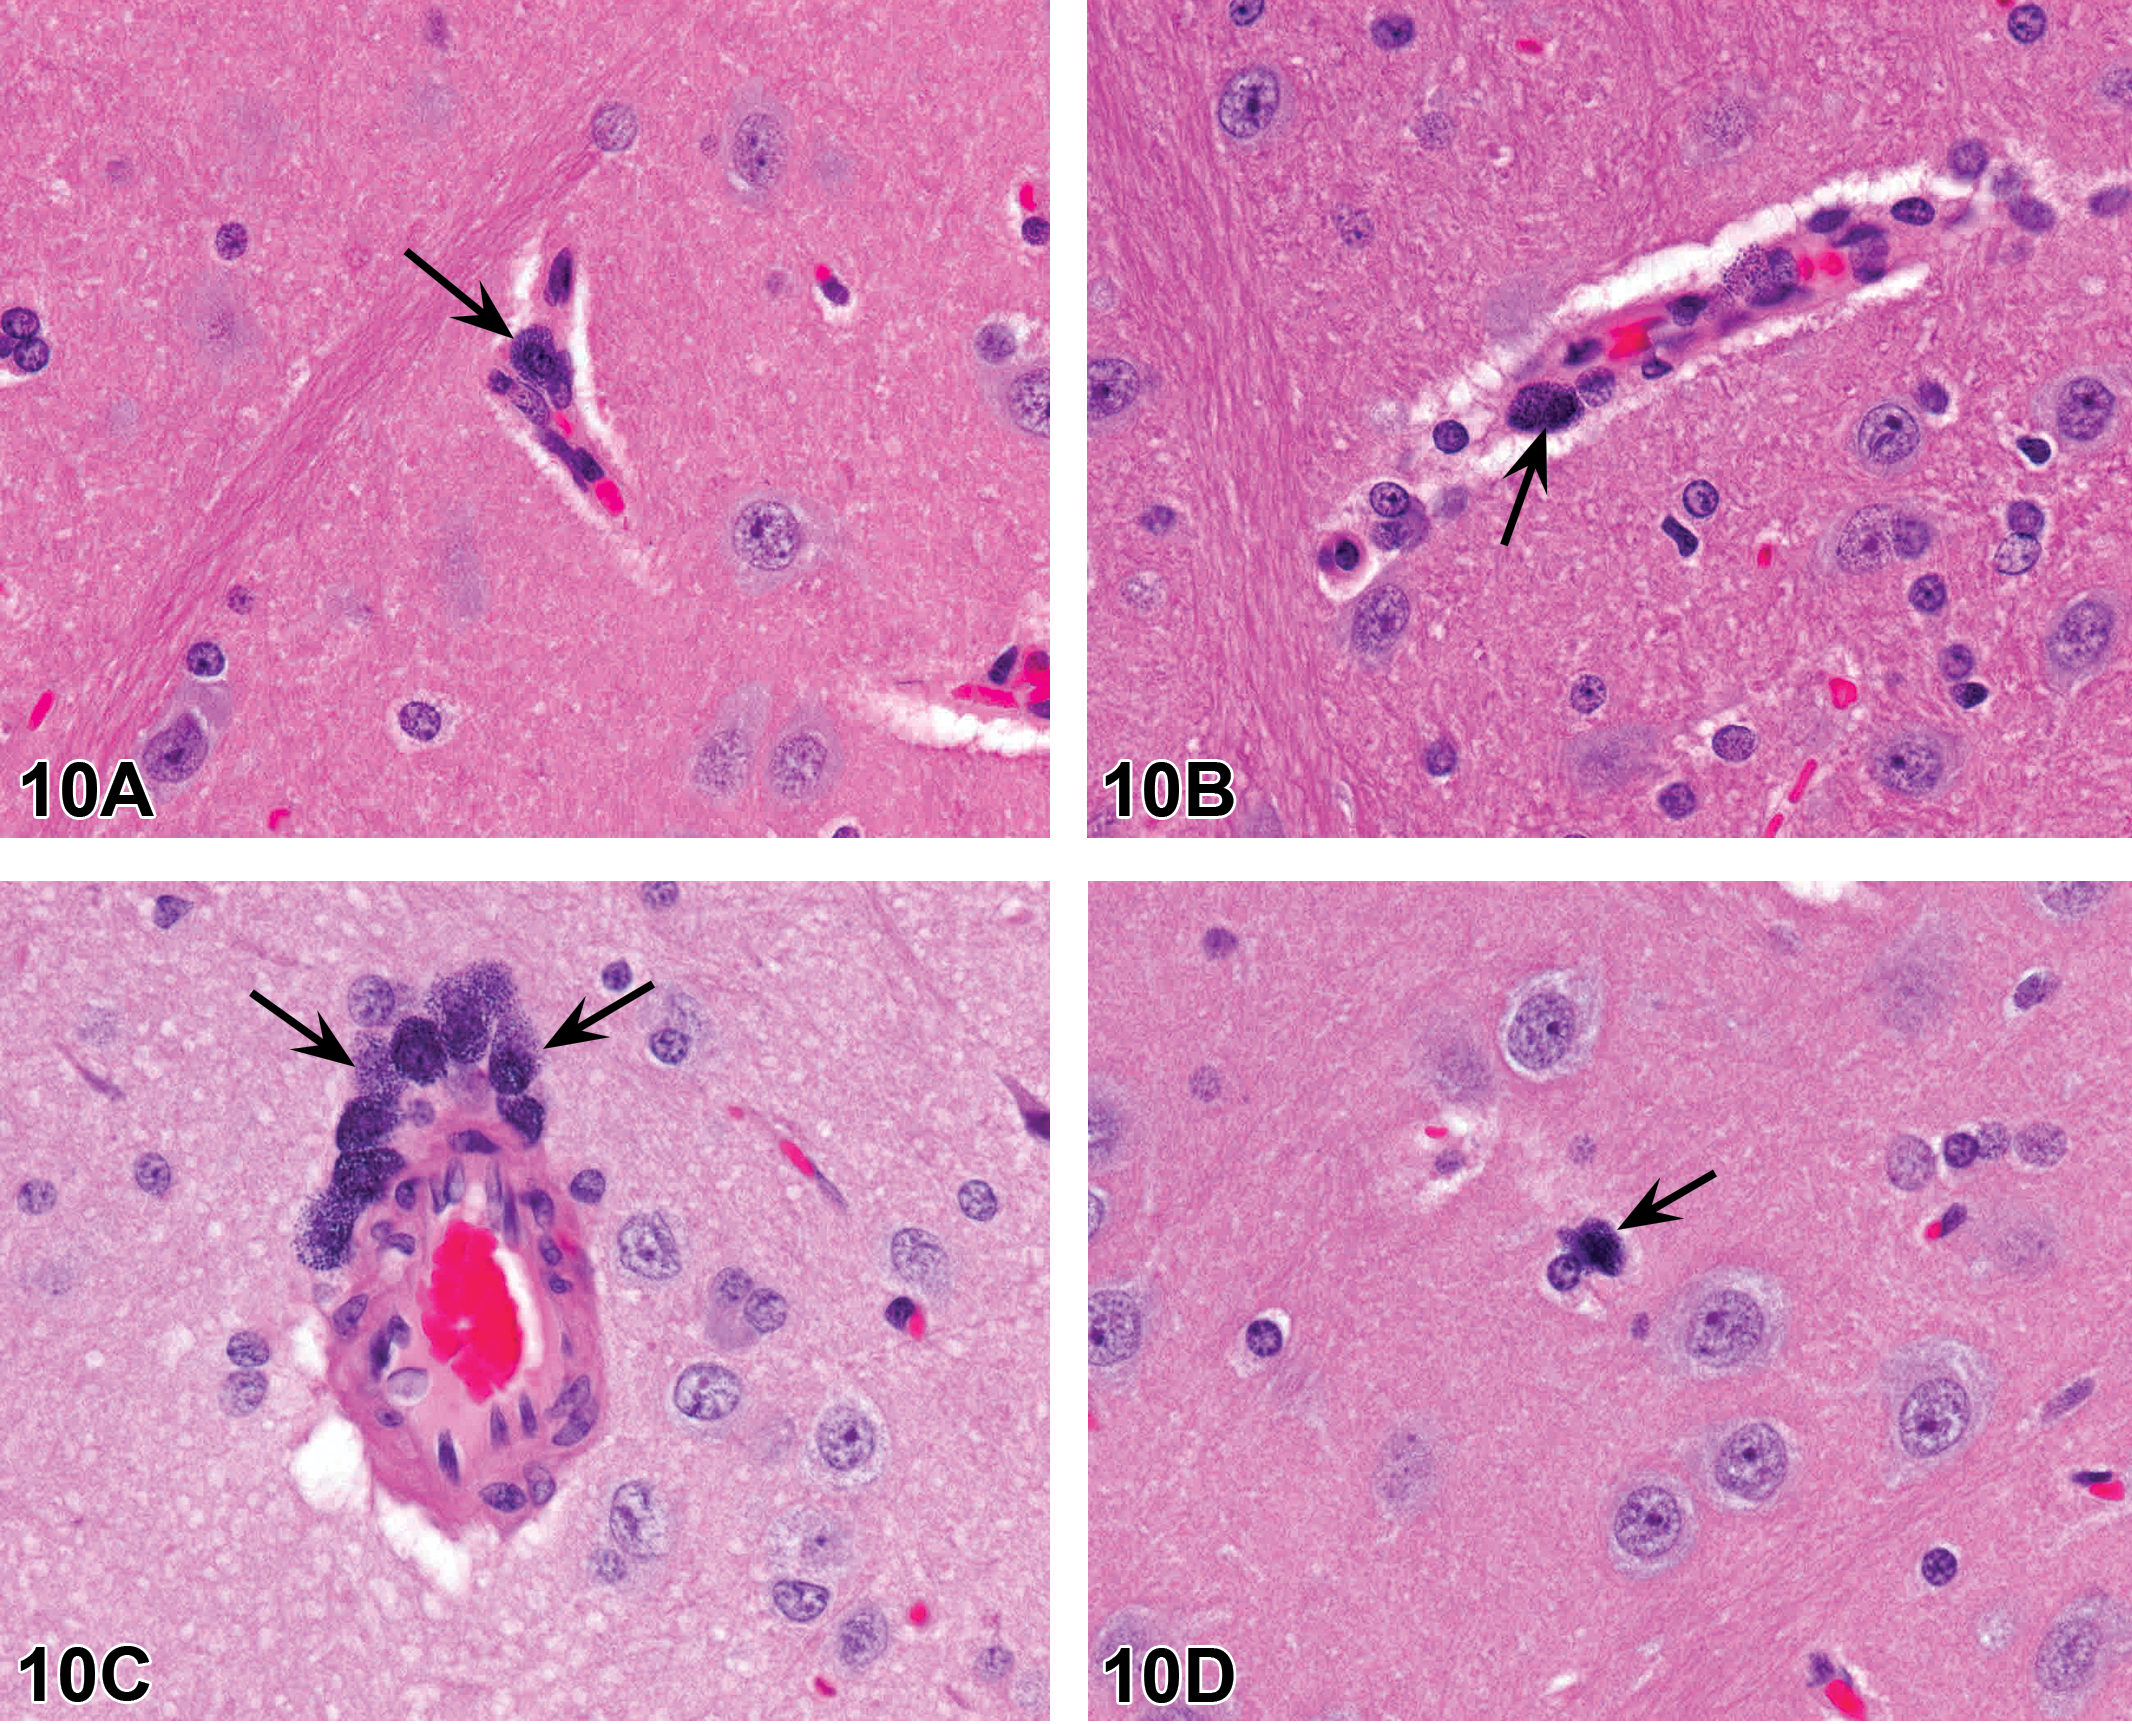
Coronal brain sections of 8- to 10-week-old Sprague Dawley (SD) rats showing the thalamus region. (A) Vehicle-treated male SD rat, (B) antibody-treated male SD rat, (C) vehicle-treated male SD rat, and (D) antibody-treated female SD rat. Note that large mononuclear cells (arrows) with abundant granular cytoplasm present around blood vessels or in the neuroparenchyma. Hematoxylin and eosin (H&E).
Dr. Bangari presented the overall incidence of this finding in the investigative study. Comparable incidence (80–100%) of perivascular mast cell infiltration was observed in all treatment and control groups regardless of genetic background, sex, and test article (Table 9). The finding was interpreted as unrelated to the test article. Comparable incidence in all treatment groups of both rat stocks suggested it was a background finding. Mast cells are generally not observed or reported in histologic sections of rat brains in routine toxicology studies. This was also the opinion of several pathologists who were consulted during the histopathology review as well as those attending the NTP symposium. A majority of the participants in the audience acknowledged that they had not seen mast cells in rodent brains. General references on veterinary histology and microscopic anatomy also do not mention mast cells in rodent brains. However, Dr. Bangari pointed out that there are well-documented papers that describe mast cells in the brain of rodents and other vertebrates (Goldschmidt et al. 1984; Hough 1988; Silver and Curley 2013).
Incidence of Brain Mast Cells in Rats.
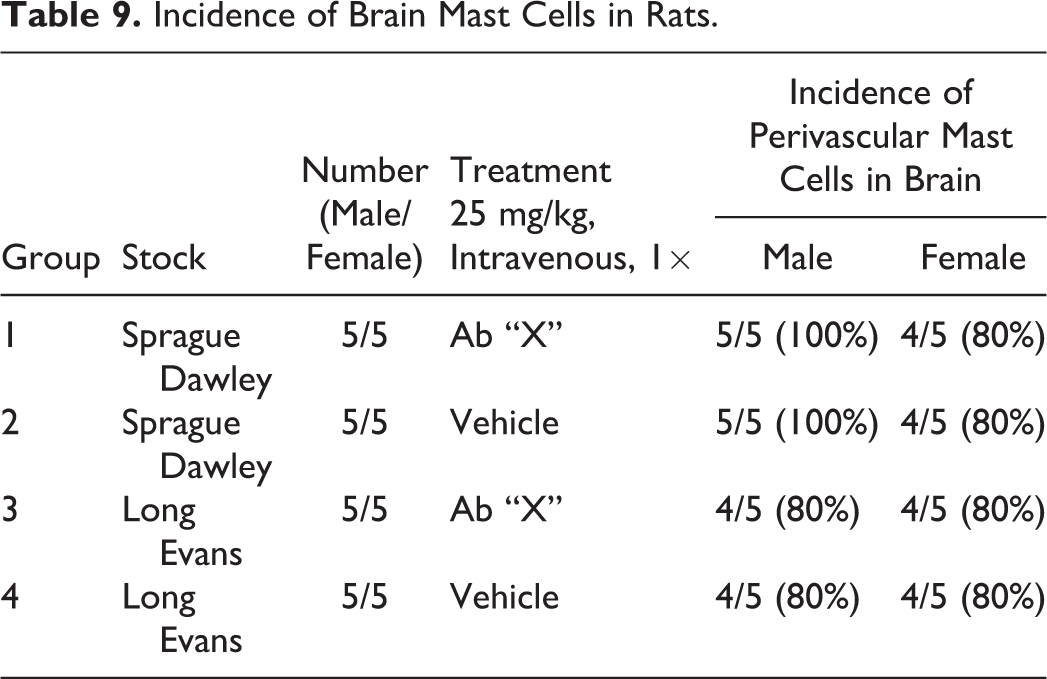
Dr. Bangari then presented the design and results of additional investigations that were undertaken to confirm the presence of mast cells in normal rat brains as reported in the literature. Brain samples from control (vehicle treated or untreated) SD rats from various studies were collected for coronal and sagittal sectioning. Three short investigations included both male (8- to 10-week-old) and female (8- to 10-month-old) SD rats. Similar to the original investigative toxicology study, perivascular mast cells were observed in almost all examined rats in all 3 studies. Perivascular mast cells were observed singly or in small clusters in the medial dorsal, ventral dorsal, and ventral thalamic nuclei of young and old rat brains. Toluidine blue staining revealed characteristic metachromatic granules within perivascular mast cells (Figure 10E, F) in rat brain sections. Thalamic location of these mast cells was also confirmed in sagittal brain sections (Figure 10G). Tryptase IHC was employed as a definitive molecular marker of mast cells. Perivascular mast cells in rat brains showed specific immunoreactivity with anti-tryptase antibodies (Figure 10H). Similar to the investigative study, the incidence of brain mast cells in these investigations was 80% to 100%. Based on reproducible results from multiple investigations, Dr. Bangari concluded that the perivascular mast cells in the thalamus region were a normal feature of the rat brain. He acknowledged that an alternative diagnosis for this case would be “within normal limits,” which was also the second most popular audience vote.
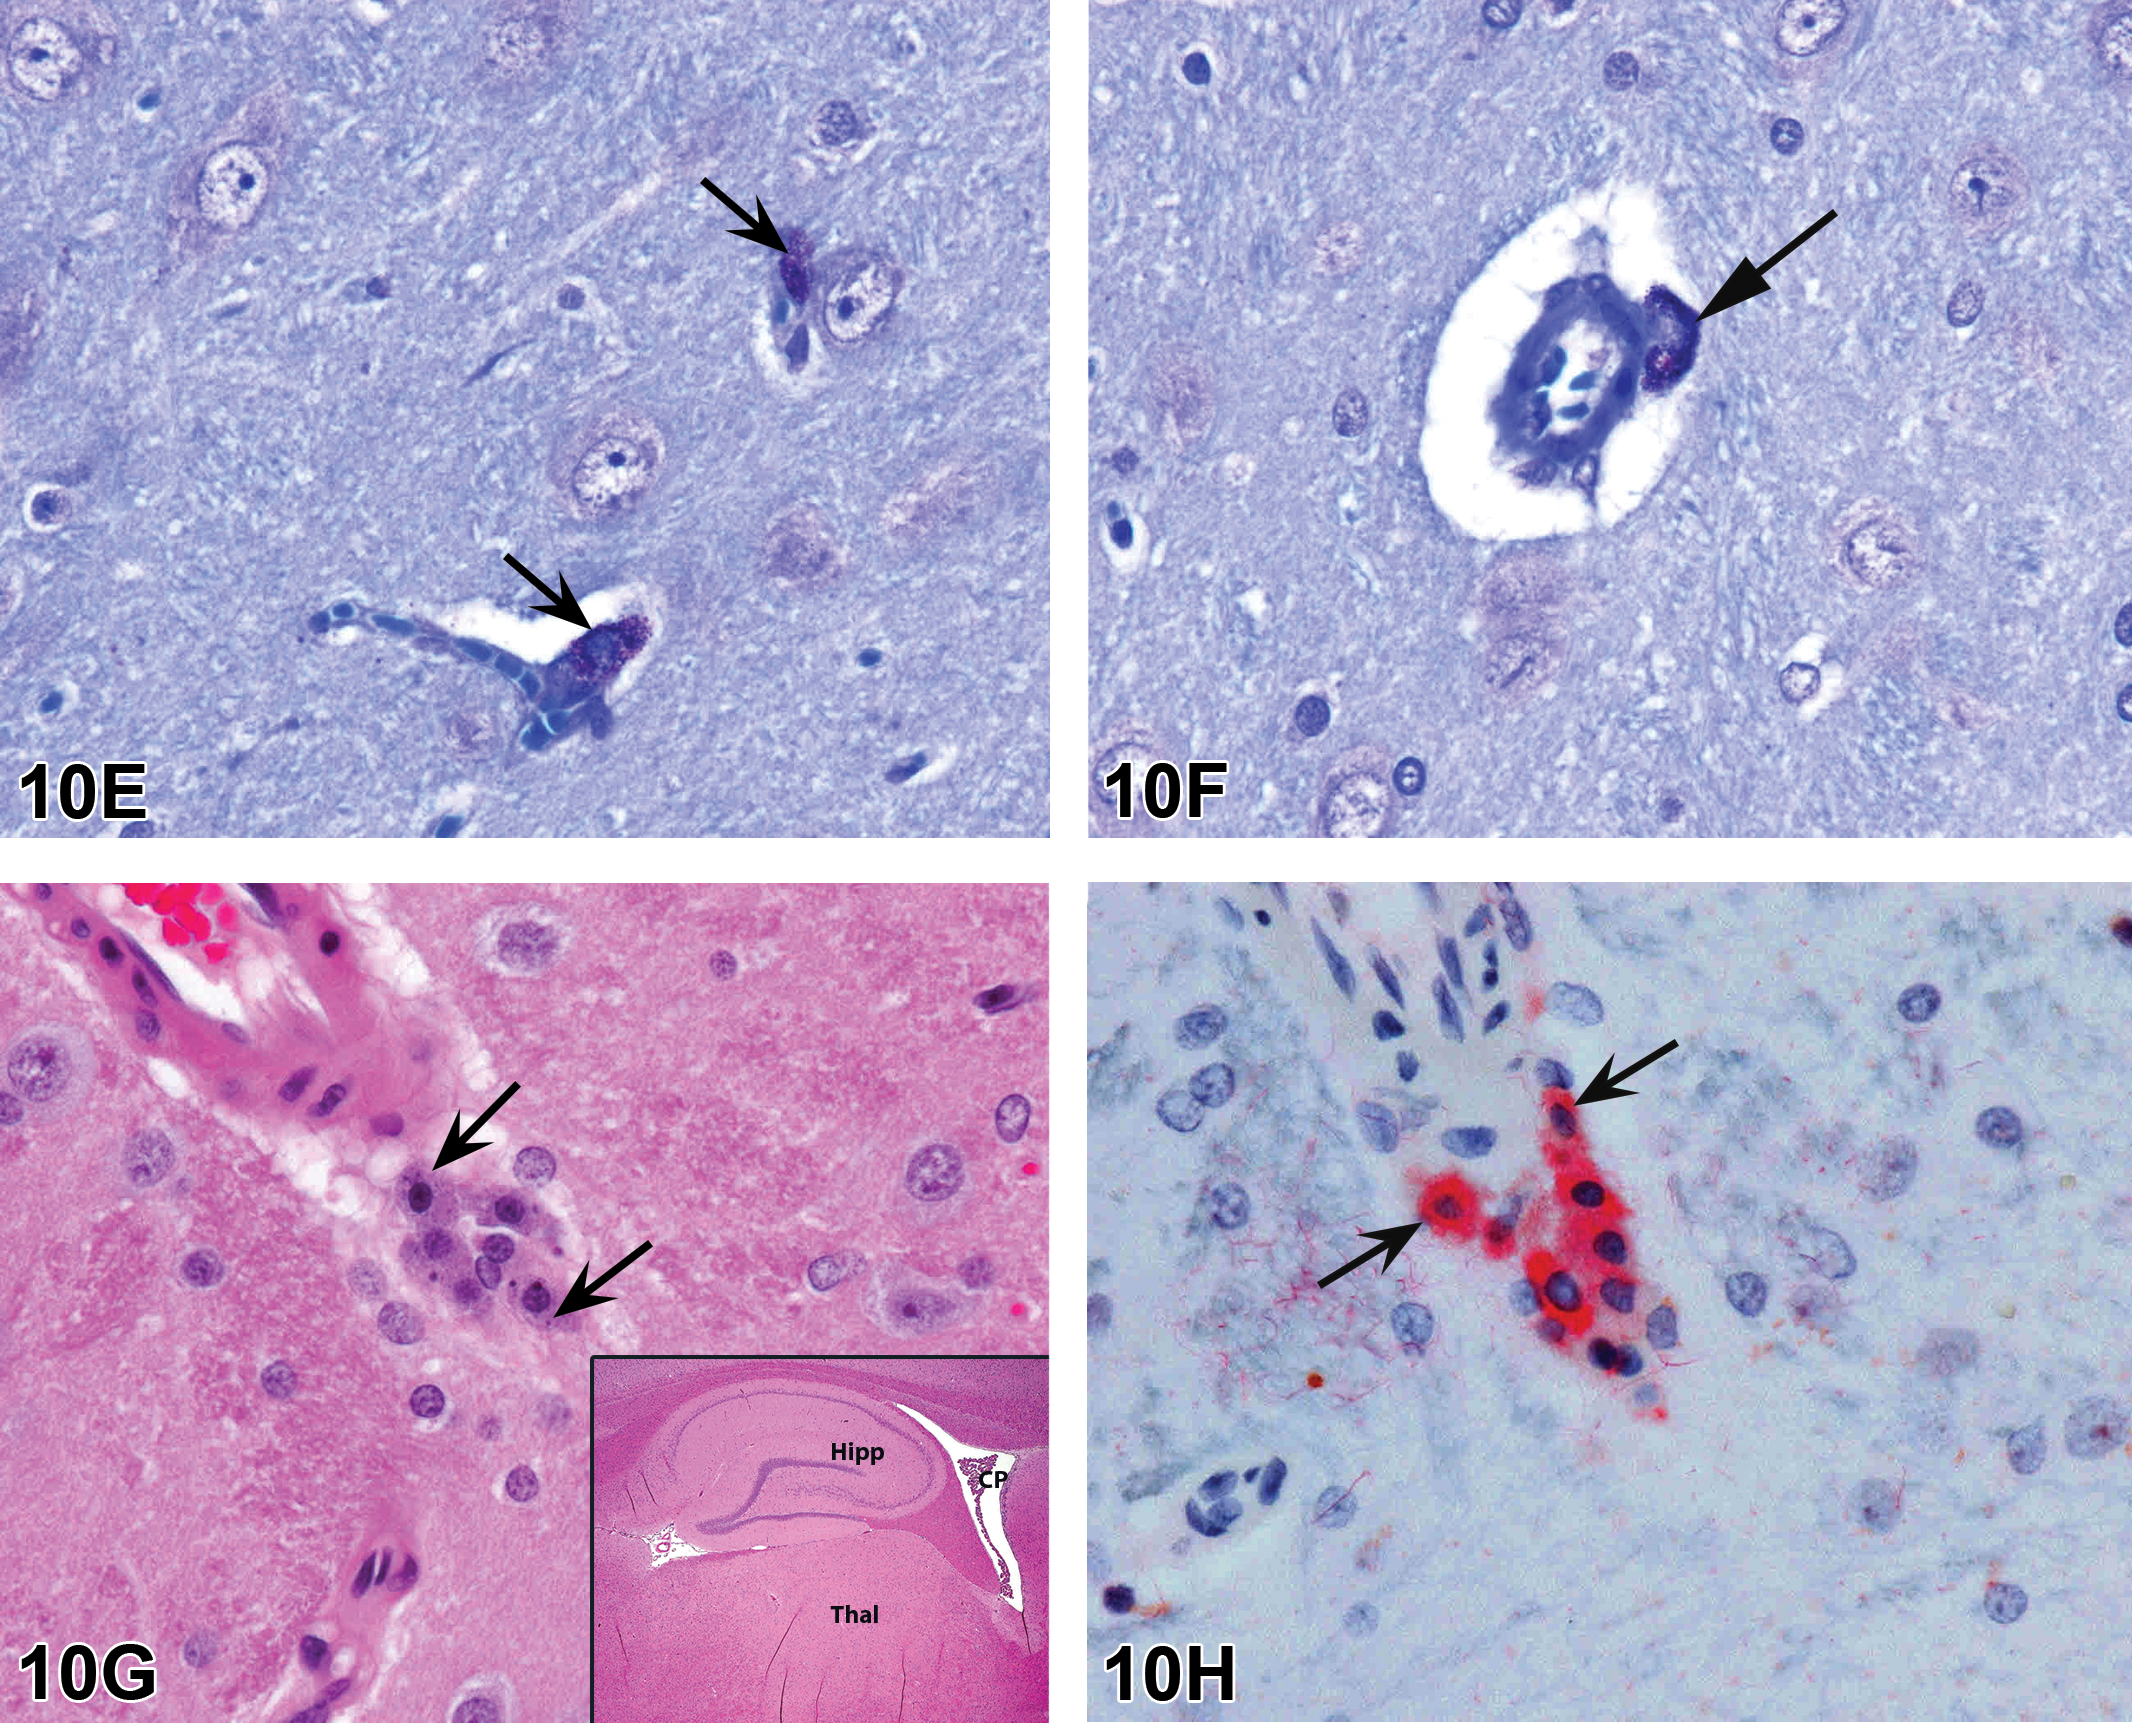
Coronal brain sections of 8- to 10-week-old control rats (E–F) show a few perivascular mast cells (arrows) in the thalamus region and the dark purple metachromatic granules are highlighted with toluidine blue stain. Sagittal brain sections (G–H) of a ∼8- to 9-month-old untreated SD rat. Low magnification view shows the location of the thalamus (Thal), hippocampus (Hipp), and choroid plexus (CP; G inset). The high-magnification H&E (G) shows perivascular mast cells in the thalamus region (arrows). Tryptase immunohistochemistry (IHC) with fast red chromogen and hematoxylin counterstain on a serial section (H) reveals immunopositive perivascular mast cells (arrows) in the same region as in G.
Dr. Bangari mentioned that brain mast cells have also been reported in a number of other animal species including amphibians, ring neck doves, and humans (Silver and Curley 2013). When the audience was asked if they had seen mast cells in brains from other animal species, one audience member shared that he noted mast cells (also known as “eosinophilic granule cells”) in the ventral aspect of fish brain and within connective tissue in non-central nervous system organs. In rat brain, the highest numbers of mast cells are present in the thalamus region where these are restricted within a narrow bregma range (Hough 1988). In mouse brain, mast cells migrate in multiple brain regions during early postnatal development (Nautiyal et al. 2012). Various brain regions are populated, and the numbers stabilize in mature animals. In humans, brain mast cell numbers tend to increase up to late teens and then decline with advancing age (Turygin, Babik, and Boyakov 2005).
Subsequent discussion included a quick review of the biology of mast cells and diverse roles these unique cells play in normal and disease states. Mast cells are capable of prompt response to diverse stimuli by releasing preformed chemical mediators, synthesizing new mediators, and elaborating cytokine and growth factors to trigger synthetic activities in other cells types. Mast cells can produce over 50 different types of chemical mediators (Marshall 2004). In addition to their classic role in IgE-mediated type I hypersensitivity (anaphylaxis mediated via histamine release), mast cells are capable of affecting diverse homeostatic and pathophysiological processes by virtue of their large repertoire of stored granular contents (histamine, heparin, serotonin, etc.) and their ability to rapidly synthesize lipid mediators, cytokines, growth factors, neuropeptides, and so on. The definitive functional role of brain mast cells is not well understood. Earlier theories considered rodent brain mast cells as mere “evolutionary artifacts” (Hough 1988). Mast cells populate the meninges of the diencephalon of lower vertebrates such as amphibians and reptiles and subsequently migrate into thalamic parenchyma. It was surmised that these mast cells in primitive brains have persisted in rodent brains for no apparent function, arguing that mast cells did not exist in normal human brains. This theory has fallen out of favor since confirmation of mast cells in human brains (Hough 1988). A role in hypersensitivity or anaphylaxis in response to external material is unlikely, given their location within the brain side of the “blood-brain barrier.” A role for brain mast cells in the innate immune response may be considered. Similarly, a response to blood-borne factors (chemicals/drugs—endogenous or exogenous) may be considered for these perivascular mast cells. Experimental data in mice suggest that these cells are preferentially located at the branch points of cerebral blood vessels (Khalil et al. 2007). It is possible that the brain mast cells are involved in cerebrovascular homeostasis. The unique locations of mast cells within rat brain (thalamus) may provide a clue to their functional role. Dorsal medial, dorsal ventral, and ventral nuclei of the thalamus are involved in sensory processing and modulating emotional behavior. Brain mast cell numbers have been demonstrated to fluctuate with the change in environmental factors such as photoperiod, stress of single housing versus group housing, exogenous hormone administration, and disease states (Silver et al. 1996).
A question from the audience was about the differences in the granules of mast cells depending on the species and anatomical sites. In response, Dr. Bangari indicated that mast cells exhibit phenotypic heterogeneity depending on anatomic location (e.g., connective tissue mast cells vs. mucosal mast cells differ in their metachromasia) and possess tremendous plasticity regarding their granular content and size. These cells can degranulate rapidly when stimulated but then quickly replenish their granular content. Although the brain mast cells in most rats in these investigations demonstrated toluidine blue metachromasia, similar to that see in connective tissue mast cells (Goldschmidt et al. 1984), their morphologic appearance can vary significantly in response to internal and external triggers (Silver et al. 1996).
The main purpose of this presentation was to raise awareness among pathologists of the presence of resident mast cells in rat brain. The fact that the majority of practicing pathologists had not seen or reported these cells in rat brains in routine studies and the lack of concrete information in standard histology references or in veterinary pathology literature prompted these investigations. The rather unusual study design of the investigative toxicology study presented in this report provided a fortuitous opportunity to examine mast cells in rat brain. It is likely that these cells are not captured in routine histology sections owing to their rather limited distribution within select brain regions. It is hoped that practicing pathologists will now look for these cells in brain sections, especially when evaluating thalamic nuclei. An awareness of the presence of brain mast cells will potentially ignite our curiosity toward understanding their functional role in physiology and disease. Furthermore, with an open mind on these brain mast cells, the toxicologic pathology community will now begin to ponder their role in the pharmacology, toxicokinetics, and safety assessment of brain-penetrant test articles.
Bones Are No Mystery: Understanding the INHAND Skeletal Nomenclature and Its Application
Dr. Stacey Fossey (AbbVie, Inc., Worcester, MA) presented on behalf of the INHAND Musculoskeletal Committee. Special thanks to the INHAND musculoskeletal manuscript coauthors: Drs. John Vahle, Philip Long, Scott Schelling, Heinrich Ernst, Rogely Waite Boyce, Jacquelin Jolette, Brad Bolon, Alison Bendele, Matthias Rinke, Laura Healy, Wanda High, Daniel Robert Roth, Michael Boyle, and Joel Leininger. The author would like to thank Drs. John Vahle and Rogely Waite Boyce for their review of the presentation.
Dr. Fossey’s topic was review of the INHAND bone nomenclature and recommended application of the terminology in routine nonclinical toxicity studies. She presented 2 cases where the audience was given the opportunity to vote for the recommended diagnostic nomenclature for bone findings in rodents based on the INHAND terminology.
INHAND is a joint initiative of the societies of toxicologic pathology from North America, Europe, Great Britain, and Japan. It was noted that this presentation was the result of tremendous work from the INHAND Musculoskeletal Committee that culminated in a publication last year in the Journal of Toxicologic Pathology (Fossey et al. 2016). Although the publication also addressed terminology for joint and tooth, these along with detailed diagnostic criteria would not be covered in this presentation. Also, terms for systemic lesions (nonproliferative and proliferative) that occur in many tissues (i.e., not skeletal specific) were not covered in this document.
The INHAND nomenclature provides a standardized system for addressing lesions in the skeletal system of rats and mice. Some preferred terms are descriptive rather than diagnostic. Examples of recommended terms with previously used terms were provided (Table 10). Although the terminology was released for review and comment on goRENI (http://www.goreni.org) prior to publication, ongoing change control is part of the INHAND system and the committee will consider feedback for updating the nomenclature on an ongoing basis. Use of the recommended terminology does not limit interpretation of the histopathologic findings in the context of the entire data set. The study pathologist may include other data (e.g., serum biomarkers, imaging data) to provide context in the pathology report.
Comparison of Recommended INHAND Terms and Previously Used Terms.
Note: INHAND = International Harmonization of Nomenclature and Diagnostic Criteria.
To begin the review of bone and cartilage diagnostic terminology, images of a variety of nonproliferative bone findings in rodents were considered along with the corresponding INHAND terminology. Nomenclature examples reviewed from the INHAND musculoskeletal manuscript included fibro-osseous lesion, fibrous osteodystrophy, increased osteoid, decreased bone, fracture, cyst, necrosis, and increased osteoclasts. The INHAND manuscript focuses largely on diagnoses made from standard H&E sections of decalcified tissue such as that from routine nonclinical toxicity studies. Histochemical or immunohistochemical techniques may be applied as diagnostic aids as in the case of increased osteoid.
Nomenclature addressing growth plate findings was also discussed. “Growth plate closed” is one of these terms; however, it is not recommended that it be recorded as a background finding in routine toxicity studies. Increased thickness of the physis is currently the preferred term for thickened growth plate; however, there has been discussion as to whether physeal dysplasia should be a stand-alone diagnosis, given the disorganization of chondrocytes that occurs in many cases in addition to altered physeal thickness.
Proliferative bone findings were reviewed with corresponding nomenclature. Osteoblast hyperplasia, osteoblastoma, osteoma, osteofibroma, osteosarcoma, and osteochondroma were proliferative bone lesions that were discussed. Chondrocyte hyperplasia, chondroma, and chondrosarcoma were presented as proliferative cartilage diagnoses with brief descriptions and images. Finally, an image of a chordoma was shown. Images and additional information on all of these terms are available in Fossey et al. (2016).
For the case study reviews, 2 cases of bone findings in rats were presented with choices of diagnostic terminology for audience voting. In case 1 (Figure 11A, B), images of bone from adult SD rats administered either vehicle or an antisclerostin antibody for an unknown length of time were displayed. Sclerostin is a protein produced by the osteocyte that has anti-anabolic effects on bone formation. The finding in the treated animal was characterized by nonneoplastic augmentation of bone mass through sclerostin inhibition. There was increased thickness of trabeculae and cortex with decreased marrow cavity volume. The audience opinion was largely that the finding was increased bone, trabeculae, and cortex (91%) with trabecular hypertrophy, osteosclerosis, osteopetrosis, hyperostosis, and “other” each receiving ≤3% of the votes. The most popular choice, increased bone, was also considered the preferred terminology according to the INHAND manuscript (Fossey et al. 2016).
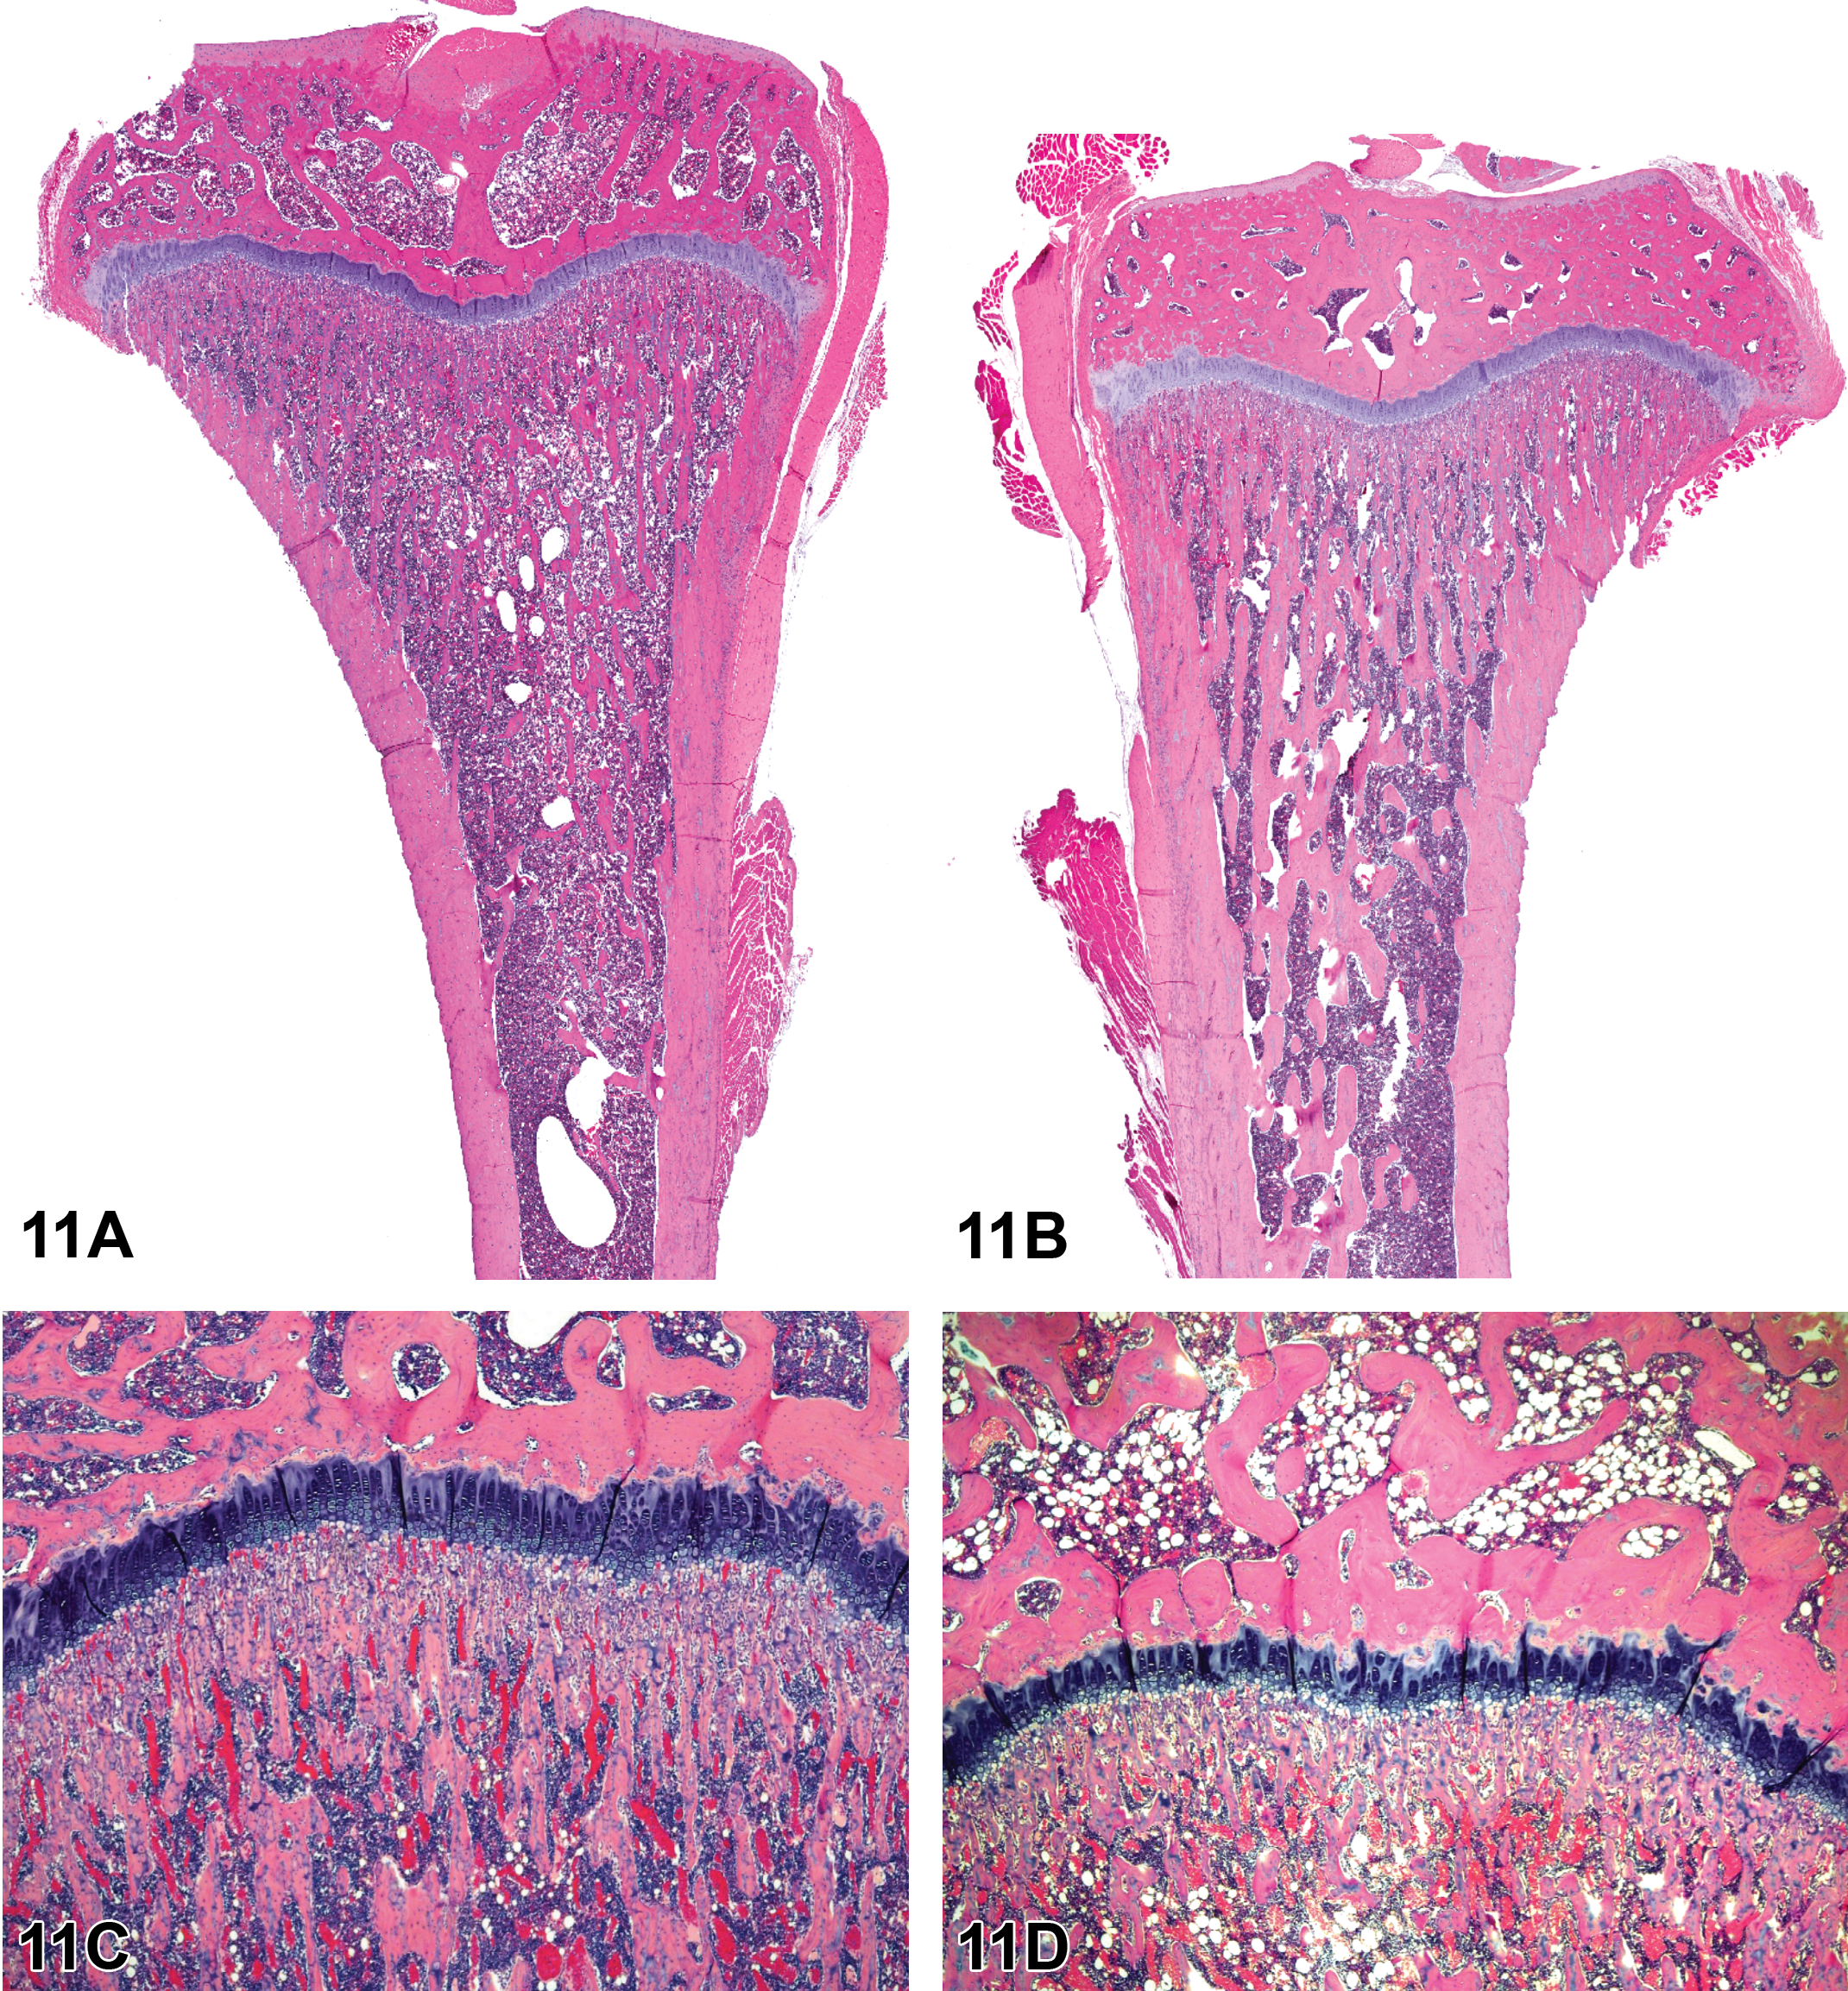
Increased bone, trabeculae, and cortex in the tibia from an adult rat that had been given an antisclerostin antibody presented in case 1 (A, B). Figure A shows decalcified tibia of an age-matched control rat of the same sex. Figure B shows a section of the tibia from a treated rat with increased bone that is characterized by expanded thickness of metaphyseal trabeculae and cortex compared to the untreated rat. Decreased physeal thickness in the femur of an adult rat with severe food restriction presented in case 2 (C, D). Figure C shows a stained section of decalcified bone in an age-matched control rat of the same sex. Figure D shows the physis of a rat with severe food restriction at the same magnification. The growth plate of the rat with food restriction is slightly narrowed compared to that of the control. This change was confirmed with quantitative methods. Hematoxylin and eosin. Reproduced with permission of the Japanese Society of Toxicologic Pathology from Fossey et al. (2016).
Sclerostin is a protein produced by osteocytes that decreases bone formation by osteoblasts through inhibition of the Wnt pathway. Increased bone has been reported in rats with antisclerostin antibody administration in a 6-month chronic toxicity study and in a lifetime pharmacology study (Chouinard et al. 2016). In summary, the recommended diagnostic terminology was increased bone rather than hyperostosis or osteopetrosis. These terms confer different meaning to physicians. Hyperostosis refers to a condition where there is calcification of ligaments, tendons, and joint capsules, especially those associated with the spine (Mazieres 2013). Osteopetrosis refers to a condition where bones harden and are more dense than normal but actually are more prone to fracture (Stark and Savarirayan 2009).
Case 2 was bone from an adult SD rat with prolonged reduced food consumption. Images of bone from the femur from an age-matched rat of the same sex without food restriction were shown along with physis from the affected rat (Figure 11C, D). The finding was characterized by slight narrowing of the physis compared to the control rat. The finding was confirmed by quantitative histomorphometry. The audience opinion was largely that the finding was decreased thickness, physis (90%). Other options included within normal limits, growth plate closed, physeal atrophy, physeal dystrophy, and “other” with each receiving ≤4% of the votes. The most popular choice, decreased physeal thickness, was considered the preferred terminology according to the INHAND manuscript (Fossey et al. 2016).
Prolonged decreased food consumption can lead to perturbation of endochondral ossification and cartilage proliferation through alterations in signaling pathways (e.g., growth hormone, fibroblast growth factor 21, and insulin-like growth factor 1; Kubicky et al. 2012). The resulting decrease in physeal thickness is most often observed in the femur and tibia which are routinely examined in nonclinical rodent toxicity studies; however, it may be observed in other bones. The finding is generally a uniform change across the physis. Typically, this is a subtle finding and can be challenging with routine microscopic examination. Therefore, quantitative methods can be employed to confirm the diagnosis.
Dr. Fossey’s take-home message was that descriptive nomenclature is recommended for histopathologic diagnoses in nonclinical toxicity studies. INHAND nomenclature for bone, joint, and tooth has been published (Fossey et al. 2016), and this terminology can also be found on the STP website (www.toxpath.org) and goRENI website (www.goreni.org).
Footnotes
Author Contribution
Authors contributed to conception or design (SE); data acquisition, analysis, or interpretation (SE, FA, DB, TC, SF, SG, WH, JH, KJ, RK, GP, LW, EQ); drafting the manuscript (SE, FA, DB, TC, SF, SG, WH, JH, KJ, RK, GP, LW, EQ); and critically revising the manuscript (SE, EQ). All authors gave final approval and agreed to be accountable for all aspects of work in ensuring that questions relating to the accuracy or integrity of any part of the work are appropriately investigated and resolved.
Declaration of Conflicting Interests
The author(s) declared no potential conflicts of interest with respect to the research, authorship, and/or publication of this article.
Funding
The author(s) received no financial support for the research, authorship, and/or publication of this article.