
Abstract
The 2016 annual National Toxicology Program Satellite Symposium, entitled “Pathology Potpourri” was held in San Diego, CA, at the Society of Toxicologic Pathology’s (STP) 35th annual meeting. The goal of this symposium was to present and discuss challenging diagnostic pathology and/or nomenclature issues. This article presents summaries of the speakers’ talks, along with select images that were used by the audience for voting and discussion. Some lesions and topics covered during the symposium included malignant glioma and histiocytic sarcoma in the rodent brain; a new statistical method designed for histopathology data evaluation; uterine stromal/glandular polyp in a rat; malignant plasma cell tumor in a mouse brain; Schwann cell proliferative lesions in rat hearts; axillary schwannoma in a cat; necrosis and granulomatous inflammation in a rat brain; adenoma/carcinoma in a rat adrenal gland; hepatocyte maturation defect and liver/spleen hematopoietic defects in an embryonic mouse; distinguishing malignant glioma, malignant mixed glioma, and malignant oligodendroglioma in the rat; comparison of mammary gland whole mounts and histopathology from mice; and discussion of the International Harmonization of Nomenclature and Diagnostic Criteria collaborations.
Keywords
The National Toxicology Program (NTP) Satellite Symposium is a 1-day meeting that has traditionally been held in conjunction with the annual Society of Toxicologic Pathology (STP) meeting (Adams et al. 2011; Bach et al. 2010; Boorman et al. 2012; Elmore et al. 2013, 2014, 2015, 2016). The objective of this annual symposium is to provide continuing education on interpreting histopathology slides. This includes the presentation and discussion of diagnostically difficult, interesting, or rare lesions, or challenging nomenclature issues. The session is interactive in that each speaker presents images for audience voting via wireless keypads. Once the votes are tallied, the results are displayed for all to view. The speaker generally provides a preferred diagnosis and some additional background information, after which lively and constructive discussion ensues.
The theme of the 2016 Symposium was “Pathology Potpourri,” which allowed for a variety of topics to be presented. The format for this year’s symposium included a mixture of laboratory and domestic animal cases featuring various species that included rat, mouse, and cat. Tissues included brain, uterus, heart, axillary skin, adrenal gland, and mammary gland. A novel way to compare mammary gland whole mounts to histopathology was also presented, as well as a recent statistical method to evaluate histopathology data. Finally, a presentation was given on the International Harmonization of Nomenclature and Diagnostic Criteria (INHAND) collaborations with the Federal Food and Drug Administration (FDA) and the Standard for the Exchange of Nonclinical Data (SEND). This article provides synopses of all presentations including the diagnostic or nomenclature issues, a selection of images presented for voting and discussion, voting choices, voting results, and major discussion points.
Usin’ Your Noggin’
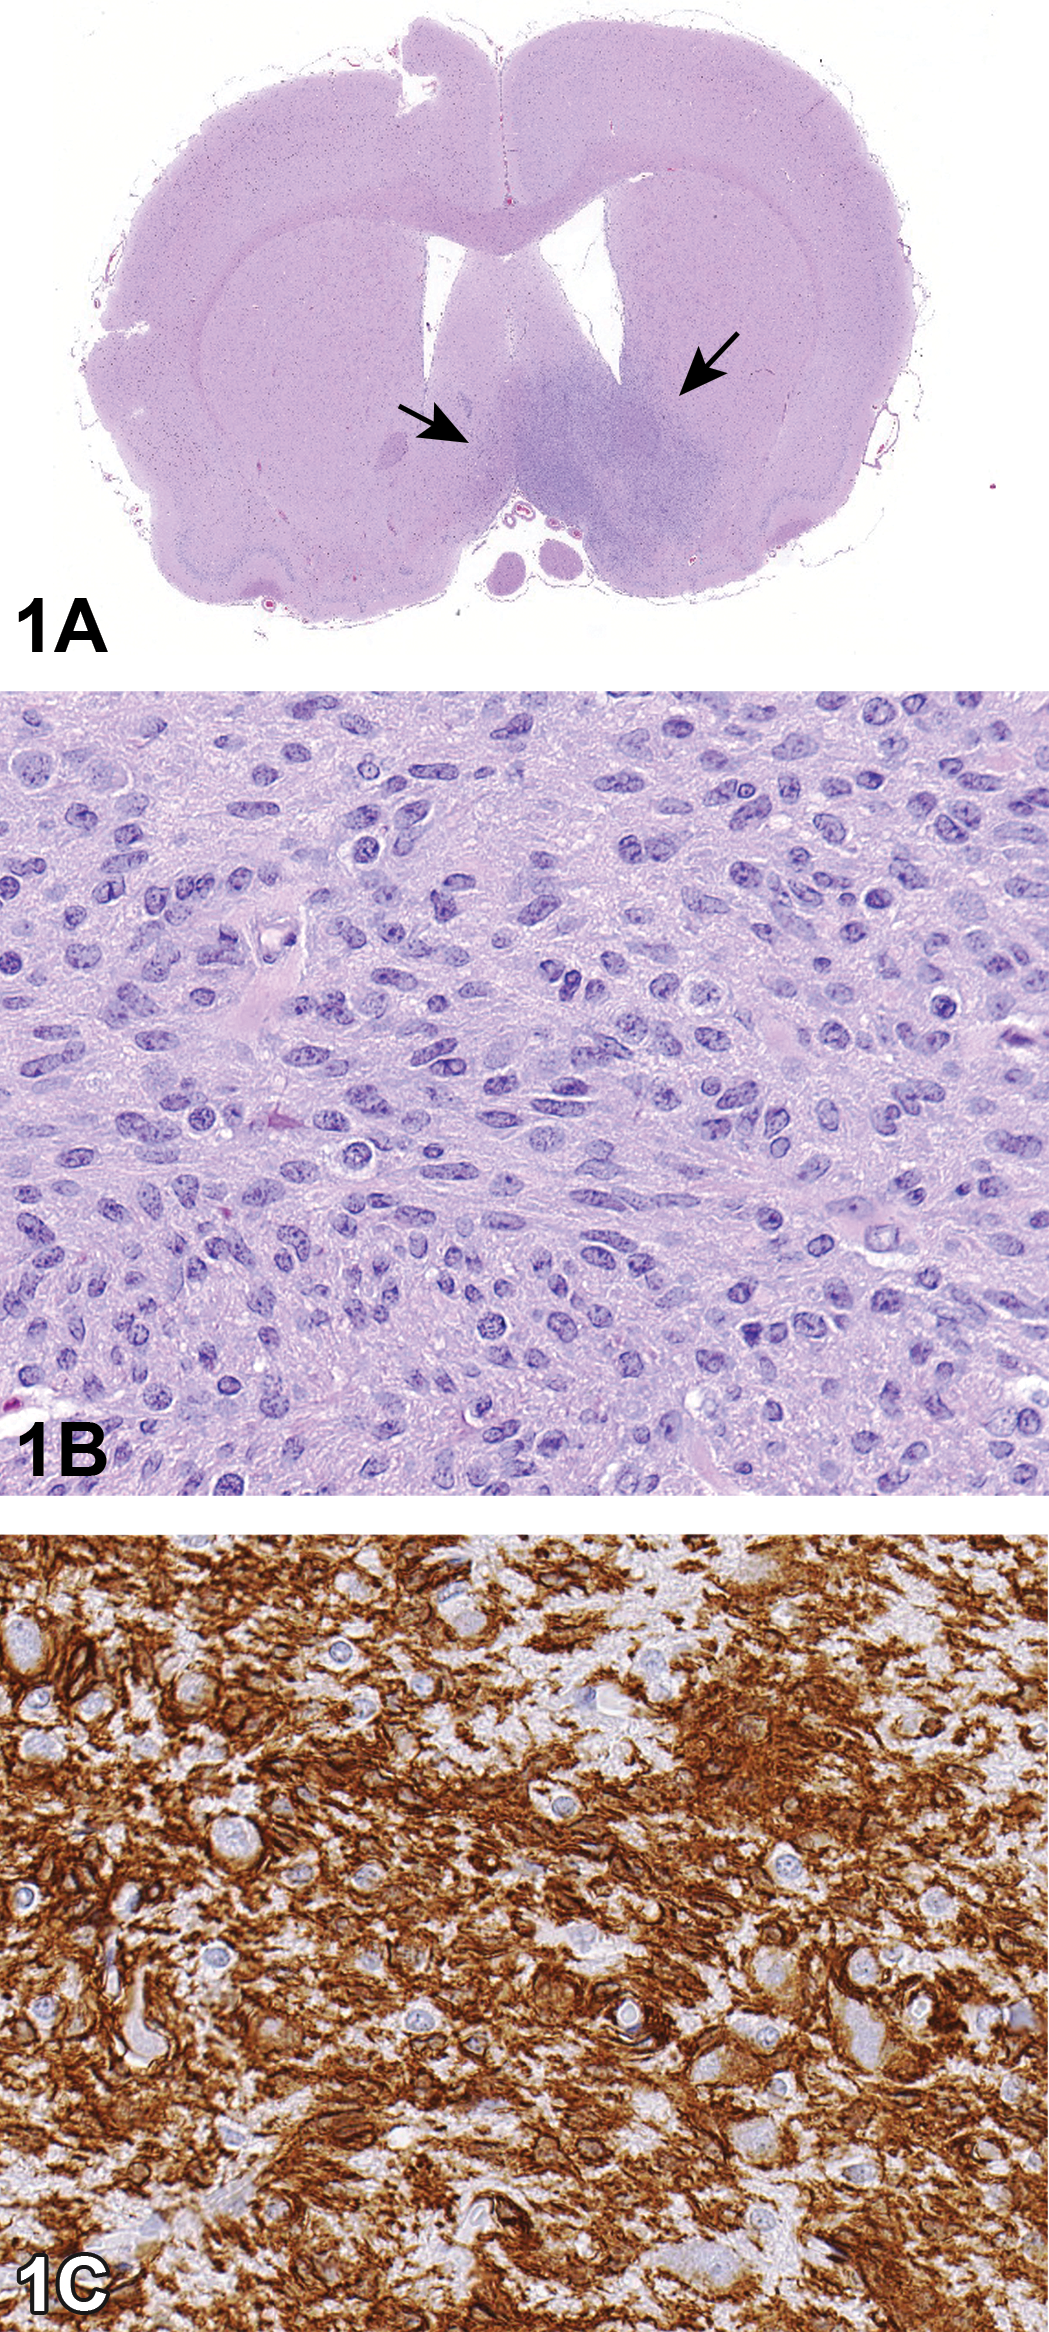
Dr. David E. Malarkey of the National Institute of Environmental Health Sciences (NIEHS) and NTP, Research Triangle Park (RTP), NC, got the ball rolling for a common theme of this symposium: brain tumors! Brain tumors in the rodent are rare (<0.1%), and there are only a few rodent brain carcinogens in the NTP database. Diagnostic criteria for glial tumors have primarily been based on hematoxylin and eosin (H&E) histomorphology (Table 1). He presented 2 cases, 1 from a 2-year-old Harlan Sprague-Dawley (Hsd: SD) male control rat without clinical signs (case 1) and the other was from a treated male B6C3F1 mouse with lethargy (case 2). The 2 neoplasms exhibited some similar morphological and immunohistochemical features.
Terminology for Glial Cell Tumors in the Rodent.
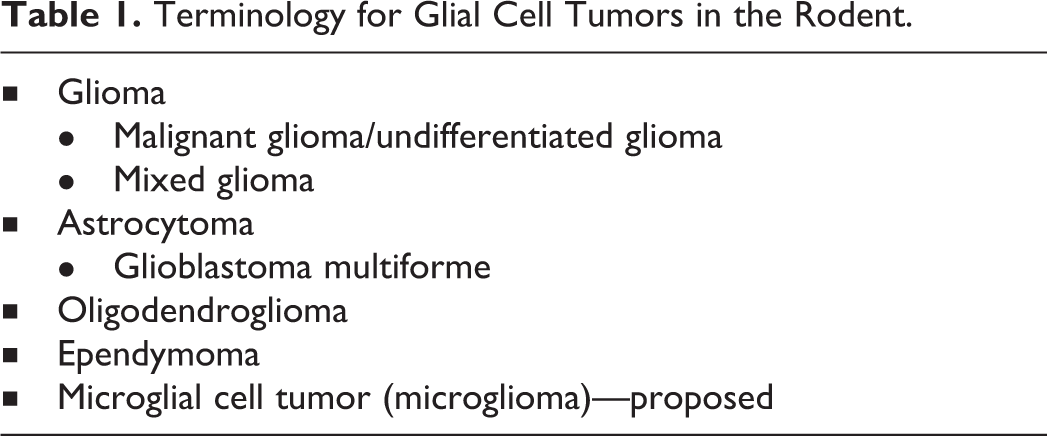
In case 1 (Figure 1A–C), the neoplasm appeared to arise unilaterally from, and locally infiltrate, the cerebral neuropil near the region of the optic chiasm with minimal distortion of the parenchyma. The cells were closely packed and fusiform with euchromatic oval nuclei and indistinct nucleoli with occasional mitotic figures (3 per 10 high-power field). The audience opinions were markedly varied among astrocytoma with or without macrophage differentiation (38.4%); glioma, malignant glioma, or mixed glioma (37.7%); microglial cell tumor/microglioma (13.8%); oligodendroglioma (2.2%); meningioma (1.4%); and 10.9% needed more information to make any conclusions.
Brain tumor from a 2-year-old Harlan Sprague-Dawley male control rat presented in case 1. (A) shows a low-magnification H&E of the brain tumor that appears to arise unilaterally from and locally infiltrate the cerebral neuropil near the region of the optic chiasm with minimal distortion of the parenchyma (arrows). A higher-magnification H&E of the neoplasm (B) shows that the cells are closely packed and fusiform with oval euchromatic nuclei and indistinct nucleoli. High magnification of the brain neoplasm with strongly positive cytoplasmic ionized calcium binding adaptor molecule 1 (Iba1) immunohistochemical expression (C). Iba1 is a microglia/macrophage-specific calcium binding protein.
Immunohistochemistry (IHC) results revealed that the neoplasm was strongly positive for ionized calcium-binding adaptor molecule (Iba1) and negative for glial fibrillary acidic protein (GFAP), oligodendrocyte lineage transcription factor 2 (Olig2), glutamine synthetase (GS), and nestin (Table 2). IHC for Iba1, a marker for macrophage cells in the rat, demonstrates that the neoplasm is of histiocyte, macrophage, or microglial cell origin or differentiation. This additional information swayed the majority (72%) of the audience to diagnose this neoplasm as a microglial cell tumor (microglioma in a following vote), while 13% continued to call it an astrocytoma (with or without macrophage differentiation) and 9% called it a malignant glioma (which is currently the preferred term used by NTP for all glial cell neoplasms except ependymoma and oligodendroglioma). The remaining choices of glioma, mixed glioma, oligodendroglioma, meningioma, and “need more information” each received less than 2% of the vote.
Results of Immunohistochemistry of Case 1.
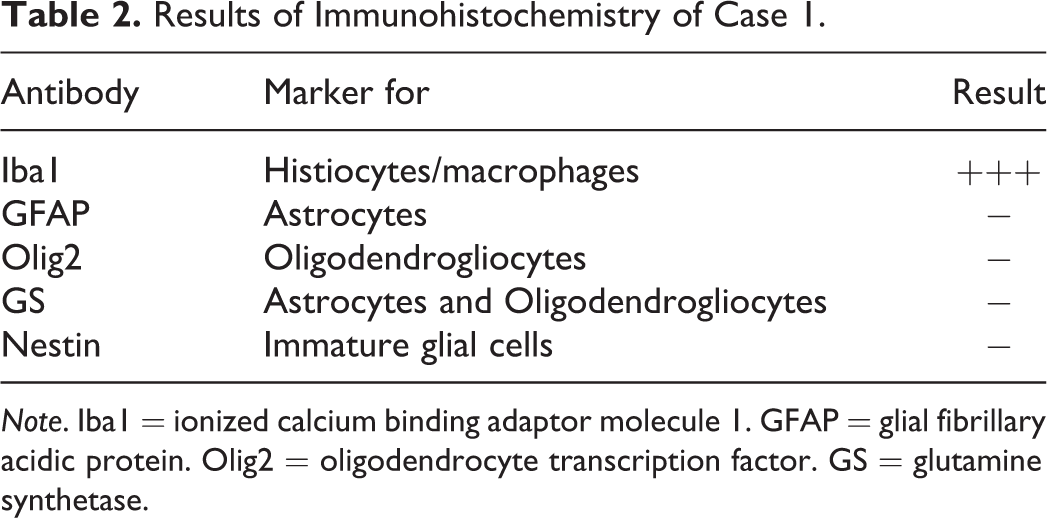
Note. Iba1 = ionized calcium binding adaptor molecule 1. GFAP = glial fibrillary acidic protein. Olig2 = oligodendrocyte transcription factor. GS = glutamine synthetase.
This case exemplifies the dilemma pathologists face in rendering an accurate diagnosis and determining the cell of origin or differentiation of rodent brain and spinal cord neoplasms. Immunohistochemical studies are leading to more in-depth characterization of central nervous system (CNS) tumors in the rodent. In most cases of brain tumors to date in the NTP database, the classification has been almost entirely based upon H&E morphology, rarely with immunohistochemical verification. The diagnoses include astrocytoma, oligodendroglioma, glioma, malignant glioma, mixed glioma, and recently, microglioma (microglial cell tumor). The results in case 1 indicate that the differentiation of brain neoplasms cannot always be predicted by H&E histomorphology and that many tumors that look like astrocytomas are negative for GFAP by IHC, yet positive for markers of macrophage lineage. This uncertainty in the diagnosis of brain tumors and the definition of glial cells of the brain is being used in a nonspecific way to include all types of glial (support) cells of the brain (ependymal, astrocytic, oligodendroglial, and microglial cells). It is the recommendation and practice by the NTP that, until further characterized, the neuroglial cell tumors, other than ependymomas and oligodendrogliomas, shall be classified as malignant gliomas. Furthermore, because of the mixed nature of many of the glial cell neoplasms, it is appropriate to combine glial cell neoplasms of the CNS for the purpose of statistical analyses and interpretation of incidence data as part of the determination of the NTP’s levels of evidence of carcinogenic activity.
Case 2 reminds us that nonglial brain tumors must be distinguished from metastatic or other neoplasms that arise from the CNS. This case is from a 2-year-old treated male B6C3F1 mouse (Figure 1D–F) and is characterized by an expansile and compressive nodule of round to ovoid cells with a moderate amount of eosinophilic cytoplasm apparently arising from the meninges along the ventral aspect of the brain stem. Some of the cells are surrounding medium-sized vessels of the meninges and brain. Remarkably, by H&E alone, 53% diagnosed the mass as some form of meningioma (the consensus NTP diagnosis), 18% diagnosed it as some type of glial cell tumor, 5% a histiocytic sarcoma, and 9% needed more information. IHC results were provided to demonstrate that the neoplastic cells are strongly positive for the macrophage markers Iba1, F4/80, MAC3, MAC2, CD45, and lysozyme. Clinically, there was a similar mass invading the jaw. Based upon the morphology, IHC, and evidence of at least one metastatic lesion, the most accurate diagnosis is histiocytic sarcoma.
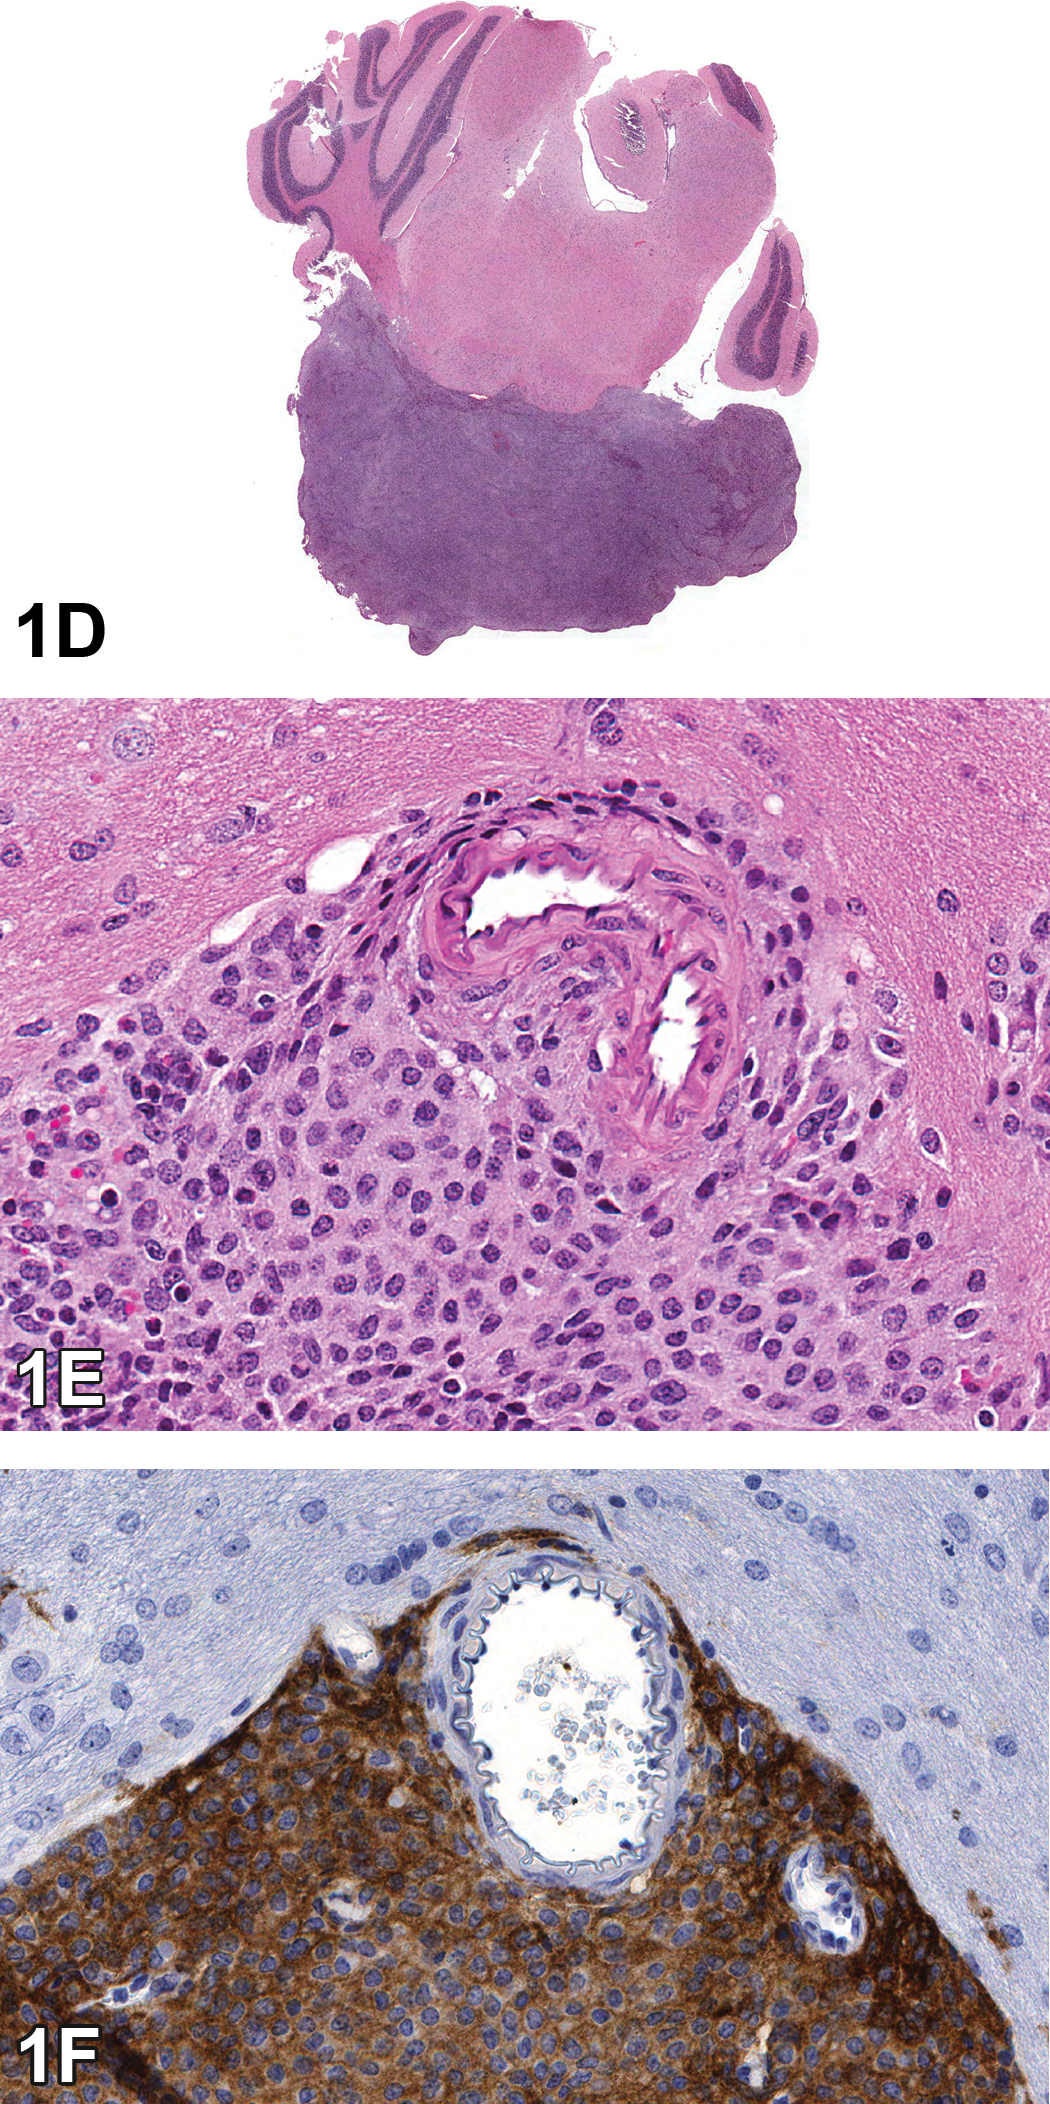
Brain tumor from a treated male B6C3F1 mouse presented in case 2. The low-magnification H&E image shows an expansile and compressive nodule apparently arising from the meninges along the ventral aspect of the brain stem (D). The mass is composed of round to ovoid cells with a moderate amount of eosinophilic cytoplasm, and some of the cells are surrounding medium-sized vessels of the meninges and brain (E). The neoplastic cells have strongly positive cytoplasmic immunoreactivity for the macrophage marker F480 (F).
RSCABS: Picking at Histopathology Data
Dr. Jeffrey C. Wolf (Experimental Pathology Laboratories, Inc., Sterling, VA) presented examples of histopathology data from 3 hypothetical toxicology studies, in which each data set was progressively more complex than the preceding. Each study featured a negative control group, and 4 groups representing test article concentrations of 0.01, 0.1, 1, and 10 mg/kg/day, respectively. The 2 questions posed to the symposium participants were the same for each of the 3 studies: are there statistically significant differences between the test article–treated groups and controls and, if so, at what test concentration is the no observed effect level (NOEL), based solely on statistical significance? Importantly, the audience was asked to “predict” statistical significance based on the data provided.
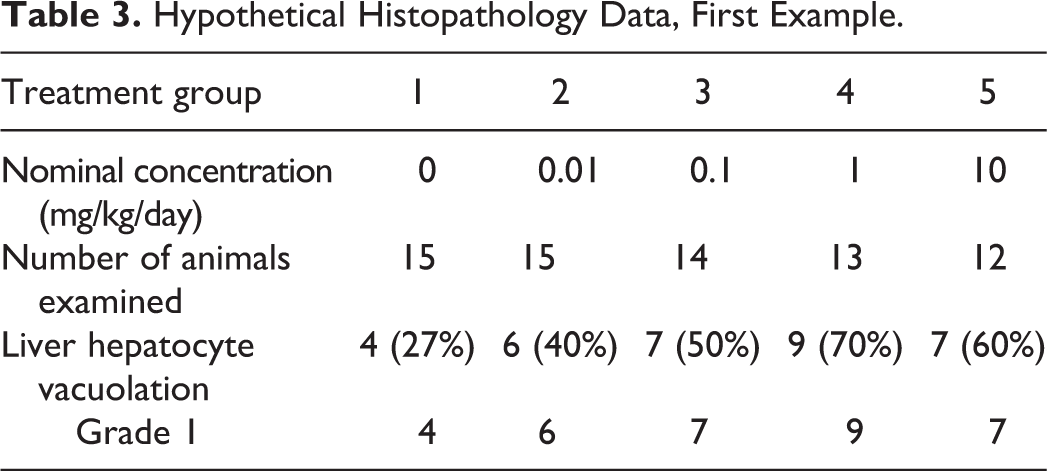
In the first set of example data (Table 3), the incidence of hepatocyte vacuolation was increased in the treated animals relative to the controls, but the severity of this lesion was scored as grade 1 for all 5 groups. The voting choices and participant results were no significant differences between control and treated groups (38%); significant differences, no NOEL (21%); significant differences, NOEL = 0.1 mg/kg/day (18%); significant differences, NOEL = 0.01 mg/kg/day (14%); significant differences, NOEL = 1 mg/kg/day (5%); and other outcome (4%). At that point, the participants learned that the speaker’s preferred answer was significant differences, NOEL = 0.1 mg/kg/day (p ≤ .05), but the method for determining statistical significance was not yet revealed.
Hypothetical Histopathology Data, First Example.
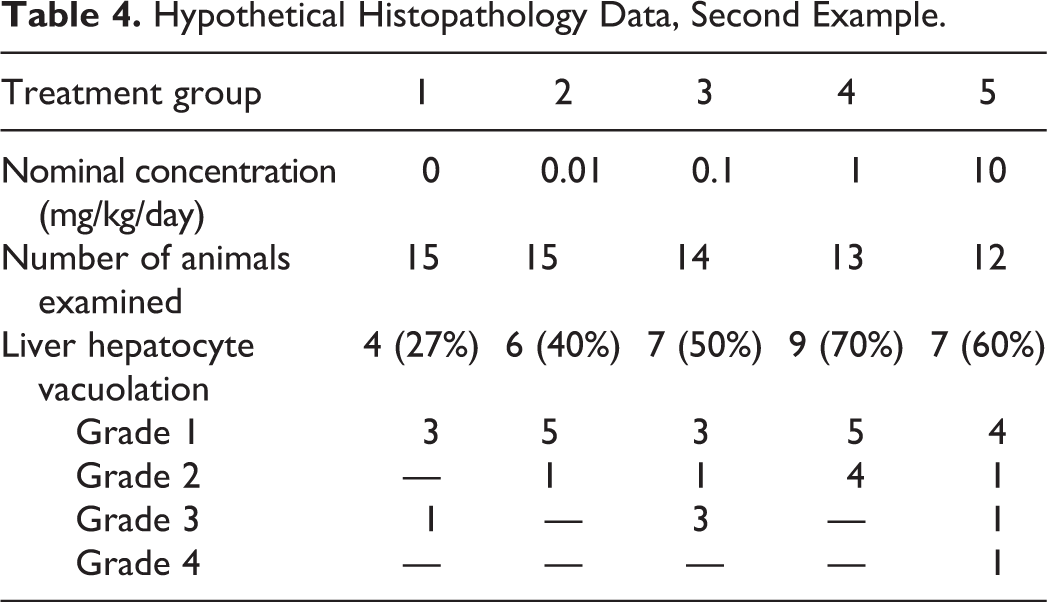
In the second set of data (Table 4), groupwise incidence for hepatocellular vacuolation was the same as in the prior example; however, in this case, the severity scores varied from grades 1 to 4. Consequently, although the voting choices were identical to those of the prior example, the voting results differed as follows: significant differences, NOEL = 0.01 mg/kg/day (39%); significant differences, NOEL = 0.1 mg/kg/day (28%); no significant differences between control and treated groups (19%); significant differences, NOEL = 1 mg/kg/day (7%); significant differences, no NOEL (6%); and other outcome (0%). The answer with the highest voting score was also the speaker’s preferred answer: significant differences, NOEL = 0.01 mg/kg/day (p ≤ .05).
Hypothetical Histopathology Data, Second Example.
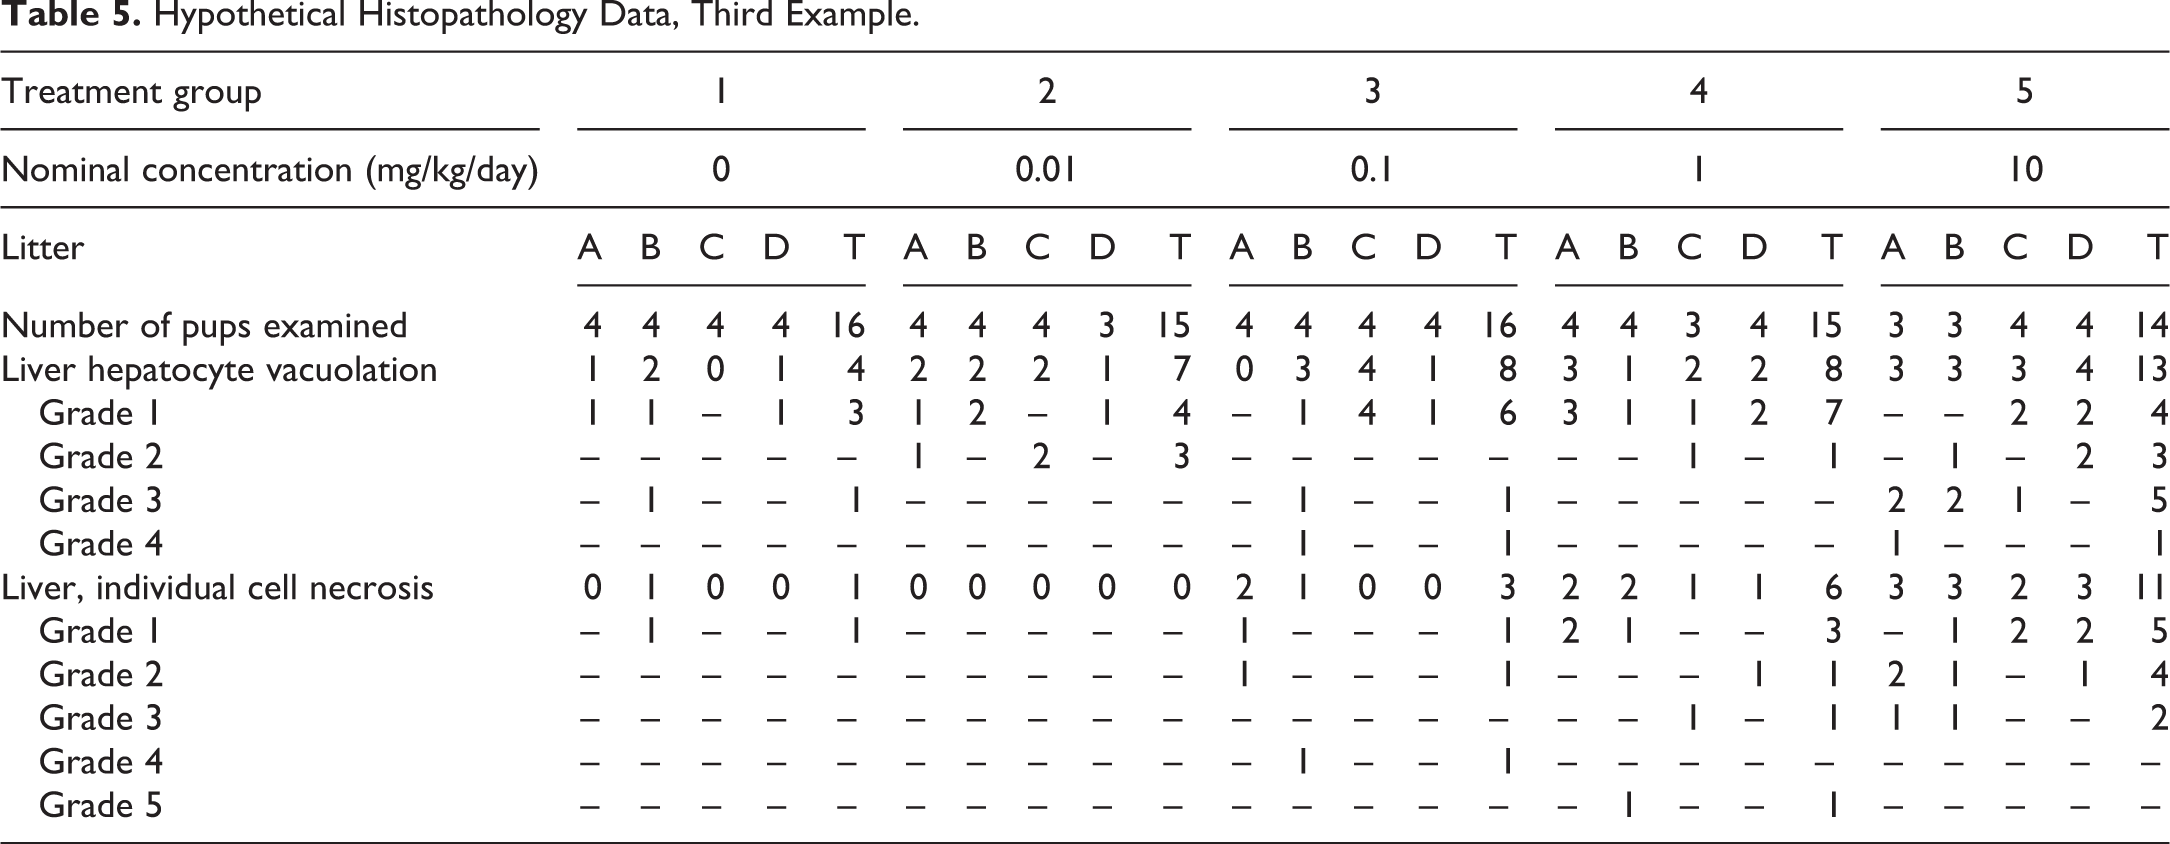
The complexity of the third data set (Table 5) dwarfed that of the earlier examples, because a second diagnosis of liver cell necrosis was added, and because each treatment group consisted of 4 litters of pups, with 3 to 4 pups per litter, rather than merely individual animals. Experimental designs that include litters or group-housed animals are challenging analytically because the individual animals within each litter or housing group are not considered to be independent from one another, and thus the most appropriate experimental unit is the group or litter rather than the individual. For this example, the voting choices and participant results were significant difference in vacuolation, NOEL = 0.01 mg/kg/day, and significant differences in necrosis, NOEL = 0.1 mg/kg/day (48%); significant differences in vacuolation, no NOEL, and significant difference in necrosis, NOEL = 0.01 mg/kg/day (26%); significant difference in vacuolation, NOEL = 0.1 mg/kg/day, and significant differences in necrosis, NOEL = 1 mg/kg/day (19%); no significant differences between control and treated groups (1%); and you gotta be kidding (6%). The speaker’s preferred answer was significant differences in vacuolation, no NOEL, and significant difference in necrosis, NOEL = 0.01 mg/kg/day.
Hypothetical Histopathology Data, Third Example.
The symposium participants were then asked to respond to the following survey-type question: what’s your standard method for determining treatment relationship and the NOEL? The voting choices and participant results for this question included the following: visual examination of incidence/severity tables (48%); Fisher’s exact test (3%), mean (average) severity scores (3%), trend test (2%), a combination of the above 4 answers (35%), RSCABS (0.0%), other statistical methods (2%), coin flip (3%), and Ouija board (4%).
The primary purpose of this presentation was to promote awareness of a recently published novel statistical method for handling histopathology data. Problems associated with typical methods of histopathology data interpretation include inherent subjectivity, difficulty encountered when attempting to evaluate incidence and severity values simultaneously, the fact that averages of severity grades are not statistically valid because grades represent categories (ordinal data) rather than numerical values (e.g., grade 3 is not necessarily 3 times as severe as grade 1), the fact that most commonly used statistical methods fail to consider concentration–response trends or potential effects of paired or group housing (e.g., litter or tank effects), and the understanding that journal reviewers and government regulatory agencies tend to prefer submissions in which the data have been analyzed statistically. Statistical methods that are currently used rarely incorporate severity scores into their calculations, and agencies such as the FDA do not provide firm recommendations for the analysis of nonneoplastic histopathology data.
Initially published by Green et al. (2014), the statistical method introduced in this presentation is called RSCABS. Unlike previous methods, RSCABS was developed specifically to handle histopathology data from toxicologic studies. For pathologists, one of the most valuable aspects of the RSCABS method is that it considers both incidence and severity data simultaneously. It accomplishes this by applying a trend test across dose levels at each severity grade independently in an increasing stepwise fashion, thus avoiding the use of severity score averages. RSCABS also considers effects of dose–response trends and replicate treatment groups (e.g., litters or group housed animals), and it adapts to different data scenarios (e.g., 3-, 4-, or 5-grade scoring systems). RSCABS has been tested against real-world data and other statistical methods, and it has been endorsed by the United States Environmental Protection Agency (USEPA) and the Organization for Economic Cooperation and Development (OECD). In fact, to facilitate the use of this statistical approach, the USEPA has developed a no-cost software package for RSCABS called StatCharrms v0.75 that operates within the freely available R software version 3.2.4 environment or within SAS. The StatCharrms program, installation instructions, user guide, and example data are currently available for download at https://archive.epa.gov/med/med_archive_03/web/html/rscabs.html. This easy-to-use program displays results by sacrifice, gender, and age class, and it lists p values, the direction of change (i.e., increased or decreased compared to controls), and the degree of significance (asterisks representing p ≤ .05, p ≤ .01, or p ≤ .001) for each test concentration and severity level (Figure 2A). If desired, results can be exported to Microsoft Excel. RSCABS was used to determine the preferred answers for the 3 hypothetical data examples presented to the symposium participants.
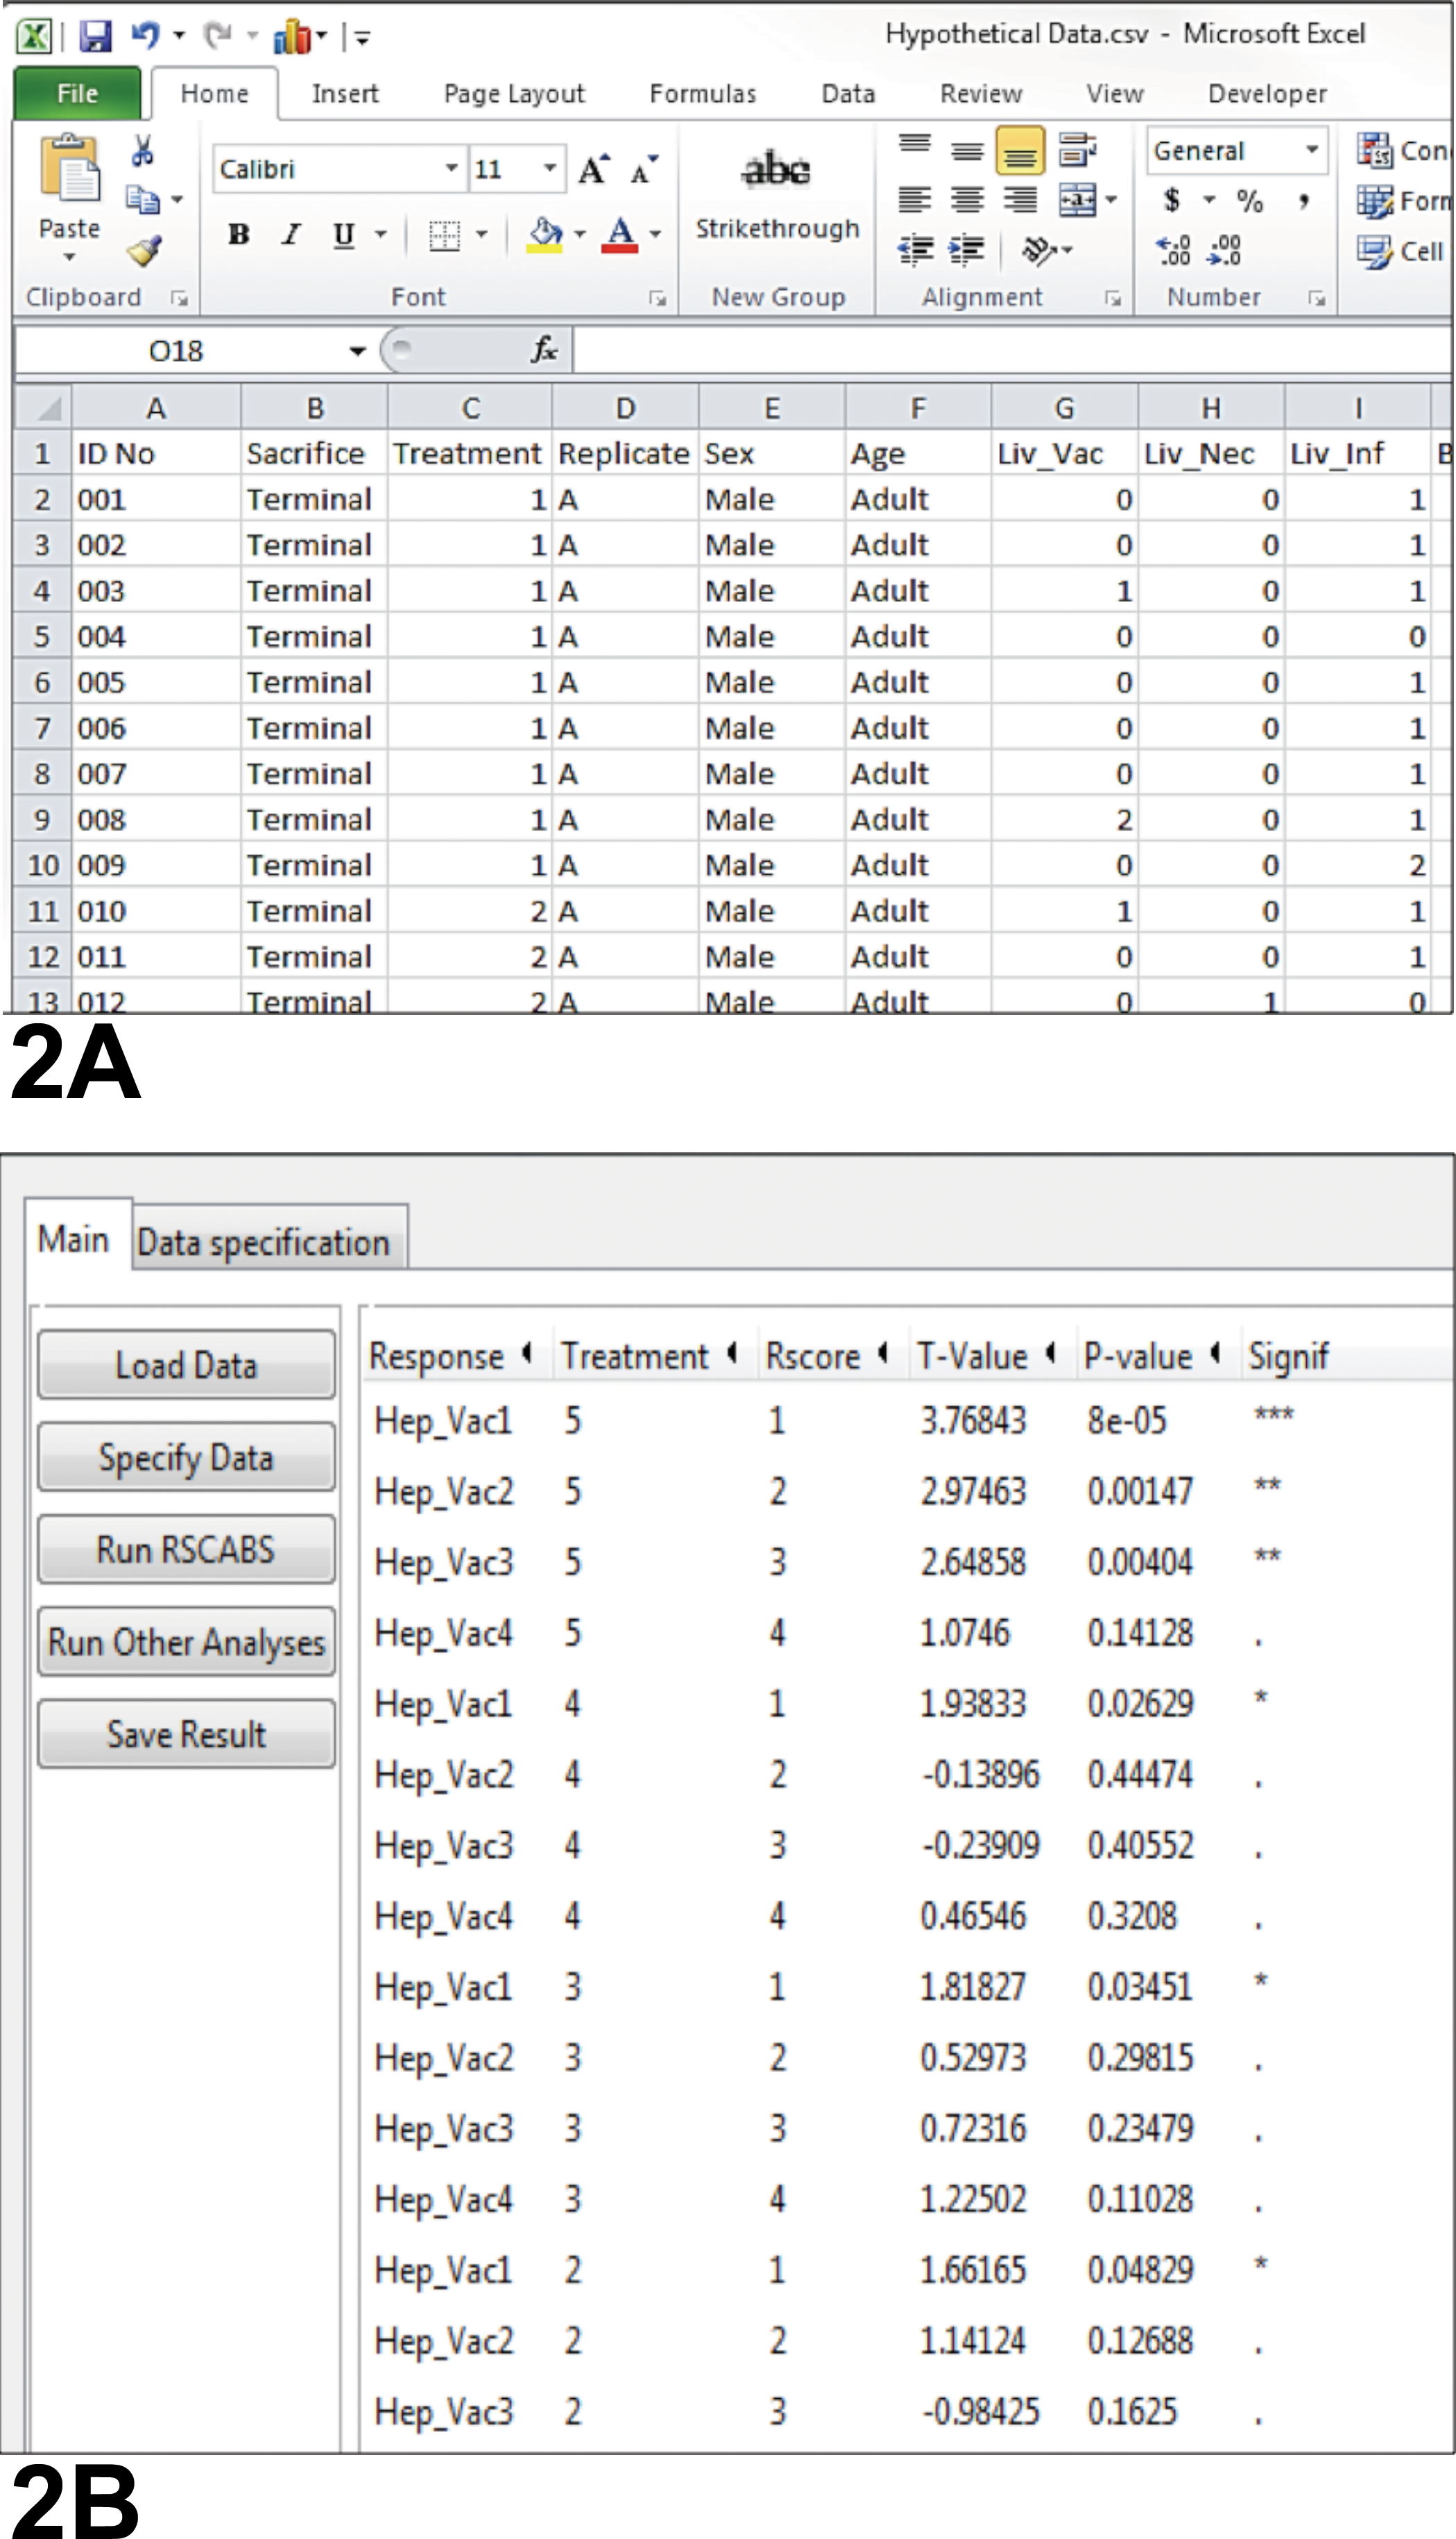
(A) shows example formatting of hypothetical data for use in Rao-Scott Cochran-Armitage by Slices (RSCABS) analyses conducted via StatCharrms software. The arrangement and naming of columns are somewhat flexible; for example, the column labeled “replicate” in (A) could just as easily be replaced by “generation” or another useful category. The Microsoft Excel spreadsheets are saved as comma delimited files (.csv). (B) demonstrates example results generated by RSCABS (partial results from data set #3). The column labeled “response” contains the abbreviated diagnoses, “treatment” represents the treatment group level, “Rscore” represents the severity grade, and “T value” indicates the direction of change (positive or negative). “p Value” indicates the treatment level(s) at which results are significant and also indicates the significant severity level(s).
There are 2 known limitations to the use of RSCABS and StatCharrms. First, the software requires the data to be organized in an Excel worksheet according to a specific format, in which group designations and diagnoses are arranged across columns, and individual animal data are represented by rows (Figure 2B). To accomplish this task efficiently for large studies, it may be necessary to create an algorithm (e.g., using Visual Basic) to help convert data from commercial packages (e.g., Pristima®, PathData®) to this particular format. Formatted spreadsheets are then saved as comma delimited (.csv) files. The second limitation is that RSCABS functions under the presumption that dose–response effects will be monotonic; thus, an alternate statistical method may be preferable if true nonmonotonic effects are suspected.
A common concern voiced by symposium participants was the potential for regulatory officials to inadvertently conclude that each statistically significant difference from controls (i.e., asterisk) automatically represents a toxicologically important finding. It should be recognized that RSCABS and other statistical methods are merely mathematical tools; thus, not every finding identified as significant by RSCABS will be toxicologically important (e.g., outlier responses involving background changes), and conversely, some nonsignificant findings may actually be considered toxicologic effects (e.g., certain historically rare lesions). For those who opt to use RSCABS, it may be beneficial to include a statement reflecting that caveat in each pathology report. Similarly, RSCABS and other statistical methods cannot be used to determine whether a particular finding is adverse, preneoplastic, or within historical control ranges; appropriately, such conclusions are based on evidence from the scientific literature, ancillary study results, internal laboratory data, and the experience of the pathologist.
In conclusion, the high degree of variability in voting responses for each of the 3 hypothetical data examples suggests that “eyeball” assessments of complex histopathology data are not always reliable. When combined with the StatCharrms software, the RSCABS statistical method provides pathologists with an objective, easily used, and flexible device for simultaneously assessing the incidence and severity of histopathologic findings in toxicologic bioassays. In addition to the statistical analysis of data intended for regulatory agency submission, RSCABS may be used informally in-house to highlight possible treatment effects in large data sets or as the analytical method of choice for publishing histopathology data in scientific journals. Because this method is still relatively new, it is primarily through its widespread utilization that additional advantages and limitations may be identified.
Dr. Wolf is extremely grateful for the generous assistance of John W. Green (DuPont, Stine-Haskell Research Center), Timothy A. Springer (Wildlife International, Ltd.), and Joe Swintek and Kevin Flynn (USEPA).
Thinking, Thinking! (Or What’s Amiss in the Uterus)
Dr. Gabrielle A. Willson of Experimental Pathology Laboratories, Inc. (EPL; RTP, NC) presented 3 cases from female Hsd: SD rats from a current NTP 2-year carcinogenicity and toxicity bioassay. All were proliferative uterine lesions stained with H&E. These cases were selected as representative of lesions encountered during histological evaluation of the uteri in long-term studies in rodents. They present varying degrees of diagnostic challenges encountered in toxicity/carcinogenicity studies when slides are stained with H&E and decisions are generally made without the benefit of special stains or IHC.
The first case was a uterine lesion in a terminally sacrificed female rat. Light microscopic examination revealed a large, nonencapsulated mass within the uterine lumen (Figure 3A). Approximately 75% of the surface of the mass was lined by simple cuboidal epithelium, overlying a densely cellular stroma of neoplastic spindle or stellate cells, small amounts of collagen, and endothelial-lined vascular spaces. A small number of endometrial glands, some dilated, were present throughout the mass (Figure 3B). The remaining 25% of the surface consisted of a deep invagination lined by keratinized stratified squamous epithelium (Figure 3C). Variable amounts of fibrin admixed with extravasated erythrocytes and leucocytes were present in the uterine lumen.
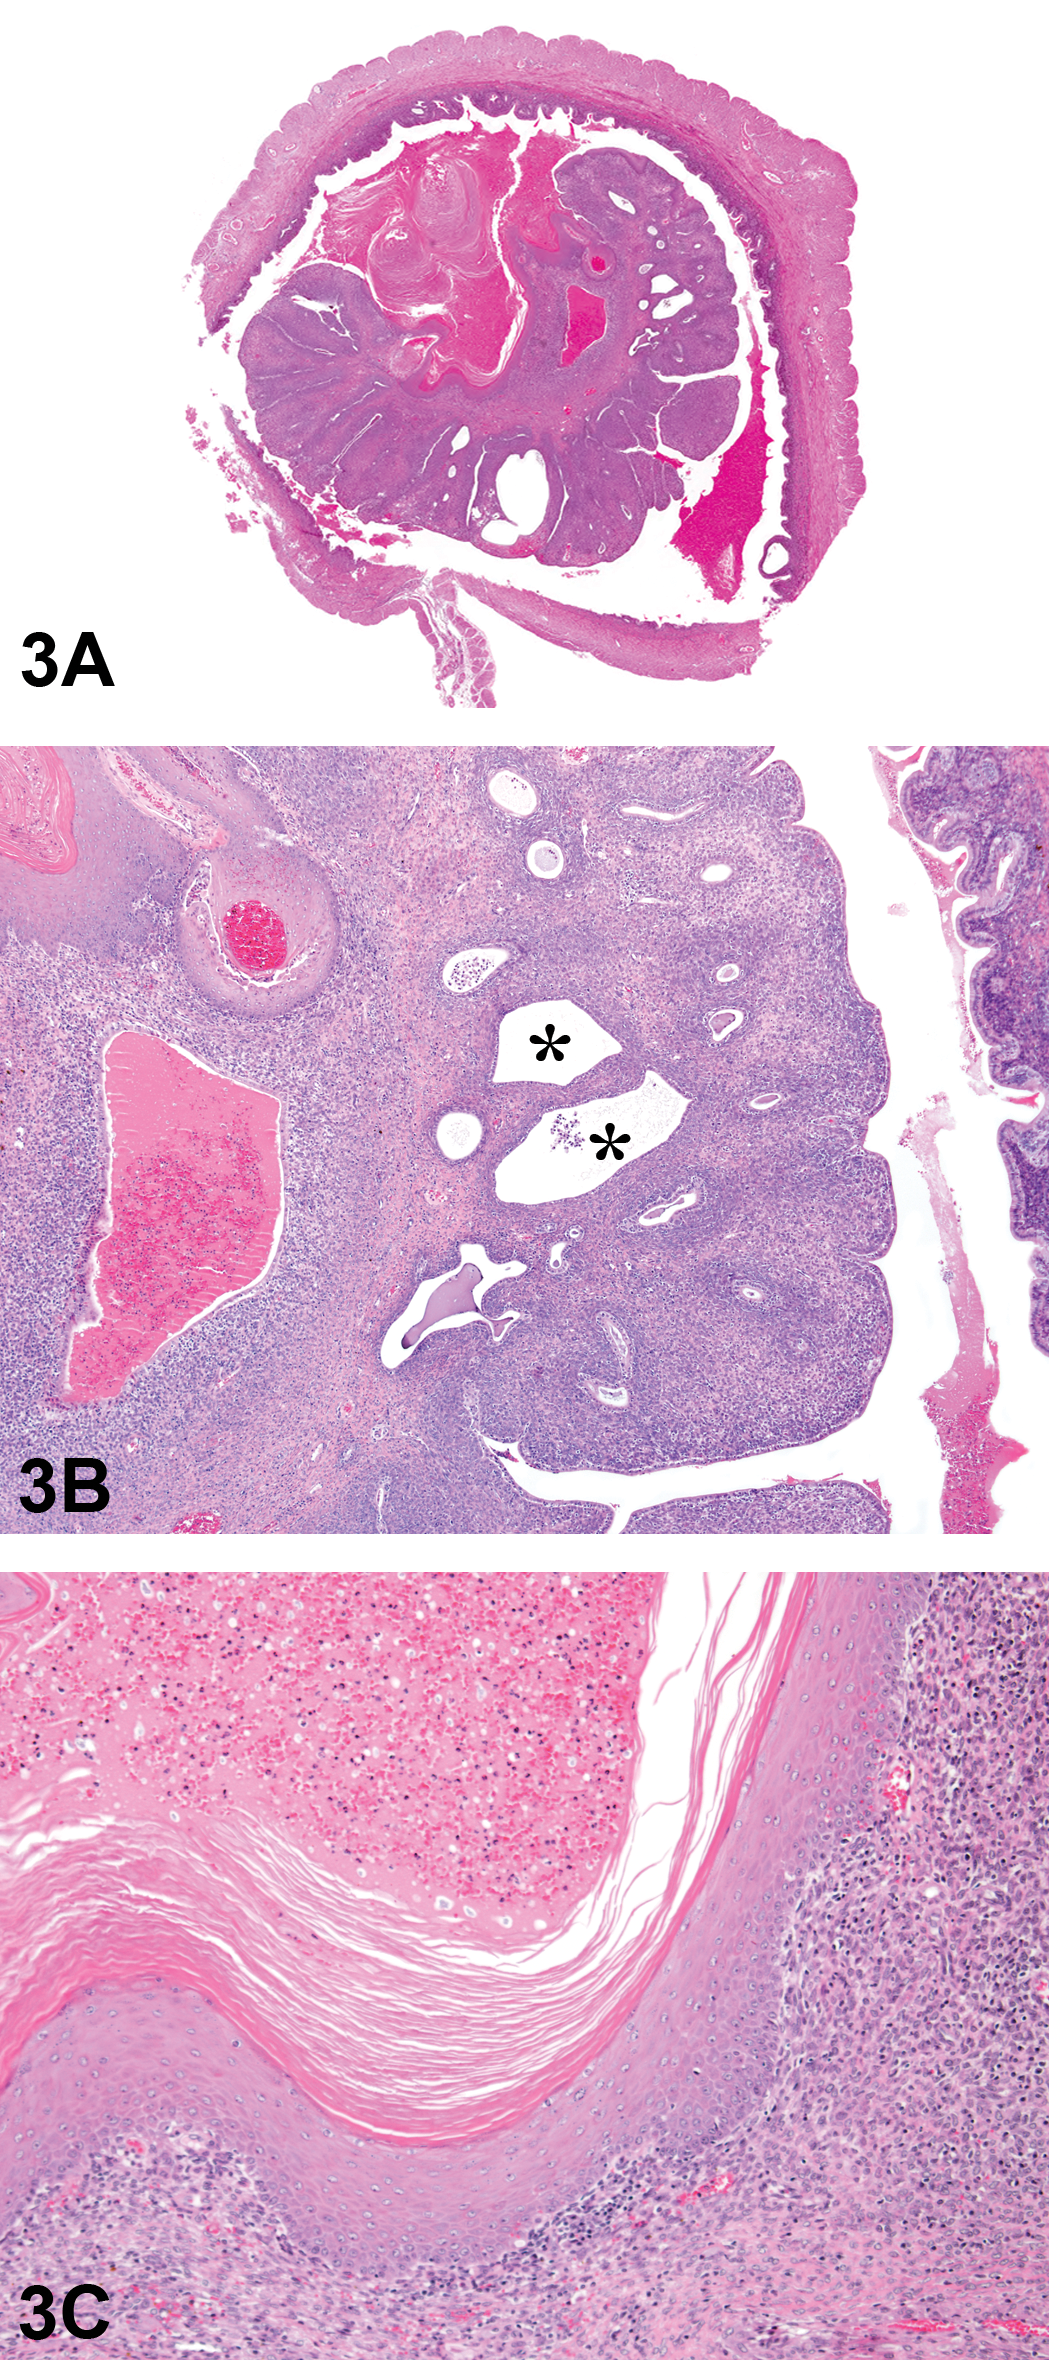
Uterine polyp from a 2-year rat carcinogenicity assay presented as case 1. A large, nonencapsulated mass is present within the uterine lumen (A). Higher magnification (B) shows a number of endometrial glands throughout the stroma, some of which are dilated (asterisks). (C) illustrates the deep invagination lined by keratinized stratified squamous epithelium. H&E.
The voting choices and results were adenomatous polyp (29%); stromal polyp (20%); squamous cell carcinoma (15%); adenocarcinoma (9%); glandular polyp (8%), papilloma (7%); cystic endometrial hyperplasia (7%); and adenoma (5%). The majority vote from the audience was for some type of “polyp” (57%) with adenomatous polyp being the most popular (29%). The NTP pathology working group preference was endometrial stromal polyp.
The ensuing discussion in part revolved around whether or not uterine polyps should be classified consistently as glandular or stromal, according to their morphologic characteristics (Figure 3D). Are these really 2 different variants of the same lesion? The audience expressed differing opinions. Glandular polyps generally include a hyperplastic glandular component with endometrial glands, often cystic, scattered throughout the stroma (Dixon et al. 2014). Endometrial stromal polyps in rodents consist predominantly of loosely organized, endometrial stromal cells with numerous blood vessels and very few glandular elements (Davis 2012; Leininger and Jokinen 1990).
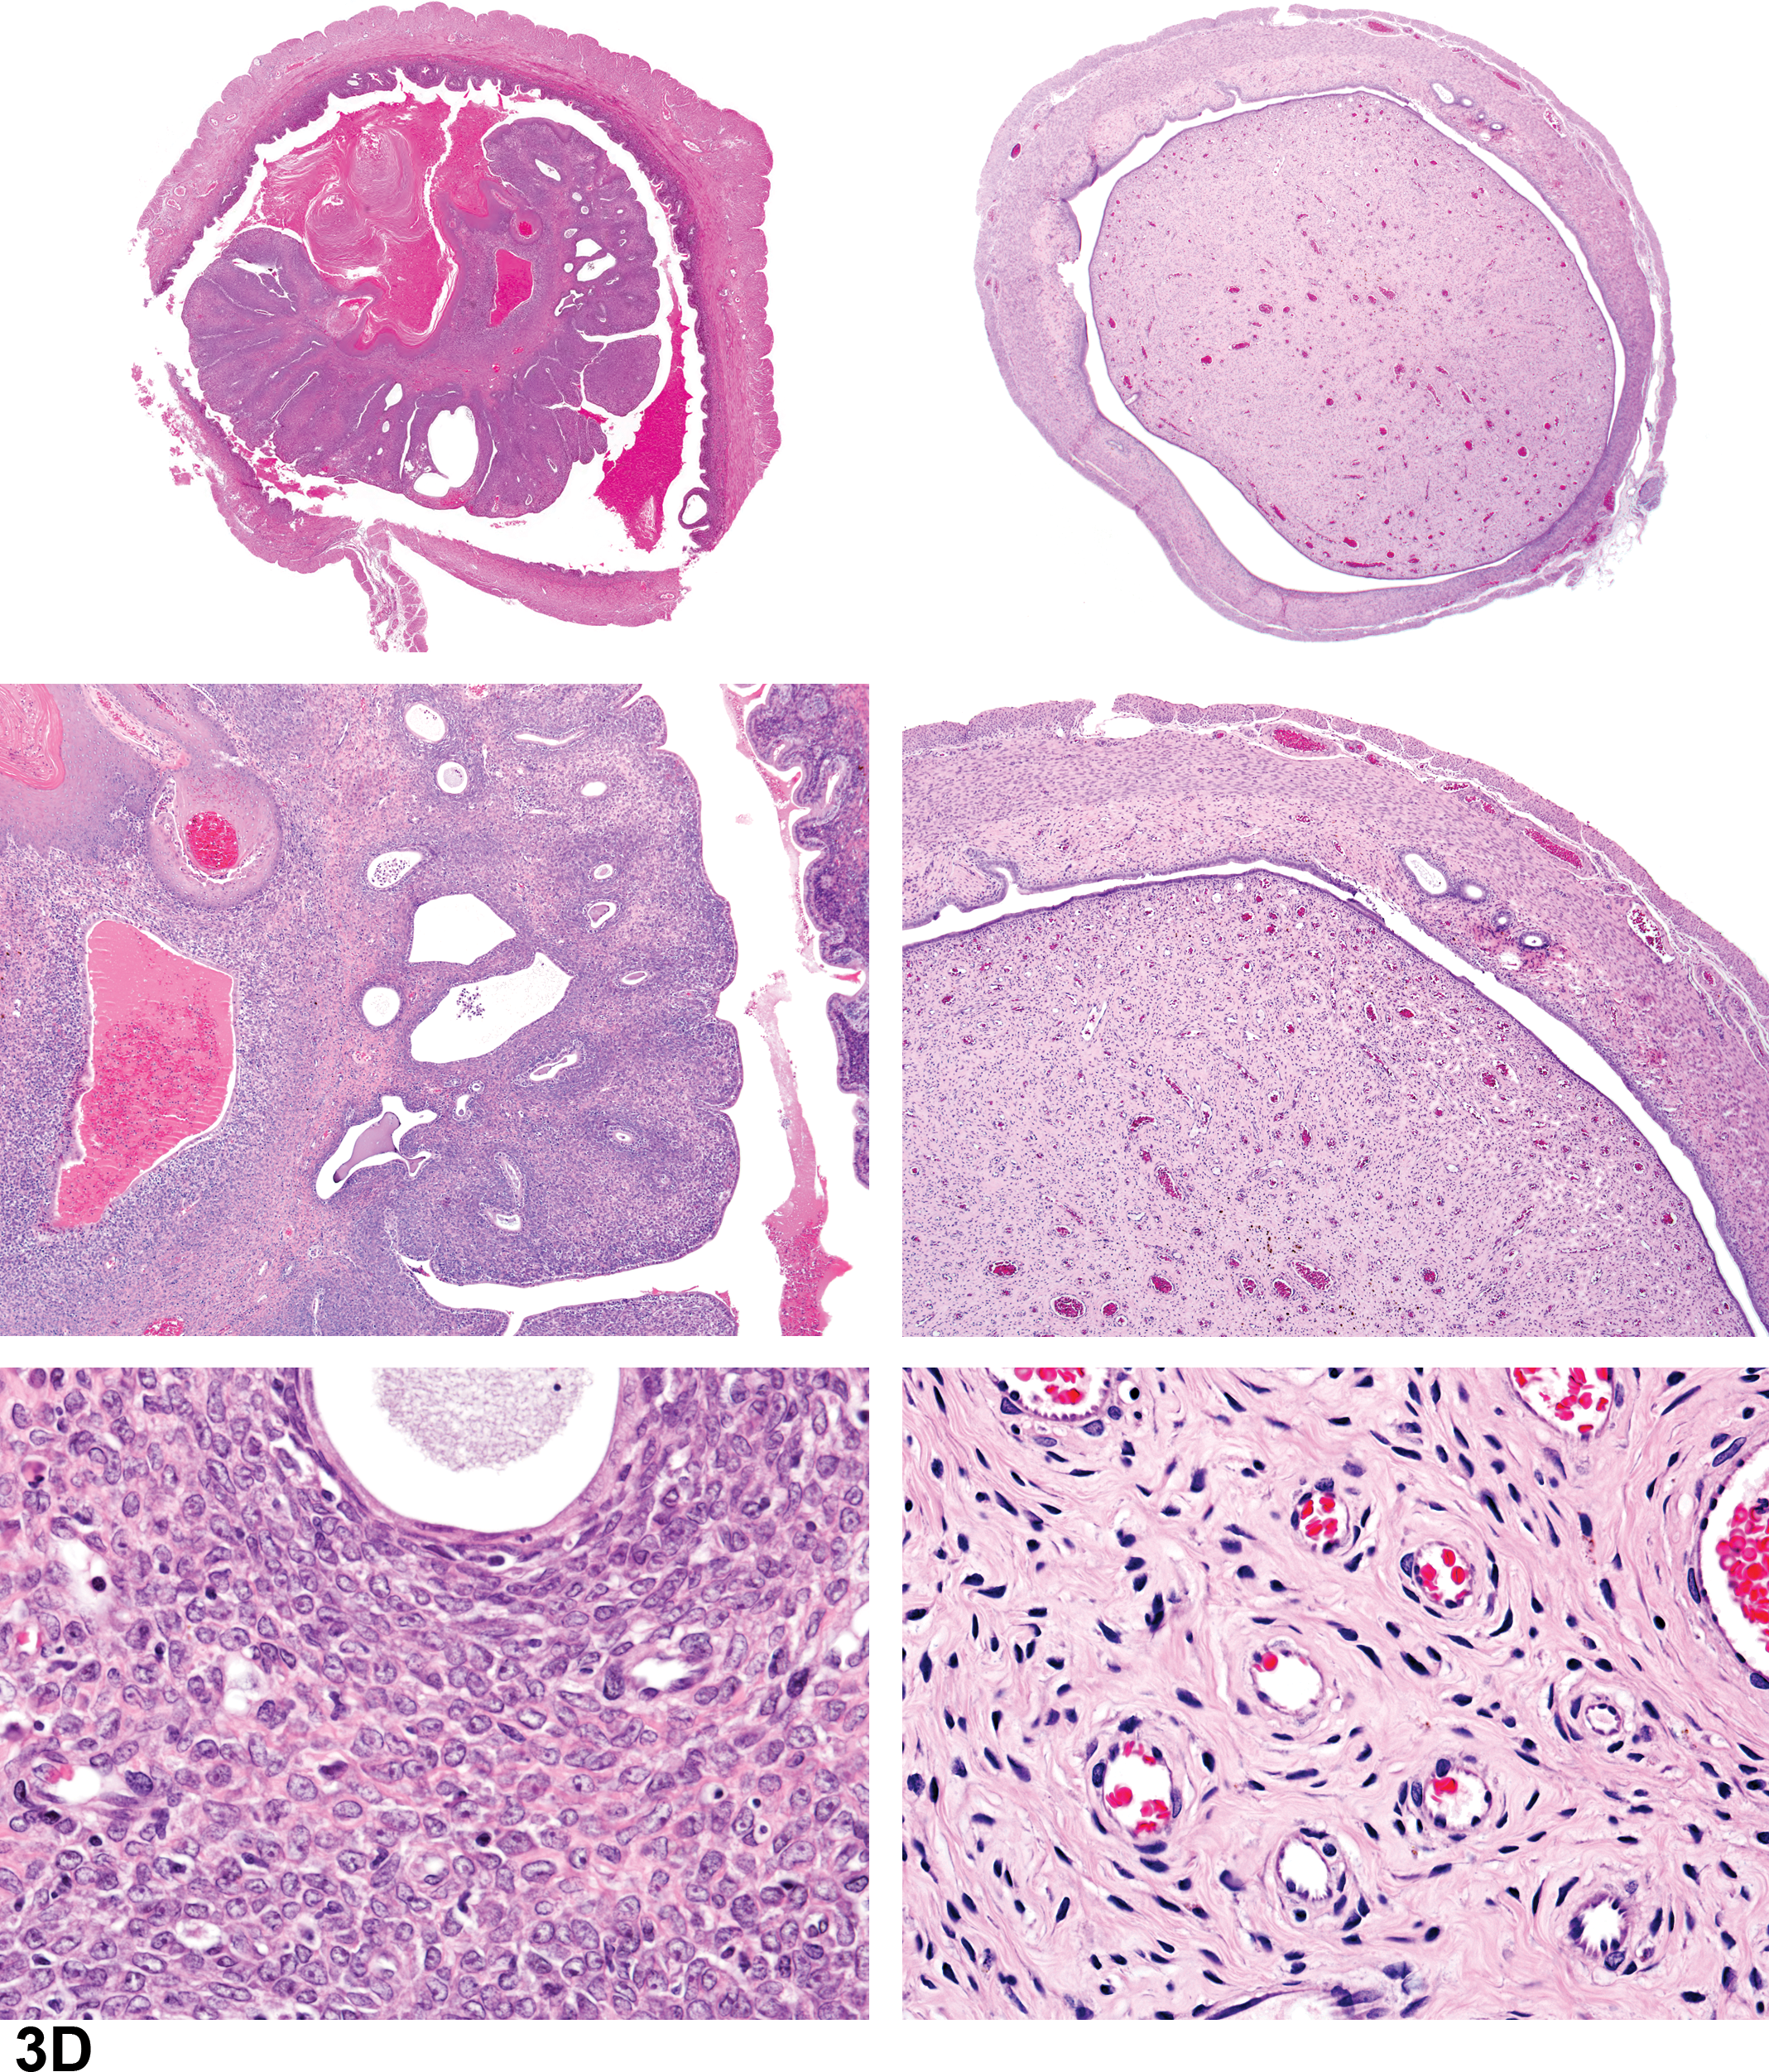
Comparison of features of rat glandular polyps (left panel) versus stromal polyps (right panel). There is dense fibrovascular stroma and a paucity of endometrial glands in the endometrial stromal polyp (right panel). H&E.
In the online NTP Nonneoplastic Lesion Atlas (Willson et al. 2015), polyps are designated as “endometrial stromal polyps” regardless of the presence or absence of a glandular component. It is recommended that the glandular component be described in the pathology narrative. However, elsewhere (Dixon et al. 2014) a distinction is made between glandular and stromal polyps. Due to the difficulties in separating the different forms of endometrial polyps, they are commonly combined for statistical analysis (Greaves 2012).
A discussion ensued as to whether or not polyps were in fact neoplasms. Some audience members considered them to be preneoplastic and others to be neoplastic. The NTP considers stromal polyps to be benign neoplasms and are combined with stromal sarcomas of the uterus when evaluating the carcinogenic potential of a chemical. There are no cases of a compound being designated a carcinogen by the NTP solely due to an increased incidence in uterine stromal polyps. Also, studies of estrogenic or endocrine disrupting compounds show no clear induction of stromal polyps, suggesting that these polyps are not estrogen responsive (Davis 2012). Some authors (Greaves 2012) consider the adenomatous polyps to be neoplastic growths although the difficulty in separating the 2 types of polyps is widely acknowledged. Other authors (Davis 2012) indicate there is no evidence that endometrial stromal polyps are precancerous lesions. The NTP is currently conducting a review of more than 100 polyps classified as glandular or stromal, based upon histologic characteristics. Selected polyps will be step sectioned to determine whether the criteria for separating the 2 diagnoses can be stated more definitively and if the morphology of each type remains stable in step sections. It is also proposed to investigate the usefulness of IHC markers including Ki67 and PCNA.
The NTP has recently introduced the practice of examining longitudinal sections of the female reproductive tract, including uterus body, uterine horns, cervix, and vagina. Obviously, this produces more information by providing more tissue for evaluation. The recent NTP database on the HSd: SD rat (NTP 2016) is based on longitudinal sectioning of the uterus. A straw poll of the satellite symposium audience revealed that very few are currently sectioning female reproductive tissue in this manner but approximately 50% would prefer to review longitudinal sections of the uterus if given the option.
The second case was another uterine lesion that occurred in the same rat as the first case. At necropsy, a 6.5 cm × 5.5 cm mottled mass was observed in the uterine body. Light microscopic examination of a transverse section through the mass revealed marked thickening of the uterine wall, resulting in compression and distortion of the lumen (Figure 3E). The lumen was lined by fragments of hyperplastic stratified squamous epithelium (Figure 3F) and contained a small amount of fibrin mixed with moderate numbers of extravasated erythrocytes and leucocytes. Most of the normal architecture of the uterine wall was effaced by a poorly demarcated, unencapsulated, infiltrative neoplasm containing spindle cells and pleomorphic cells with blunt-ended, “cigar-shaped,” oval nuclei (Figure 3G). A few dilated glands were scattered throughout the uterine wall. The serosal surface was variably thickened by fibrosis and infiltration of mainly lymphocytes and plasma cells, with fewer mast cells and degenerating neutrophils, and adipose cells.
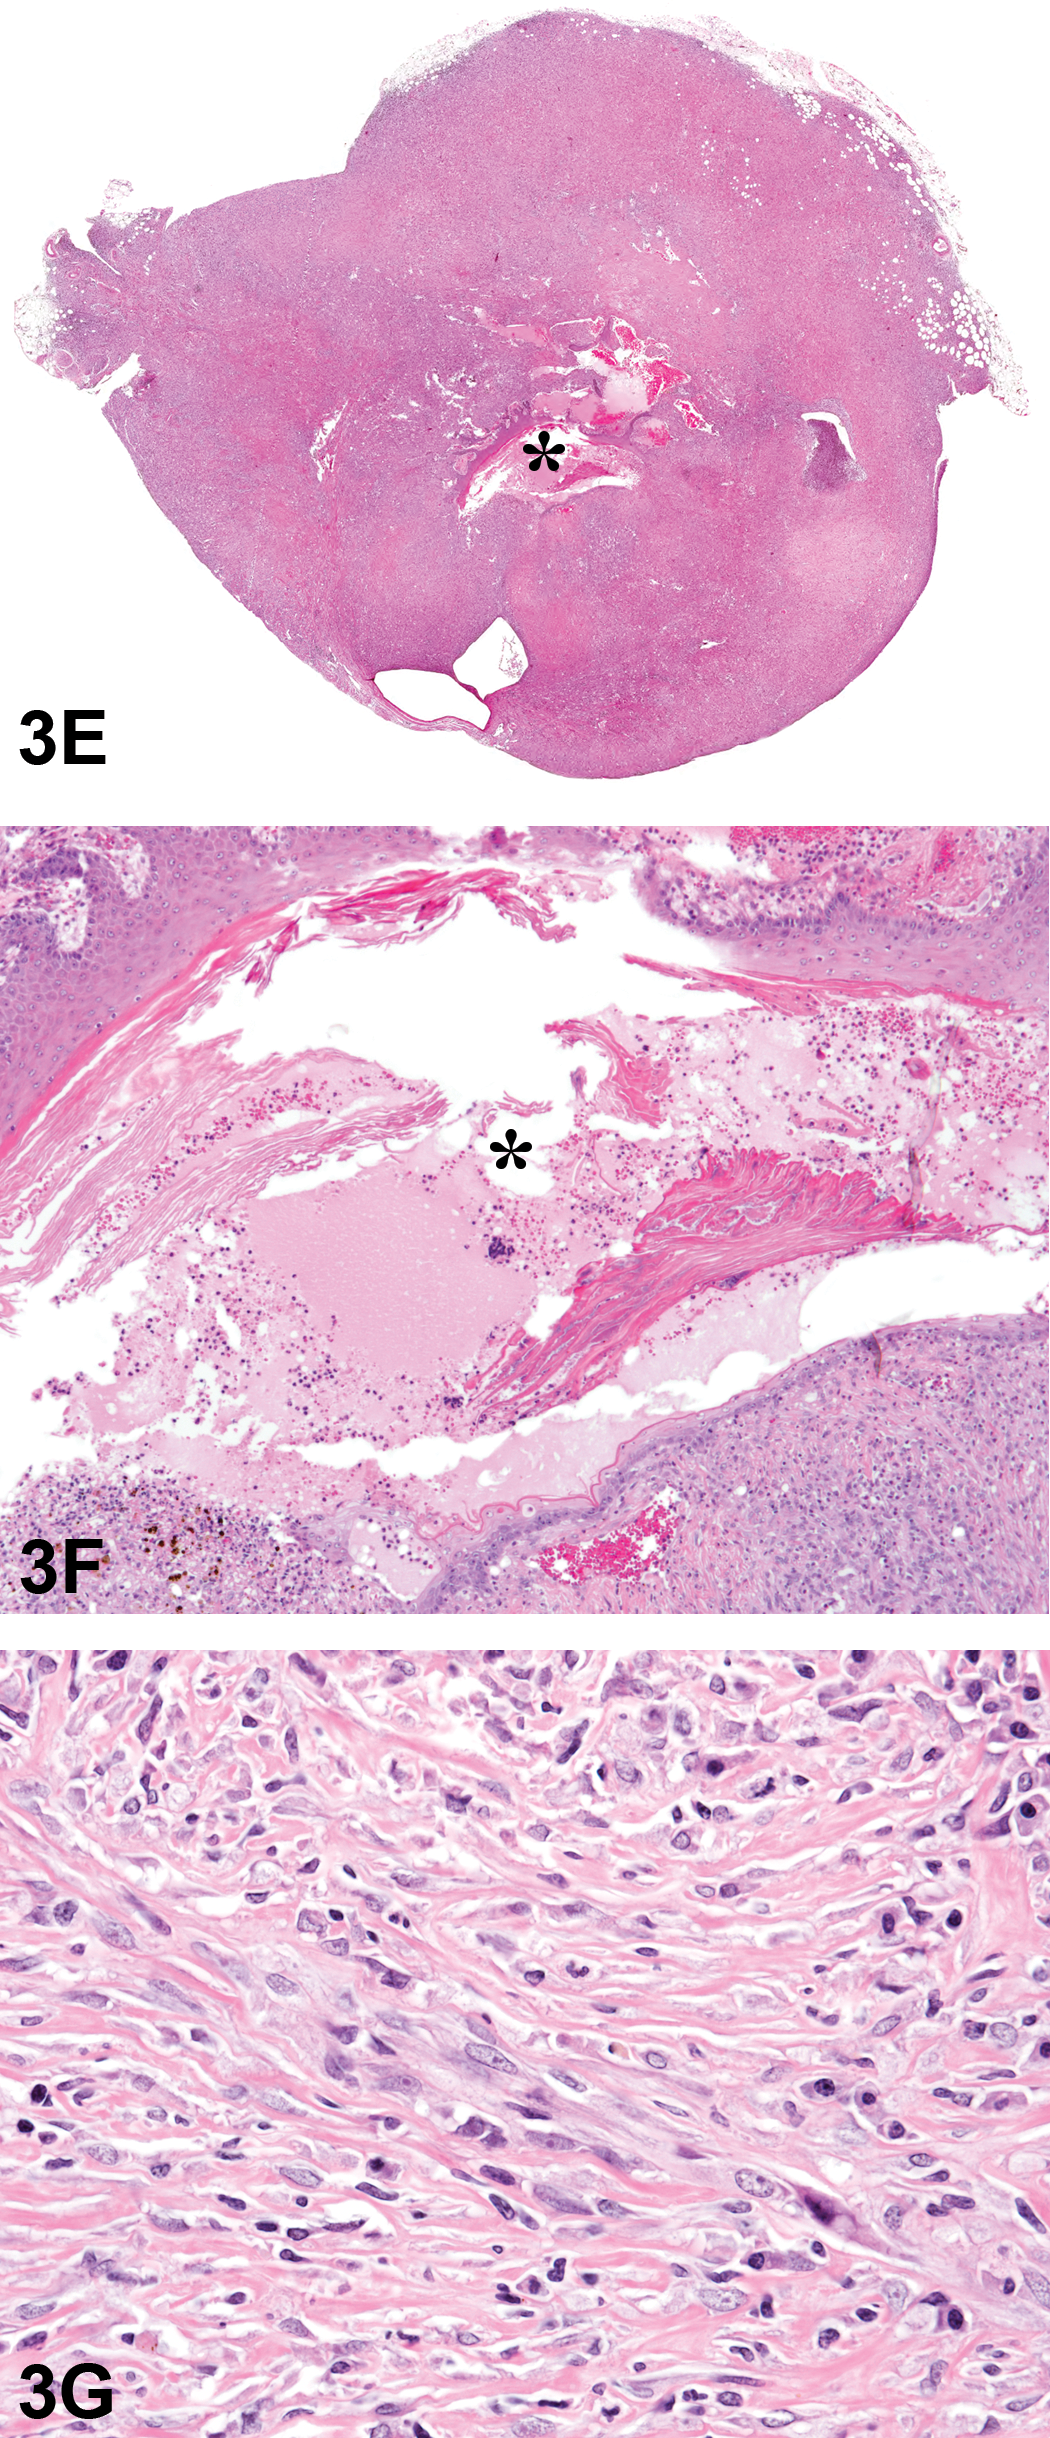
A rat leiomyosarcoma presented as case 2. There is marked thickening of the uterine wall with compression of the lumen (E, asterisk). The higher magnification (F) illustrates the lumen (asterisk) lined by fragmented, hyperplastic stratified squamous epithelium. A higher magnification of the neoplasm (G) shows that it contains pleomorphic spindle cells with blunt-ended, “cigar-shaped” oval nuclei. H&E.
The voting choices and results were leiomyosarcoma (35%), stromal sarcoma (29%), leiomyoma (19%), stromal polyp (11%), schwannoma malignant (4%), adenocarcinoma (2%), glandular polyp (0%), and adenoma (0%). Leiomyosarcoma was favored at the Pathology Working Group (PWG) previously held at NTP.
The third case was a uterine lesion in a rat sacrificed on testing day 646 due to pallor and a distended abdomen. At necropsy, there was a 0.8-cm diameter mass in the right horn of the uterus. Light microscopic examination revealed a poorly demarcated, unencapsulated, infiltrative mass (Figure 3H). In some areas, elongated cells were arranged in interlacing or whorling patterns consistent with Antoni type A pattern. Some areas consisted of randomly arranged, round to spindle-shaped cells (Figure 3I). Other areas were comprised of large, endothelial-lined cystic spaces in a poorly stained edematous matrix (Figure 3J). The serosal surface was variably thickened by fibrosis and inflammation extending into adjacent adipose tissue.
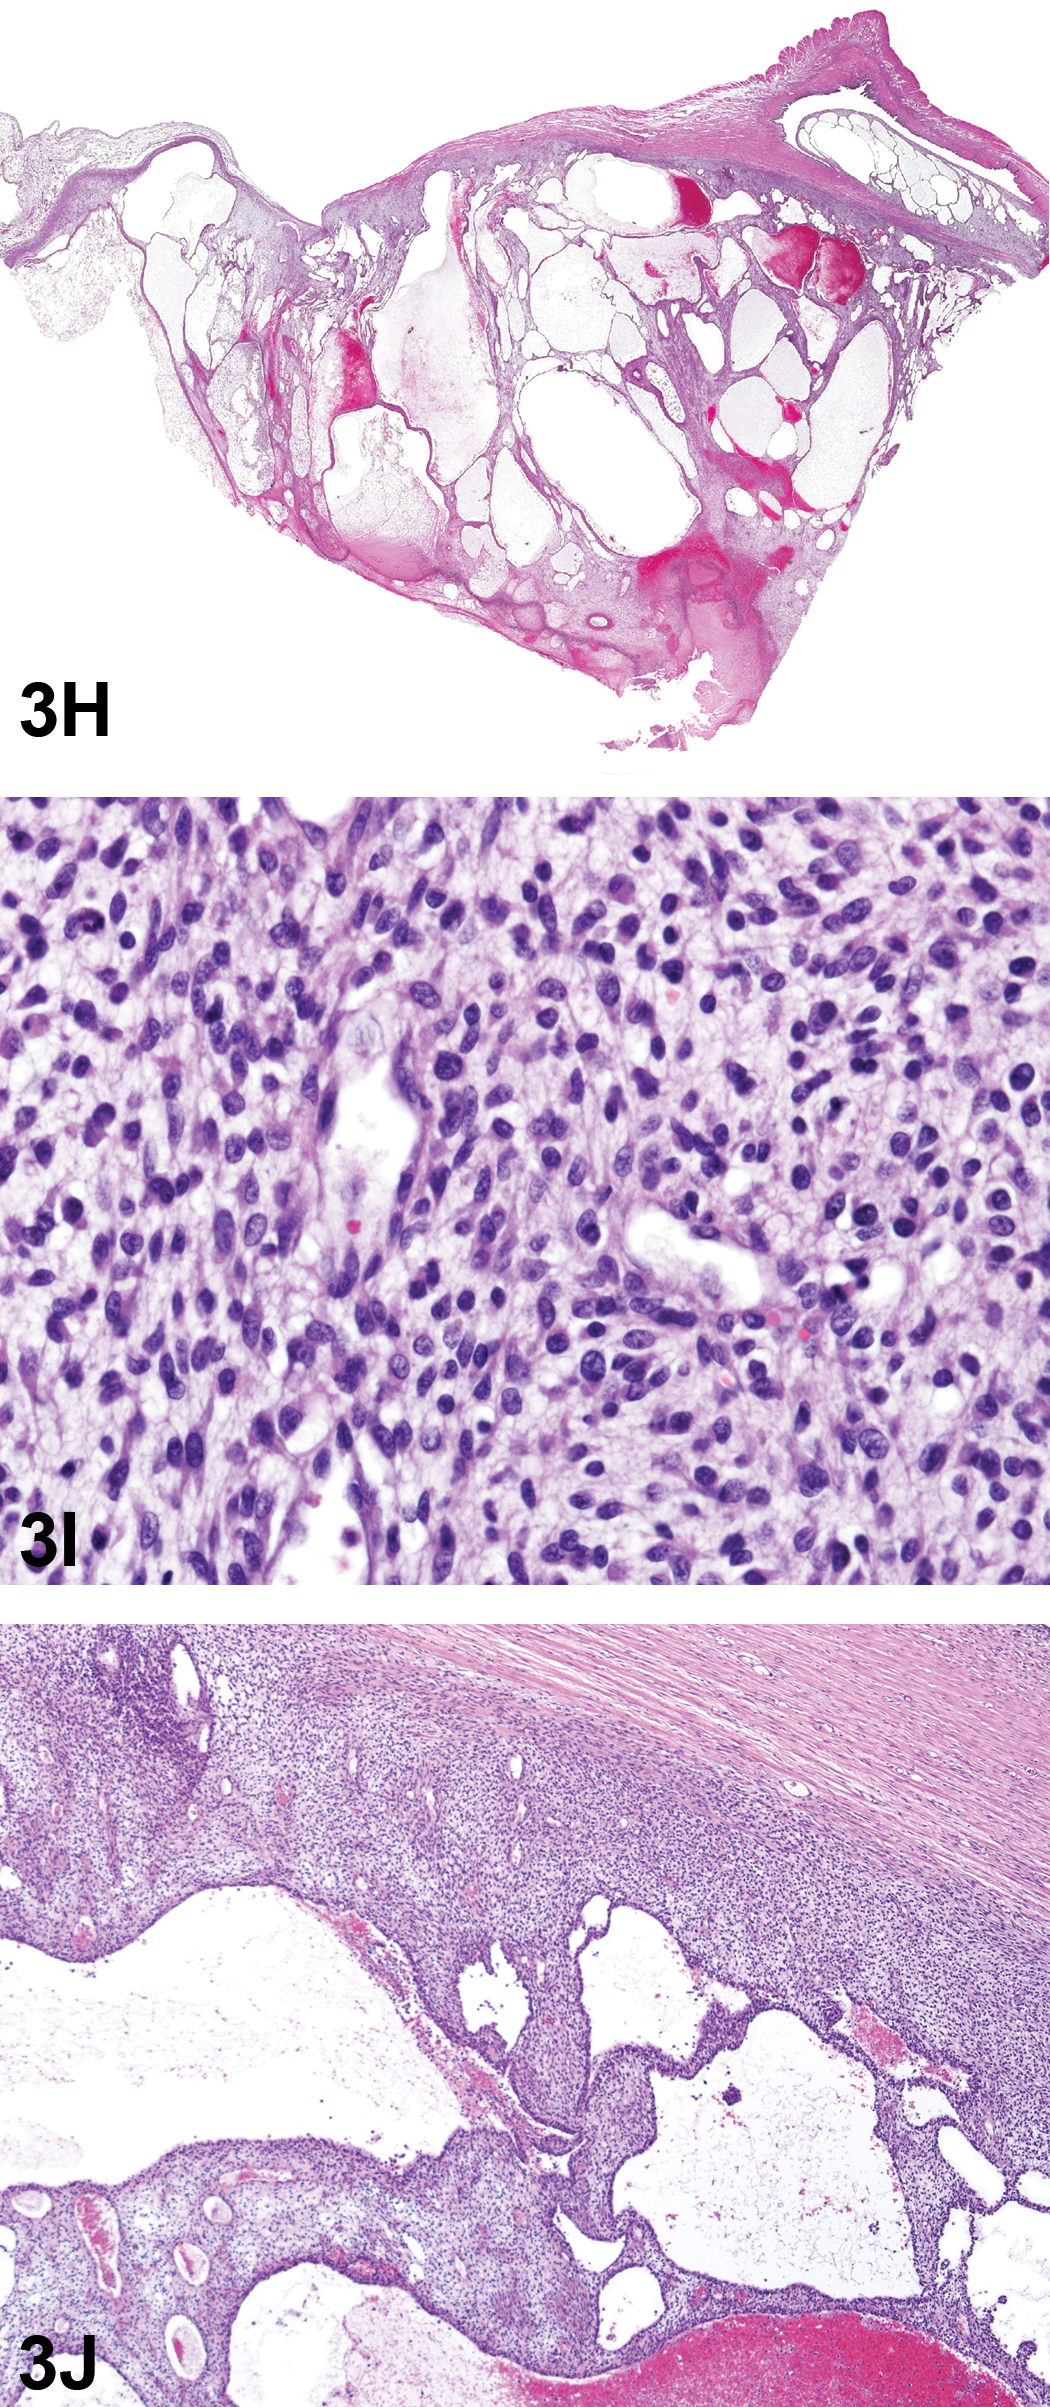
(H) illustrates a rat uterine malignant schwannoma presented as case 3. The neoplasm is poorly demarcated, unencapsulated, and infiltrative. Higher magnifications show that there are randomly arranged, round to spindle-shaped cells (I) and areas comprised of large, endothelial-lined cystic spaces in a poorly stained edematous matrix (J). H&E.
The voting choices and results were malignant schwannoma (28%), stromal sarcoma (24%), myxosarcoma (21%), adenocarcinoma (11%), myxoma (9%), histiocytic sarcoma (4%), sarcoma (3%), and adenoma (1%). Malignant schwannoma was favored at the PWG, although there were 3 votes for stromal sarcoma.
The audience debate for these last 2 cases centered on the difficulties of differentiating spindle cell tumors on H&E-stained slides. Uterine leiomyosarcomas rarely metastasize. Utilizing IHC, leiomyosarcomas are positive for smooth muscle actin (SMA) and h-caldesmon and sporadically positive for desmin (Coindre 2003; Table 6). h-Caldesmon is a protein that binds with actin and tropomyosin to regulate cellular contraction (Watanabe et al. 1999). It is specific for smooth muscle differentiation and therefore a useful marker in the diagnosis of leiomyosarcoma. Vimentin, as it is a universal mesenchymal marker, provides no useful diagnostic information because it is expressed in many tumor types. While S100 positivity may be exhibited in endometrial stromal sarcoma, leiomyosarcoma, and malignant schwannoma, SOX 10 and PRX are schwannoma-specific markers.
Expected Uterine Tumor Immunohistochemistry.
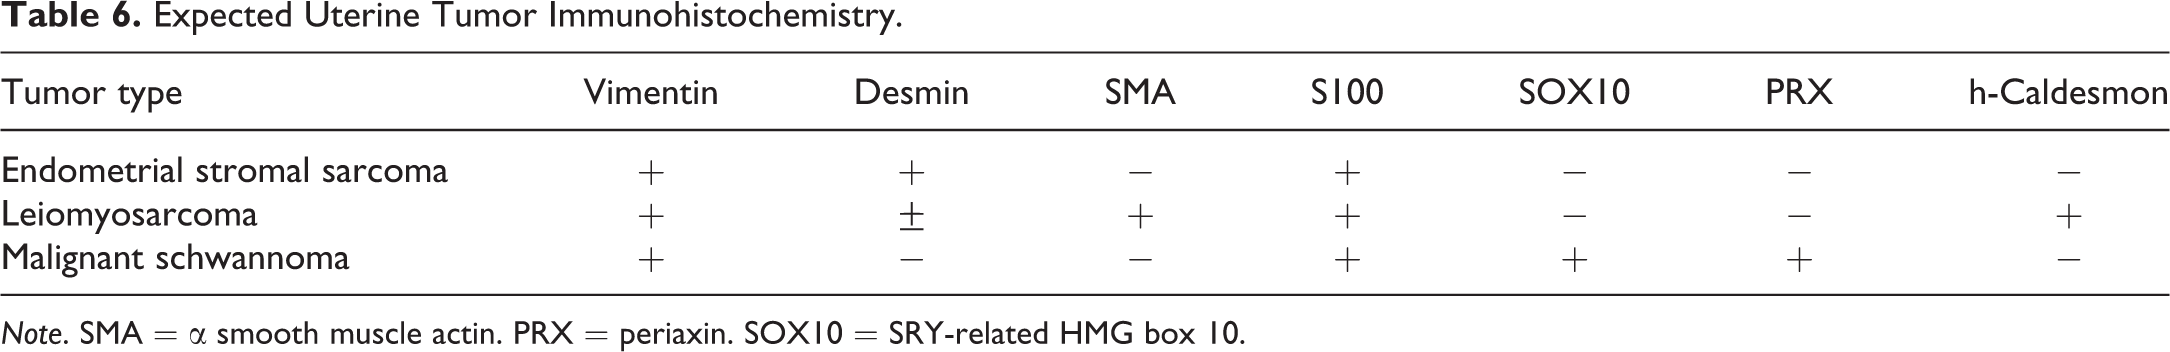
Note. SMA = α smooth muscle actin. PRX = periaxin. SOX10 = SRY-related HMG box 10.
NTP historical data (NTP 2016) were also presented. Table 7 compares the spontaneous/control incidences of uterine tumors in 3 different rat strains. The Fischer 344 rat had the highest incidence of stromal polyps and the lowest incidence of other tumors, while Wistar Han rats had the lowest incidence of stromal polyps.
NTP Spontaneous Rat Uterine Tumor Incidence.
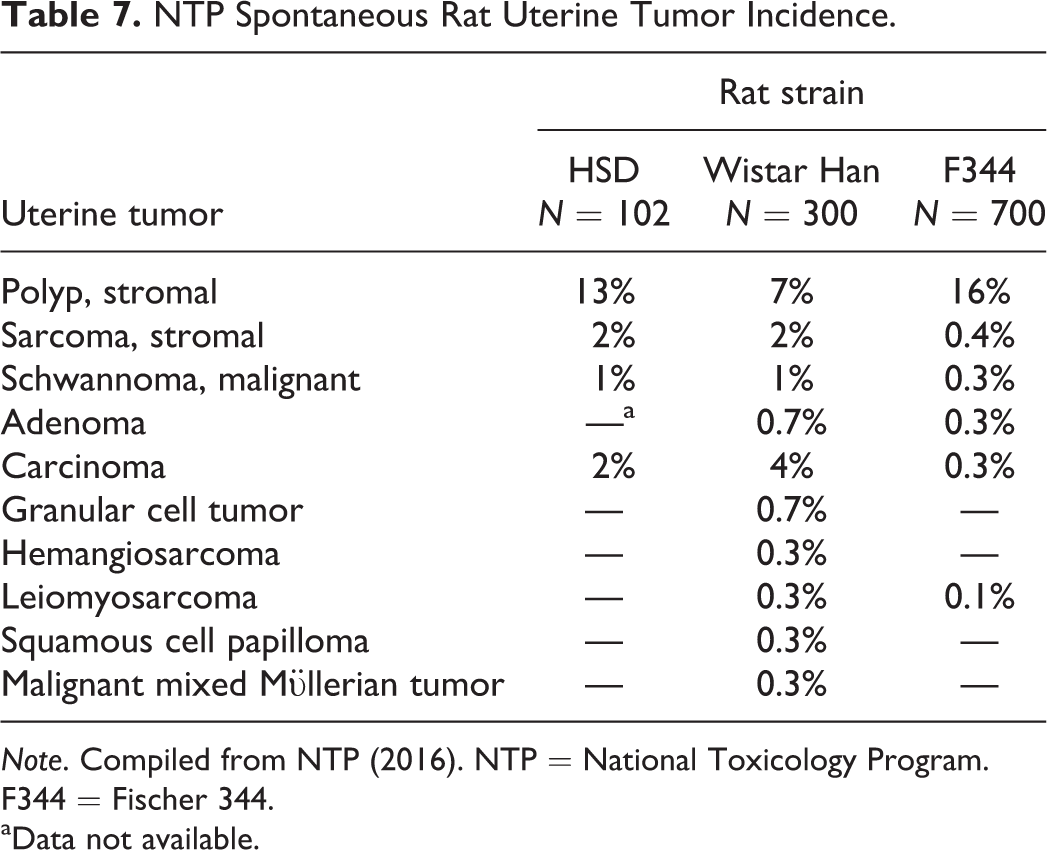
Note. Compiled from NTP (2016). NTP = National Toxicology Program. F344 = Fischer 344.
aData not available.
The author would like to thank Karen Cimon, Erin Quist, and Emily Singletary of EPL, NC, for assistance with this presentation and Kathy Szabo of Charles River Laboratories, Inc., for identifying these cases.
Maybe Not a No-brainer
Dr. Linda Kooistra (CRL, Durham, NC) presented a case of an unusual brain tumor. Contributions to this talk were made by Dr. Kathleen Szabo (CRL), Dr. James Morrison (CRL), and the CRL Electron Microscopy (EM) Laboratory. The signalment was a B6C3F1 female mouse that was a moribund euthanasia on day 703 of a 2-year inhalation carcinogenicity bioassay. On the day of euthanasia, the mouse was thin with labored breathing. A 7 mm × 10 mm dark mass was noted in the right brain stem. Other gross and microscopic findings included osteosarcoma of vertebra with metastasis to the lung, hepatocellular adenoma, forestomach squamous cell papilloma, uterine endometrial hyperplasia, and splenic lymphoid follicular hyperplasia. The pituitary gland and calvarium were grossly and microscopically normal; there was no evidence of a mass arising from the calvarium.
The audience was shown representative photomicrographs of H&E-stained slides of the tumor (Figure 4A–G) and asked to vote. The brain mass was fairly well circumscribed and compressed the brain stem without obvious invasion. The mass was composed of neoplastic round cells that were compacted in some areas and loosely arranged in other areas. In the compacted areas, the cells were composed of sheets of round cells that tended to form packets and line up along blood vessels while in the more loosely arranged areas the cells were individualized or lining up in rows along small blood vessels. The cells had abundant amphophilic to eosinophilic cytoplasm with well-defined borders. The nucleus was round, often eccentrically located, with central euchromatin, 1 to several nucleoli and peripheral heterochromatin. Six mitoses per 10 high-power fields were noted. The voting choices and results were malignant plasma cell tumor (29%), neuroendocrine tumor (27%), meningeal granular cell tumor (15%), meningioma (10%), plasmacytoid lymphoma (7%), histiocytic sarcoma (4%), diffuse large B-cell lymphoma (2%), osteosarcoma (2%), and other (4%).
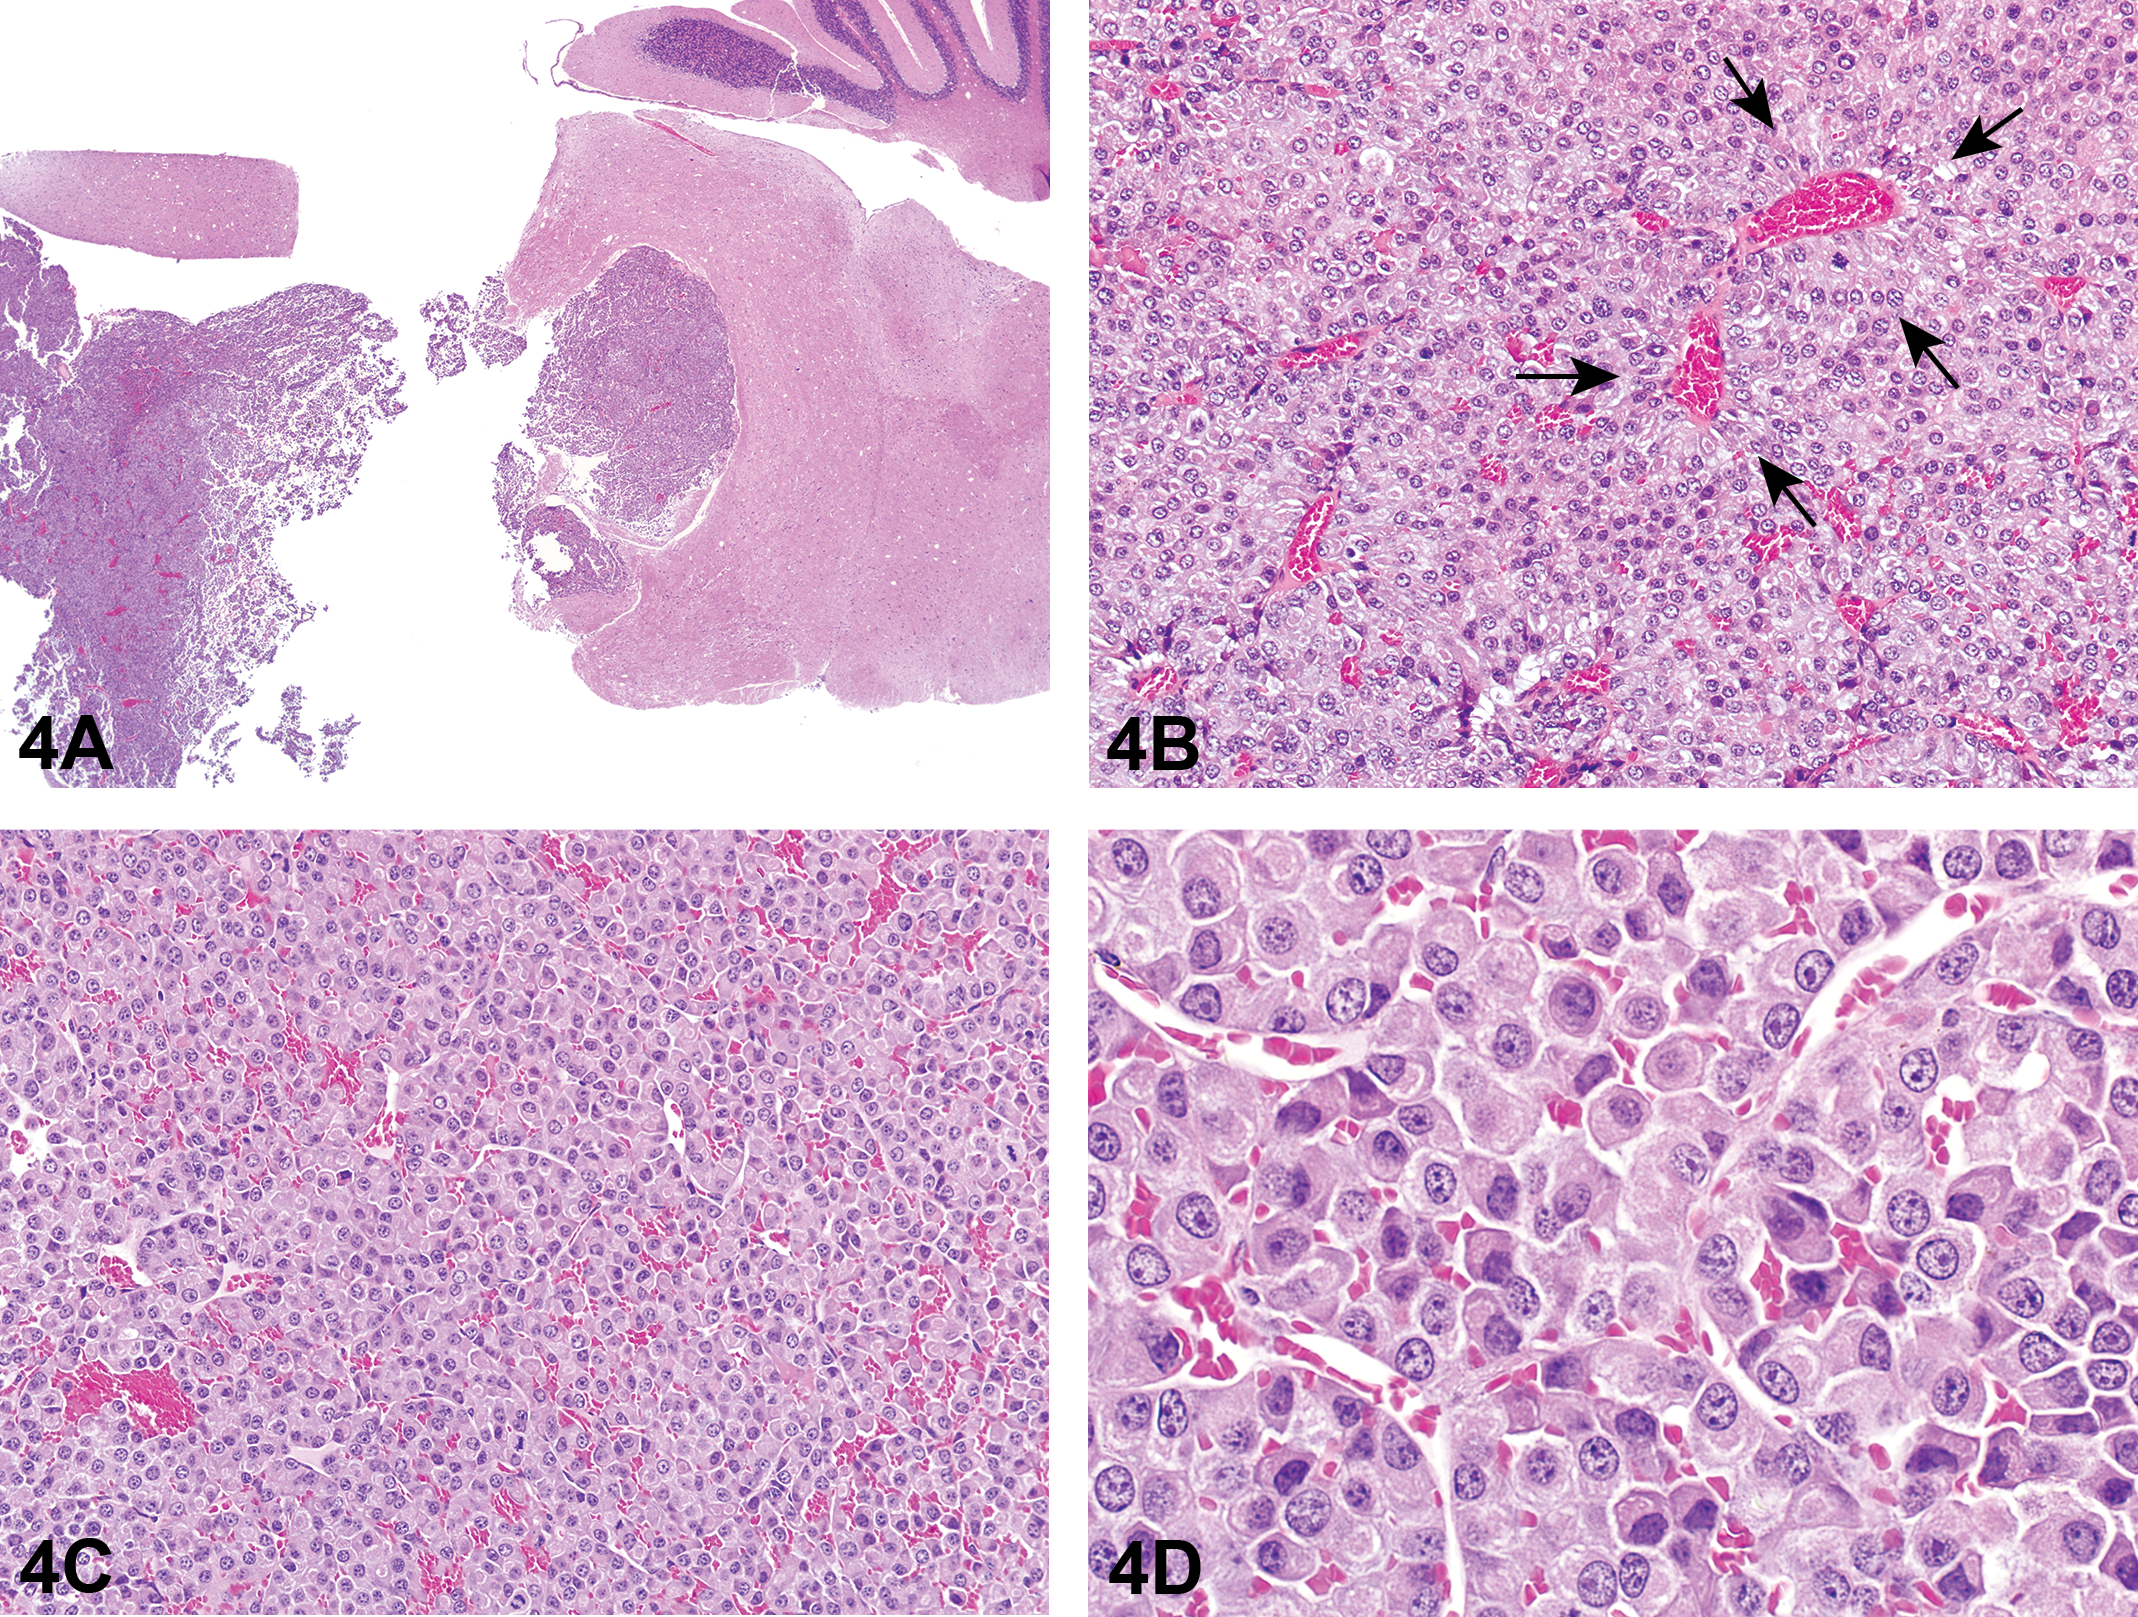
Light microscopy features of a mass in the brain stem of a B6C3F1 female mouse from a 2-year toxicity/carcinogenicity bioassay. Low (A) magnification shows a fairly well-circumscribed mass with displacement of the brain stem. Cells are organized loosely in some areas and are more compacted in others. (B) shows an area of compacted cells in which some cells are lining up along the basal lamina of capillaries (arrows). In other areas, cells appear fairly uniform and are forming packets and rows (C). A higher magnification (D) shows a fairly uniform population of cells organized in packets and rows. The cells have large round nuclei with abundant amphophilic to eosinophilic cytoplasm. The nucleus tends to be centrally or eccentrically located with a perinuclear clear zone. H&E.
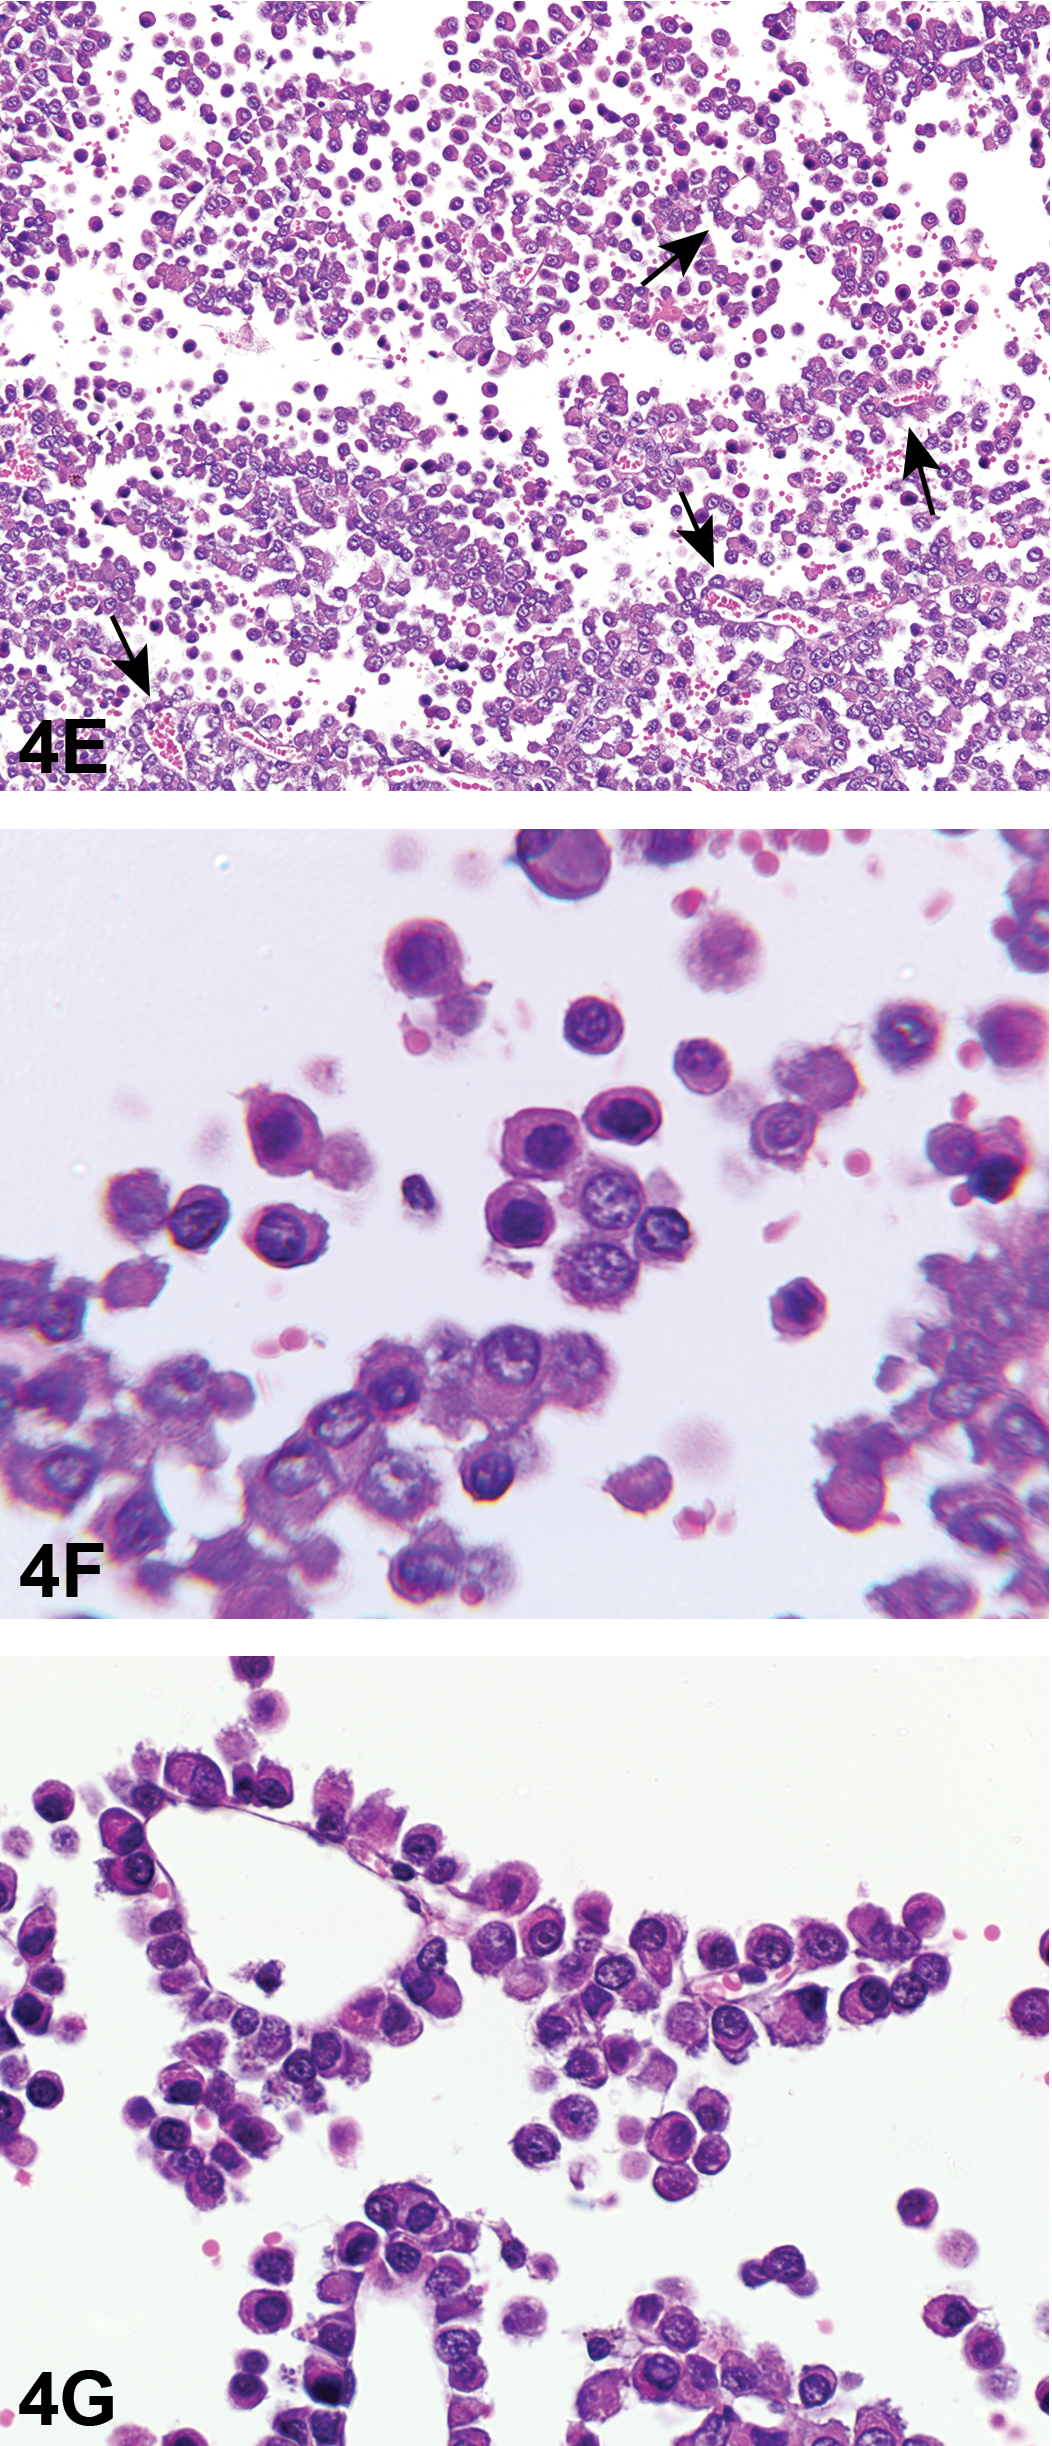
Light microscopy features of a mass in the brain stem of a B6C3F1 female mouse from a 2-year toxicity/carcinogenicity bioassay, continued. (E) is from an area of mass in which the cells are more loosely arranged. Cells appear round to oval and fairly uniform in size and shape. Cells can be seen adherent to the capillary basal lamina (arrows). Frequently, individualized cells often have an eosinophilic cytoplasm which appears slightly granular (F). Cells line up along and adhere to the basal lamina of capillaries (G). (H&E).
Based on light microscopy features, this tumor was diagnosed as a malignant plasma cell tumor by consensus of an NTP PWG. Because there has never been a diagnosis of a plasma cell tumor originating in the brain in prior NTP studies, the pathologist confirmed that it was not a metastatic tumor. This tumor was characterized further by IHC and transmission electron microscopy (TEM). Antibodies against the following markers were used in the immunohistochemical studies: cytoplasmic IgG, cytoplasmic IgM, cytoplasmic IgA, Pax5, CD3, and Iba1. Cytoplasmic immunoglobulin G, M, and A can have either monoclonal or biclonal expression in extramedullary plasma cell tumors (Withrow and Vail 2001) or in multiple myeloma cells, which are malignant plasma cells originating in the bone marrow (Kyle, Robinson, and Katzmann 1981). Pax5 is used for B lymphocyte differentiation; once a B cell becomes a plasma cell, it no longer expresses the Pax5 marker (Feldman and Dogan 2007; Nera et al. 2006; Usui et al. 1997). CD3 is used to identify T cells and it also binds to Purkinje cells in the cerebellum (Gerloff, Knoth, and Volk 1993; Ward et al. 2006). Iba1 is a macrophage marker that also binds to microglial cells and spermatids (Iida et al. 2001; Imai et al. 1996). Photomicrographs of the brain tumor with immunohistochemical stains were shown to the audience (Figure 4H–K). Many, but not all, tumor cells were positive for cytoplasmic staining with IgG or IgM. The IgA, Pax5, Cd3, and Iba1 stains were negative within the tumor cell population (data not shown). The Iba1 stain identified scattered irregular-shaped individual cells between the round cells of the mass; these cells were morphologically consistent with macrophages and therefore would be expected to stain positive for Iba1. These macrophages were considered background macrophages infiltrating the tumor. A table of the expected IHC results for the various voting differentials was presented (Table 8). Plasma cell tumors were expected to be positive for cytoplasmic staining for IgG, IgM, and/or IgA. Biclonality of extramedullary plasma cell tumors has been reported previously in dogs (Kynazidou, Brown, and Lucke 1989) and humans (Uejima et al. 1993). Cases of biclonal multiple myeloma have been reported in humans (Kyle, Robinson, and Katzmann 1981). Biclonal gammopathy was reported in a case of canine multiple myeloma (Jacobs, Couto, and Wellman 1986), and a survey of multiple myeloma in cats resulted in 20% of the cases characterized as having a biclonal gammopathy (Patel et al. 2005). In summary, the IHC results were most consistent with a plasma cell tumor for this brain stem mass.
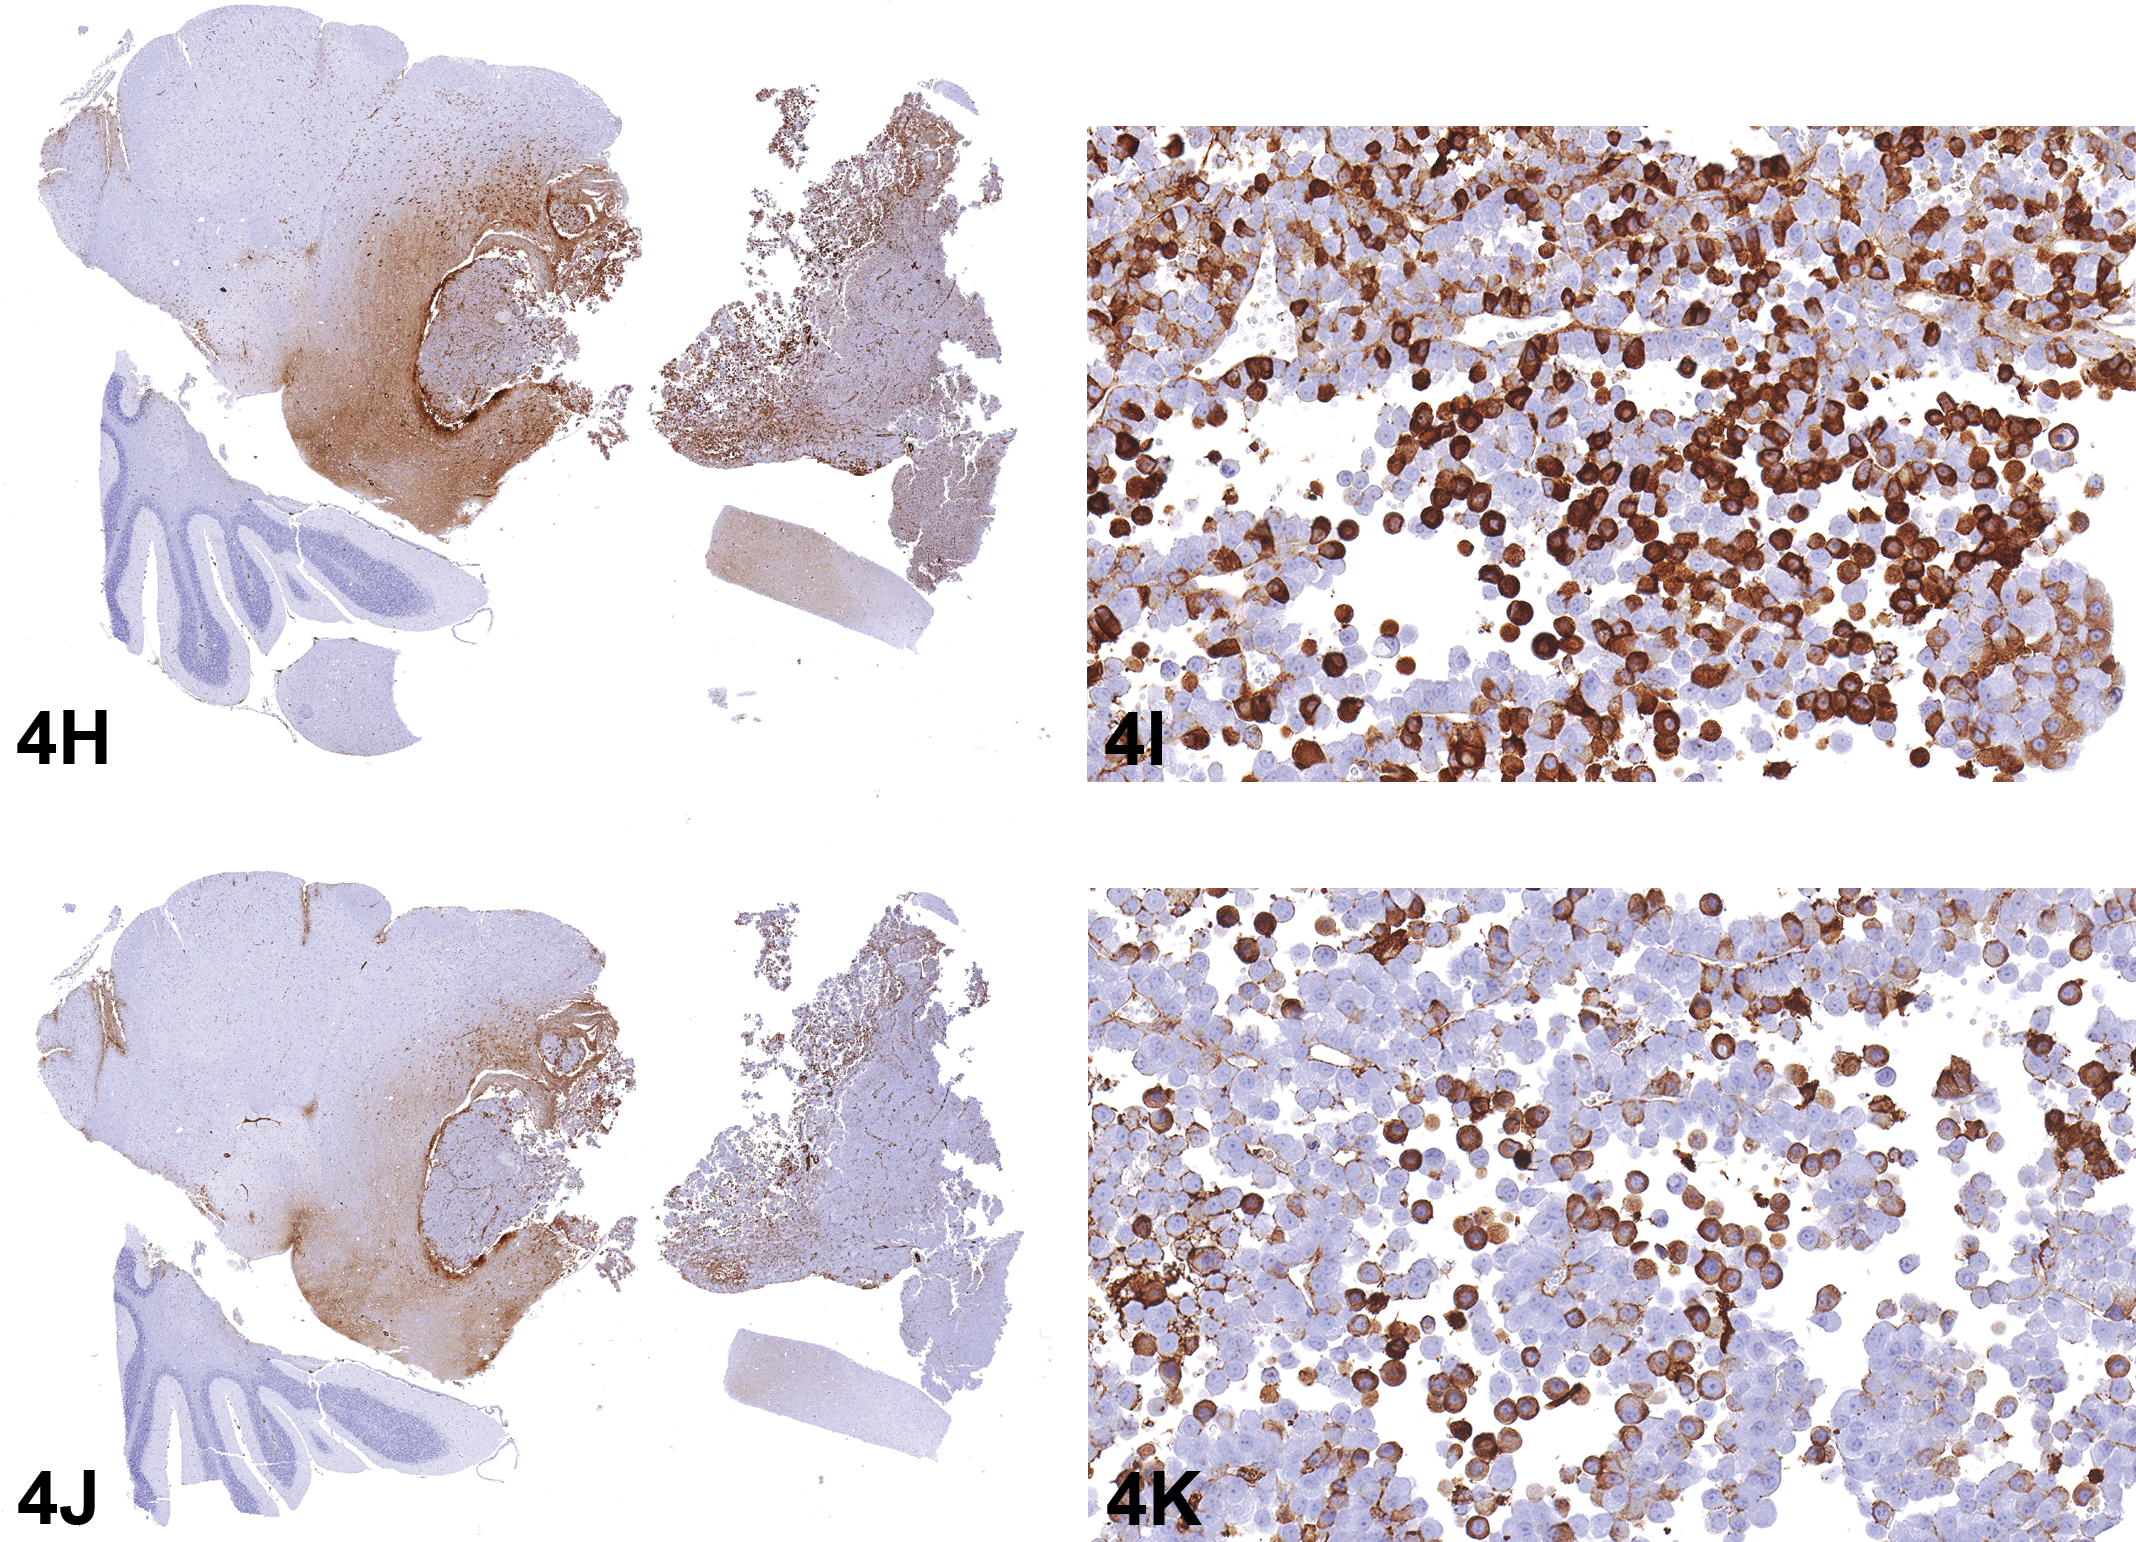
Low and high magnifications of immunohistochemistry findings of the mass in the brain stem of a B6C3F1 female mouse from a 2-year toxicity/carcinogenicity bioassay. Many of the cells within the mass are positive for cytoplasmic IgG (H&I) and IgM (J&K) although some cells are not staining.
IHC and Expected Findings.
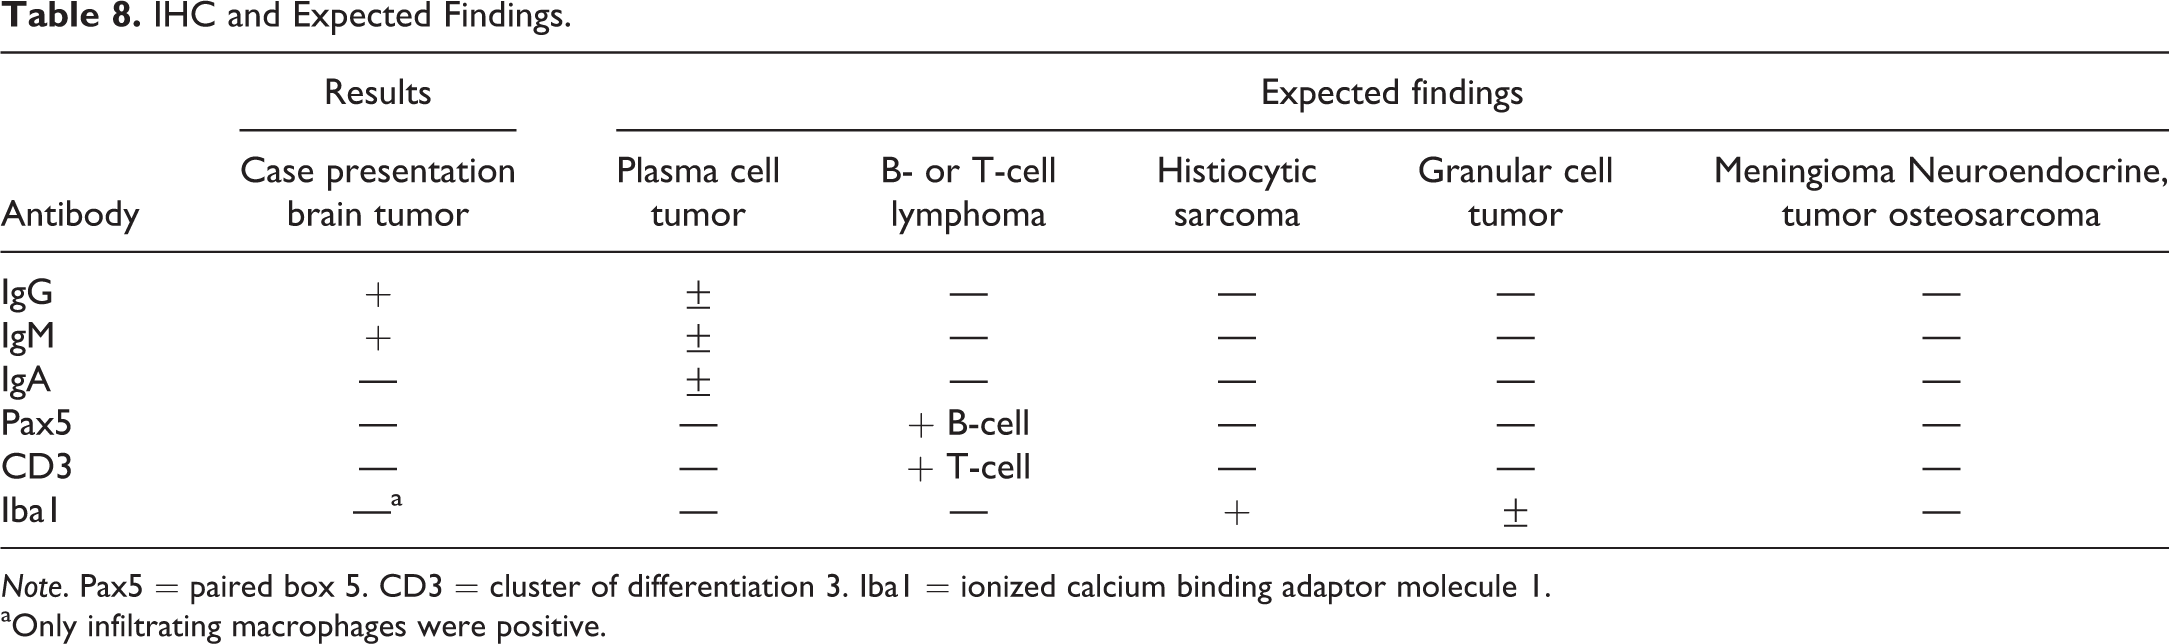
Note. Pax5 = paired box 5. CD3 = cluster of differentiation 3. Iba1 = ionized calcium binding adaptor molecule 1.
aOnly infiltrating macrophages were positive.
Concurrently with the IHC testing, TEM was done on the tumor postformalin fixation. Several images at low to high magnification (Figure 4L–O) were shown to the audience. An electron micrograph of a normal plasma cell was shown to the audience for comparison (data not shown). Significant features noted on the electron micrographs included a uniform population of round to oval cells with abundant stacked rough endoplasmic reticulum, secretory vesicles, a round nucleus with central euchromatin with peripheral heterochromatin and 1 to 2 nucleoli. The ultrastructural features of the tumor cells were consistent with those of a plasma cell (Cheville 2009; Cross and Mercer 1993).
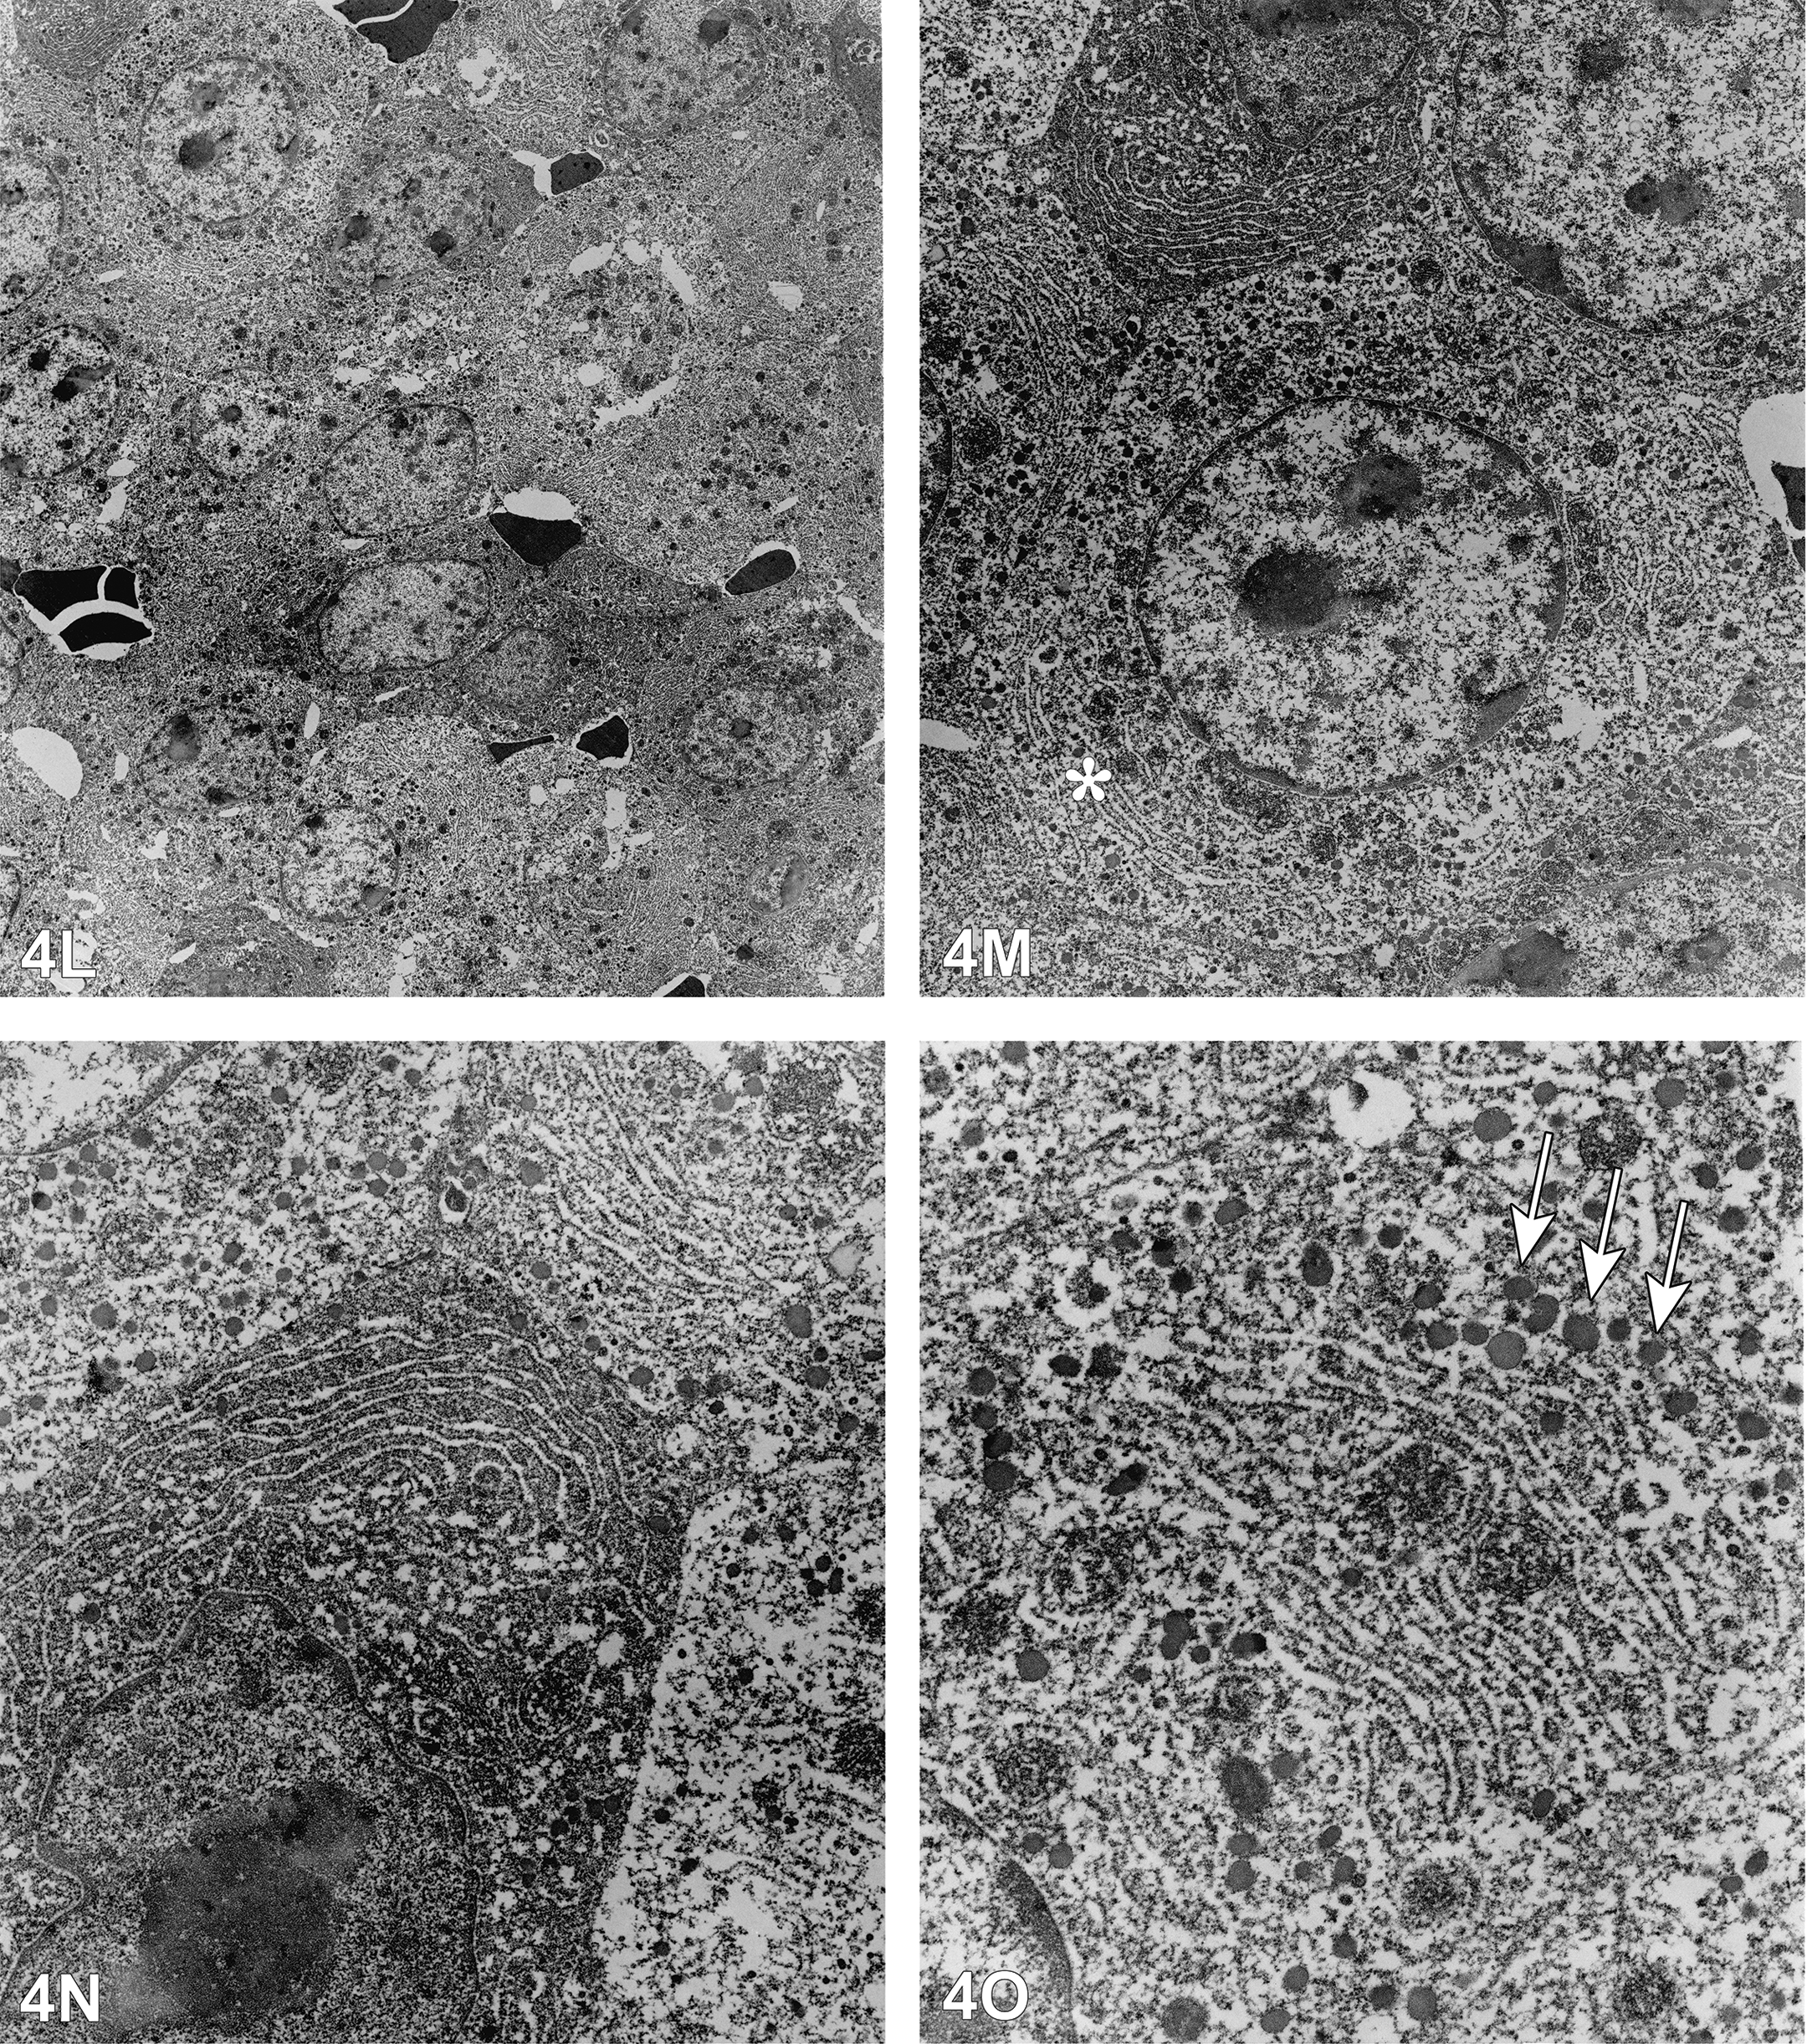
Electron micrographs of the mass in the brain stem of a B6C3F1 female mouse from a 2-year toxicity/carcinogenicity bioassay preserved in formalin. In (L), there are densely packed, fairly uniform round to oval cells with a round nucleus. (M) shows abundant rough endoplasmic reticulum organized in stacks (asterisk), nucleoli, central euchromatin, and a scant peripheral heterochromatin. In (N), there is a stacked arrangement of rough endoplasmic reticulum and vesicles in the cytoplasm. A higher magnification image (O) shows the rough endoplasmic reticulum, secretory vesicles (arrows), and mitochondria. Note the lack of tight junctions, desmosomes/hemidesmosomes, cytoplasmic filaments or psammoma bodies.
The IHC and TEM findings were considered consistent with a plasma cell tumor and supported the original diagnosis based on light microscopy of plasma cell tumor. The rule out of other differentials was discussed. Plasmacytoid lymphoma and diffuse large B-cell lymphoma were expected to be positive with Pax5 (Feldman and Dogan 2007). T-cell lymphomas stain positive with CD3 (Leong, Cooper, and Leong 2003). Histiocytic sarcoma were expected to be Iba1 positive (Pierezan et al. 2014), and granular cell tumors in the meninges would be expected to have many electron dense lysosomes in the cytoplasm (Ghadially 1997). Meningiomas, neuroendocrine tumors, and osteosarcomas were expected to be negative for all of the 6 IHC markers tested in this panel. Ultrastructurally, meningiomas would be expected to have vimentin filaments, desmosomes, hemidesmosomes, tight junctions, interdigitating cell membranes, and/or psammoma bodies (Ghadially 1997). Neoplastic osteoblasts are generally more pleomorphic, have a more invasive growth pattern with irregular borders, and usually are associated with at least some matrix production (collagen or osteoid). At the ultrastructural level, osteoblasts can have abundant rough endoplasmic reticulum but should also have some evidence of collagen fibrils or matrix production.
In summary, this tumor in the brain was diagnosed as a malignant plasma cell tumor based on the light microscopic morphology, positive staining for cytoplasmic IgG and IgM, negative IHC for B or T lymphocyte or macrophage markers and ultrastructural features of abundant rough endoplasmic reticulum, vesicles, occasional mitochondria, and uniform round cell shape.
Plasma cell tumors are rare in mice (Parsons et al. 1961) and rats, common in the skin and alimentary tract of dogs, and can be seen occasionally in cats and horses. Multiple myeloma has been diagnosed in dogs (Jacobs, Couto, and Wellman 1986) and cats (Patel et al. 2005), and animal models for malignant myeloma in humans have been developed in rats (Smolens, Venkatachalam, and Stein 1983) and mice (Fryer et al. 2013). However, extramedullary plasma cell tumors are extremely rare in the brain of humans (Ferrari et al. 2012) and animals. Two cases of primary extramedullary plasma cell tumors in the brain have been reported in dogs (Sheppard et al. 1997; Van Wettere et al. 2009). To the author’s knowledge, no cases of primary extramedullary plasma cell tumor in the brain of rats or mice have been published. Plasma cell tumors in any tissue in rats or mice are rare in NTP studies, and a search of 1,279 studies (600 chronic, 679 subchronic) in the NTP database dating back to 1982 did not reveal a diagnosis of an extramedullary plasma cell tumor in the brain.
The important take-home points from this presentation were (1) round cell tumors are often difficult to classify without the help of IHC or EM and (2) there are no known previously published reports of spontaneous or treatment-related extramedullary plasma cell tumors in the brain of rodents.
During audience discussions, 1 attendee recommended a special stain for neuroendocrine granules in order to verify the tumor was not of neuroendocrine origin. Dr. Kooistra noted that the reason a special stain for neuroendocrine granules had not been done previously was that the cells did not appear to contain neuroendocrine granules on ultrastructural analysis. Another suggestion was to apply both an anti-IgG and anti-IgM antibodies simultaneously in order to see whether there is a population of cells that do not stain for either IgG or IgM. If this were found to be the case, then an attempt to look at those cells at the ultrastructural level and with additional IHC antibodies or special stains would be warranted. However, another attendee in the audience noted that plasma cell tumors often do not have totally uniform staining throughout, and therefore, a lack of staining in some cells would not automatically rule out a plasma cell tumor. Another attendee in the audience felt that the plasma cells were secondary infiltrating inflammatory cells and that they differed morphologically from other cells in the mass based on light microscopy examination. The attendee suggested that perhaps additional EM studies may reveal a second population of cells, possibly neuroendocrine cells, if a concentrated effort was made to find a second population of cells among the plasma cells. In response to that suggestion, another attendee stated that it would be highly unlikely to have an almost pure population of plasma cells infiltrating a tumor without any other evidence of inflammation such as other inflammatory cells (lymphocytes, neutrophils) or necrosis. Following these interesting comments, Dr. Kooistra noted that if enough tissue is available, additional special stains and EM could be done to further study this tumor.
Getting to the Heart of the Matter
Dr. Susan A. Elmore (NTP, NIEHS, RTP, NC) presented 3 heart cases for voting, all with the same signalment and all with the same voting choices. They were male and female Hsd: SD rats from multiple 2-year gavage carcinogenicity and toxicity bioassays. All were control animals and terminal sacrifices. Due to space constraints, not all images presented for voting are included in this synopsis.
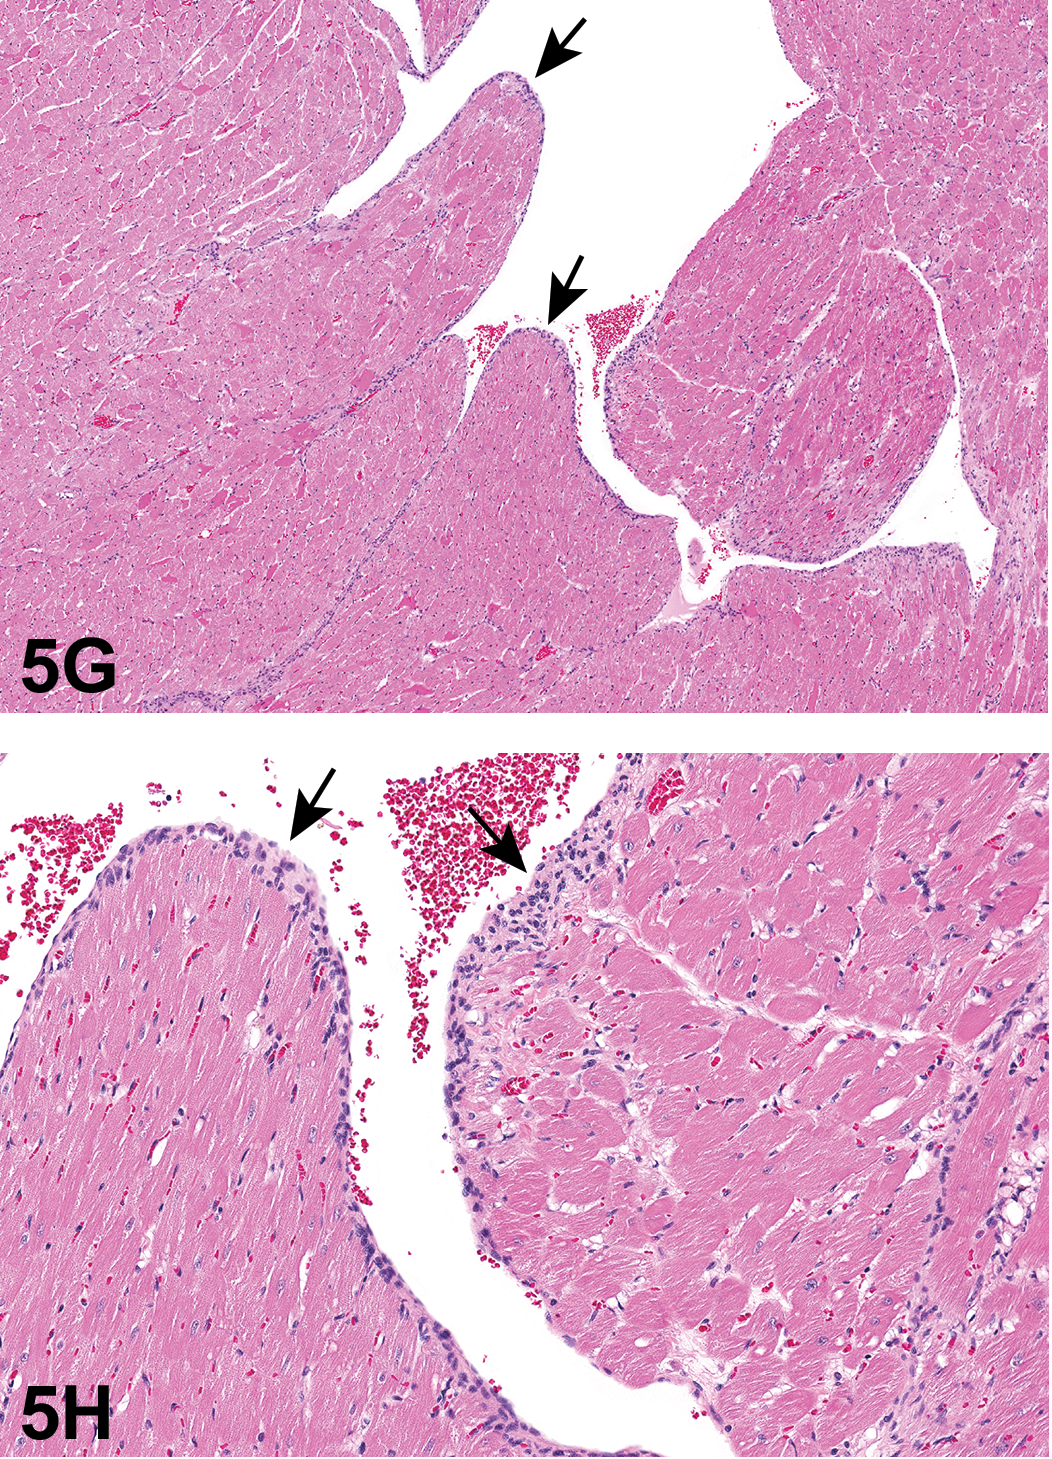
The first case for voting was a hypercellular lesion that involved about one-third of the entire right ventricular subendocardium, including papillary muscles (Figure 5A–D). The cells had oval to elongate basophilic nuclei with eosinophilic cytoplasm with deeply eosinophilic wavy extracellular material. The cells were both subjacent to an intact endocardium and infiltrating into the underlying myocardium. Within the papillary muscles, the cells were about 25 cells thick in areas and replaced the normal myocardium. The voting choices and results were Schwann cell hyperplasia (45%), endocardial hyperplasia (28%), schwannoma (15%), cardiomyopathy (6%), neurofibroma (3%), schwannomatosis (2%), and Anitschkow cell sarcoma (1%). There were no votes for neurilemmoma (also called neurilemoma) or neurosarcoma.
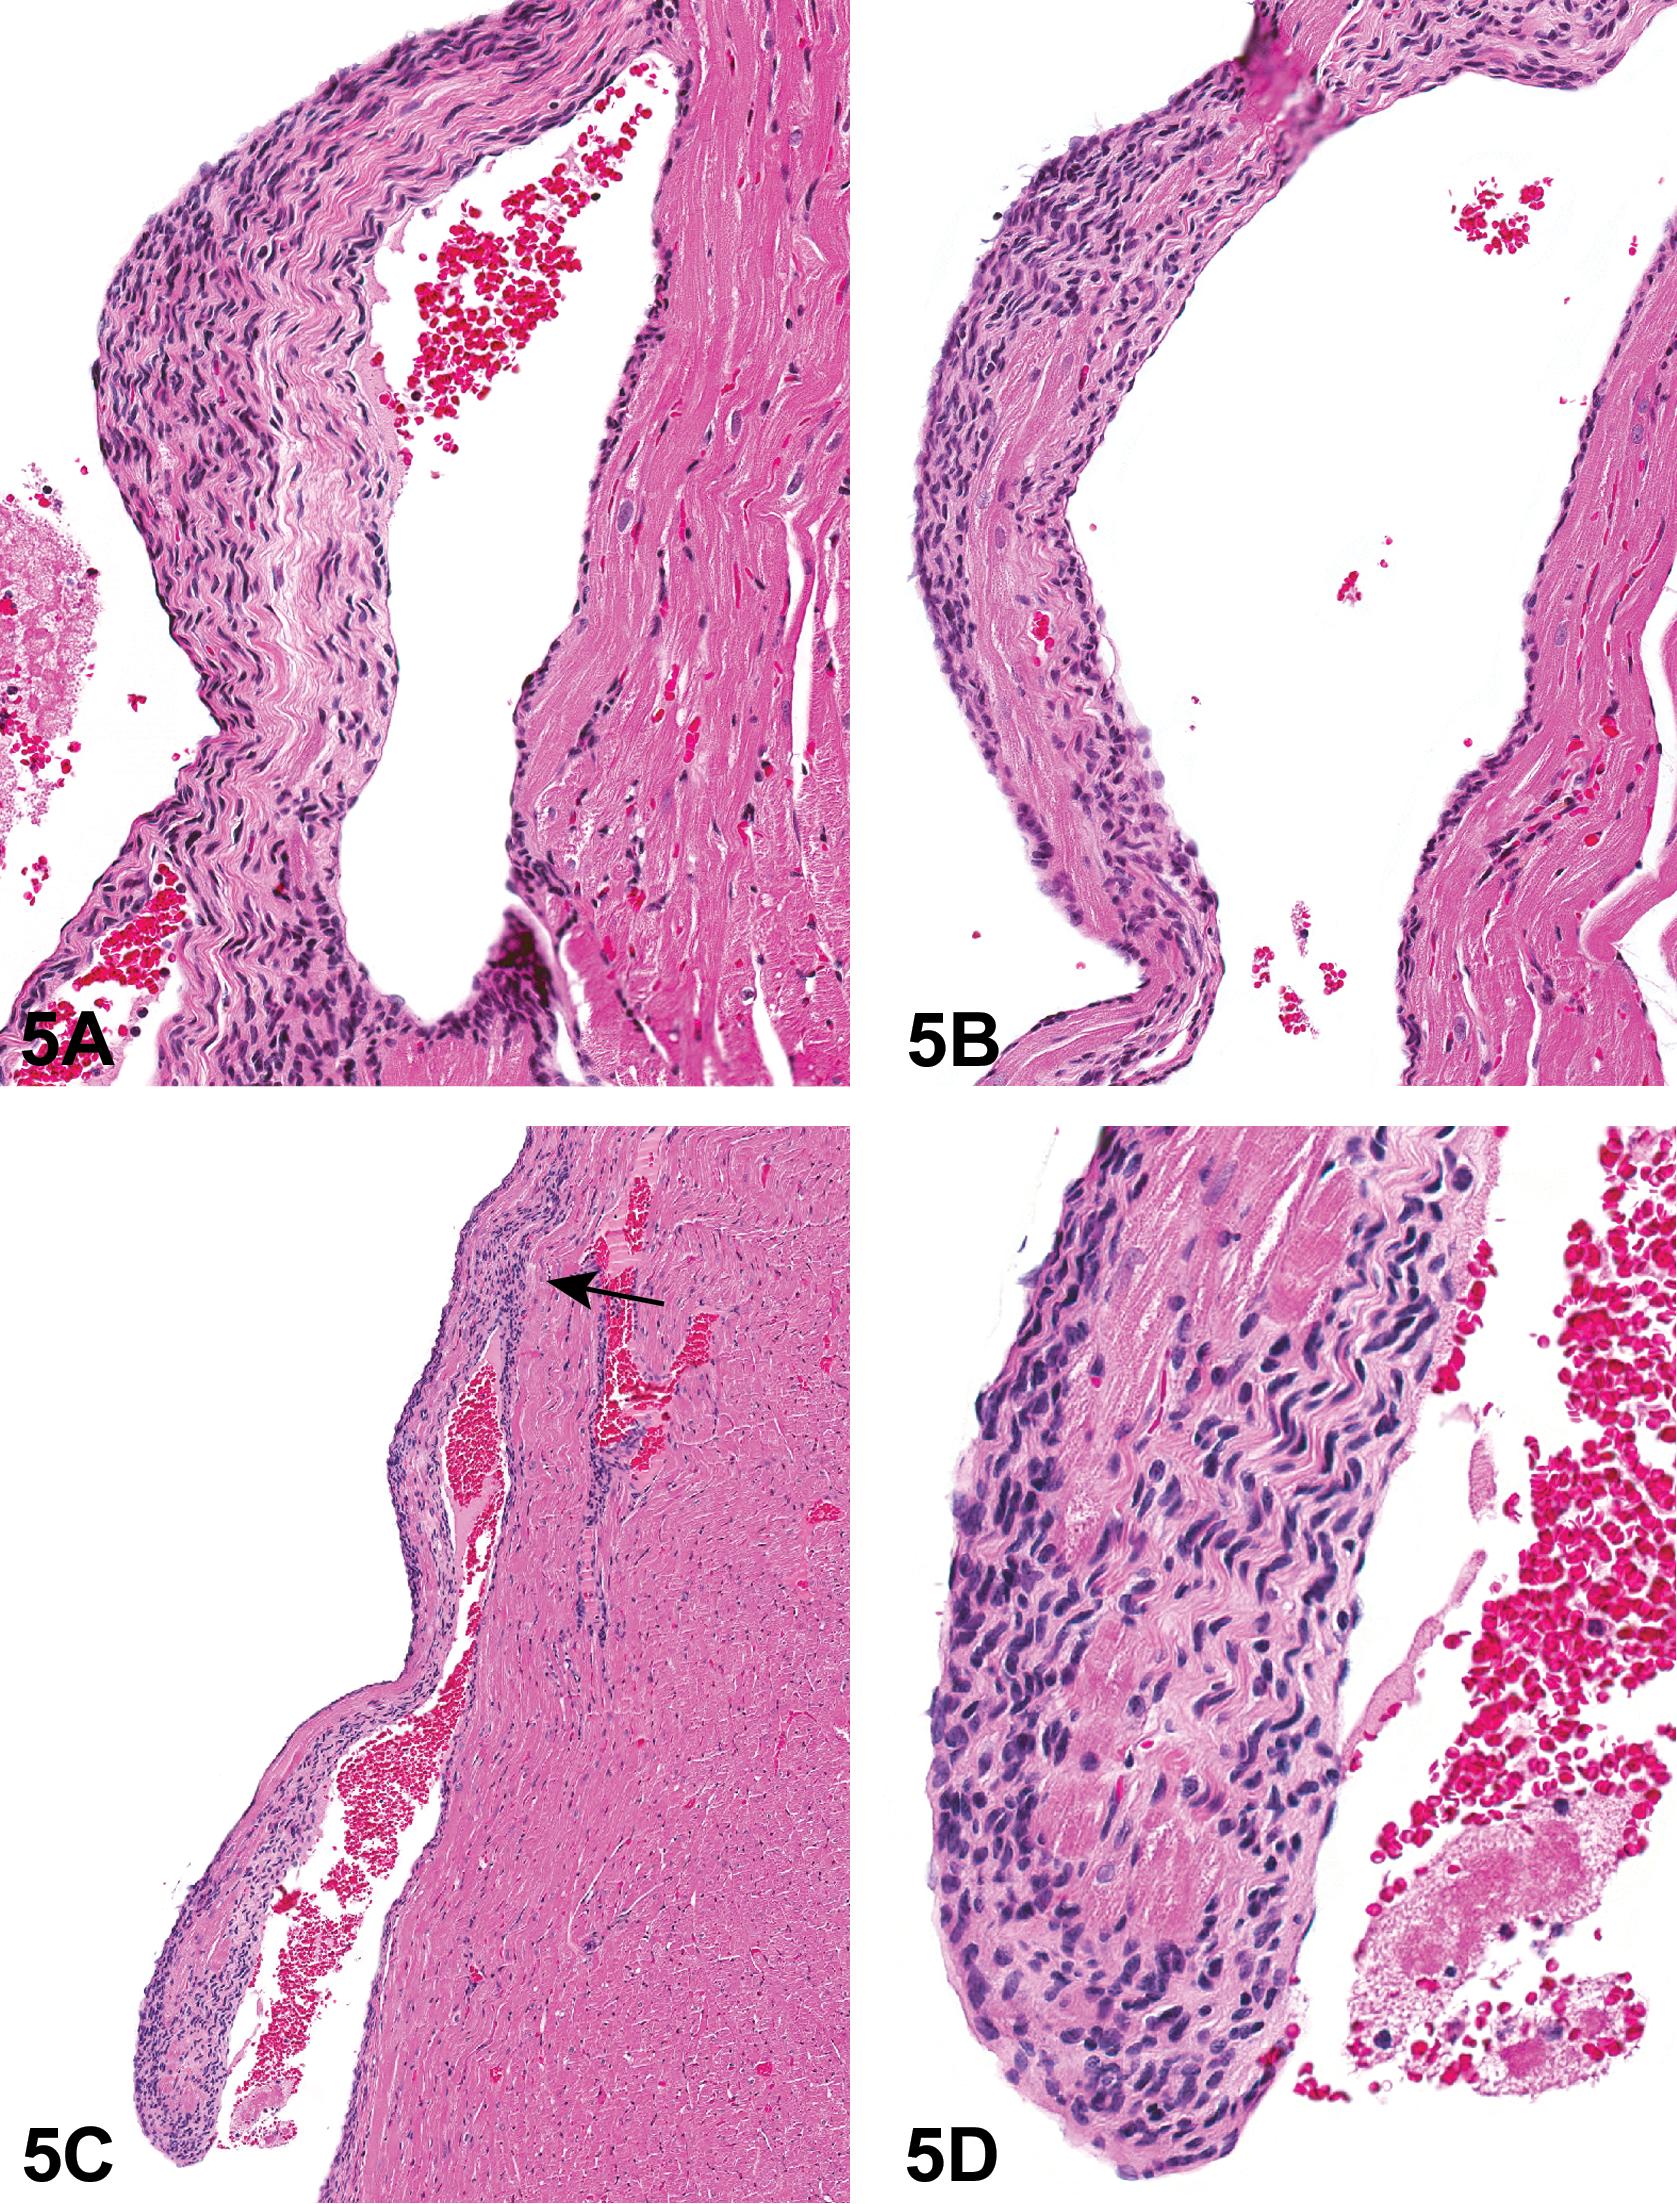
Proliferative cardiac lesion from a control Harlan Sprague-Dawley (Hsd: SD) rat from a National Toxicology Program (NTP) 2-year toxicity and carcinogenicity bioassay that was presented as case 1. This was a hypercellular lesion that involved about one third of the entire right ventricular subendocardium, including papillary muscles. These images show papillary muscles with a population of proliferative cells that have oval to elongate basophilic nuclei and eosinophilic cytoplasm with deeply eosinophilic wavy extracellular material (A–D). The cells are subjacent to an intact endocardium and also infiltrate the underlying myocardium (C, arrow). Within the papillary muscles, the proliferative cells surround and replace the normal myocardium (D). H&E.
The second case for voting was a very small lesion within the myocardial wall of the left ventricle (Figure 5E ). The cells had round to oval basophilic nuclei and eosinophilic to amphophilic cytoplasm. The cells were either spread out in rows, 2 to 8 cells thick, between cardiomyocytes or, in one focal area, 19 cells thick in the widest section. Anitschkow cells, with centrally located, linear condensed chromatin, were also present. The voting choices and results were cardiomyopathy (45%), Schwann cell hyperplasia (38%), endocardial hyperplasia (8%), schwannoma (6%), and neurofibroma (3%). There were no votes for neurilemmoma (0%), Anitschkow cell sarcoma (0%), schwannomatosis (0%), or neurosarcoma (0%).
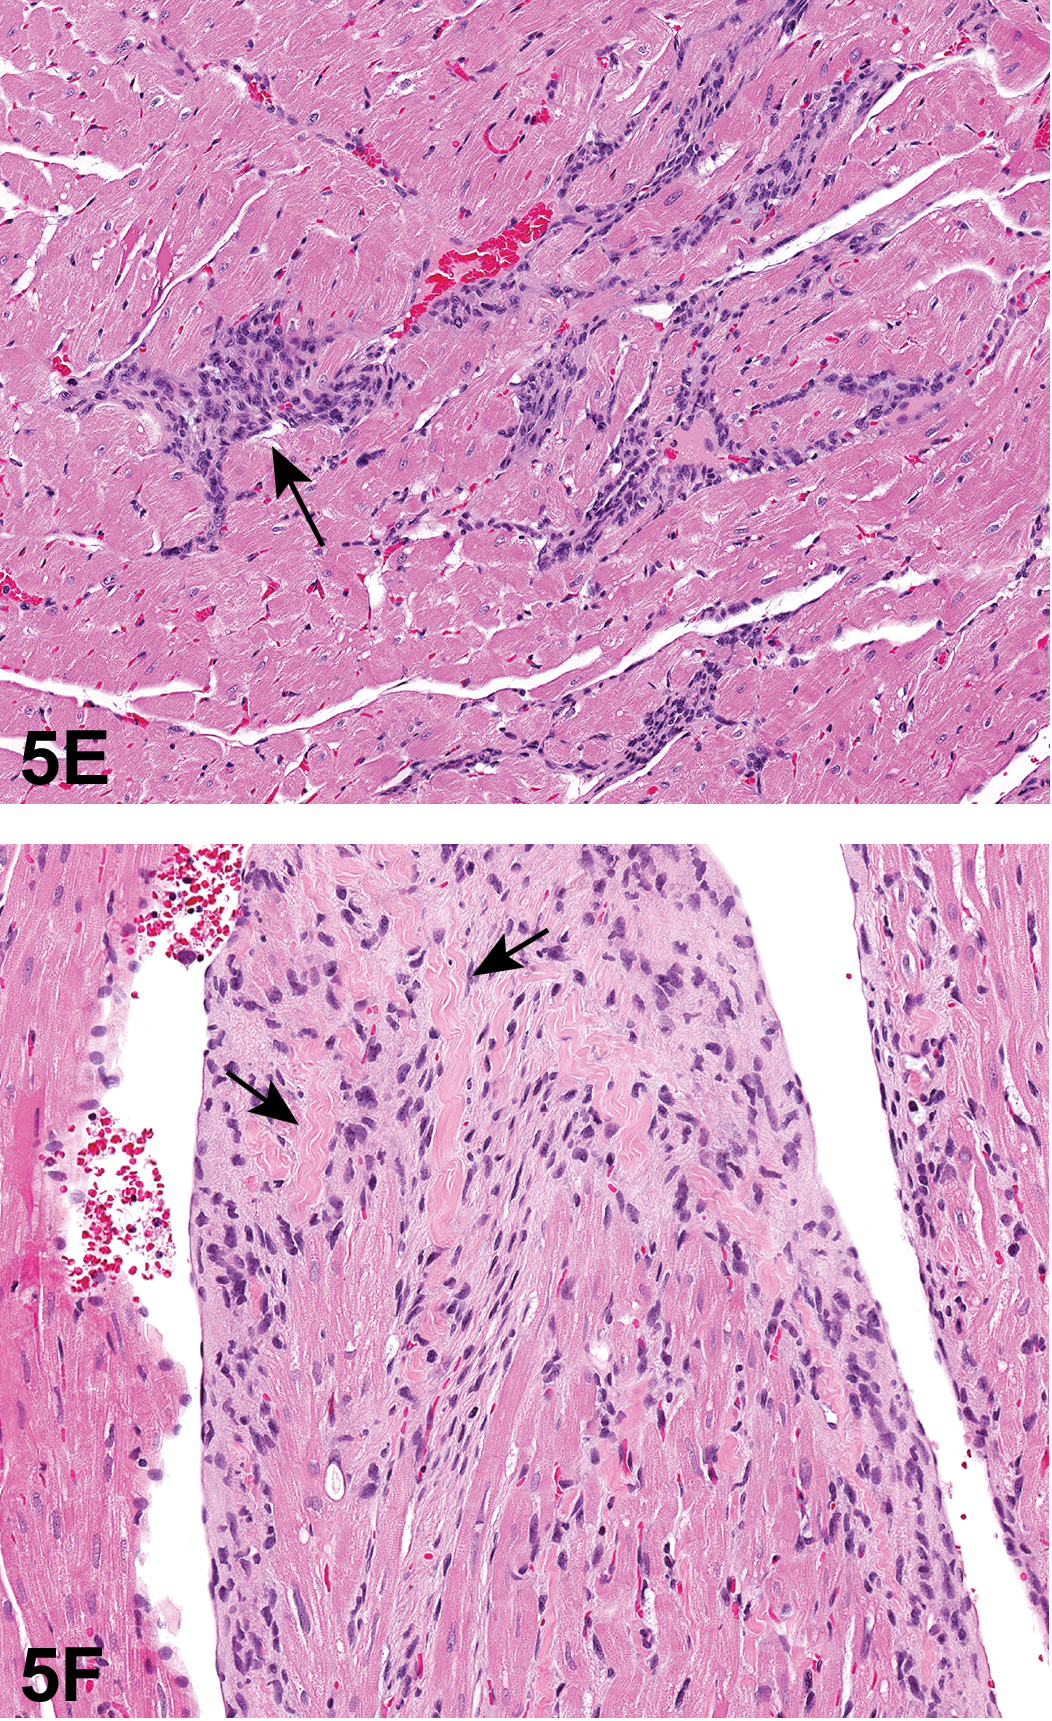
Proliferative cardiac lesions from control Hsd: SD rats from an NTP 2-year toxicity and carcinogenicity bioassay that were presented as the second (E) and third (F) cases. (E) is a small intramural cardiac lesion within the left ventricle. The cells had round to oval basophilic nuclei with eosinophilic to amphophilic cytoplasm. The cells are either spread out in rows, 2 to 8 cells thick, between cardiomyocytes or, in one focal area, 19 cells thick in the widest section (arrow). (F) is another cardiac small lesion with cells similar in appearance to those in E. This lesion is both subjacent to the endocardium and within the myocardium of the papillary muscles. At the tip of the papillary muscle (F), there is myocardium replacement by these infiltrating cells as well as eosinophilic wavy extracellular material (arrows; elastic fibers). H&E.
Classic cardiac Schwann cell hyperplasia from a 2-year-old control male SD rat. The noninvasive elongate cells lining the subendocardium are 1 to 4 cells thick (arrows). The elongate cells have faintly eosinophilic cytoplasm, indistinct cell borders and round, ovoid, or slightly elongated nuclei. H&E.
The third case for voting involved multiple papillary muscles of the left ventricle (Figure 5F). The cells were similar in appearance to those in the second voting case and occurred both subjacent to the endocardium and within the myocardium of the papillary muscles. At the tip of the papillary muscle, there was myocardium replacement by these infiltrating cells as well as eosinophilic wavy extracellular material. The voting choices and results were Schwann cell hyperplasia (36%), cardiomyopathy (32%), schwannoma (14%), endocardial hyperplasia (13%), neurofibroma (3%), and neurilemmoma (1%). There were no votes for Anitschkow cell sarcoma, schwannomatosis, or neurosarcoma.
The goal of this presentation was to discuss current diagnostic dilemmas and criteria for cardiac Schwann cell hyperplasia and schwannoma which were, according to Dr. Elmore, the 2 best choices for all of the 3 voting cases. Besides cardiomyopathy, the other foils were prior terms used for these 2 lesions. To avoid confusion of this case with cardiomyopathy, the differences between cardiomyopathy and Schwann cell proliferative lesions were next discussed. Cardiomyopathy begins as coagulative necrosis of myocardial fibers and may progress to focal loss of myofibers or necrosis. The cardiomyocytes become deeply eosinophilic and hyalinized with pyknotic nuclei. Macrophages, lymphocytes, and occasional neutrophils may be present. Fibrosis and mineralization may also be present, and it is the fibrosis that can make it difficult to distinguish this from Schwann cell proliferative lesions. Dr. Michael Boyle presented a different set of cases highlighting this diagnostic dilemma at the 2012 NTP Satellite Symposium (Elmore et al. 2013).
Schwann cells in the body are the principal glia of the peripheral nervous system and can be either myelinating or nonmyelinating. They surround the axons of the peripheral nerves, forming the myelin sheath of myelinated nerve fibers, and providing support for nonmyelinated nerve fibers. This sheath is also call neurolemma or neurilemma. The axons and glial cells are in intimate physical contact with each other, each influencing and regulating the development, function, and maintenance of the other (Jessen and Mirsky 2005; Learte and Hidalgo 2007; Woodhoo and Sommer 2008).
Schwann cells in the heart are known to localize to hyperpolarization activated cyclic nucleotide gated potassium channel 4 (HCN4) rich areas in embryonic and neonatal hearts, especially sinoatrial and atrioventricular nodes, and later populate other regions of the myocardium (Fregoso and Hoover 2012). HCN4 is a K/Na hyperpolarization-activated cyclic nucleotide-gated channel 4 protein encoded by the HCN4 gene. HCN channels are intermembrane proteins that are nonselective ligand-gated cation channels in the plasma membrane of the heart and serve as “pacemaker channels” because they help to generate rhythmic activity within groups of cardiomyocytes. The early presence and regional distribution in neonatal hearts suggests that these cells have an active role in controlling the growth and distribution of cholinergic nerves in the developing heart. They are known to have important effects on axonal growth and guidance by releasing trophic factors, contributing to extracellular matrix, and bundling of axons (Watabe et al. 1995). Cardiac Schwann cells parallel the distribution of cholinergic nerve fibers in the adult atria, are also associated with noncholinergic nerve fibers, increase in abundance in all areas of the myocardium (ventricles and atria) with increasing age, and are also present in the epicardium. They can be detected with S100 IHC (Fregoso and Hoover 2012).
The 2 proliferative lesions of cardiac Schwann cells in rats are either Schwann cell hyperplasia or schwannoma (Alison et al. 1987; Novilla et al. 1991). Schwann cell hyperplasia can be either intramural or subendocardial. The subendocardial hyperplasia is reportedly found mostly in the left ventricle, on the interventricular septum, but can be found anywhere in the heart. It begins as a proliferation of cells between the endocardium and the underlying myocardium and is variably S100 positive. It may represent a continuum with schwannoma and is rarely seen before 18 months of age. The cellular features of rat cardiac subendocardium Schwann cell hyperplasia that Dr. Elmore presented were from the draft INHAND cardiovascular document and are presented in Table 9. One example of classic cardiac Schwann cell hyperplasia from a 2-year-old control male rat was presented (Supplemental Figure 1A and B). The elongate cells lining the subendocardium were 1 to 4 cells thick.
Cellular Features of Rat Cardiac Subendocardium Schwann Cell Hyperplasia.a
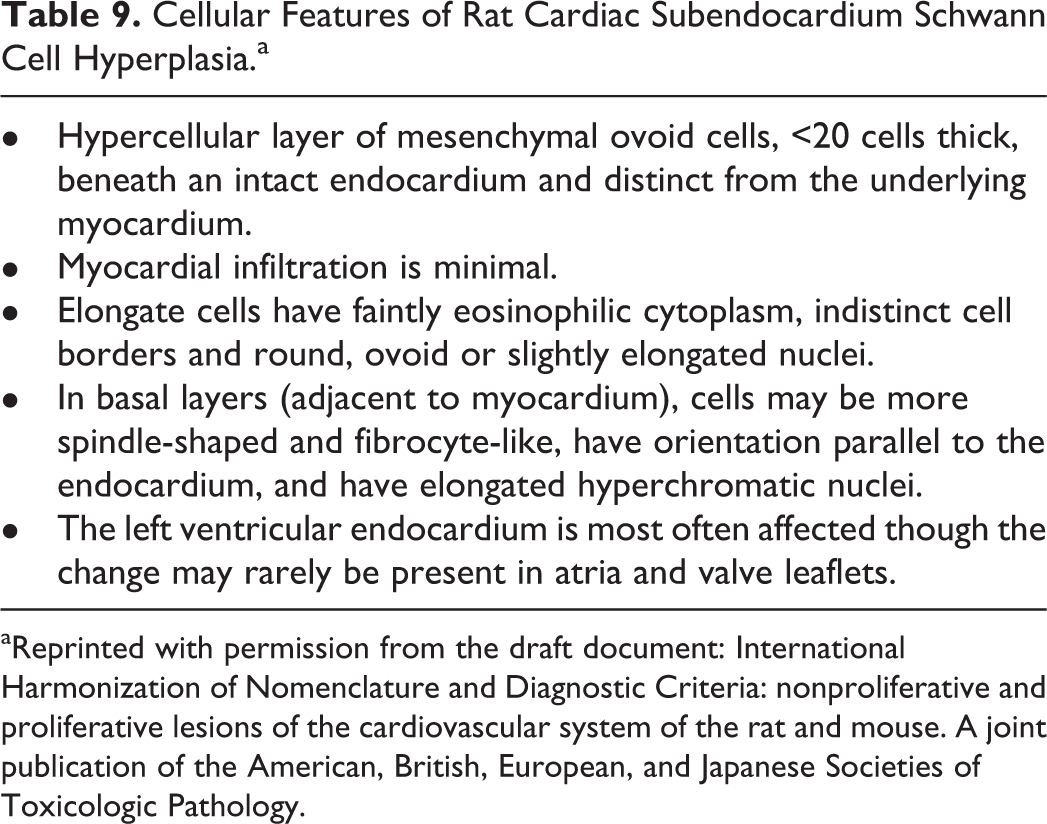
aReprinted with permission from the draft document: International Harmonization of Nomenclature and Diagnostic Criteria: nonproliferative and proliferative lesions of the cardiovascular system of the rat and mouse. A joint publication of the American, British, European, and Japanese Societies of Toxicologic Pathology.
Cardiac schwannomas occur in a variety of rat strains and have not been described in mice. There appears to be a slight male preponderance. There are endocardial and intramural (myocardial) variants, and both are variably S100+ (Ruben et al. 1997). They are generally malignant with local invasion more common than distant metastases. Elastic fiber and collagen formation, produced by the neoplastic Schwann cells, may be present (Figure 5I). Anitschkow cells may also be present. Anitschkow cells have an ovoid nucleus, and the chromatin is condensed toward the center of the nucleus, sometimes in a wavy rod-like pattern so that it resembles the shape of a caterpillar (Figure 5J). In cross section, they may have the appearance of an owl eye. Anitschkow cells occur in striated muscle cells, histiocytes, Schwann cells, and, rarely, cells outside of the heart. It is postulated that these cells indicate cellular immaturity rather than any specific cell type because they are generally associated with a response to injury. The cellular features of rat cardiac schwannoma that Dr. Elmore presented were from the draft INHAND cardiovascular document and are presented in Table 10.
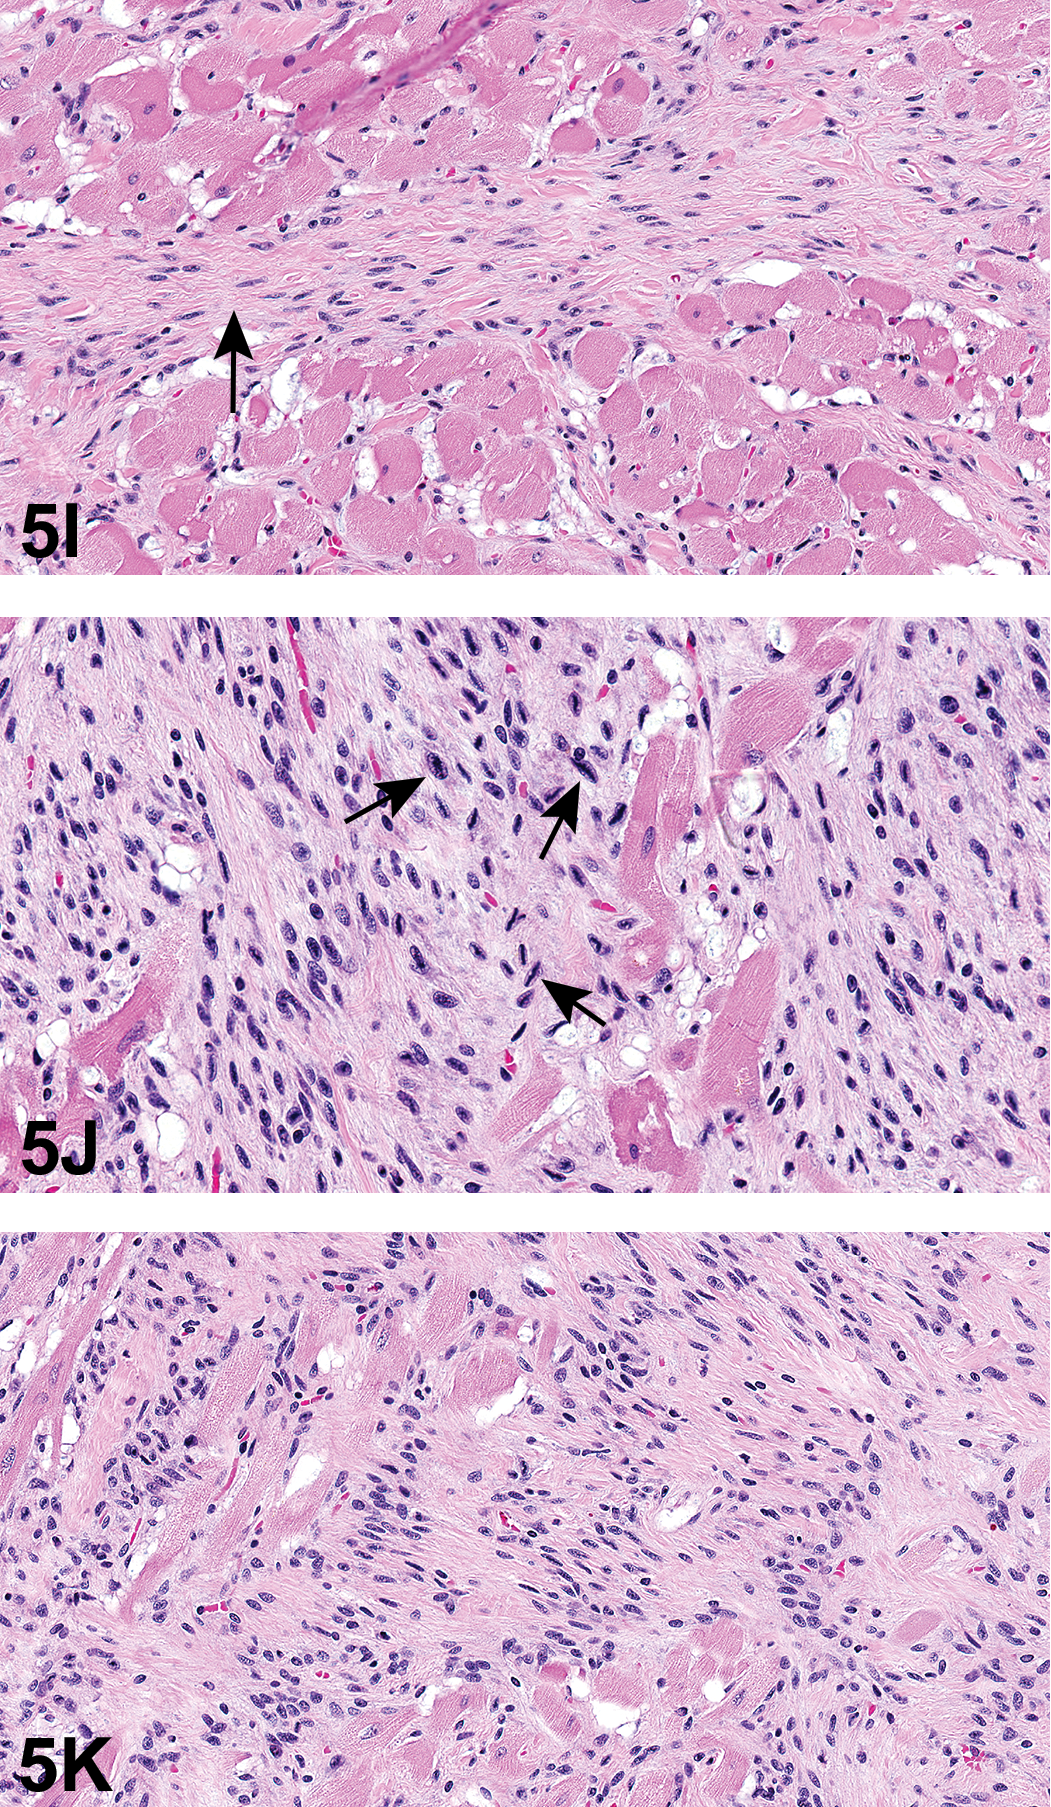
Examples of features of cardiac schwannomas. (I) is a high magnification of a region of cardiac schwannoma with elastic fibers and collagen formation (arrow), produced by the neoplastic Schwann cells. (J) is a high magnification of a region of cardiac schwannoma illustrating Anitschkow cells. Anitschkow cells have an ovoid nucleus and the chromatin is condensed toward the center of the nucleus, sometimes in a wavy rod-like pattern so that it resembles the shape of a caterpillar (J, arrows). (K) is a high magnification of a cardiac schwannoma with an Antoni A pattern, characterized by nuclear palisading. H&E.
Cellular Features of Rat Cardiac Schwannoma.a
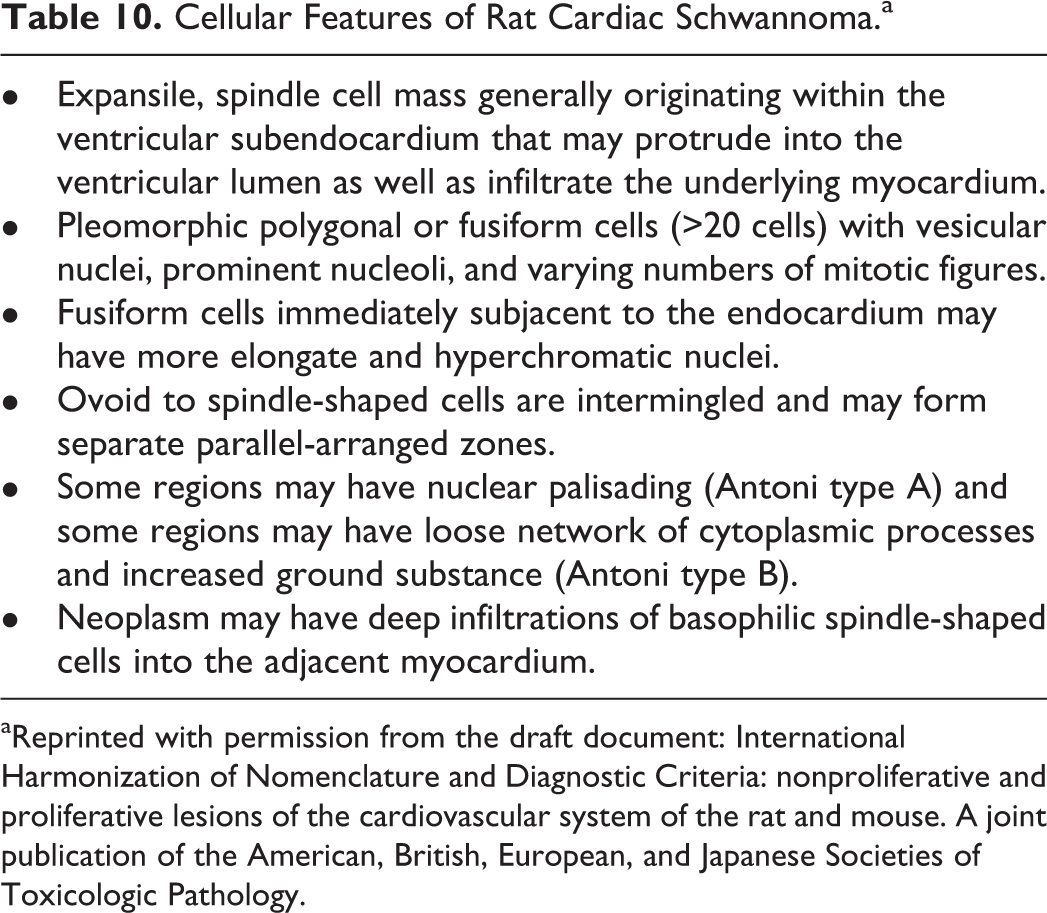
aReprinted with permission from the draft document: International Harmonization of Nomenclature and Diagnostic Criteria: nonproliferative and proliferative lesions of the cardiovascular system of the rat and mouse. A joint publication of the American, British, European, and Japanese Societies of Toxicologic Pathology.
Also presented were tables summarizing important differences and similarities between rat cardiac Schwann cell proliferative lesions (Table 11) and the current NTP historical control data for proliferative cardiac Schwann cell lesions in Hsd: SD rats (Table 12). Images were presented that illustrated a classic rat intramural cardiac schwannoma, Antoni type A pattern (Figure 5K), verocay-like bodies, classic rat endocardial schwannoma, and a classic intramural rat endocardial schwannoma. Other illustrations included 2 cardiac schwannomas with different presentations (e.g., Figure 5L) and an example of a very small intramural cardiac schwannoma (Figure 5M). Two challenging lesions shown to the audience were a very small lesion at the apex of the heart (Figures 5N and O), and another lesion that was within the myocardium (intramural) and extended out in finger-like projections rather than forming a mass (Figure 5P).
Comparison of Rat Cardiac Schwann Cell Hyperplasia and Schwannoma.
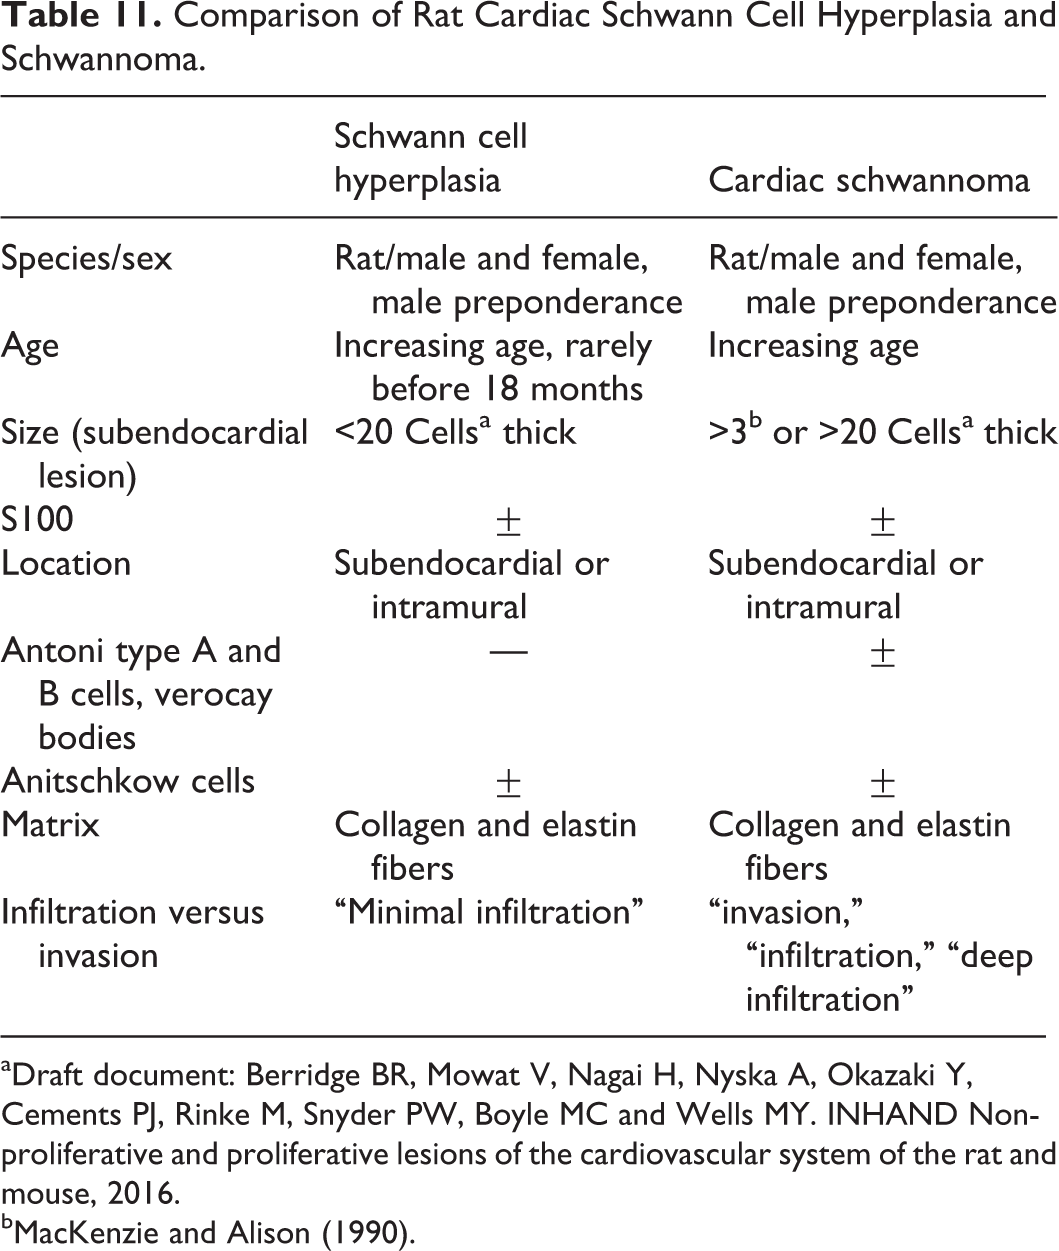
aDraft document: Berridge BR, Mowat V, Nagai H, Nyska A, Okazaki Y, Cements PJ, Rinke M, Snyder PW, Boyle MC and Wells MY. INHAND Non-proliferative and proliferative lesions of the cardiovascular system of the rat and mouse, 2016.
2016 NTP Historical Control Data for Proliferative Cardiac Schwann Cell Lesions in Harlan Sprague-Dawley Rats.
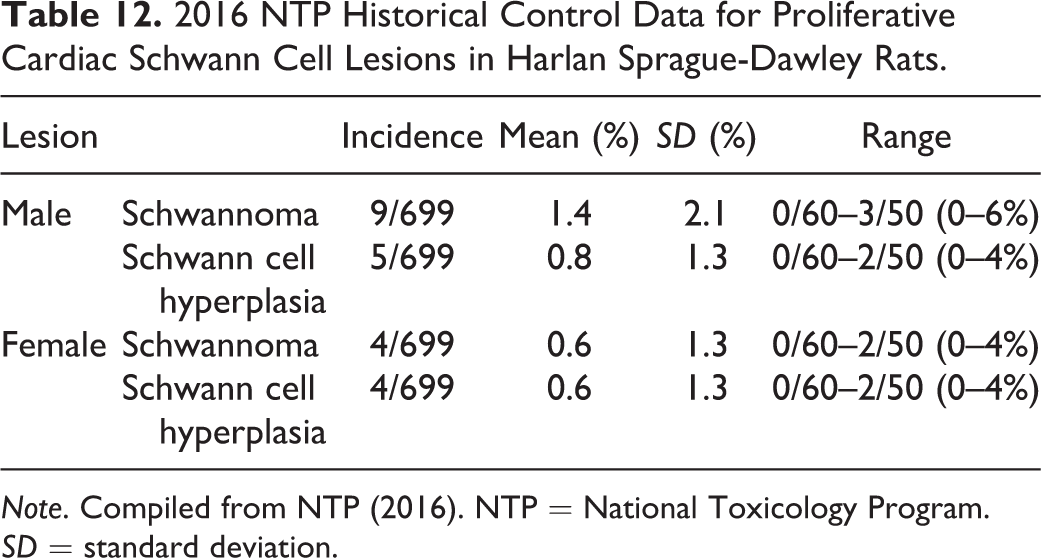
Note. Compiled from NTP (2016). NTP = National Toxicology Program. SD = standard deviation.
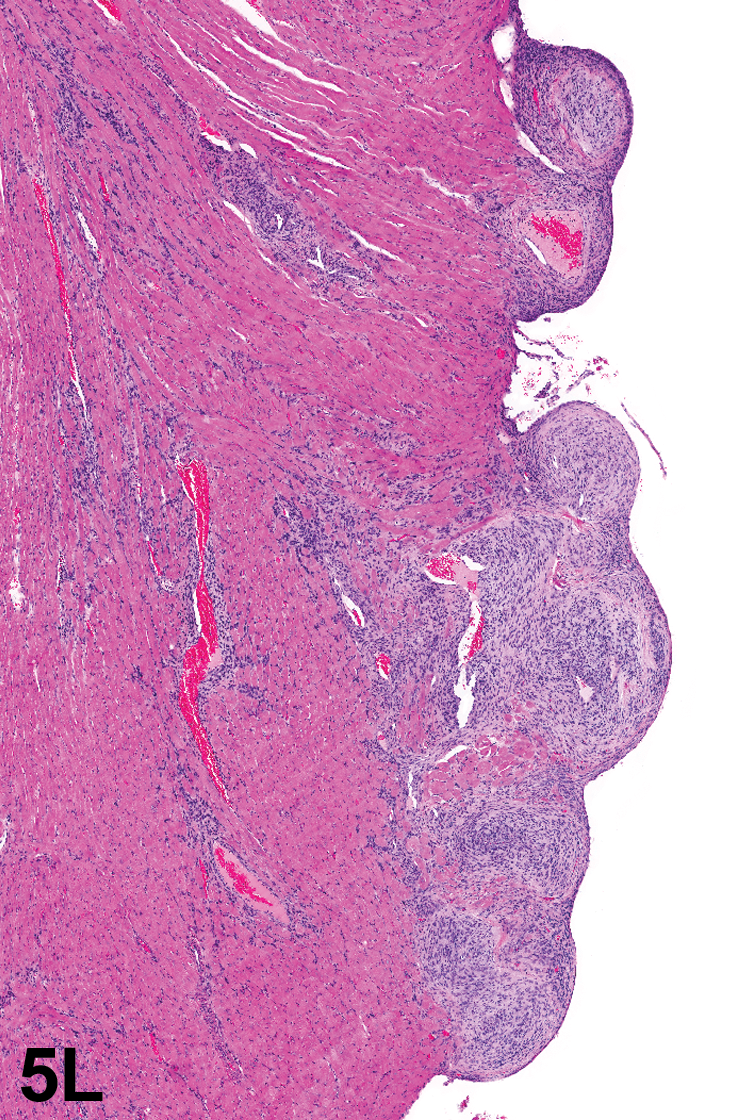
Cardiac schwannoma with a presentation different from an endocardial or intramural schwannoma. This neoplastic lesion is proliferating around epicardial and intramural vessels with infiltration into the myocardium. H&E.
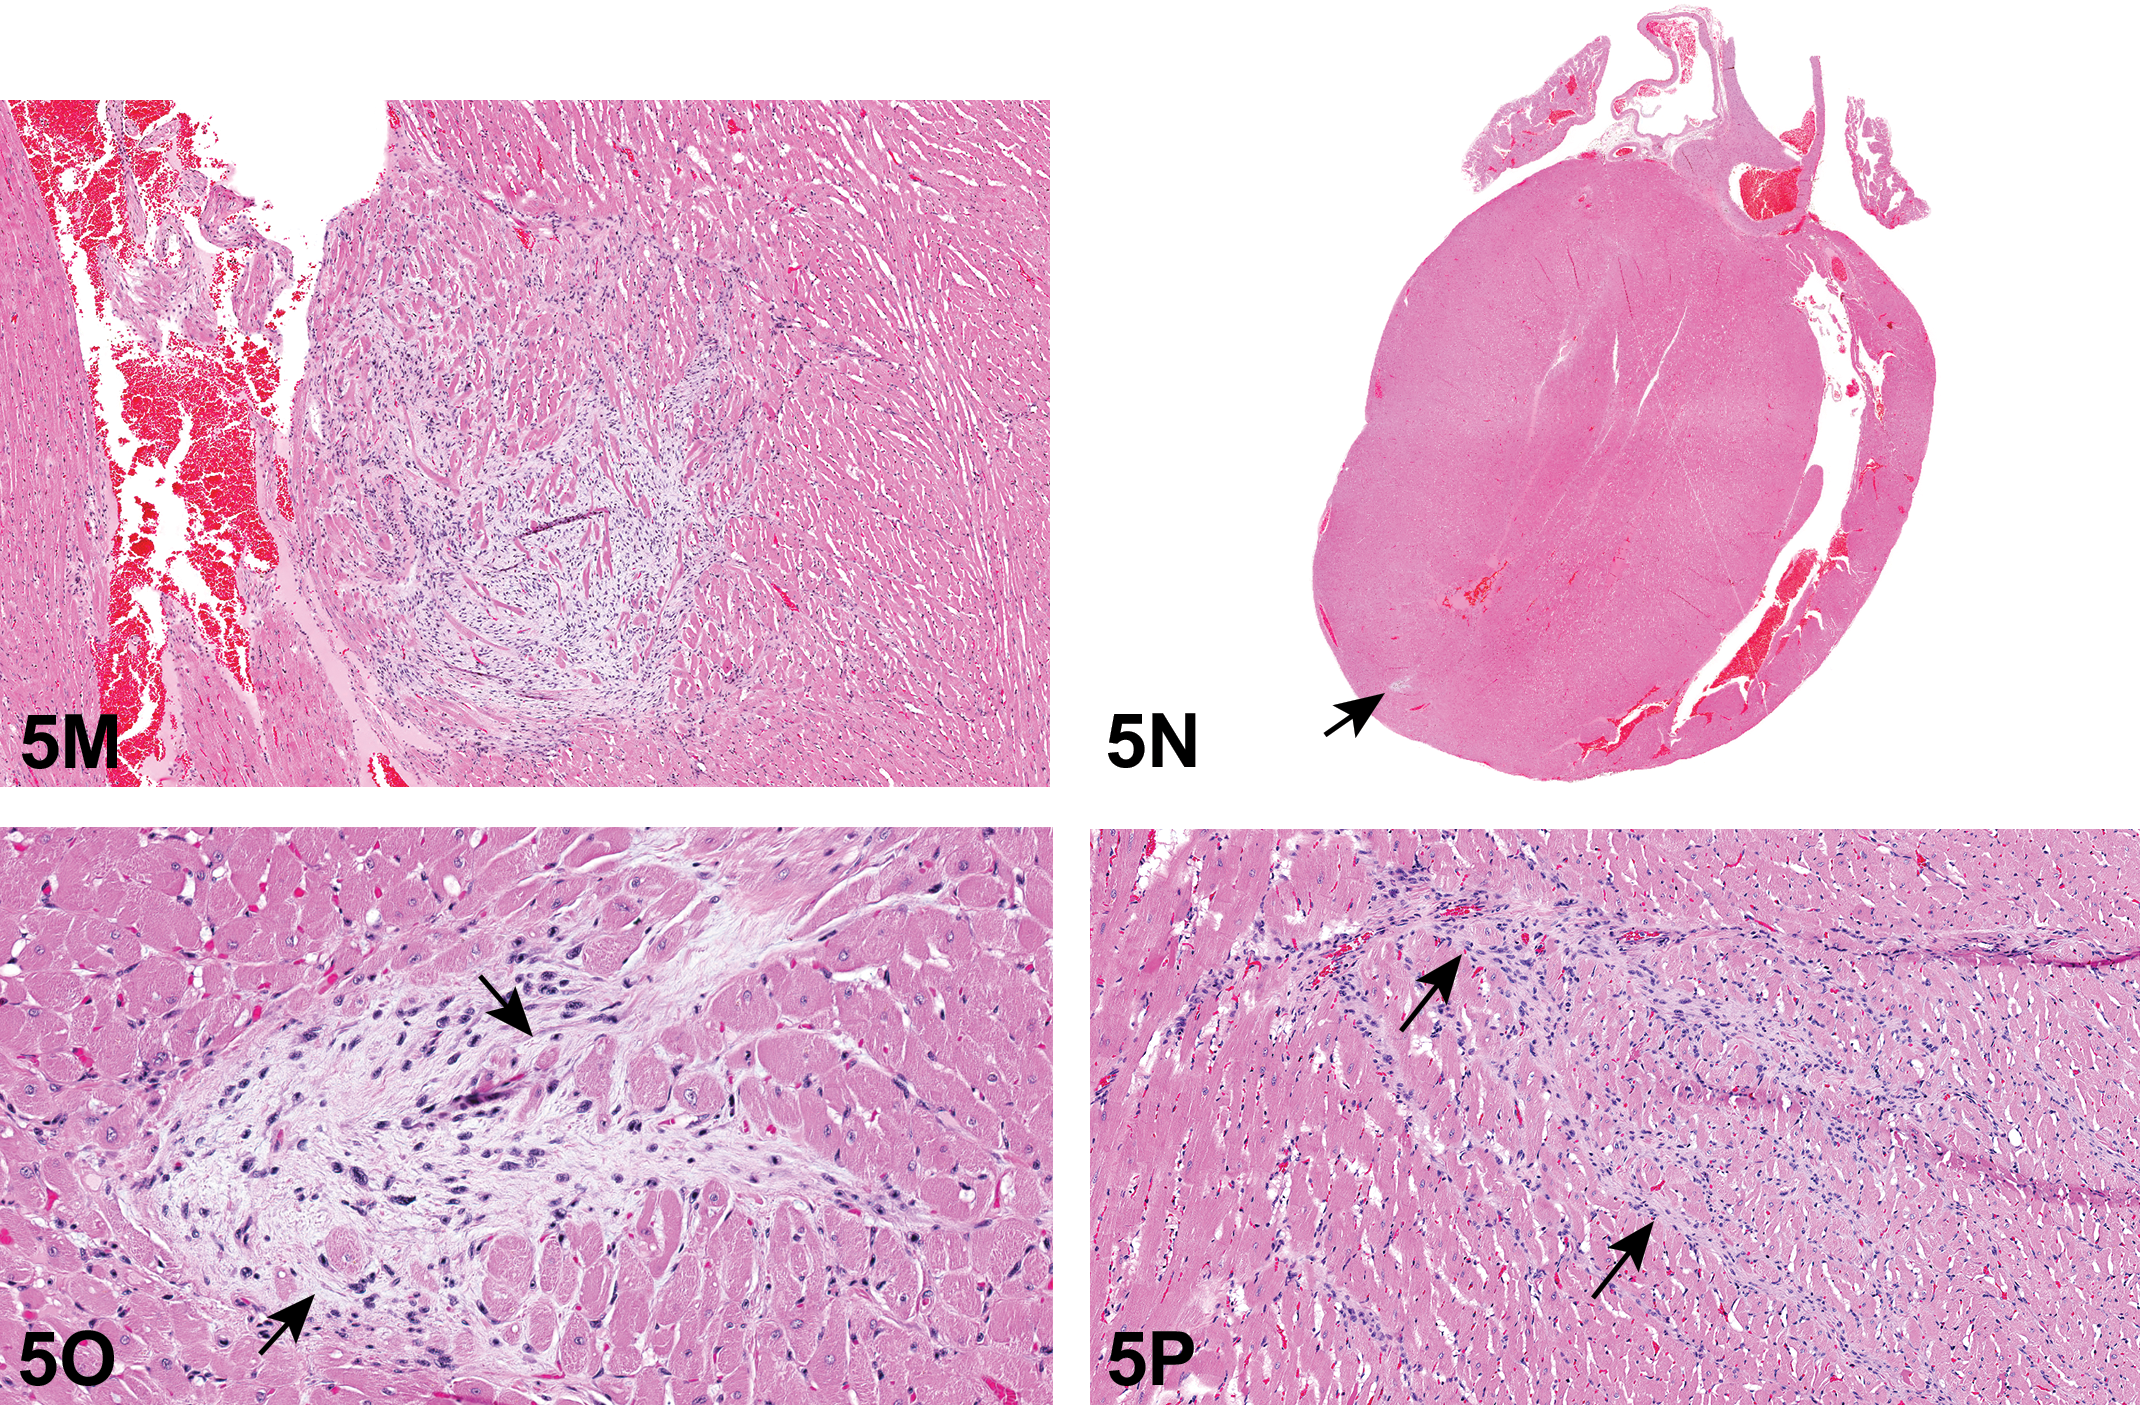
Series of challenging cardiac proliferative lesions. (M) is a small intramural cardiac Schwann cell lesion diagnosed as a schwannoma. There is infiltration and invasion with replacement of cardiomyocytes. (N; arrow; low magnification) and O (high magnification) depict an even smaller intramural cardiac lesion at the apex of the heart. This lesion has cells with similar features to that in (M), and there is invasion with replacement of cardiomyocytes. (P) shows another intramural lesion that infiltrates and invades the myocardium and in some areas surrounds and replaces cardiomyocytes (arrows). This lesion has cellular features similar to those of the lesions in (M–O). H&E.
Some of the questions posed to the audience for discussion were as follows: Do you agree with the published criteria for cardiac schwannoma and how strict should these criteria be? Are there benign and malignant variants or do you agree with considering them all malignant? What distinguishes hyperplasia from neoplasia and do you agree with the current criteria? Is the distinction between schwannoma and Schwann cell hyperplasia arbitrary? Do the number of cell layers matter and does the size of the lesion matter? What distinguishes infiltration and interdigitation from invasion? Do you think that intramural variants of Schwann cell hyperplasia exist? Should we lump or split the endocardial and intramural lesions?
There was no clear consensus on these points. A group of experts in the field previously participated in a PWG and discussed some of these issues. They reviewed a series of cardiac schwannomas and Schwann cell hyperplasias and noted some of the diagnostic difficulties. Some indicated that they felt that the distinction between schwannoma and Schwann cell hyperplasia was arbitrary, as they believed that there was a progression from one to the other. There was consensus that all should be diagnosed as malignant and that the number of cell layers to distinguish hyperplasia from neoplasia is just a guideline and should be considered in conjunction with all other data.
Finally, important take-home points were discussed. The distinction between rat cardiac Schwann cell hyperplasia and schwannoma can be difficult to make, as illustrated in this presentation and voting results. Moreover, for the 3 voting cases presented here, 5 NTP pathologists evaluated them previously, and, for all 3 cases, 2 voted for schwannoma and 3 voted for hyperplasia. A group of 5 local pathologists also voted for these lesions and had close, almost split votes for cases 1 and 2 with hyperplasia the winning vote whereas case 3 had a clear majority vote for schwannoma. These results indicate that there is still confusion in the distinction of these proliferative lesions and may be why some consider most to be schwannomas. The bottom line is that one must consider a variety of factors such as invasion, replacement of cardiomyocytes, necrosis or degeneration of the cardiomyocytes, and cellular features such as pleomorphism when determining the diagnoses.
An Axillary Anomaly
Dr. Vivian S. Chen (NTP, NIEHS, RTP, NC) presented the only domestic animal case that was received on biopsy service at the Veterinary Medical Teaching Hospital (VMTH), University of California, Davis. The case was from a 6-year-old, neutered, male domestic short-hair cat that was presented for a wellness exam and the evaluation of an axillary mass that was noted 2 weeks prior to the visit. The cat had a medical history of feline herpesvirus-1 infection with resultant symblepharon of the left eye as a kitten and was mildly overweight and with mild dental disease as an adult.
The axillary mass was a subcutaneous neoplasm that expanded the panniculus carnosus, and 2 regions of the mass were highlighted in a series of increasingly higher magnification images (Figure 6A–F). The voting choices and results were schwannoma (35%), malignant peripheral nerve sheath tumor (27%), neuroblastoma/primitive neuroectodermal tumor (23%), perineurioma (5%), neurofibroma (4%), myofibroblastic sarcoma (3%), hemangiopericytoma (3%), other (1%), and low-grade fibromyxoid sarcoma (0%). Dr. Chen agreed with the majority of the participants that the best diagnosis of the neoplasm was schwannoma.
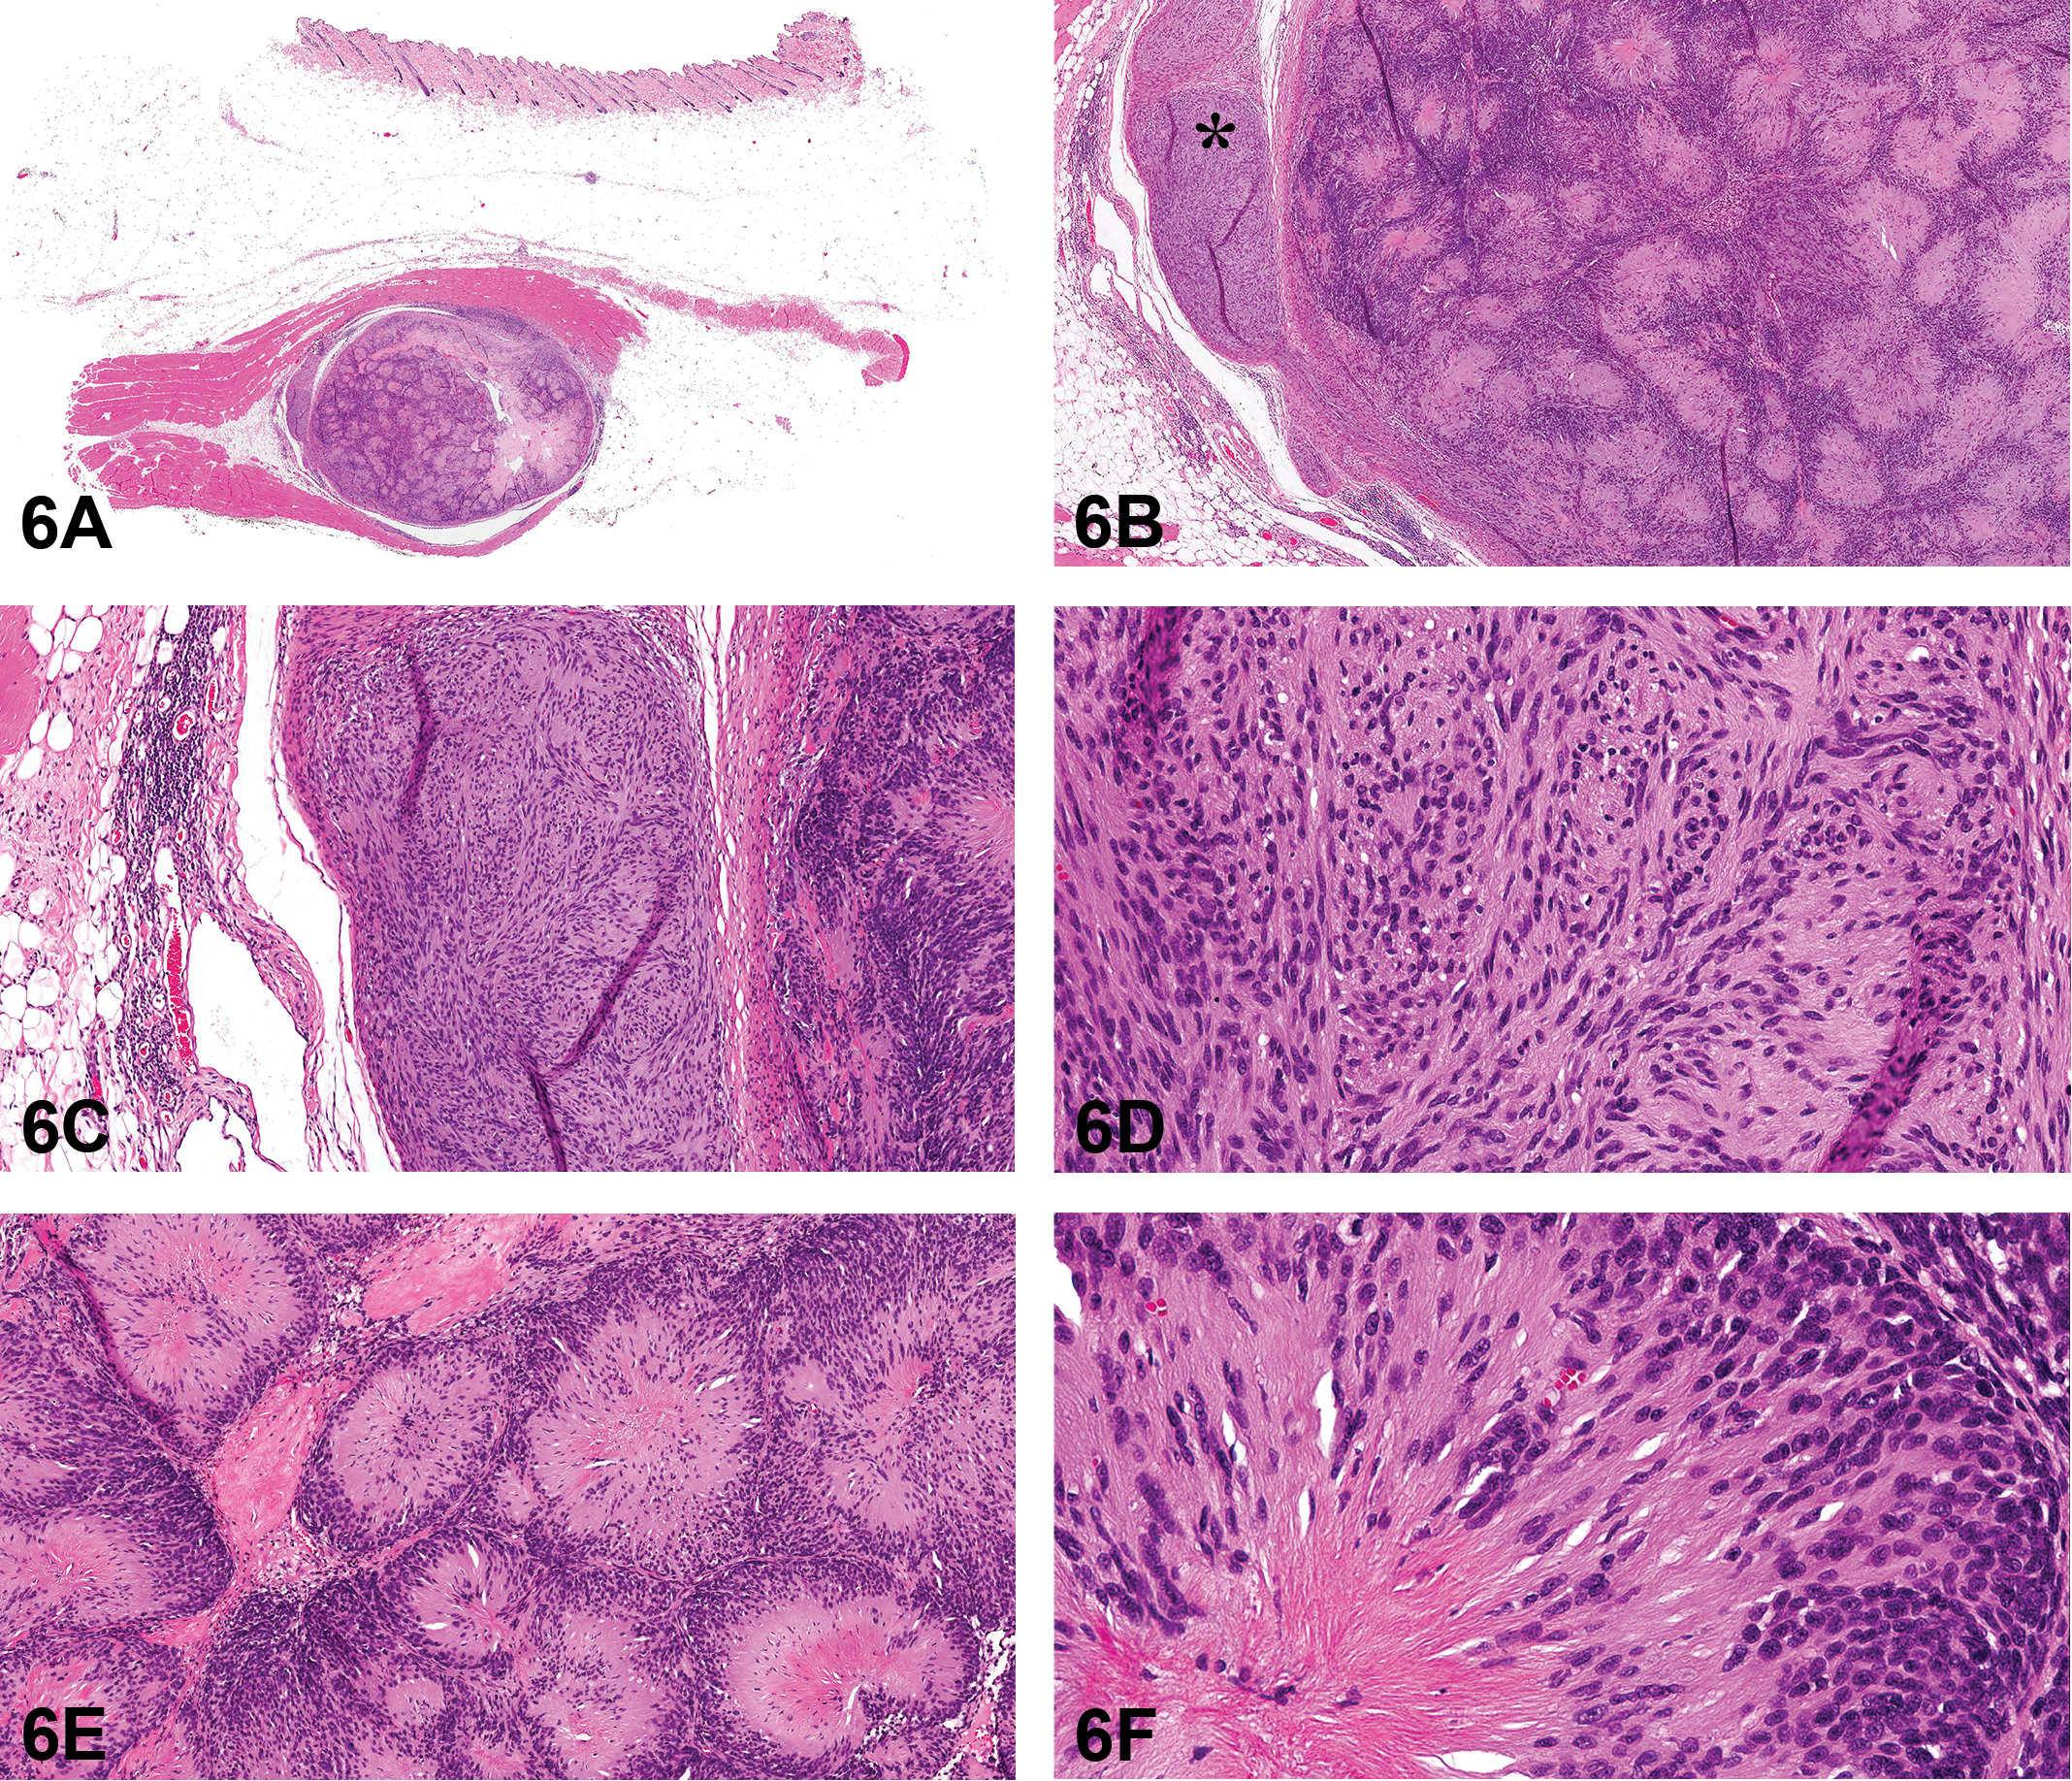
Neuroblastoma-like schwannoma in the axillary subcutis of a cat. Photomicrograph of a cross section of the subcutaneous mass (A) and a higher-magnification photomicrograph (B) of the mass with a focus on 2 morphologically distinct cellular arrangements. (C) and (D) are higher magnification photomicrographs of the crescentic lobule (asterisk) in (B), which is composed of compact, spindle cells arranged in intersecting bundles. Higher-magnification photomicrographs (E and F) of the larger portion of the mass demonstrate tightly packed, giant rosette-like structures that are similar to Homer Wright rosettes. The rosette-like structures are composed of peripherally stacked nuclei with centrally oriented cytoplasmic processes that intermingle with a scaffold of collagen fibers. H&E.
Schwannomas, neurofibromas, and perineuriomas are grouped together under peripheral nerve sheath tumors (PNSTs) and comprise at least 7% of all skin tumors in cats (Mandara et al. 2013). Histologically, schwannomas are characterized by alternating patterns of Antoni type A and Antoni type B regions. Antoni type A is the more common of the 2 patterns and is characterized by compact, fusiform cells arranged in whorls and bundles that intersect at various angles (Vandevelde, Higgins, and Oevermann 2012). Verocay bodies, which are composed of opposing rows of palisading nuclei that are separated by acellular areas of cytoplasmic processes, may be observed. Antoni type B is much less common and is characterized by loosely arranged, plump to stellate cells embedded in an abundant myxoid ground substance (Vandevelde et al. 2012). While seemingly “classic,” these histological features, particularly those of Antoni type A, can be difficult to discern from features and patterns seen in other spindle cell tumors. In addition, there are several morphologic variants of schwannoma that are recognized in human medicine and are rarely reported in domestic animal species. These variants include “ancient,” cellular, epithelioid, plexiform, pseudoglandular, microcystic/reticular, and neuroblastoma-like and are described in detail with photomicrographs in Diagnostic Pathology: Soft Tissue Tumors (Lindberg 2016). In the cat, schwannomas are often diagnosed as benign versus malignant PNSTs or more broadly as soft tissue tumors due to the absence of distinct histologic features and due to the lack of immune biomarker profiling to confirm the histogenesis of the neoplastic cells.
Key histologic features of the subcutaneous mass were reviewed. The mass was well demarcated, multilobular, and partially encapsulated (Figures 6A and B). The first series of images highlighted a crescentic lobule that hugged the larger, main mass (Figure 6C). The lobule was composed of compact, spindle cells arranged in intersecting bundles, reminiscent of nerve fibers (Figure 6D). The larger portion of the mass was composed of variably sized, tightly packed, giant rosette-like structures that were likened to Homer Wright rosettes and separated by variably thick bands of dense connective tissue (Figure 6E). The rosette-like structures were composed of radially arranged fusiform cells with peripherally stacked nuclei and centrally oriented, eosinophilic, fibrillary cytoplasmic processes that intermingled with a scaffold of collagen fibers (Figure 6F), which was highlighted by Masson’s trichrome stain (data not shown). These features are consistent with the neuroblastoma-like variant of schwannoma, a rare tumor in humans with approximately 20 case reports published between 1994 and 2016 (Goldblum, Beals, and Weiss 1994; Kaur et al. 2016). This is the first report of neuroblastoma-like schwannoma in the cat.
In this case, the diagnosis of schwannoma was supported by ancillary diagnostics. A panel of immune biomarkers were used and included S100, laminin, periaxin, and SOX10,
GFAP, cytokeratin AE1/AE3, synaptophysin and SMA, and the expected outcomes for schwannoma were presented in Table 13. The neoplastic cells were strongly immunoreactive for S100, laminin, periaxin, SOX10, and GFAP and negative for the remaining markers. In this case study, periaxin and SOX10 were used to support Schwann cell histogenesis. Periaxin is a protein that is expressed in the nuclei of embryonic Schwann cells and is translocated to the plasma membrane of myelinating cells, where it is required for the maintenance of the myelin sheath (Gillespie et al. 1994). SOX10 is a neural crest transcription factor that is required for Schwann cell and melanocyte specification and survival (Nonaka, Chiriboga, and Rubin 2008). Lastly, TEM demonstrated that the neoplasm had features characteristic of schwannoma—tightly packed, interdigitating cytoplasmic processes separated by a continuous basal lamina and scattered collagen deposits (data not shown).
Schwannoma Biomarkers with Expected Outcomes and Immunohistochemistry Results in a Cat.
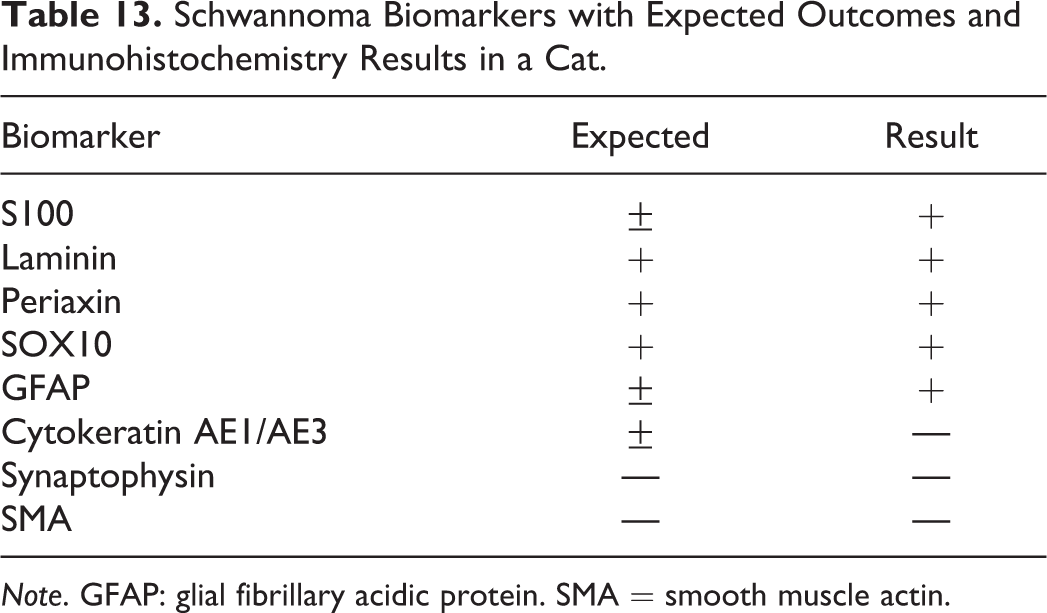
Note. GFAP: glial fibrillary acidic protein. SMA = smooth muscle actin.
In a 3-month follow-up appointment, a computed tomography scan was performed. The subcutaneous tissue of the axilla where the mass was removed demonstrated mild contrast enhancement, which was suggestive of either granulation tissue or recurrent neoplasia. Further work-up was declined, and contact with the client and the cat was lost.
Take-home points were subsequently discussed. Schwannomas in domestic animals often lack distinct histological features that distinguish them from other soft tissue tumors, and thus, biomarker profiling is needed for the determination of histogenesis. Furthermore, morphologic variants of schwannoma are described in human medicine and may be applied to veterinary medicine. The histomorphology and ancillary diagnostics of the axillary mass in this case were most consistent with neuroblastoma-like schwannoma. The differential diagnoses considered for this exercise were excluded by histomorphology, the panel of immune biomarkers, and cytological features observed by TEM.
This case report has been submitted for publication with complete histochemical, IHC, and TEM data. Coauthors include Dr. Sílvia Sisó (Biomarin Pharmaceutical, Inc., Novato, CA), Dr. Andrew W. Bollen (School of Medicine, UC San Francisco, CA), Dr. Robert J. Higgins (School of Veterinary Medicine, UC Davis, CA), and Dr. Paola Marco-Salaza (Universidad Complutense de Madrid). We would like to thank the UCD VMTH histology laboratory for their histological and immunohistochemical technical support and the EM service at California Animal Health and Food Safety (CAHFS) for their technical expertise.
Challenging Cases or Run-of-the-mill?
Dr. Kathleen A. Szabo (Charles River Laboratories, Inc.) presented 2 cases for voting. Both cases were female Sprague-Dawley rats (Hsd: SD) from an NTP 2-year inhalation toxicity and carcinogenicity study. The first case brain lesion was a low-dose animal (moribund sacrifice) and the second case adrenal gland lesion was a high-dose animal (terminal sacrifice).
For the first case, Dr. Szabo presented a series of photomicrographs of the brain lesion (Figures 7A–D). Based on H&E morphology, there was loss of brain parenchyma, a unilateral distribution, with inflammation (primarily macrophages) and a reactive astrocytic response to the inflammation.
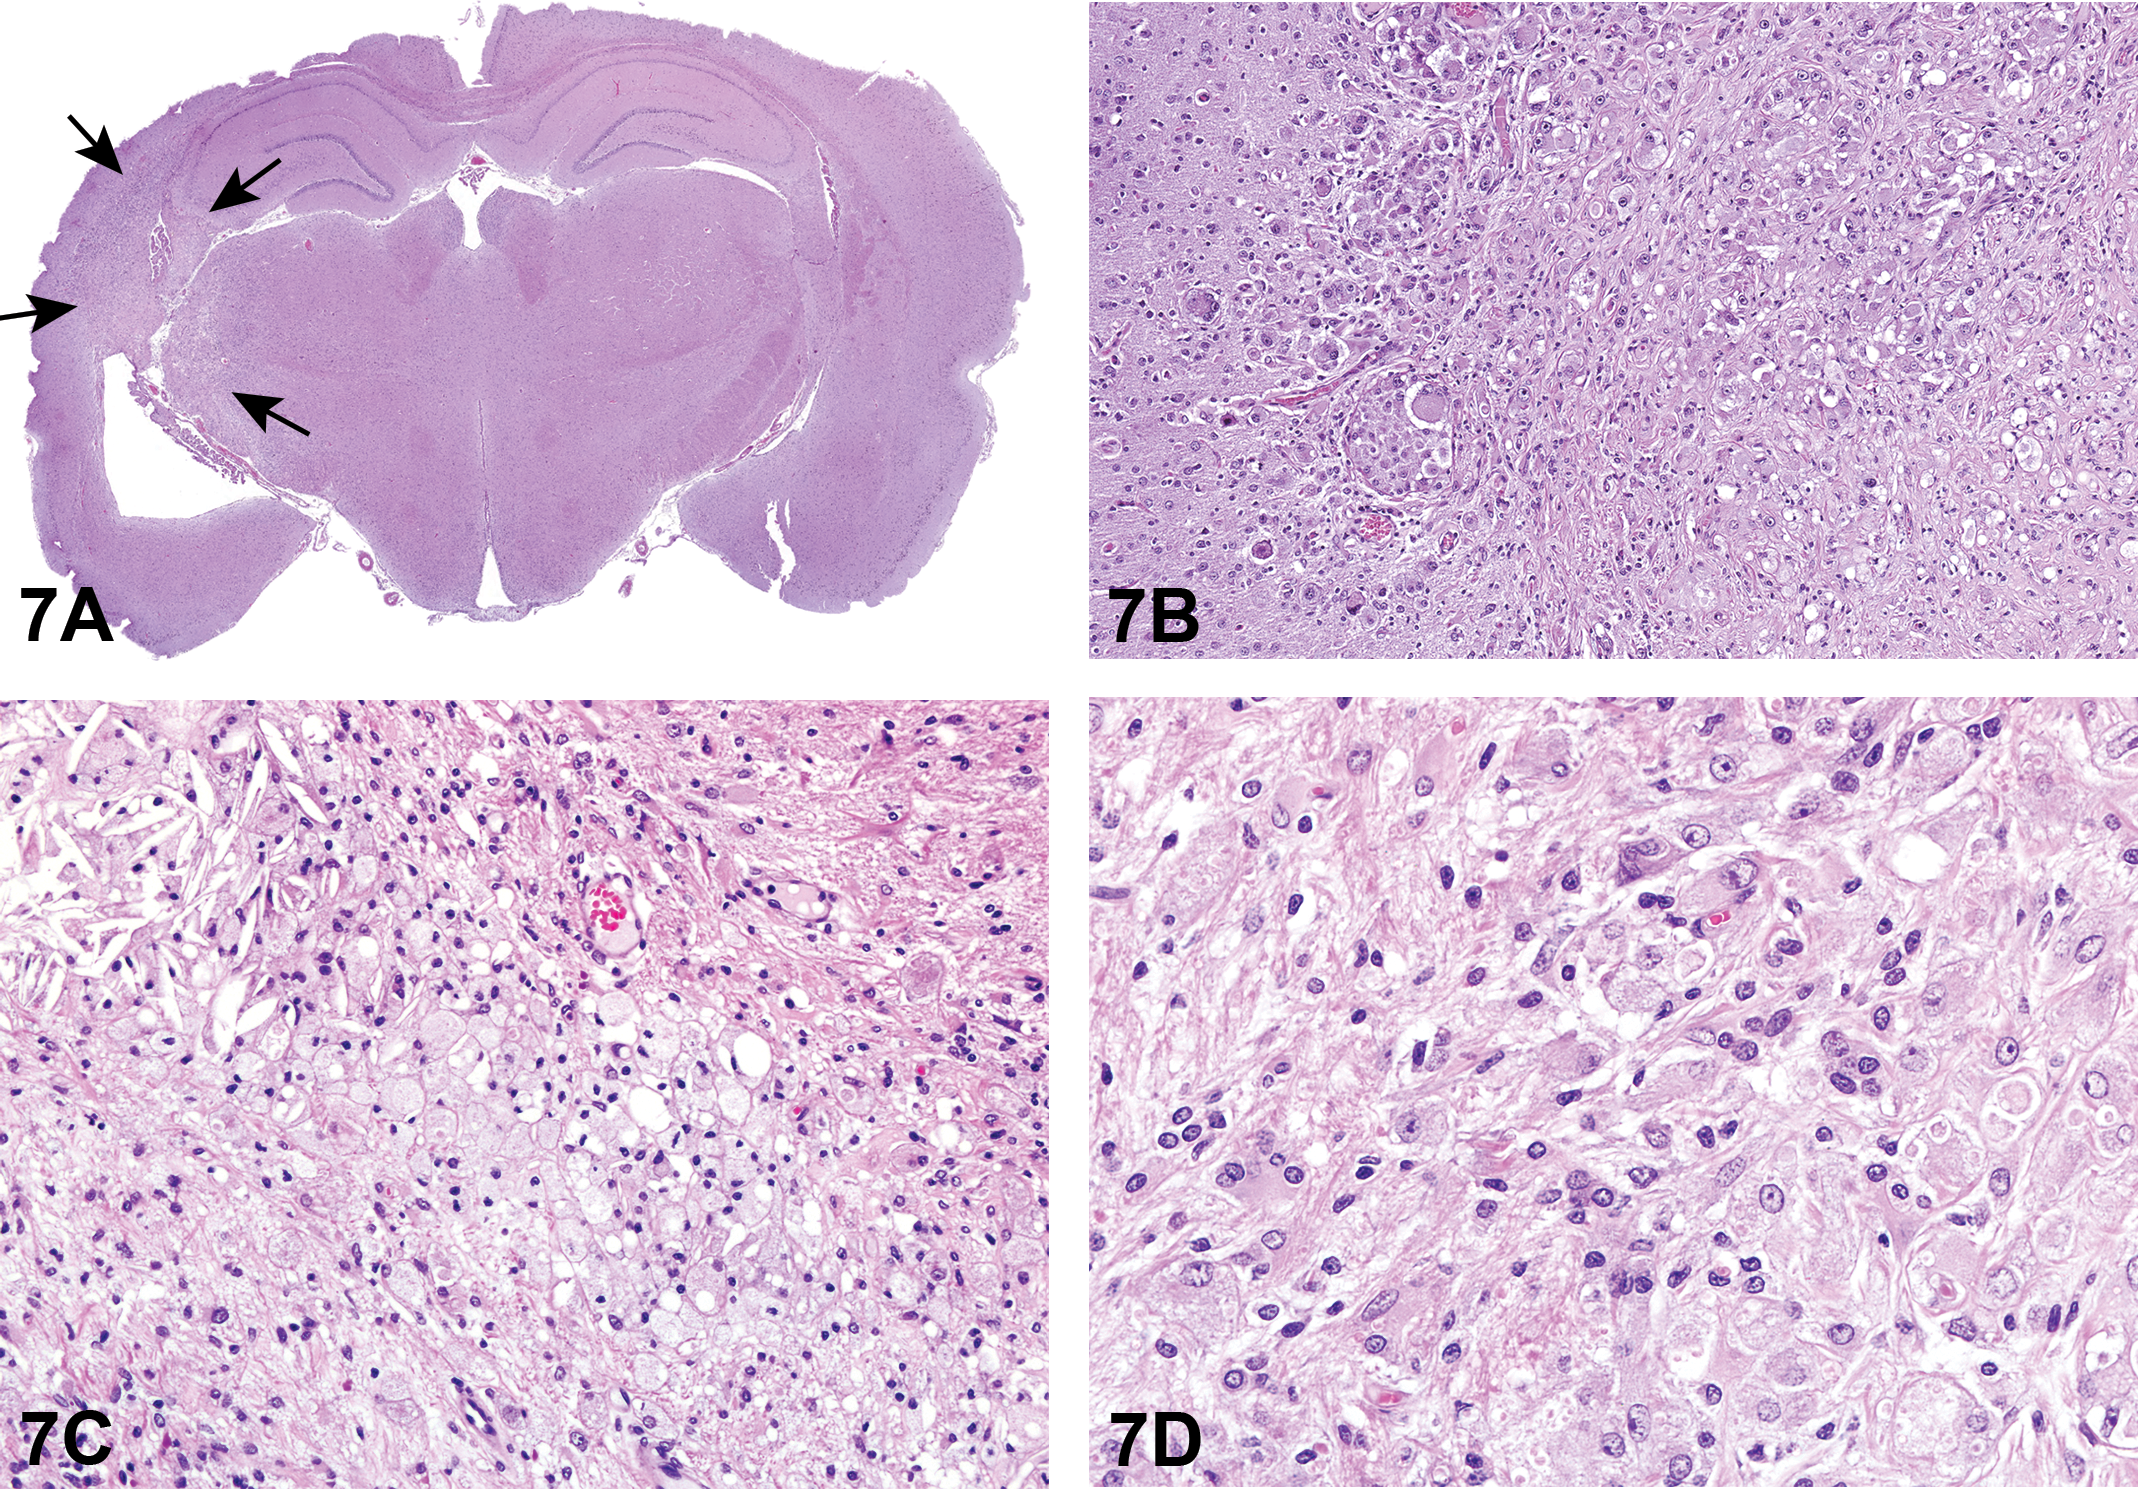
Brain lesion in a Sprague-Dawley (SD) rat from a 2-year inhalation toxicity and carcinogenicity study presented as case 1. Low-magnification view of brain with a unilateral lesion (A, arrows), characterized at the subgross level by pallor and increased cellularity, indicating loss of brain parenchyma, and cellular infiltration, respectively. Higher-magnification image of the lesion shows numerous macrophages infiltrating the brain parenchyma as a component of the inflammatory response (B). There are occasional cholesterol clefts and numerous macrophages infiltrating the brain parenchyma (C). (D) is a high-magnification image showing numerous macrophages infiltrating the parenchyma. There is loss of brain parenchyma evidenced by increased pallor of the neuropil and presence of increased clear space. H&E.
The voting choices and results were unilateral necrosis and granulomatous inflammation (39.2%), cholesterol clefts/cholesterol granuloma (20%), granulomatous inflammation (12%), histiocytic sarcoma (12%), malignant glioma (6.4%), unilateral necrosis (6.4%), benign astrocytoma (3.2%), gliosis (0.8%), and other (0%). Despite a clear audience favorite, a revote had been preplanned, so that Dr. Szabo could present IHC photomicrographs of Iba1 (Figure 7E), which positively stained macrophages, GFAP (Figure 7F), which positively stained reactive astrocytes, and Olig2, which was negative (data not shown) (Kolenda-Roberts et al. 2013). Immunofluorescence staining of Iba1 and GFAP (Figure 7G) was also shown to illustrate the mixed cell population composed of GFAP-positive reactive astrocytes and Iba1 positive macrophages; nuclei were counterstained blue with 4’,6-diamidino-2-phenylindole (DAPI). The results of the IHC staining are presented in Table 14.
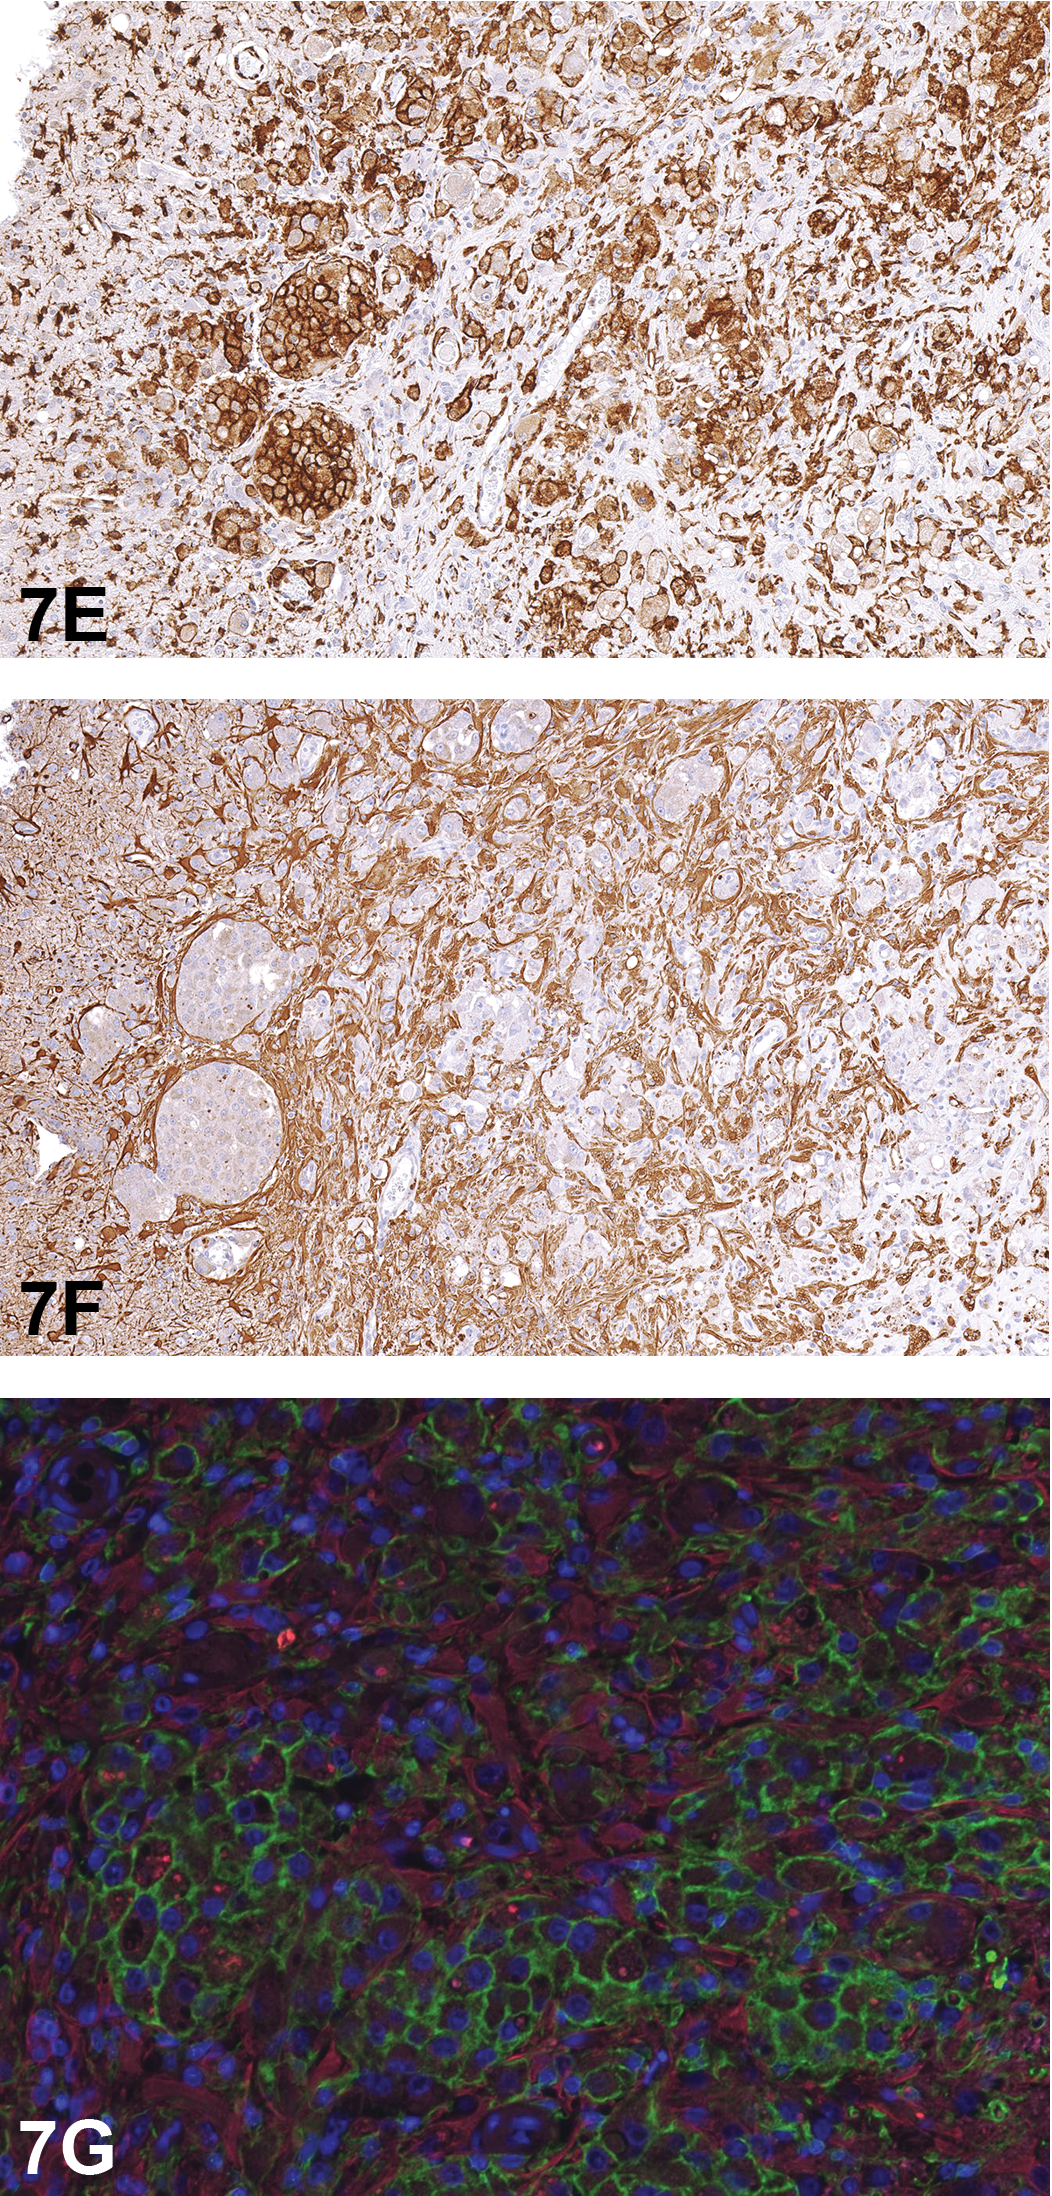
Immunohistochemical and immunofluorescence staining of the unilateral brain lesion from case 1. (E) shows immunohistochemical staining for ionized calcium binding adaptor molecule 1 (Iba1). Note the positive (brown) cytoplasmic staining of inflammatory cells (macrophages). (F) shows immunohistochemical staining for glial fibrillary acidic protein (GFAP). Note positive cytoplasmic (brown) staining of astrocytes, interpreted as a reactive response to the inflammation. Immunofluorescence staining (G) illustrates the GFAP (red) staining of reactive astrocytes and Iba1 (green) staining of the inflammatory cell infiltrate (macrophages). Nuclei are counterstained with 4’,6-diamidino-2-phenylindole (blue).
Immunohistochemical Results of Case 1.
Note. Parts of the table (expected cellular reactivity) adapted from Kolenda-Roberts et al. (2013). IHC = immunohistochemistry. Iba1 = ionized calcium binding adaptor molecule 1. GFAP = glial fibrillary acidic protein. Olig2 = oligodendrocyte transcription factor.
The revote choices and results were unilateral necrosis and granulomatous inflammation (51.6%), malignant glioma (10.9%), granulomatous inflammation (10.2%), histiocytic sarcoma (10.2%), cholesterol clefts/cholesterol granuloma (8.6%), gliosis (4.7%), benign astrocytoma (2.3%), unilateral necrosis (1.6%), and other (0%).
The differential diagnoses were then discussed. Malignant glioma has been described as an umbrella term for neuroectodermal (astrocytic, oligodendroglia, ependymal, mixed origin) tumors (Greaves 2007); this terminology is also used for microglial tumors. This lesion lacked any of the neoplastic features of neuroectodermal tumors. For histiocytic sarcoma, there was no evidence of this neoplasm in other tissues examined in this animal, and this lesion lacked the cellular features of this tumor, so it was ruled out. Cholesterol clefts were present in this lesion (Figure 7C) but were considered part of the inflammatory and necrotic processes and not the primary process; current dogma is to only diagnose the primary process (i.e., necrosis) with discussion of other lesions in the pathology narrative unless there is a reason to diagnose all lesions (Kaufmann et al. 2012; Little and Rao 2014). If a primary process cannot be determined, then the most severe lesion would be diagnosed with discussion of the less severe concurrent lesions. Therefore, the cholesterol clefts would be described as part of the overall lesion. The next differential, gliosis, is a term used for a brain lesion containing glial cells with some evidence of prior injury (e.g., necrosis, collagen, etc.; Kaufmann et al. 2012). The final diagnosis, astrocytoma, is classified by INHAND in rodents as malignant and either low or high grade. Low-grade malignant astrocytomas are poorly demarcated, generally affect one main area of the brain, are described as “modest in size,” exhibit moderate to dense cellularity, have a uniform appearance, and there may be meningeal infiltration. Additional features of low-grade malignant astrocytomas specific to rats include necrosis, cellular palisading around areas of necrosis, hemorrhage, cellular pleomorphism, differentiation into several cellular subtypes, and various neoplastic patterns (Kaufmann et al. 2012).
In summary, the diagnostic challenge of rat brain inflammation and necrosis versus neoplasia was presented. The audience majority was correct in both voting instances for the diagnosis of unilateral necrosis and granulomatous inflammation based on the morphology, unilateral distribution, and IHC results. An audience member asked Dr. Szabo if a possible infectious cause of the brain lesion was investigated (i.e., fungal) due to the morphology of the lesion at high magnification. However, because this was an isolated case, no additional stains were conducted.
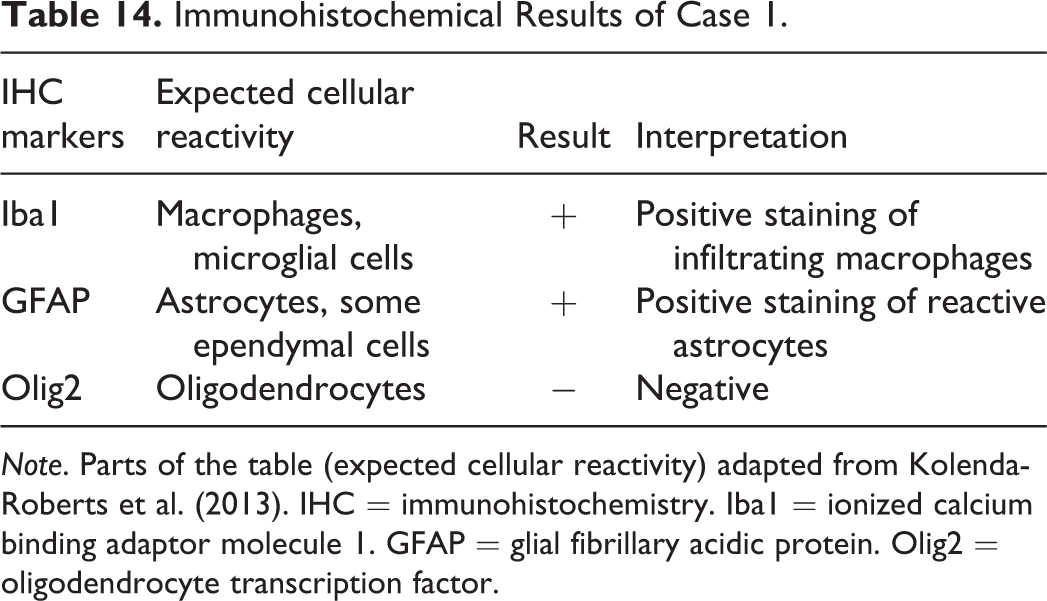
For case 2, Dr. Szabo presented photomicrographs (Figure 7H–J) of the adrenal gland focusing on a cortical lesion. The voting choices and results were carcinoma (46%), adenoma (30%), focal hypertrophy (8%), cystic degeneration (8%), focal hyperplasia (7%), and “other” (1%).
Adrenal gland lesion in an SD rat from a 2-year inhalation toxicity and carcinogenicity study presented as case 2. Note the compressive, well-demarcated neoplastic lesion in the cortex that appears to expand through the capsule (H). Compression of the surrounding adrenal cortex and adjacent medulla by the neoplasm is evident, with apparent expansion of the neoplasm through the adrenal capsule (I). (J) is a view of adrenal gland where a component of the fibrous capsule is barely perceptible (arrows) and appears to partially encapsulate the neoplastic cells. Additional neoplastic cells are outside this extension and arranged in cords outside of the thick, fibrous capsule. H&E.
The audience majority vote was for carcinoma. Dr. Szabo discussed that the lesion was well demarcated yet compressive, had a low mitotic rate, affected primarily the zona fasciculata, and exhibited cellular pleomorphism but appeared well differentiated. The main question for the audience was if there was evidence of capsular breakthrough. A Masson’s trichrome was conducted to further investigate capsular breakthrough, but was not considered helpful because additional sectioning did not retain the same morphology as the original slide (data not shown). Dr. Szabo also showed a photomicrograph from the NTP archives of a Sprague-Dawley rat adrenal cortical carcinoma as a comparator for this case (data not shown).
A discussion of voting choices followed. Clear invasion (i.e., capsular, adjacent tissue, vascular), loss of normal architecture, cellular pleomorphism, cellular atypia, prominent nucleoli, variable mitotic rate, various histologic patterns, and distant metastasis are some features expected with cortical carcinoma (Hamlin and Banas 1990; Rosol et al. 2013). Necrosis and blood-filled spaces may also be observed (Rosol et al. 2013). Adenoma affects the zona fasciculata or zona glomerulosa and is typically well demarcated and compressive. The normal radial architecture is lost, the cells are well differentiated, atypia is minimal, and there is no invasion (Hamlin and Banas 1990; Rosol et al. 2013). Focal hypertrophy affects the zona glomerulosa or zona fasciculata. This lesion is recognizable by its triangular to crescentic shape in the cortex, is typically well demarcated, and lacks compression. The cytoplasmic staining characteristics can be variable. When compared to the adjacent normal cortex, the involved cells are larger but not increased in number (Hamlin and Banas 1990; Hoenerhoff, Hill, and Gruebbel 2015a; Laast et al. 2014). Cystic degeneration is typically a focal, compressive, well-circumscribed lesion most often seen in older female Sprague-Dawley rats in the zona fasciculata with larger, vacuolated cells, and cystic spaces that can be blood filled. More extensive involvement of the adrenal cortex may occur. Also, cystic degeneration can be observed concurrently in hypertrophic, hyperplastic, and neoplastic lesions of the adrenal cortex (Hamlin and Banas 1990; Laast et al. 2014). Focal hyperplasia typically affects the zona fasciculata but can involve the reticularis, is well demarcated or blends, exhibits minimal compression, has few mitoses, and generally the involved cells are increased in number yet smaller and more basophilic (although can be larger and eosinophilic, or vacuolated) when compared to the adjacent normal cortical epithelium (Hamlin and Banas 1990; Hoenerhoff, Hill, and Gruebbel 2015b).
Two questions posed to the audience were if they thought there was clear invasion to support carcinoma and if the quiescent appearance of the neoplastic cells might support a diagnosis of adenoma. Dr. Szabo conceded that the histologic appearance is quite challenging and some may favor a malignant classification while others may favor benign: the presence of neoplastic cells outside the capsule seemingly supports capsular invasion and malignancy, but the quiescent appearance of the neoplastic cells may be convincing of a benign neoplasm. It was briefly mentioned that currently there is no INHAND guidance document on the endocrine system.
In summary, a challenging adrenal cortex neoplasm was presented and the majority favored carcinoma over the consensus diagnosis of adenoma. Indeed, this was a diagnostically challenging case!
Abnormal Fetal Development: Finding the Needle in a Gestational Sac
Dr. Schantel Hayes-Bouknight (Charles River Laboratories, Inc.) presented 2 cases on abnormal fetal development in conditional knockout (KO) embryos of different embryonic ages. Genetically engineered mice (GEM) have played a vital role in understanding gene regulation and function. In exploring valid models for adult diseases, many target genes have been found to have critical roles during development. The crop of genes whose loss or overexpression during development leads to early lethality will continue to grow, as the number of GEM studies continues to increase. This body of new genes represents a rich field for veterinary pathologists, as we have formal training in anatomy, molecular biology, and physiology and therefore have the ability to interpret an event (mutation, toxicant exposure) that might perturb development (Bolon 2015).
Dr. Hayes-Bouknight’s first case focused on the liver of an E13.5 (E = embryonic, roughly midgestation) conditional KO embryo on a C57BL/6 background. The first image presented was a transverse section through the developing liver of a normal E13.5 C57BL/6 wild type (WT) embryo in order to illustrate the normal anatomy at this stage of development (Figure 8A). The next image for voting was the same magnification from the equivalent area of the conditional KO embryo (Figure 8B). The remaining images alternated between WT and KO at different magnifications (Figures 8C and D as examples). The majority of the audience participants voted correctly for a combined diagnosis of hematopoietic defect and hepatocyte maturation defect (49%). The voting choices with the second and third highest votes were hematopoietic defect (30%) and hepatocyte maturation defect (11%), respectively. Fewer audience participants voted for hepatocellular hypertrophy (1%), hypocellularity (2%), focus of hyperplastic hepatocytes (2%), hepatocellular carcinoma (4%), and “I don’t know” (1%). No audience participants voted for apoptosis. The most striking features of this case were the sheets of large hepatocytes in the KO embryo. Hepatocytes contained large nuclei and abundant eosinophilic cytoplasm and were often binucleate, which resembled hepatoblasts (immature developing hepatocytes) rather than mature hepatocytes. In the WT embryo, the hepatocytes were smaller and separated by islands of hematopoietic precursors. These features were lacking in the KO embryo, consistent with a combined hematopoietic and hepatocyte maturation defect.
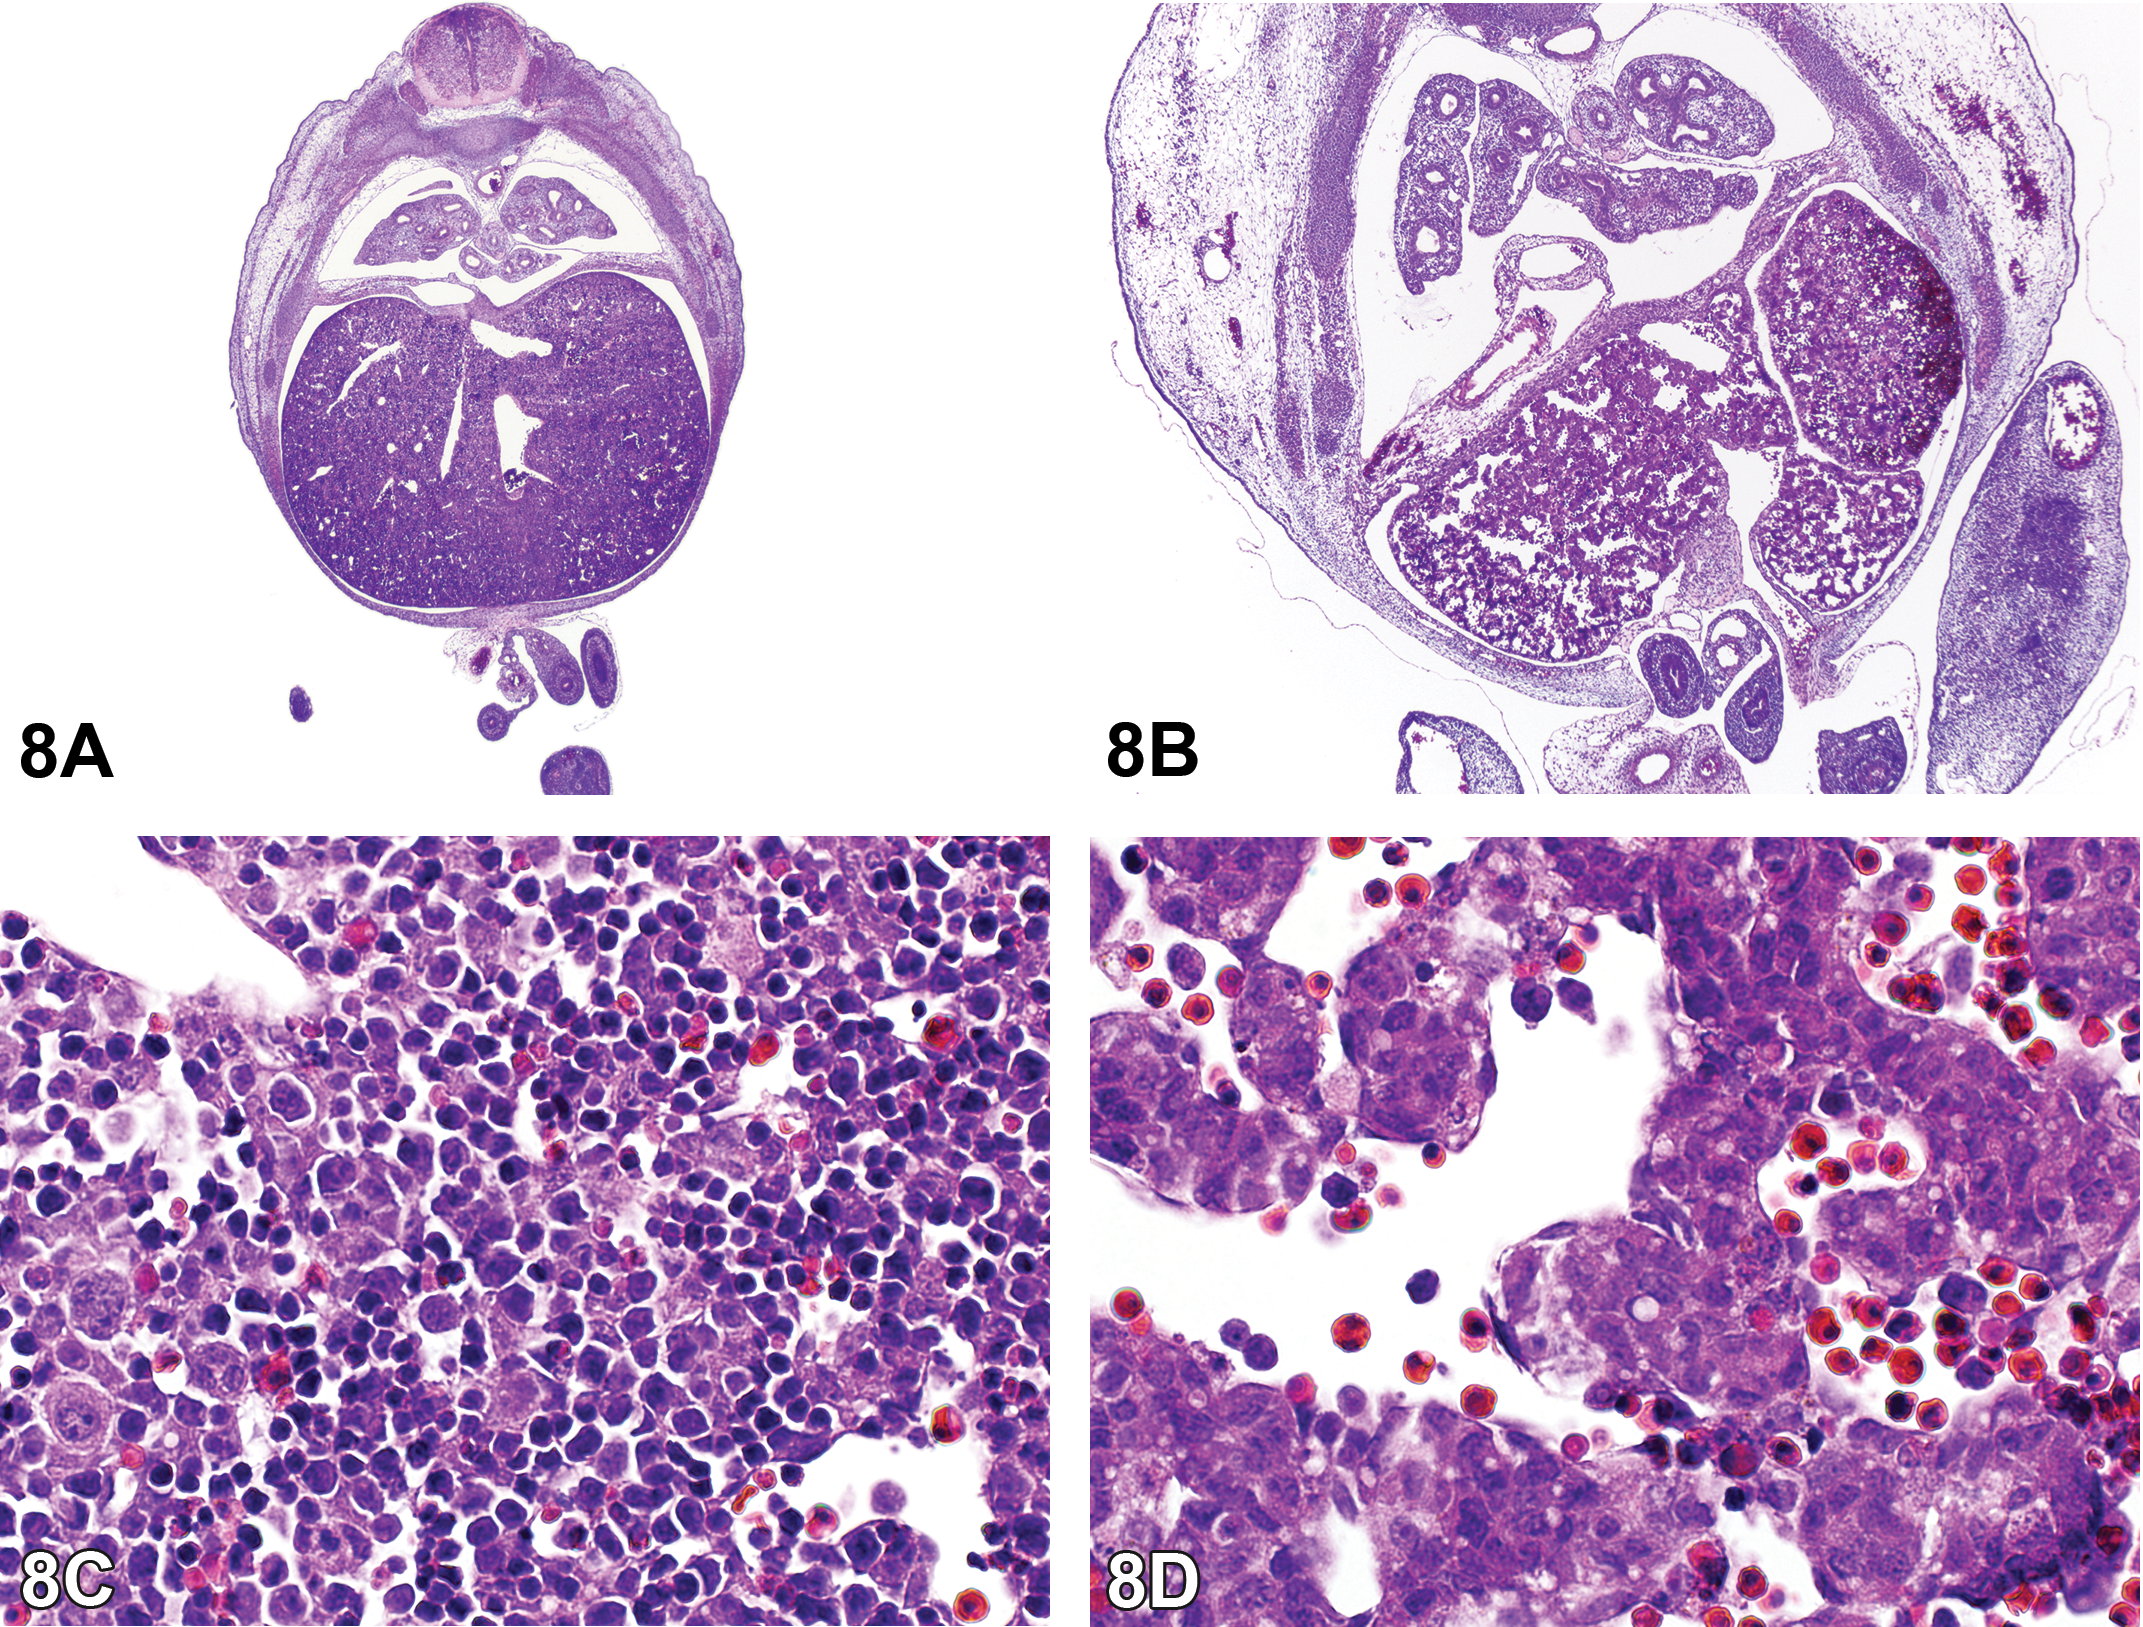
Abnormal development of the liver in a conditional knockout (KO) embryo presented in case 1. Wild type (WT; A&C) is compared to the KO (B&D). Compared to WT (A), the size of the E13.5 conditional KO mouse liver was diminished (B). The E13.5 conditional KO mouse had a delay in hepatocellular maturation and decreased hematopoiesis. Compared to WT (C), hepatocytes contained large nuclei and abundant eosinophilic cytoplasm (D) and were often binucleate, which resembled hepatoblasts (immature developing hepatocytes) rather than hepatocytes. The hepatic sinusoids of the conditional KO mouse at E13.5 were markedly dilated and showed an obvious absence of erythropoietic islands (D) when compared to WT animals (C). H&E.
This first case focused on the liver of an E13.5 conditional KO embryo for voting, but 2 additional abnormalities were observed in the embryo that included subcutaneous edema and pulmonary hypoplasia. As summarized in Table 15, by E11.5 the liver is the primary site for hematopoiesis and at E13.5, the 2 main cell populations of the liver are the hepatocytes and the erythroblasts (Crawford, Foley, and Elmore 2010). The hematopoietic compartment of the liver is nearly 75% of the total volume at E13.0 and during the peak stages of hematopoiesis in the liver (E13.5), the hepatocytes have limited contact area with each due to the high density of the hematopoietic cells present (Crawford, Foley, and Elmore 2010). The conditional KO mouse at E13.5 showed an obvious absence of erythropoietic islands when compared to WT animals (Figure 8A–D). The immature hepatocytes in the KO mice were significantly larger than in the WT animals at E13.5 and more resembled tightly packed hepatoblasts. These features were consistent with a hematopoietic and hepatocyte maturation defect.
Major Points of Hepatic (Including Hepatic Hematopoiesis) and Splenic Organogenesis during Mouse Gestation.
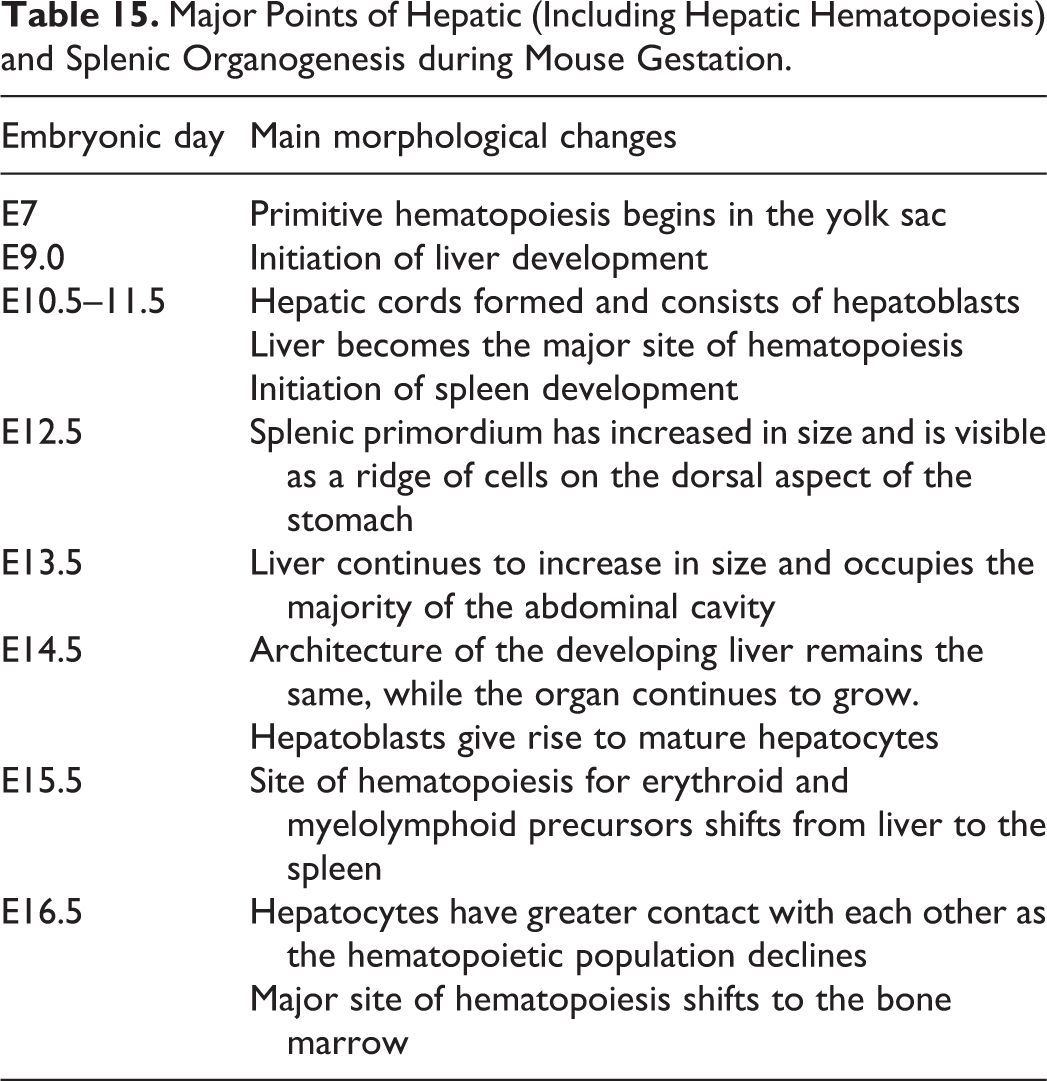
The second case focused on the spleen of an E16.5 conditional KO embryo on a C57BL/6 background. The first image presented was a transverse section through the developing spleen of a normal E16.5 C57BL/6 WT embryo in order to illustrate the normal anatomy at this stage of development (Figure 8E). The next image for voting was the same magnification from the equivalent area of the conditional KO embryo (Figure 8F). The remaining images alternated between WT and KO at different magnifications (Figures 8G and H as examples). The majority of the audience participants voted correctly for hematopoietic defect (68.8%). Fewer participants voted for hypoplasia (19.9%), extramedullary hematopoiesis (3.5%), erythrophagocytosis (2.8%), necrosis (2.8%), lymphocyte hyperplasia (1.4%), and I don’t know (0.7%). The spleen of the E16.5 KO embryo had a markedly reduced population of hematopoietic precursors relative to the WT controls. In the WT embryo, the spleen contained large numbers of hematopoietic cells at various stages of differentiation while the spleen of the KO embryo only contained indistinct cells with darkly stained nuclei, mesenchymal cells, and erythrocytes.
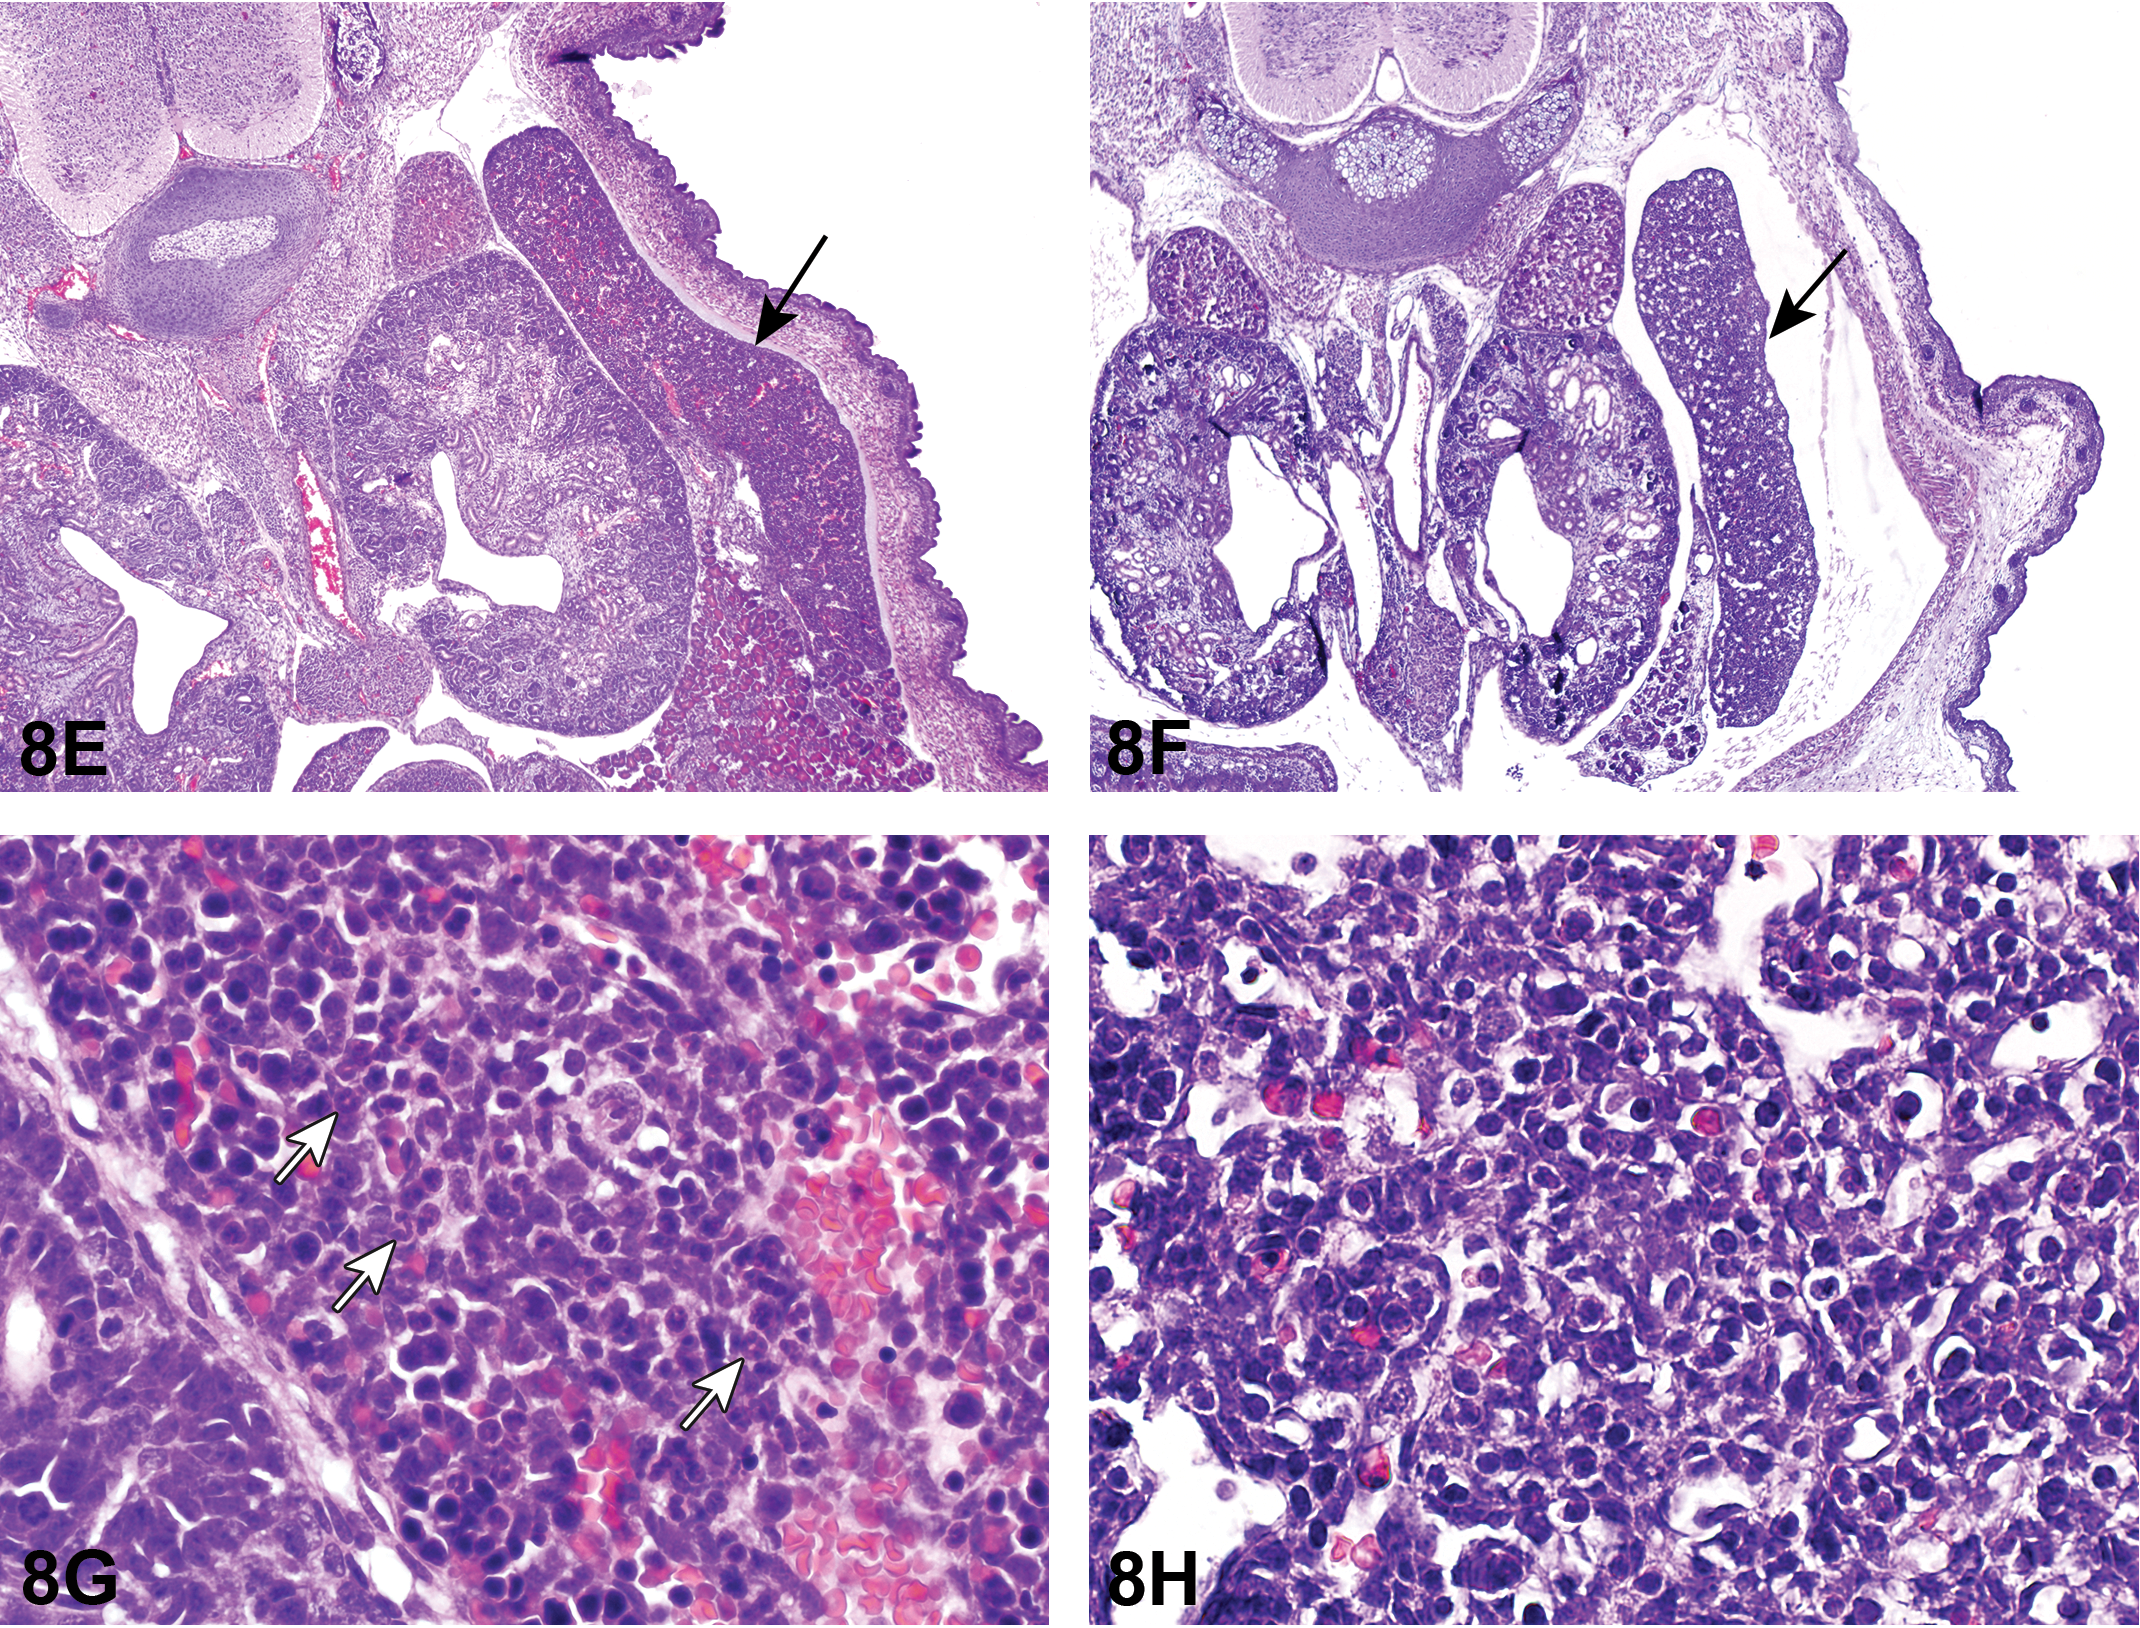
Abnormal development of the spleen in a conditional KO embryo (F&H) compared to WT (E&G) presented in case 2. The spleen (black arrow) of the E16.5 WT mouse (E) contains large numbers of hematopoietic cells at various stages of differentiation (G, immature neutrophils, white arrows) while the spleen (black arrow) of the conditional KO mouse (F) only contains indistinct cells with darkly stained nuclei, mesenchymal cells, and nucleated erythrocytes (H). H&E.
This second case focused on the spleen of an E16.5 conditional KO embryo for voting; however, additional abnormalities included subcutaneous edema, renal hypoplasia, and adrenal hypoplasia. Mesenchymal cells represent the majority of the cell population in earlier embryonic spleens (12–15 gestational days [GDs]); however, by E15, the site of hematopoiesis for erythroid and myelolymphoid precursors shifts from the liver to the spleen (Table 15). With the increase of the number of cells of the erythroid and myeloid series, the relative number of mesenchymal cells begins to decline (Djaldetti, Bessler, and Rifkind 1972). At E16.5, the spleen of the conditional KO mouse had a markedly reduced population of hematopoietic precursors relative to the WT controls. The WT mice contained large numbers of hematopoietic cells at various stages of differentiation while the spleen of the E16.5 conditional KO mouse only contained indistinct cells with darkly stained nuclei, mesenchymal cells, and erythrocytes (Figures 8E–H).
Evaluation of GEM embryos can be quite daunting to the novice developmental pathologist, as complex and rapid changes occur during embryonic development. The goal of this presentation was to discuss a systematic approach, described by Bolon and Carreira (2015), to macroscopically and microscopically evaluate GEM embryos and provide a brief overview of general patterns of alterations observed in developing mice.
The first step of embryonic microscopic examination is to assess the section at low magnification to observe the general arrangement of organs in the embryo. Histologic examination with a conventional light microscope at 2× objective is suitable to discern alterations in size, shape, symmetry of paired organs, and color. The second step is to examine the embryo at an intermediate magnification (4× or 10× objectives). At this magnification, the pathologist can evaluate structural defects and differences in cell populations when compared to WT controls. These assessments, and those done at higher magnifications (20×, 40×, or above), require a detailed knowledge of the unique cellular and anatomical attributes of numerous organ systems throughout many gestational and postgestational stages (Bolon 2015; Crawford, Foley, and Elmore 2010; Savolainen, Foley, and Elmore 2009; Swartley et al. 2016).
Consequences of alterations to the developing mouse will depend on the stage at which gene inactivation or injury occurred. Progressive changes could ultimately result in death of the embryo within a few days or over a period of time. Prior to implantation (E0–E4.5), severe injury that results in diffuse cell death can lead to embryonic death or to gross malformations, while mild injury can lead to developmental delays or a normal embryo. The organogenesis phase (post implantation, E5.0–E15.0) is a critical period in the embryo, in which the 3 germ layers (endoderm, ectoderm, and mesoderm) develop into organs. During the crucial phases of organ development, injury can result in gross malformations. Furthermore, patterns of anomalies depend on the organ system involved and if the timing of the insult coincides with a critical window of development. After organogenesis is complete (at GD 15.0), damage to the embryo will either result in a delay in development or cause functional abnormalities. It is important to note that GEMs may survive the gestation period with an organ or system developmental defect and die shortly after birth. Developmental defects may also be compatible with life with or without clinical consequences (Ward, Elmore, and Foley 2012).
With the rapidly expanding use of GEM in biomedical research, the need for developmental pathologists is evident. One important take-home point for this presentation was that there’s a developmental pathologist in us all. Veterinary pathologists have the ability to investigate hypotheses from a broad knowledge base and are therefore well equipped to interpret alterations in the developing transgenic mouse. Although macro- and microscopic assessments of the developing mouse do require a detailed knowledge of numerous organ systems throughout many gestational and postgestational stages, there are numerous useful resources available to aid in this endeavor (Rossant and Tam 2002; Bolon 2015; Crawford, Foley, and Elmore 2010; Petiet et al. 2008; Savolainen, Foley, and Elmore 2009; Swartley et al. 2016; Ward, Elmore, and Foley 2012).
Food for Thought
Dr. Jessica S. Hoane (Charles River Laboratories, Inc.) presented 2 cases of brain tumors from an NTP chronic dosed feed toxicity and carcinogenicity bioassay. Other pathologists involved in this study included the NTP pathologist (Dr. Susan A. Elmore, NTP, NIEHS, RTP, NC) and the study pathologist (Dr. Daphne Vasconcelos, Battelle, Columbus, OH).
Male and female Hsd: SD rats were exposed to the test material via dosed feed for up to 105 weeks. At the PWG, the 2 brain tumors presented herein were noted to have some features reminiscent of glioblastoma multiforme (GBM) including palisading necrosis and endothelial proliferation. Areas of palisading necrosis are traditionally defined as small, irregular regions of necrosis surrounded by dense accumulations of tumor cells; the tumor cells are more densely packed at the edge of necrosis than in other regions of the tumor and thus appear to “palisade” around the necrotic zone. A panel of IHC stains was performed on these tumors to further characterize the cellular origin. The IHC panel included GFAP, Olig2, Iba1, GS, and nestin. Detailed staining protocols for all antibodies are available at the NIEHS IHC website (http://www.niehs.nih.gov/research/resources/protocols/protocols-immuno/index.cfm, last accessed August 29, 2016).
Low- and high-magnification images of H&E-stained sections from case 1 were shown to the audience (Figures 9A–D as examples). This tumor was a well-demarcated mass unilaterally expanding the caudate putamen and was composed of neoplastic cells exhibiting 2 distinct cellular morphologies. The majority of the tumor was composed of a moderately dense population of neoplastic cells within a matrix of abundant remnant eosinophilic neural parenchymal matrix. The neoplastic cells had small round nuclei with scant to moderate cytoplasm and rare mitoses. There were multifocal regions of densely cellular neoplastic cells, which were larger and polygonal with moderate amounts of eosinophilic cytoplasm, with intervening hyalinized matrix, and many mitoses. There were areas of necrosis and some endothelial proliferation along the periphery of the tumor.
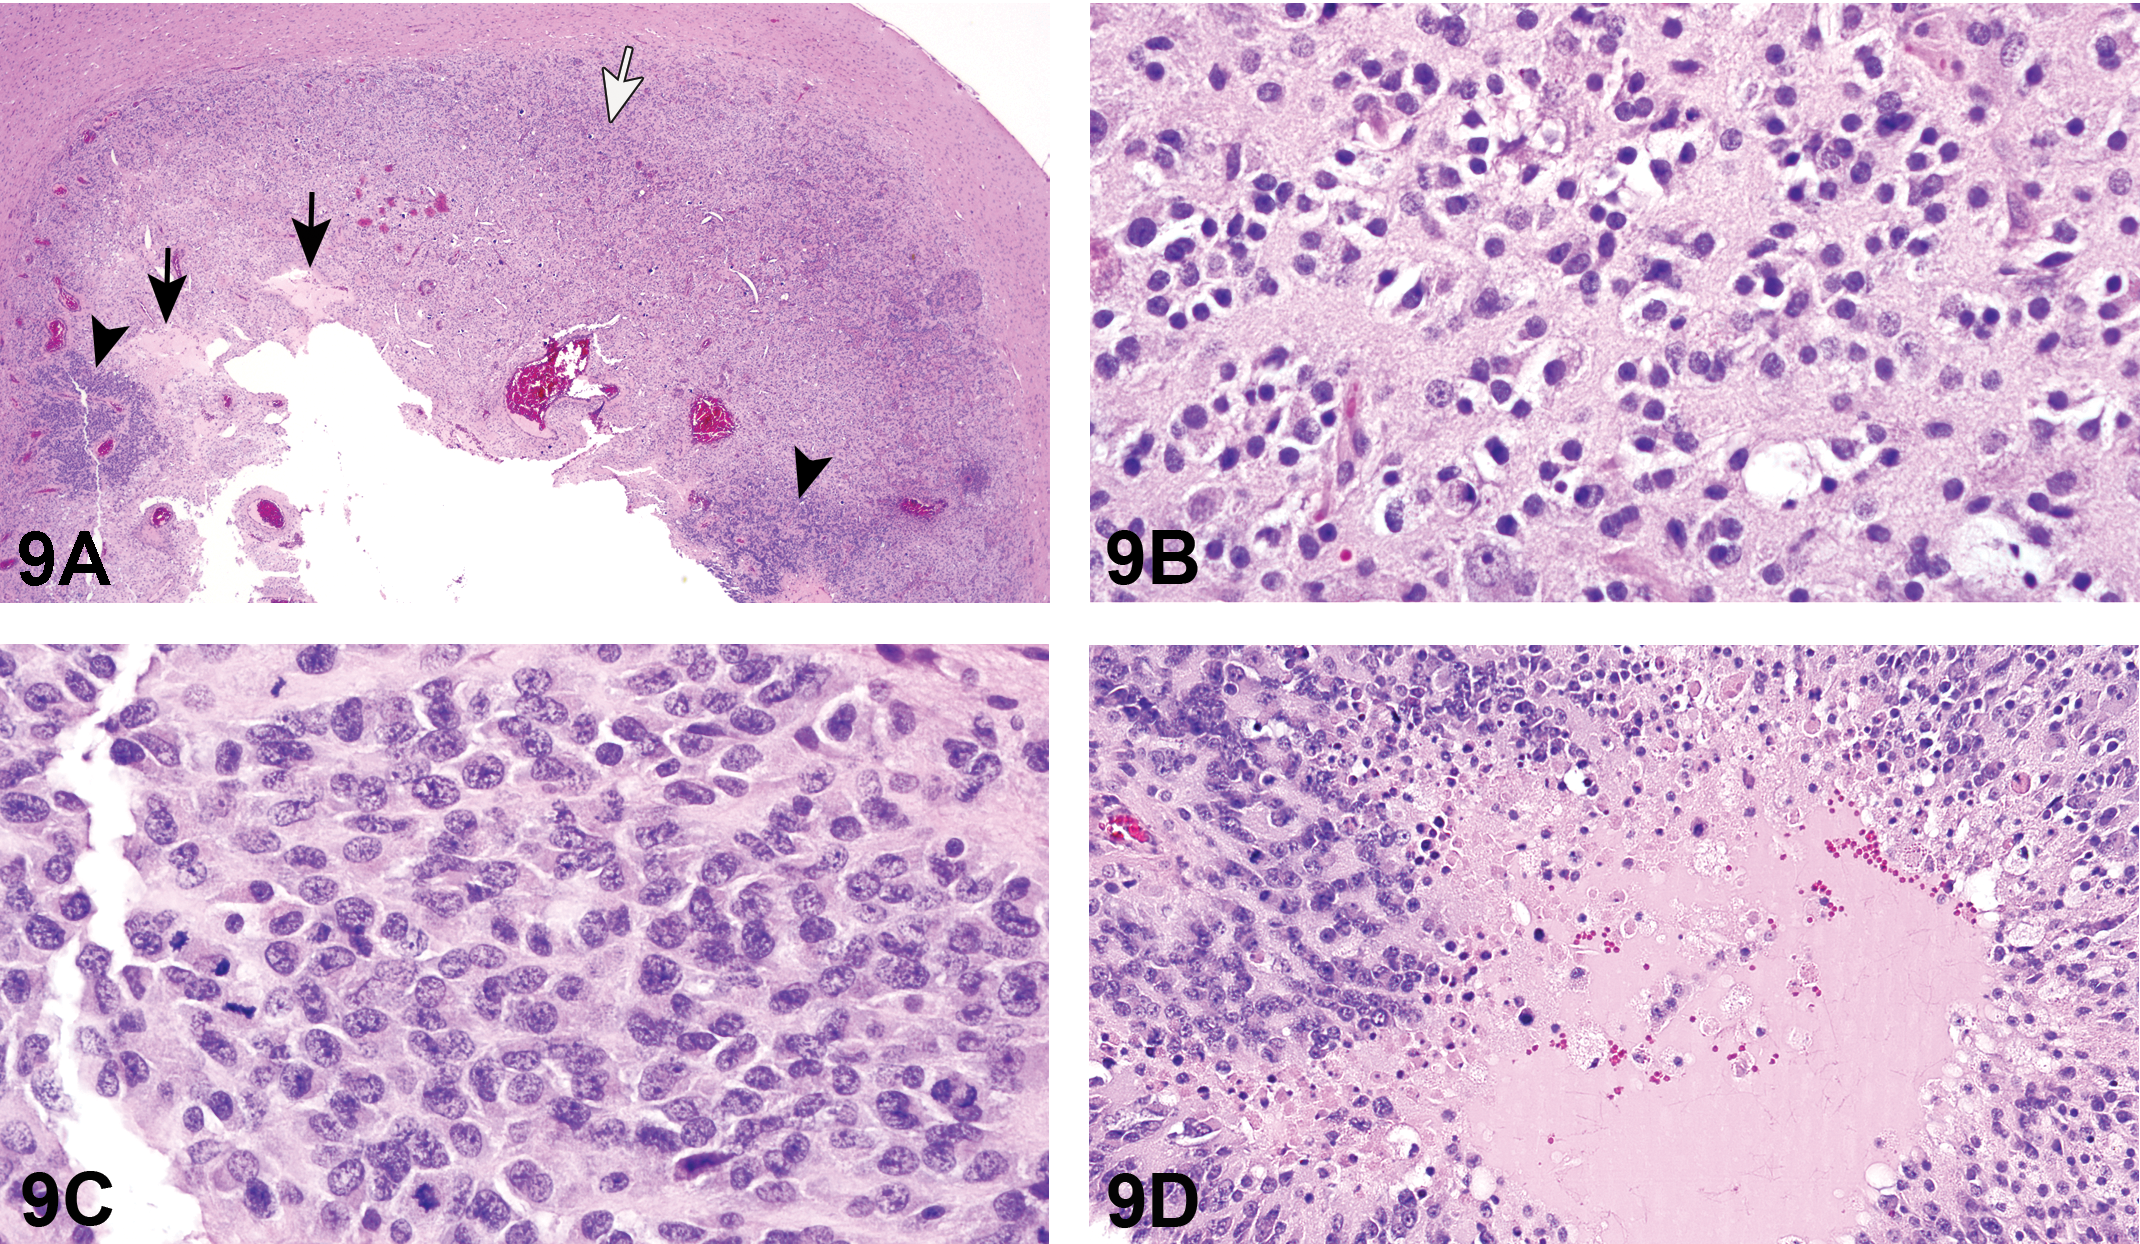
Brain tumor from a Harlan Sprague-Dawley (Hsd: SD) rat from a National Toxicology Program (NTP) chronic dosed feed toxicity and carcinogenicity bioassay presented as case 1. This is a well-demarcated mass that unilaterally expands the caudate putamen (A) and is composed of 2 morphologically distinct populations of neoplastic cells (white arrow region in A, higher magnification in B; black arrowhead regions in A, higher magnification in C). Much of the tumor is composed of one morphology (A, white arrow and B) characterized by a moderately dense population of neoplastic cells with small round nuclei and scant to moderate cytoplasm and rare mitoses. The other morphology (A, black arrowheads and C) is less abundant and characterized by multiple regions of densely cellular neoplastic cells. In these regions, the cells are larger and polygonal with moderate amounts of eosinophilic cytoplasm and intervening hyalinized matrix. Multifocal areas of necrosis (A, black arrows; D, higher magnification) are also present. H&E.
The majority of attendees selected the diagnosis of malignant mixed glioma (32.2%) for this lesion. The other diagnoses received from 22.1% to 0.7% of the votes: GBM (22.1%), malignant oligodendroglioma (14.8%), malignant astrocytoma (11.4%), malignant oligoastrocytoma (7.4%), malignant glioma (6.0%), malignant microglial cell tumor (5.4%), and other (0.7%). The NTP preferred diagnosis for this lesion was “malignant glioma” and is the recommended diagnosis for the majority of brain glial tumors prior to further characterization by IHC.
Low- and high-magnification images of each IHC stain from case 1 were shown to the audience. The majority of the tumor was immunopositive for GFAP, Olig2, and GS (Figures 9E–G as examples); although, the focal regions described above were strongly positive for Olig2, weakly positive for GS, and negative for GFAP. There were numerous Iba1 positive cells within and surrounding the tumor (Figure 9H), which were thought to be reactive microglial cells walling the tumor off from the adjacent neural parenchyma. Nestin positive cells were rare, and nestin staining was predominantly restricted to the endothelium (not shown). For this vote, based on IHC results, the majority of attendees selected malignant mixed glioma (32.6%), which was also the speaker’s preferred diagnosis. The other diagnoses received from 19.6% to 1.4% of the votes: malignant oligodendroglioma (19.6%), malignant oligoastrocytoma (15.9%), GBM (12.3%), malignant glioma (11.6%), malignant astrocytoma (4.3%), malignant microglial cell tumor (2.2%), and other (1.4%). Interestingly, there was a decrease in votes after the IHC discussion for both GBM and malignant astrocytoma, despite the presence of GFAP-positive staining within the majority of the neoplastic cell population.
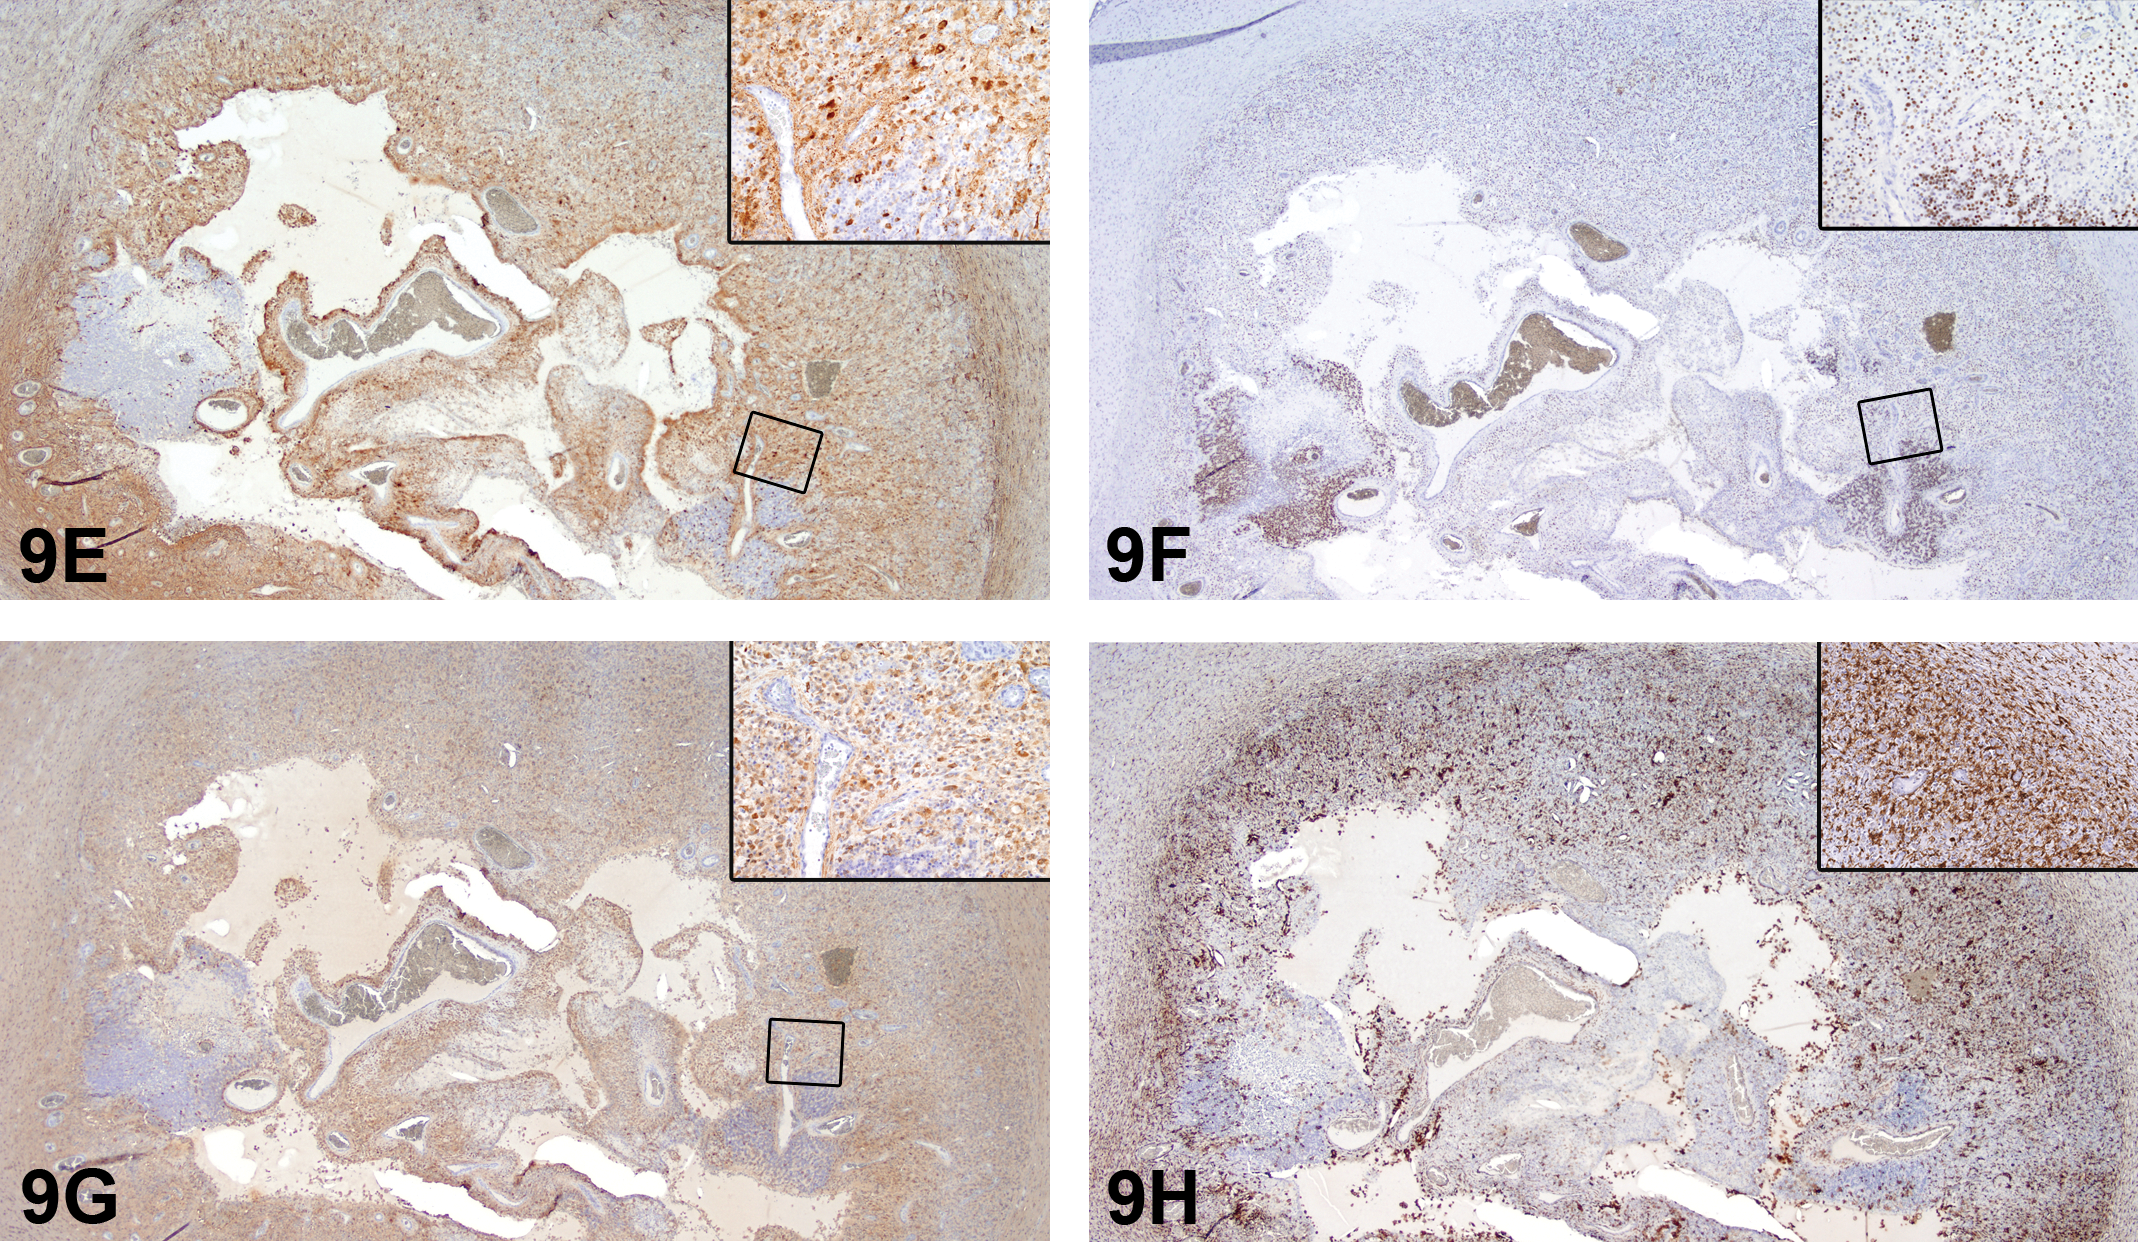
Immunohistochemical evaluation of the brain tumor from case 1 at low magnifications and insets with high magnifications for each panel. The majority of neoplastic cells are immunopositive for glial fibrillary acidic protein (GFAP; E), Olig2 (F), and glutamine synthetase (GS; G), although there are multifocal small regions which are GFAP negative. There are ionized calcium binding adaptor molecule 1 (Iba1) immunopositive cells within and surrounding the tumor (H), but these cells were interpreted to be reactive microglial cells, isolating the tumor from the adjacent neural parenchyma.
Low- and high-magnification images of H&E-stained sections from case 2 were shown to the voting audience (Figures 9I–K as examples). This tumor was a well-demarcated mass unilaterally expanding the caudate putamen. The tumor was composed of a densely cellular population of relatively monomorphic neoplastic cells that had small round nuclei with moderate cytoplasm and rare mitoses. There were multiple areas of palisading necrosis and endothelial proliferation along the periphery of the tumor, creating distinct vascular garlands.
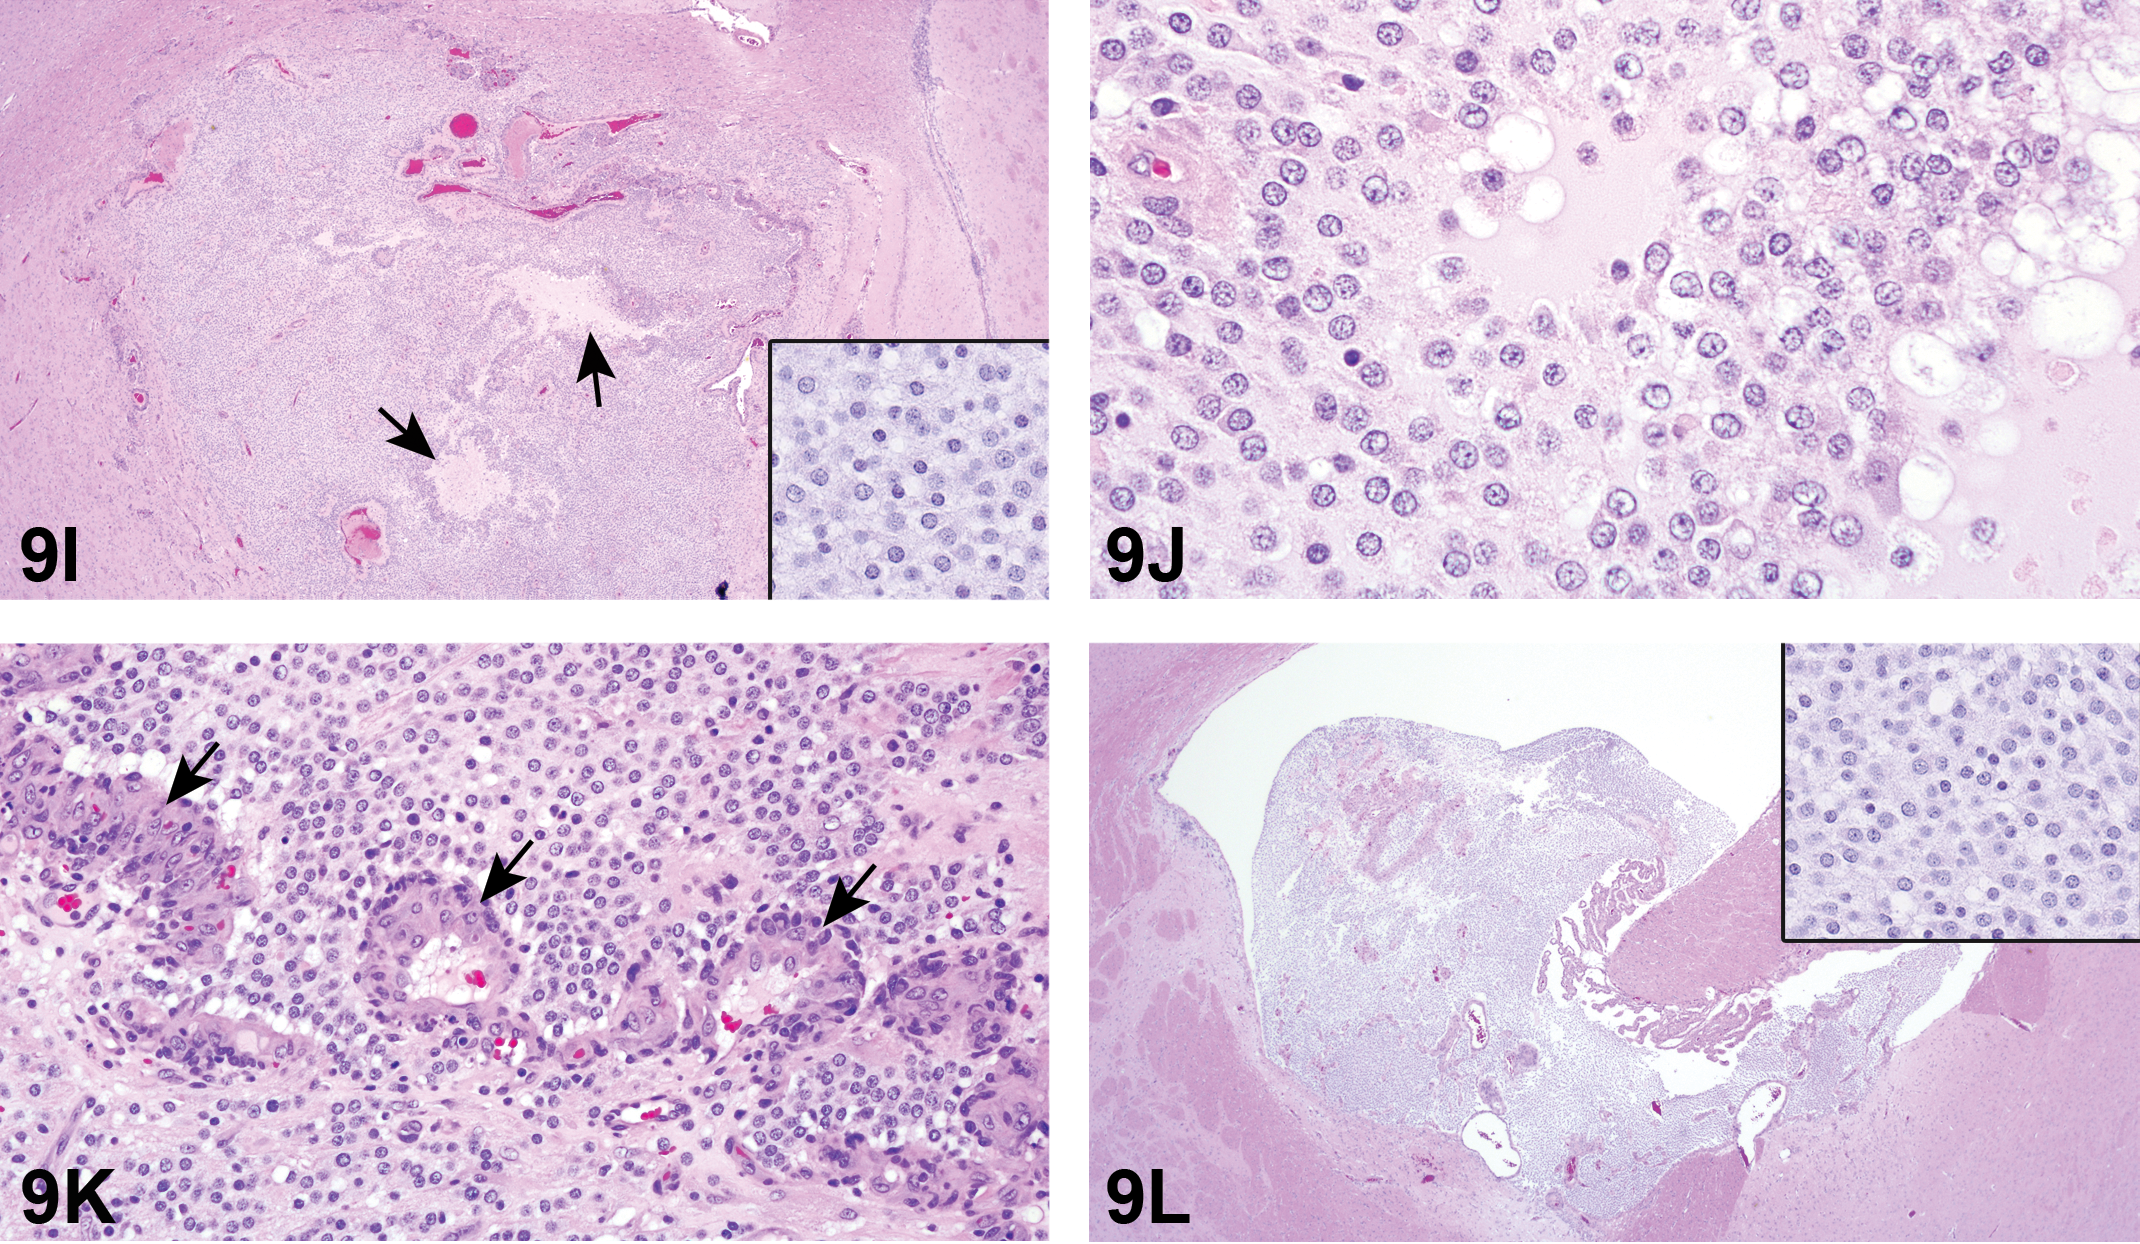
Brain tumor from an Hsd: SD rat from an NTP chronic dosed feed toxicity and carcinogenicity bioassay presented in case 2. At low magnification (I), the tumor is well demarcated from the adjacent neural parenchyma and is composed of a dense, relatively monomorphic, neoplastic cell population with small round nuclei with moderate cytoplasm and rare mitoses (I, inset). Multifocally, neoplastic cells palisade around necrotic foci (I, arrows; J, higher magnification). Endothelial proliferation creates distinct vascular garlands along the tumor periphery (K, black arrows). Additional low- and high-magnification images from a more rostral brain section represent neoplastic infiltration of the lateral ventricle (L), where these cells exhibit the classic “honeycomb” pattern (L, inset) associated with oligodendrogliomas. H&E.
The majority of attendees selected GBM (30.5%) as the best diagnosis for this lesion. The other diagnoses received from 28.2% to 0.0% of the votes: malignant oligodendroglioma (28.2%), malignant astrocytoma (16.8%), malignant glioma (9.2%), ependymoma (6.1%), malignant microglial cell tumor (5.3%), malignant mixed glioma (2.3%), malignant oligoastrocytoma (1.5%), and other (0.0%). As with the first case, the NTP-preferred diagnosis was malignant glioma and is the NTP-recommended diagnosis for the majority of brain glial tumors prior to further characterization by IHC.
Additional low- and high-magnification images (Figure 9L, inset) taken of the tumor from a more rostral brain section were then shown to the audience. These images depict the tumor within the lateral ventricle of the brain and the neoplastic cells exhibit the classical “honeycomb” pattern seen with oligodendrogliomas.
Low- and high-magnification images of each IHC stain from case 2 were then shown to the audience. The majority of the tumor was immunopositive for GFAP, Olig2, and GS (Figures 9M–O, respectively), and dual positivity for GFAP and Olig2 was present within neoplastic cells. There were small numbers of Iba1 positive cells within and surrounding the tumor, which were thought to be reactive microglial cells and not part of the neoplasm (Figure 9P). Nestin-positive cells were rare, and nestin staining was predominantly restricted to the endothelium (not shown). The voting choices made available to the audience were the same as those shown for H&E voting. The majority of attendees selected malignant oligodendroglioma (39.6%). The other diagnoses received from 20.9% to 0.0% of the votes: malignant mixed glioma (20.9%), malignant glioma (15.7%), GBM (13.4%), malignant oligoastrocytoma (8.2%), malignant astrocytoma (1.5%), malignant microglial cell tumor (0.7%), and other (0.0%). Again, there was a decrease in votes after the IHC discussion for both GBM and malignant astrocytoma, despite the presence of GFAP-positive staining within the majority of the neoplastic cell population. However, there may have been some influence from the additional H&E sections shown after the case 2 H&E vote.
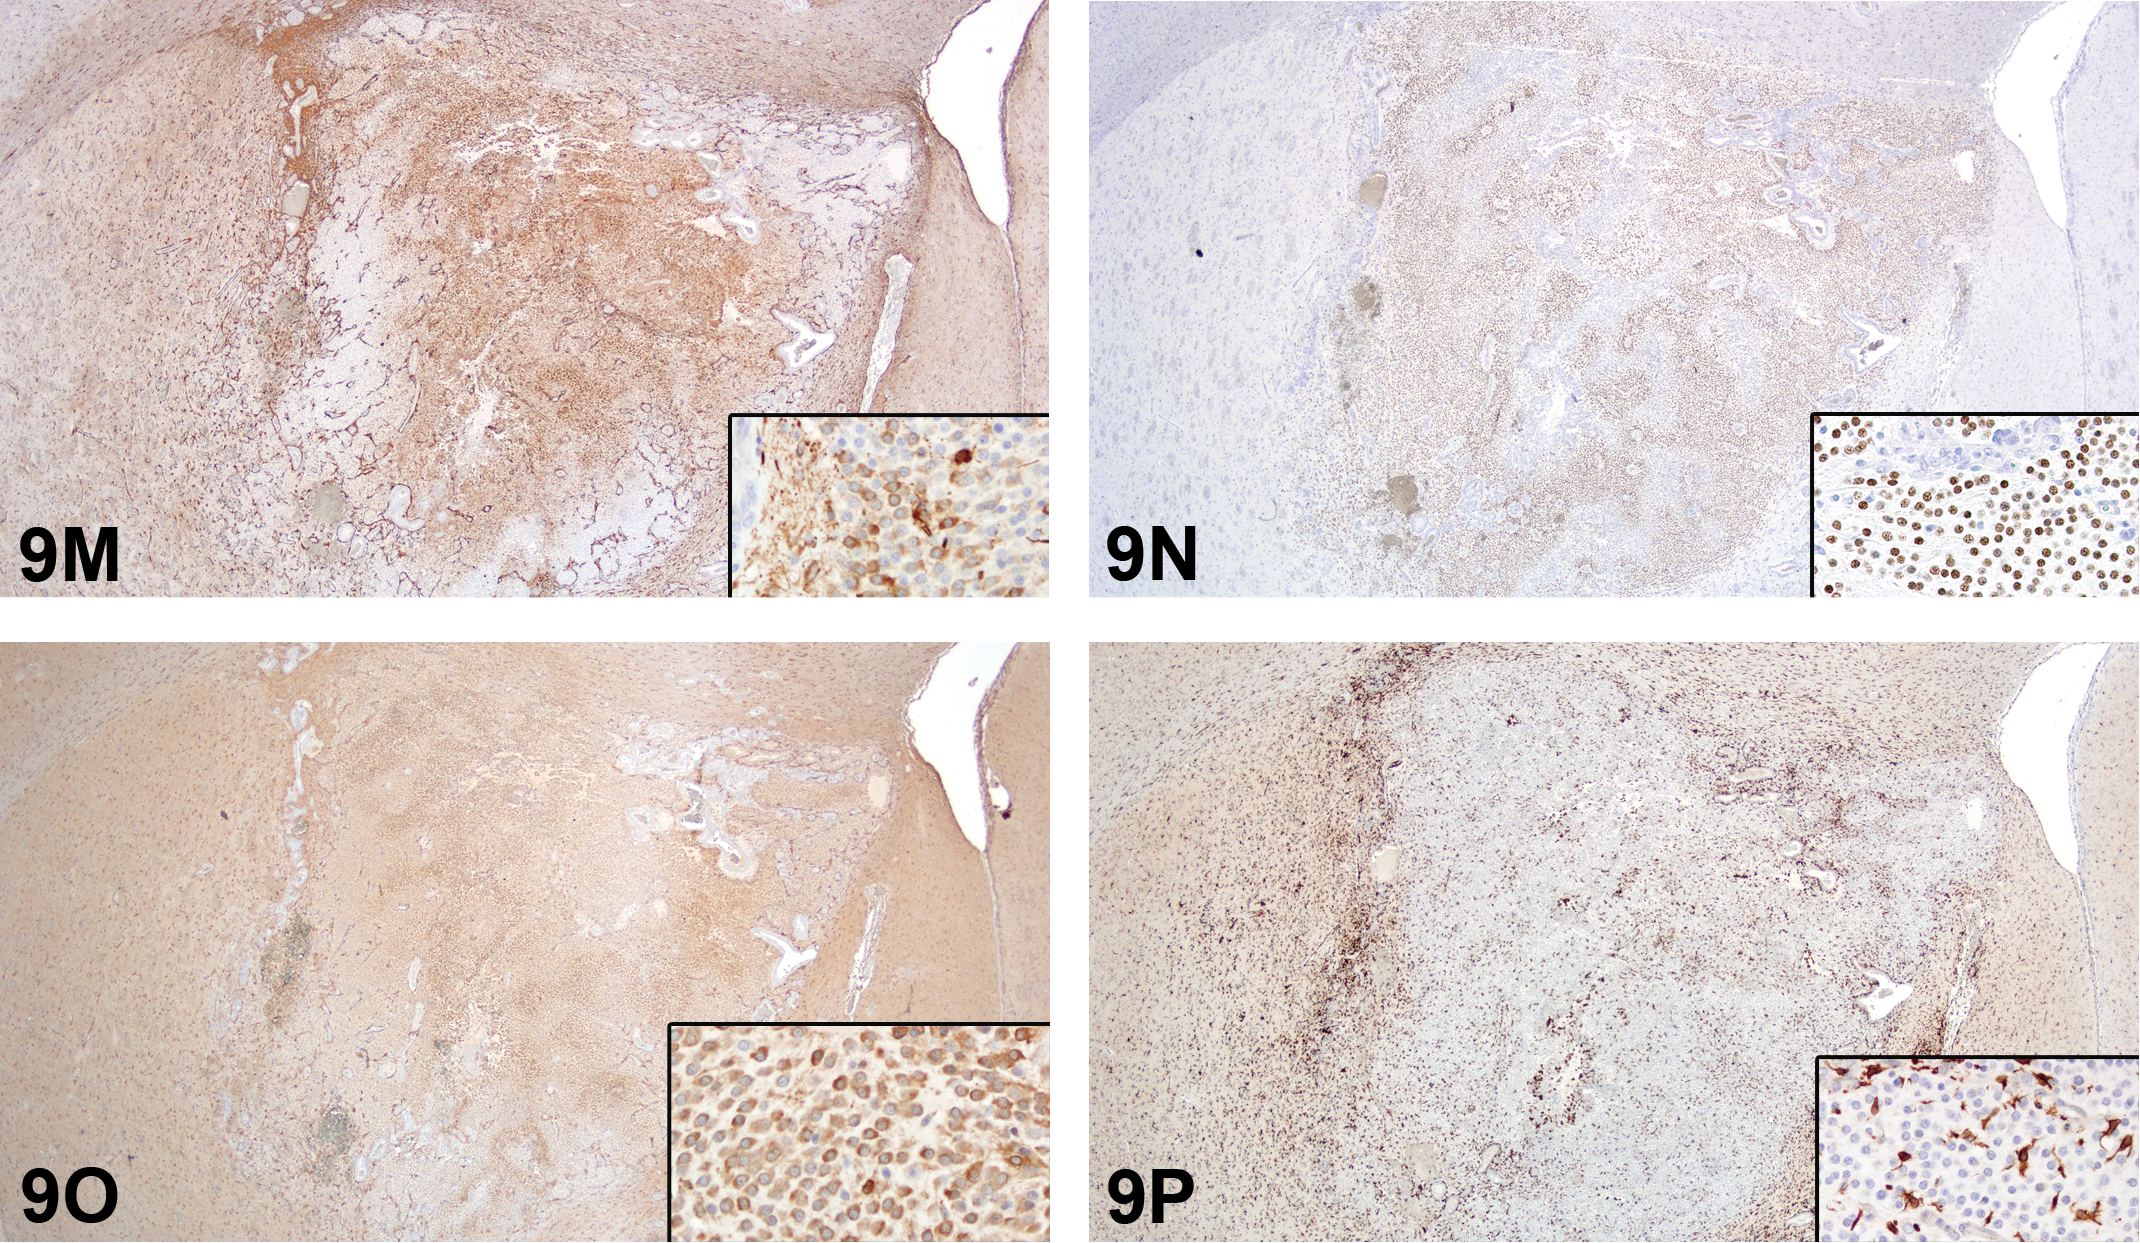
Immunohistochemical evaluation of the brain tumor from case 2 at low magnifications and insets with high magnifications for each panel. The majority of neoplastic cells were immunopositive for GFAP (M), Olig2 (N), and GS (O). There were Iba1-positive cells within and surrounding the tumor (P), which were interpreted to be reactive, rather than neoplastic, microglial cells.
As stated above, the current recommendation of the NTP is to diagnose the majority of brain glial tumors as malignant glioma and then to perform IHC for additional characterization if there is an exposure-related increase in brain tumors. So the recommended diagnosis for cases 1 and 2 (H&E-stained slides) was malignant glioma.
Due to the multiple cellular morphologies and multiple IHC staining patterns, case 1 was best diagnosed as a mixed glioma, which was confirmed by the audience. Malignant astrocytoma and malignant oligodendroglioma were ruled out due to the mixed neoplastic cell population. Malignant oligoastrocytoma is a term used in human medicine, and it, along with anaplastic oligoastrocytomas, represents the mixed glioma category l (Kleihues and Cavenee 2000). Although case 1 had 2 distinct neoplastic glial cell populations and for the most part low mitotic activity, there was necrosis and microvascular proliferation that is not reported for oligoastrocytomas (Kleihues and Cavenee 2000). Malignant microglial tumor was ruled out due to lack of neoplastic cell Iba1 immunoreactivity. Some of the features of GBM were present in this tumor, such as regions of marked hypercellularity and focal regions of high mitotic index, but the neoplastic cells did not exhibit palisading necrosis and there was not extensive endothelial proliferation/vascular garland formation.
Even though the majority of the neoplastic cells in case 2 were GFAP positive, the diffuse Olig2 positivity, the cellular characteristics, the peri/intraventricular location, and presence of vascular garlands suggested that malignant oligodendroglioma was the most appropriate diagnosis, which was the speaker’s and audience’s preferred diagnosis. The cellular features were not consistent with those reported for the various forms of malignant astrocytoma in humans (Kleihues and Cavenee 2000). Malignant oligoastrocytoma was ruled out due to the lack of 2 distinct neoplastic glial cell populations and the presence of necrosis and microvascular proliferation. The lack of neoplastic cell Iba1 immunoreactivity ruled out malignant microglial tumor. Malignant mixed glioma was ruled out due to the lack of multiple neoplastic cell morphologies. The key features differentiating GBM from lower grade gliomas are palisading necrosis and endothelial proliferation/vascular garland formation. Although these key features were present, this tumor did not have a high mitotic index and had a relatively monomorphic population of neoplastic cells.
The recommendation of combining all brain tumors under the single term of malignant glioma when diagnosed solely with H&E-stained slides was a suggested discussion point. A related suggested discussion point was made regarding malignant oligodendrogliomas, which have the classic honeycomb appearance, and was apparent in the more rostral section of case 2a, and whether or not the umbrella diagnosis of malignant glioma should be used in this situation since it is so recognizable. One participant discussed that the INHAND nervous system working group had considered all of the current WHO human brain tumor diagnoses such as the subtypes of astrocytoma and oligoastrocytoma, but that the tumors seen in rodents did not fit the diagnostic criteria of those tumors. Another participant indicated that malignant glioma was an acceptable initial diagnosis for brain tumors, with IHC or other molecular characterization as necessary to determine the cellular origin. This commenter also noted that these 2 tumors were well demarcated, which is a distinct difference from the poorly circumscribed and highly infiltrative tumors that have been classically called astrocytomas, but that have recently been shown to have immunohistochemical features consistent with cells of macrophage origin, that is, microglial cells (Kolenda-Roberts et al. 2013; Nagatani et al. 2009; Nakamura et al. 2013).
The expected IHC findings for select human and rat brain tumors are summarized in Table 16. GS and nestin IHC staining was similar in the 2 presented tumors. Nestin immunopositivity was largely restricted to blood vessels with very rare positive neoplastic cells, but the endothelial reactivity provided an excellent internal positive control. Also, the nestin stain nicely highlighted the vascular proliferation seen predominantly along the tumor leading edge, which has been previously reported (Sugawara et al. 2002). Nestin expression in gliomas has impact on clinical outcome in human patients (Yang et al. 2008; Zhang et al. 2008). GS expression is expected in astrocytomas and is variable in oligodendrogliomas (Pilkington and Lantos 1982; Zhuang et al. 2011).
Expected Immunohistochemical Results for Select Human (Shaded Rows) and Rat Brain Tumors. Increased Neoplastic Cell Expression of Nestin Occurs in Higher Grade Human Brain Tumors.a
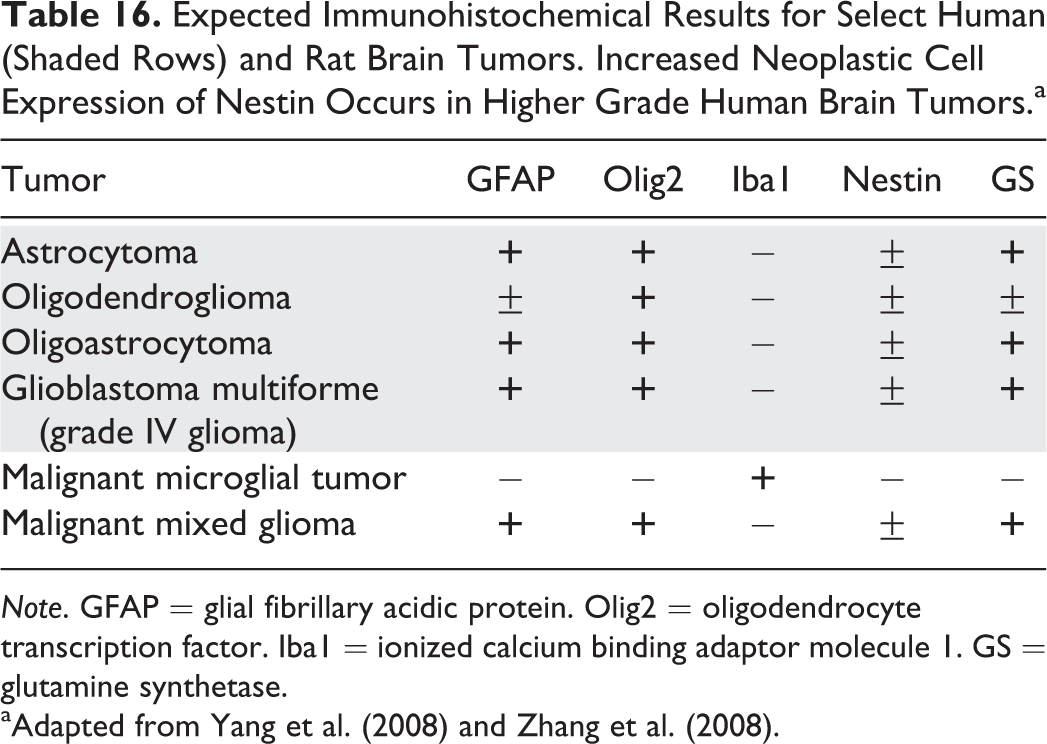
Note. GFAP = glial fibrillary acidic protein. Olig2 = oligodendrocyte transcription factor. Iba1 = ionized calcium binding adaptor molecule 1. GS = glutamine synthetase.
aAdapted from Yang et al. (2008) and Zhang et al. (2008).
There is only one other report of GFAP-positive cells within rat brain tumors (Nagatani et al. 2013). Although the authors of this previous report called the GFAP-positive cells “astrocytes,” it seems as if many of the GFAP-positive cells are also reported to be Olig2 positive and thus determining if the cells were of astroglial or oligodendroglial origin is unclear based solely on IHC analysis. It is not uncommon for tumors of astrocytic or oligodendrocytic origin in humans, particularly those of higher grade, to have both Olig2 and GFAP expression (Ohnishi et al. 2003; Otero, Rowitch, and Vandenberg 2011), as these cells share a common precursor cell (Levison and Goldman 1993). The World Health Organization has stated that the “pronounced phenotypic heterogeneity of the astroglial and oligodendroglial cell lineages and a lack of reliable markers make it difficult to define precise diagnostic criteria” (Kleihues and Cavenee 2000, 63–67). Based on the cases presented here, this may also hold true for malignant neuroepithelial tumors in the rat. Although valuable markers in many well-differentiated cases, the application of Olig 2 and GFAP IHC to determine histogenesis of higher grade glial neoplasms may have similar limitations as in humans.
The Contralateral Mammary Gland: Missing the “Whole” Story
Dr. Schantel Hayes-Bouknight (Charles River Laboratories, Inc.) presented 2 cases on a cost-effective technique to facilitate the use of whole mounts for histopathologic evaluation of mammary gland alterations. Collaborators on this project were Deirdre Tucker (predoctoral fellow, NTP, NIEHS, UNC-Chapel Hill), Dr. Suzanne Fenton (Reproductive Endocrinology Laboratory Group Leader, NTP, NIEHS, RTP, NC), Julie Foley (NTP, NIEHS, RTP, NC), and the NTP pathologist, Dr. Susan Elmore (NTP, NIEHS, RTP, NC).
Dr. Hayes-Bouknight began her presentation with a brief overview of traditional mammary gland evaluation techniques. Typically, the 4th and 5th mammary glands are collected at the time of necropsy for whole mount evaluation, using the inguinal lymph node as an anatomical landmark, on one side of the animal. Collected glands are laid flat on a dry glass slide, fixed with Carnoy’s solution, stained with carmine alum stain, and then cleared in xylene (Davis and Fenton 2013; Plante, Stewart, and Laird 2011). The contralateral gland is processed for histology. Two cases prepared by traditional mammary gland techniques were presented to the audience for voting. Mammary glands from both cases were from 14-month-old Charles River CD1 mice (Crl:CD-1[ICR]) that were part of a large ongoing gavage study. Mice were treated with the test article 2 times daily from GD 10 to 17 and exposed via lactation until weaning at postnatal day 21. For each case, the mammary gland whole mount was presented first for review and voting, followed by the H&E section from the contralateral gland.
The first case presented for voting was a mammary gland whole mount that contained an area of increased opacity that surrounded ducts and stromal structures of the mammary gland (Figure 10A). While the majority of the audience participants voted for lobuloalveolar hyperplasia (40%), the correct answer was increased opacity (8%). Voting results for other choices were mammary gland within normal limits (18%), accelerated mammary gland development (11%), atypical hyperplasia (10%), artifact (10%), decreased opacity (2%), inflammation (1%), and neoplasia (0%). The contralateral H&E-stained mammary gland consisted of uniform adipocytes and 3 ducts lined by morphologically normal columnar epithelial cells (Figure 10B). The majority of audience participants voted for the correct answer, mammary gland within normal limits (74%). Fewer participants voted for inflammation (7%), lobuloalveolar hyperplasia (7%), accelerated mammary gland development (4%), other (4%), atypical hyperplasia (3%), or artifact (1%). No participants voted for neoplasia.
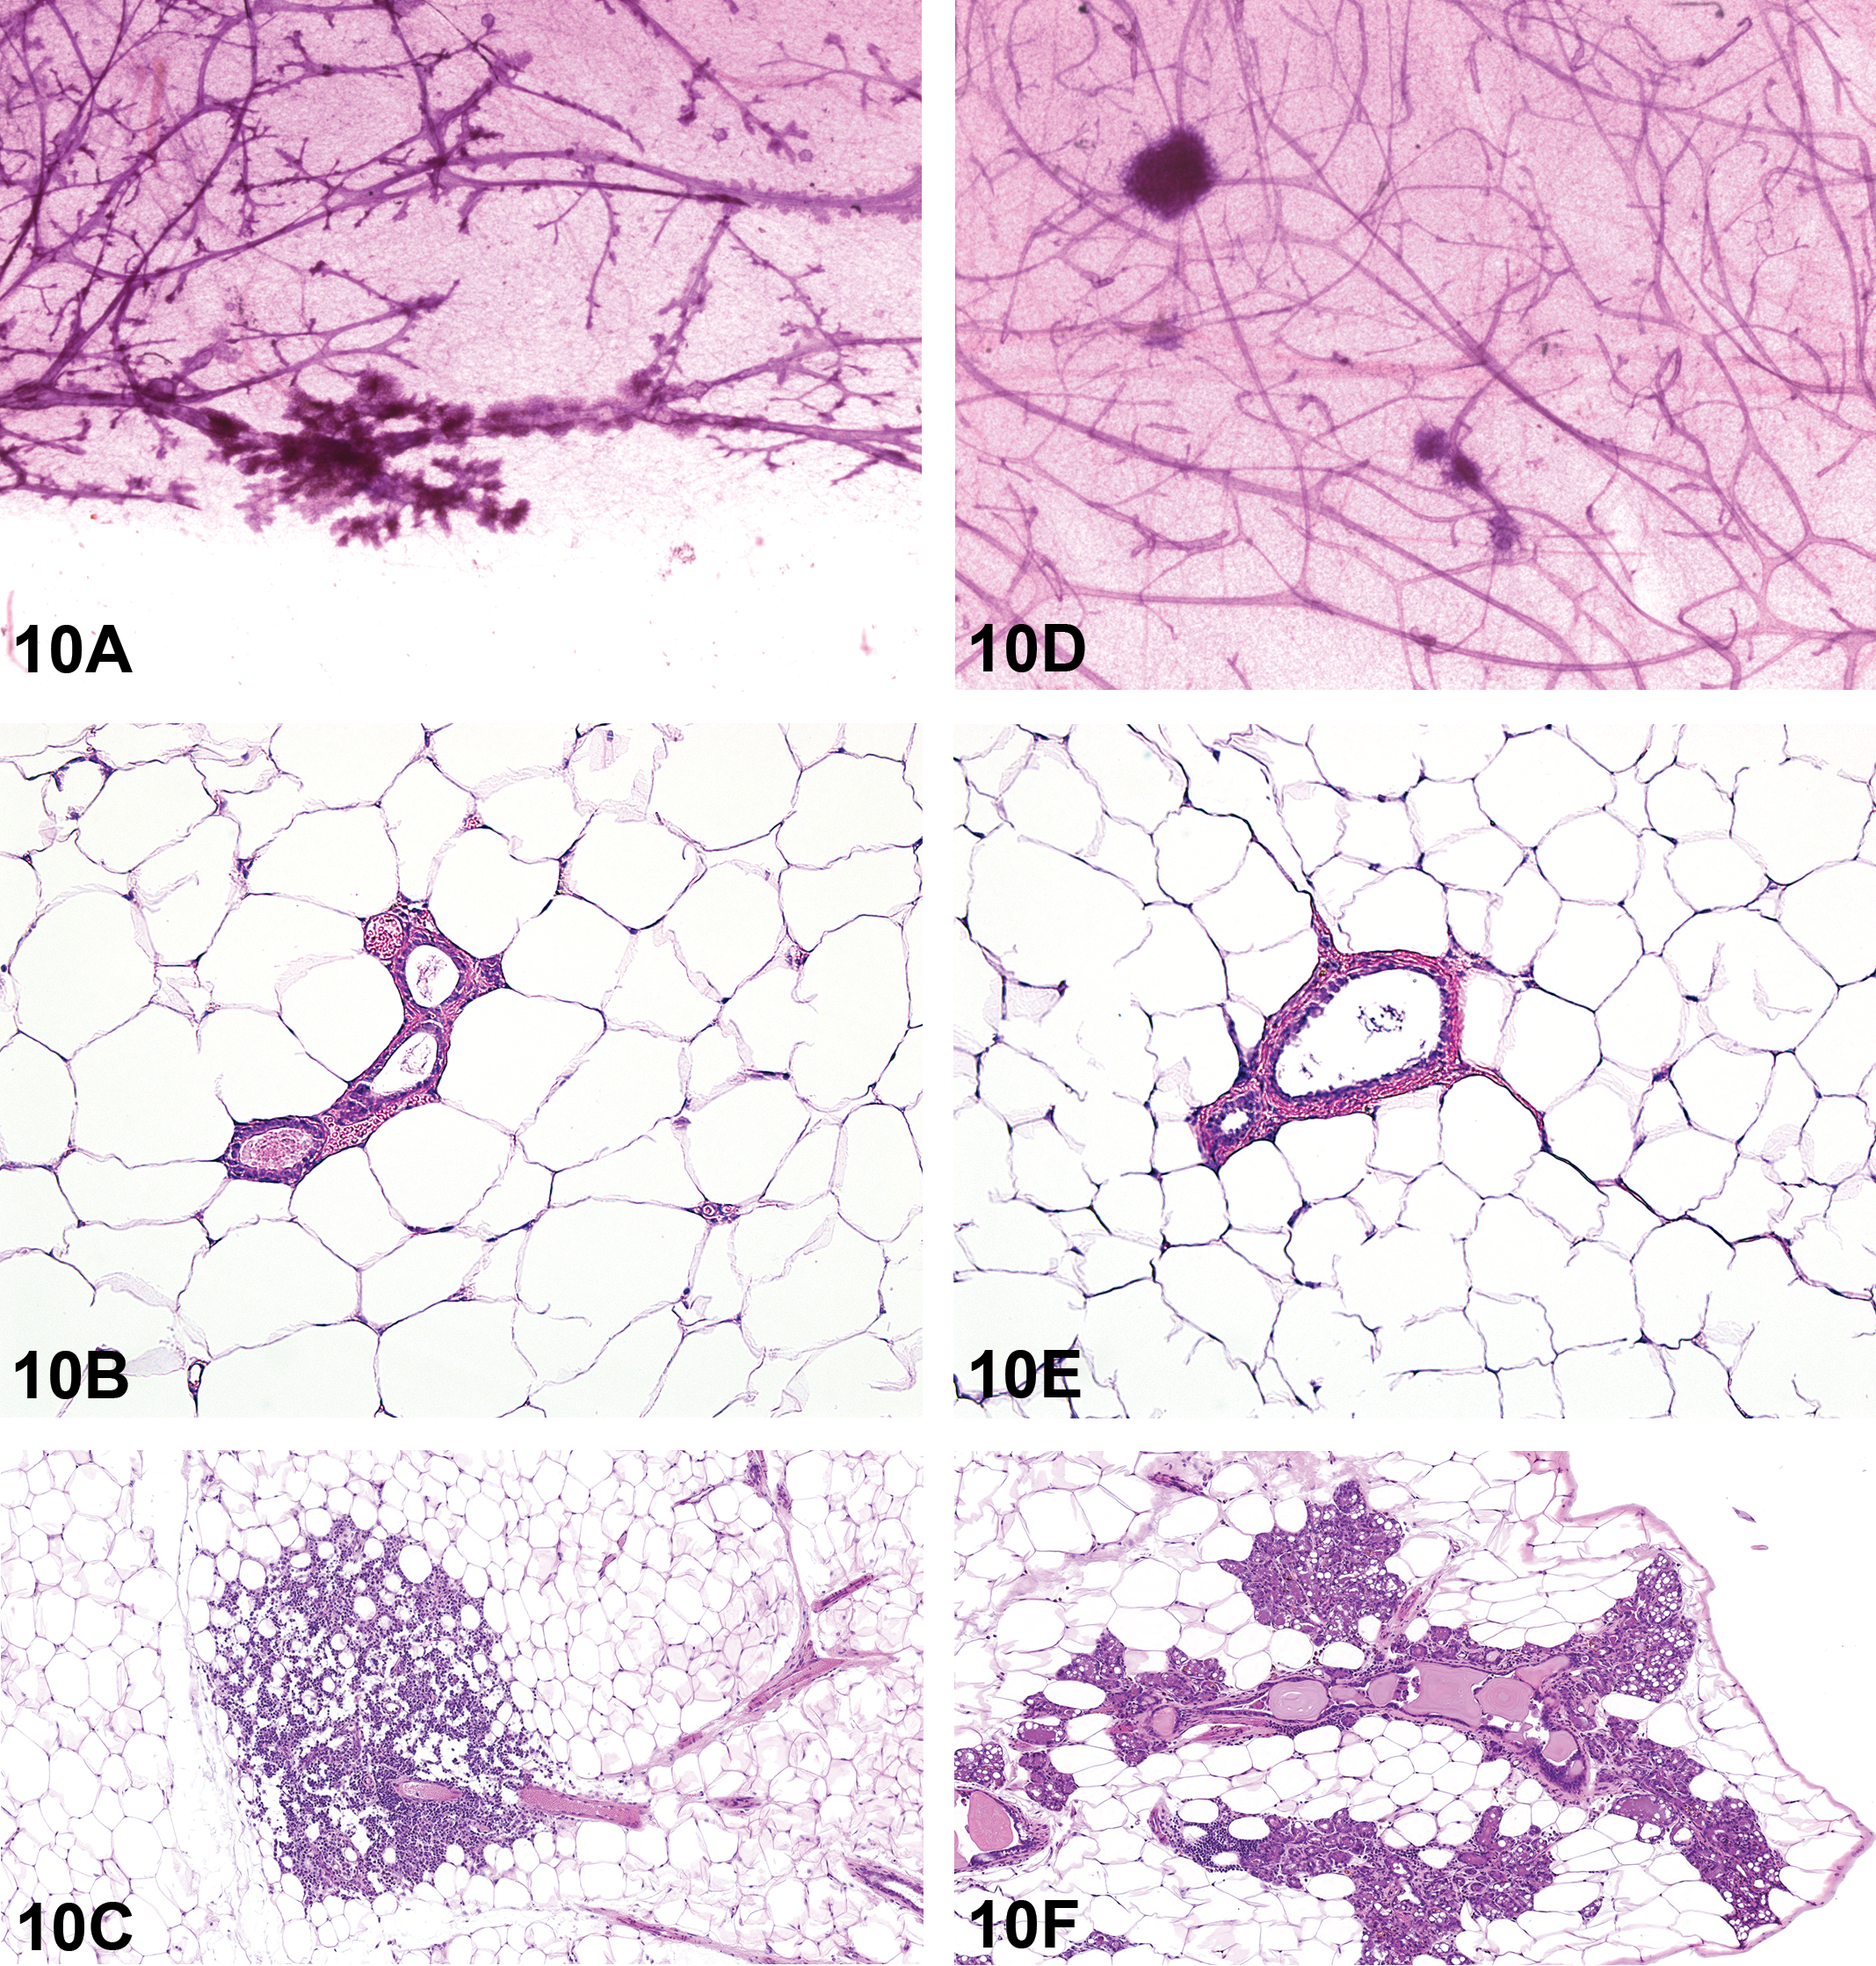
Comparison of mammary gland whole mounts (A and D) to the formalin-fixed, H&E-stained contralateral mammary glands (B and E) and the whole mount mammary glands that were then processed for histology (C&F). Case 1 (A–C) represents a case of perivascular inflammation. There is an increased opacity around ducts and stromal structures in the carmine stained mammary gland whole mount (A). (B) is the contralateral mammary gland section with no histopathologic findings. (C) is a low-magnification H&E of the mammary gland prepared from the whole mount that shows clusters of mononuclear cells around the blood vessel and extending into the adjacent adipose tissue. Case 2 (D–F) represents lobuloalveolar hyperplasia. In (D), there is an increased opacity around ducts and stromal structures in the carmine stained mammary whole mount. (E) is the contralateral mammary gland section with no histopathologic findings. (F) is a low-magnification H&E of the mammary gland prepared from the whole mount that shows enlargement of the lobule due to an increase in the number and size of cells (lobuloalveolar hyperplasia).
The second case was similar to the first, as the mammary gland whole mount illustrated multifocal areas of increased opacity that surrounded ducts and stromal structures (Figure 10D). The majority of the audience participants correctly identified the whole mount lesion as increased opacity (35%), most likely due to prior discussion of the correct answer for case one. Fewer participants voted for lobuloalveolar hyperplasia (16%), mammary gland within normal limits (16%), artifact (14%), atypical hyperplasia (8%), decreased opacity (6%), accelerated mammary gland development (2%), neoplasia (2%), and inflammation (1%). The contralateral H&E-stained mammary gland consisted of uniform adipocytes and 2 ducts lined by morphologically normal columnar epithelial cells (Figure 10E). The majority of the audience correctly identified the contralateral mammary gland as within normal limits (96%), and a few participants voted for atypical hyperplasia (2%), lobuloalveolar hyperplasia (1%), and inflammation (1%). No audience participants voted for neoplasia, accelerated mammary gland development, artifact, or other.
At the end of the presentation, the 2 cases were reviewed with the H&E section prepared from the mammary gland whole mount. For the first case, the new H&E section of the mammary gland contained inflammation composed of moderate numbers of lymphocytes and plasma cells that surrounded a large blood vessel and extended into the adjacent adipose tissue (Figure 10C). For the second case, the mammary gland lobular architecture was maintained but was enlarged multifocally by increased numbers and size of normal alveoli and ducts (lobuloalveolar hyperplasia; Figure 10F). Alveolar epithelial cells were well differentiated, round, often vacuolated, and formed one concentric layer around a lumen that typically contained proteinaceous fluid. Ducts were lined by columnar cells and were similar to alveolar cells, with well-differentiated epithelium that formed one concentric layer. Alveoli and ducts were normally distributed, and there was no evidence of compression or cellular atypia.
Mammary gland whole mounts are an invaluable tool, primarily used in rodent studies, to identify morphologic changes, as well as the temporal and spatial progression of epithelial development as it allows visualization of ductal branching and glandular densities (Davis and Fenton 2013; Osborne, Rudel, and Schwarzman 2015). While the whole mount preparation allows visualization of the entire gland for structural assessment, cellular features of the mammary gland are best evaluated by histological examination of longitudinal sections (Elmore et al. 2016). Use of both whole mount and H&E-stained section evaluation is recommended, as it provides a better understanding of the morphological changes as well as cellular alterations (Plante, Stewart, and Laird 2011). However, evaluating 2 different mammary glands cannot allow for the conclusive diagnosis of the lesion(s) seen as increased opacity on a whole mount. Also, acquiring and evaluating mammary glands from both sides of the animal may not be practical (tissue may be required for biochemical and biomarker evaluation) or, as represented in the cases presented, abnormalities may occur unilaterally. To address these potential issues, an inexpensive and streamlined protocol was developed to examine H&E-stained paraffin sections of the original mammary gland whole mount using bright field microscopy.
Materials and methods for mammary gland whole mount to H&E preparation have been described in Tucker et al. (2016) and are briefly described here. High-quality images were prepared by scanning the whole mount mammary gland glass slide on a flatbed scanner for archiving. Mammary gland whole mounts were immersed overnight in xylene to remove the glass coverslip. Tissues were scraped from the slide with a sharp disposable razor blade into a petri dish containing xylene. Two techniques were explored for optimization. In the first technique, a punch biopsy was used to target regions of interest from the mammary gland. For the second technique, glands were halved at the midline (at lymph node) and placed in 2 histology cassettes (labeled 1 and 2). Punch biopsies or halves were placed in histology cassettes for processing. The cassettes were held in xylene for up to 2 hr before being placed on the tissue processor (Leica Microsystems TP1020, Chicago, IL). Tissues were processed in xylene for 30 min. This step was repeated and followed by immersion in a 1:1 xylene:molten paraffin (30 min). The cassettes were then transferred to the next station, which consisted of molten paraffin (1 hr), followed by another incubation in molten paraffin (2 hr). Processor settings included a temperature of 60°C and the vacuum on for all stations. Finally, the mammary pad was embedded in paraffin with the flat surface down (side adjacent to the glass slide). Prior to sectioning, the paraffin blocks were incubated at −20°C for 1 hr. Glands were sectioned at 4 µm and 6 µm using a low-profile blade (Sakura Finetek USA, Inc., Torrance, CA). All slides were incubated overnight at 37°C prior to an automated staining with H&E. Tissues sectioned at 4 µm were found to be superior in quality opposed to the thicker 6µm sections.
Thorough morphological evaluation of mammary glands should incorporate routine assessments of H&E-stained sections and morphological evaluations of whole mounted mammary glands. Ideally, these evaluations should be done on the same mammary gland in order to better define the lesions of increased opacity seen with the whole mounts. The method described in this presentation was designed to highlight the dual functionality of the mammary gland whole mount. We anticipate that this method will increase the awareness within the scientific community that the mammary gland can easily be incorporated into studies at minimal added cost and that this method will serve as a standardized protocol to reduce interlaboratory variability.
INHAND Collaboration with FDA on SEND
Dr. Thomas Nolte (Boehringer Ingelheim Pharma GmbH & Co. KG, Biberach [Riss], Germany) presented on behalf of the INHAND Global Editorial and Steering Committee (GESC). His topic was the cooperation of INHAND with the FDA on the SEND initiative.
With SEND the FDA intends to collect nonclinical data from different sources in a way that data can be analyzed not only within studies but also across studies from 1 sponsor and even across studies from different sponsors. This is possible only if all data submitted have the same organization, structure, and format. SEND defines these standards for nonclinical study data. They were developed by the Clinical Data Interchange Standards Consortium (CDISC) that is a nonprofit organization that develops standards not only for nonclinical studies but also for clinical studies (http://www.cdisc.org, accessed August 1, 2016). CDISC cooperates with the Enterprise Vocabulary Service (EVS) of the National Cancer Institute (NCI; http://evs.nci.nih.gov, accessed August 1, 2016). It is the role of the NCI-EVS to maintain and distribute the SEND terminology as part of the NCI thesaurus (https://ncit.nci.nih.gov/ncitbrowser/, accessed August 1, 2016). More information can be obtained from the CDISC home page (http://www.cancer.gov/research/resources/terminology/cdisc, accessed August 1, 2016).
Within SEND, nonclinical data are divided into different domains, for example, trial set (study-related parameters like study number and study type), clinical observation, organ measurement (organ- or tissue-related parameters like organ weight), macroscopic findings, and microscopic findings, among many others. Within each domain, all relevant variables are defined. For the domain of microscopic findings, this includes the microscopic finding as originally recorded by the sponsor, the standardized finding (base process), and modifiers like chronicity and distribution and several more. Codelists exist for base processes and modifiers. There are 2 codelists for base processes: 1 for nonneoplastic findings and 1 for neoplastic findings. These codelists contain the terminology maintained by the NCI-EVS.
The use of harmonized terminology and diagnostic criteria is key when histopathology data are to be standardized. This is where the interest of the FDA in the INHAND terminology originates from. The INHAND terminology was developed by expert working groups, has been reviewed by the scientific community, and has been published in peer-reviewed journals. These are the best prerequisites for global acceptance and application.
The INHAND terminology is generally adopted by SEND. In this respect, it is important to note that the format and structure of findings in SEND is different from that in INHAND: most importantly, (I) findings, called base processes in SEND, can be used across organs, and (II) composite terms are generally broken up into a base process and modifiers. Thus, it is important to “translate” INHAND findings into the format and structure of SEND findings, before they can be added to the codelists of nonneoplastic and neoplastic findings. While the codelist of neoplastic findings is almost complete and all INHAND terms known so far have been included, the nonneoplastic codelist is still growing. The presentation, therefore, focused on nonneoplastic findings.
The codelist of nonneoplastic terms contains findings from published INHAND organ systems. After a new organ system is published by INHAND, the initial map of microscopic findings defined in the publication is prepared by the GESC representative of the SEND team. This initial map is then reviewed by the Organ Working Group (OWG) chair. Once alignment is achieved between the OWG chair and the GESC representative, the map is provided to the NCI-EVS representative. The NCI-EVS representative coordinates with the SEND-Controlled Terminology Group to review the map. A general overview of this process is provided in Figure 11. Any need for clarification is discussed between the OWG chair and the GESC representative. After final agreement has been achieved, the new terms will be added to the SEND nonneoplastic codelist during the next quarterly update.
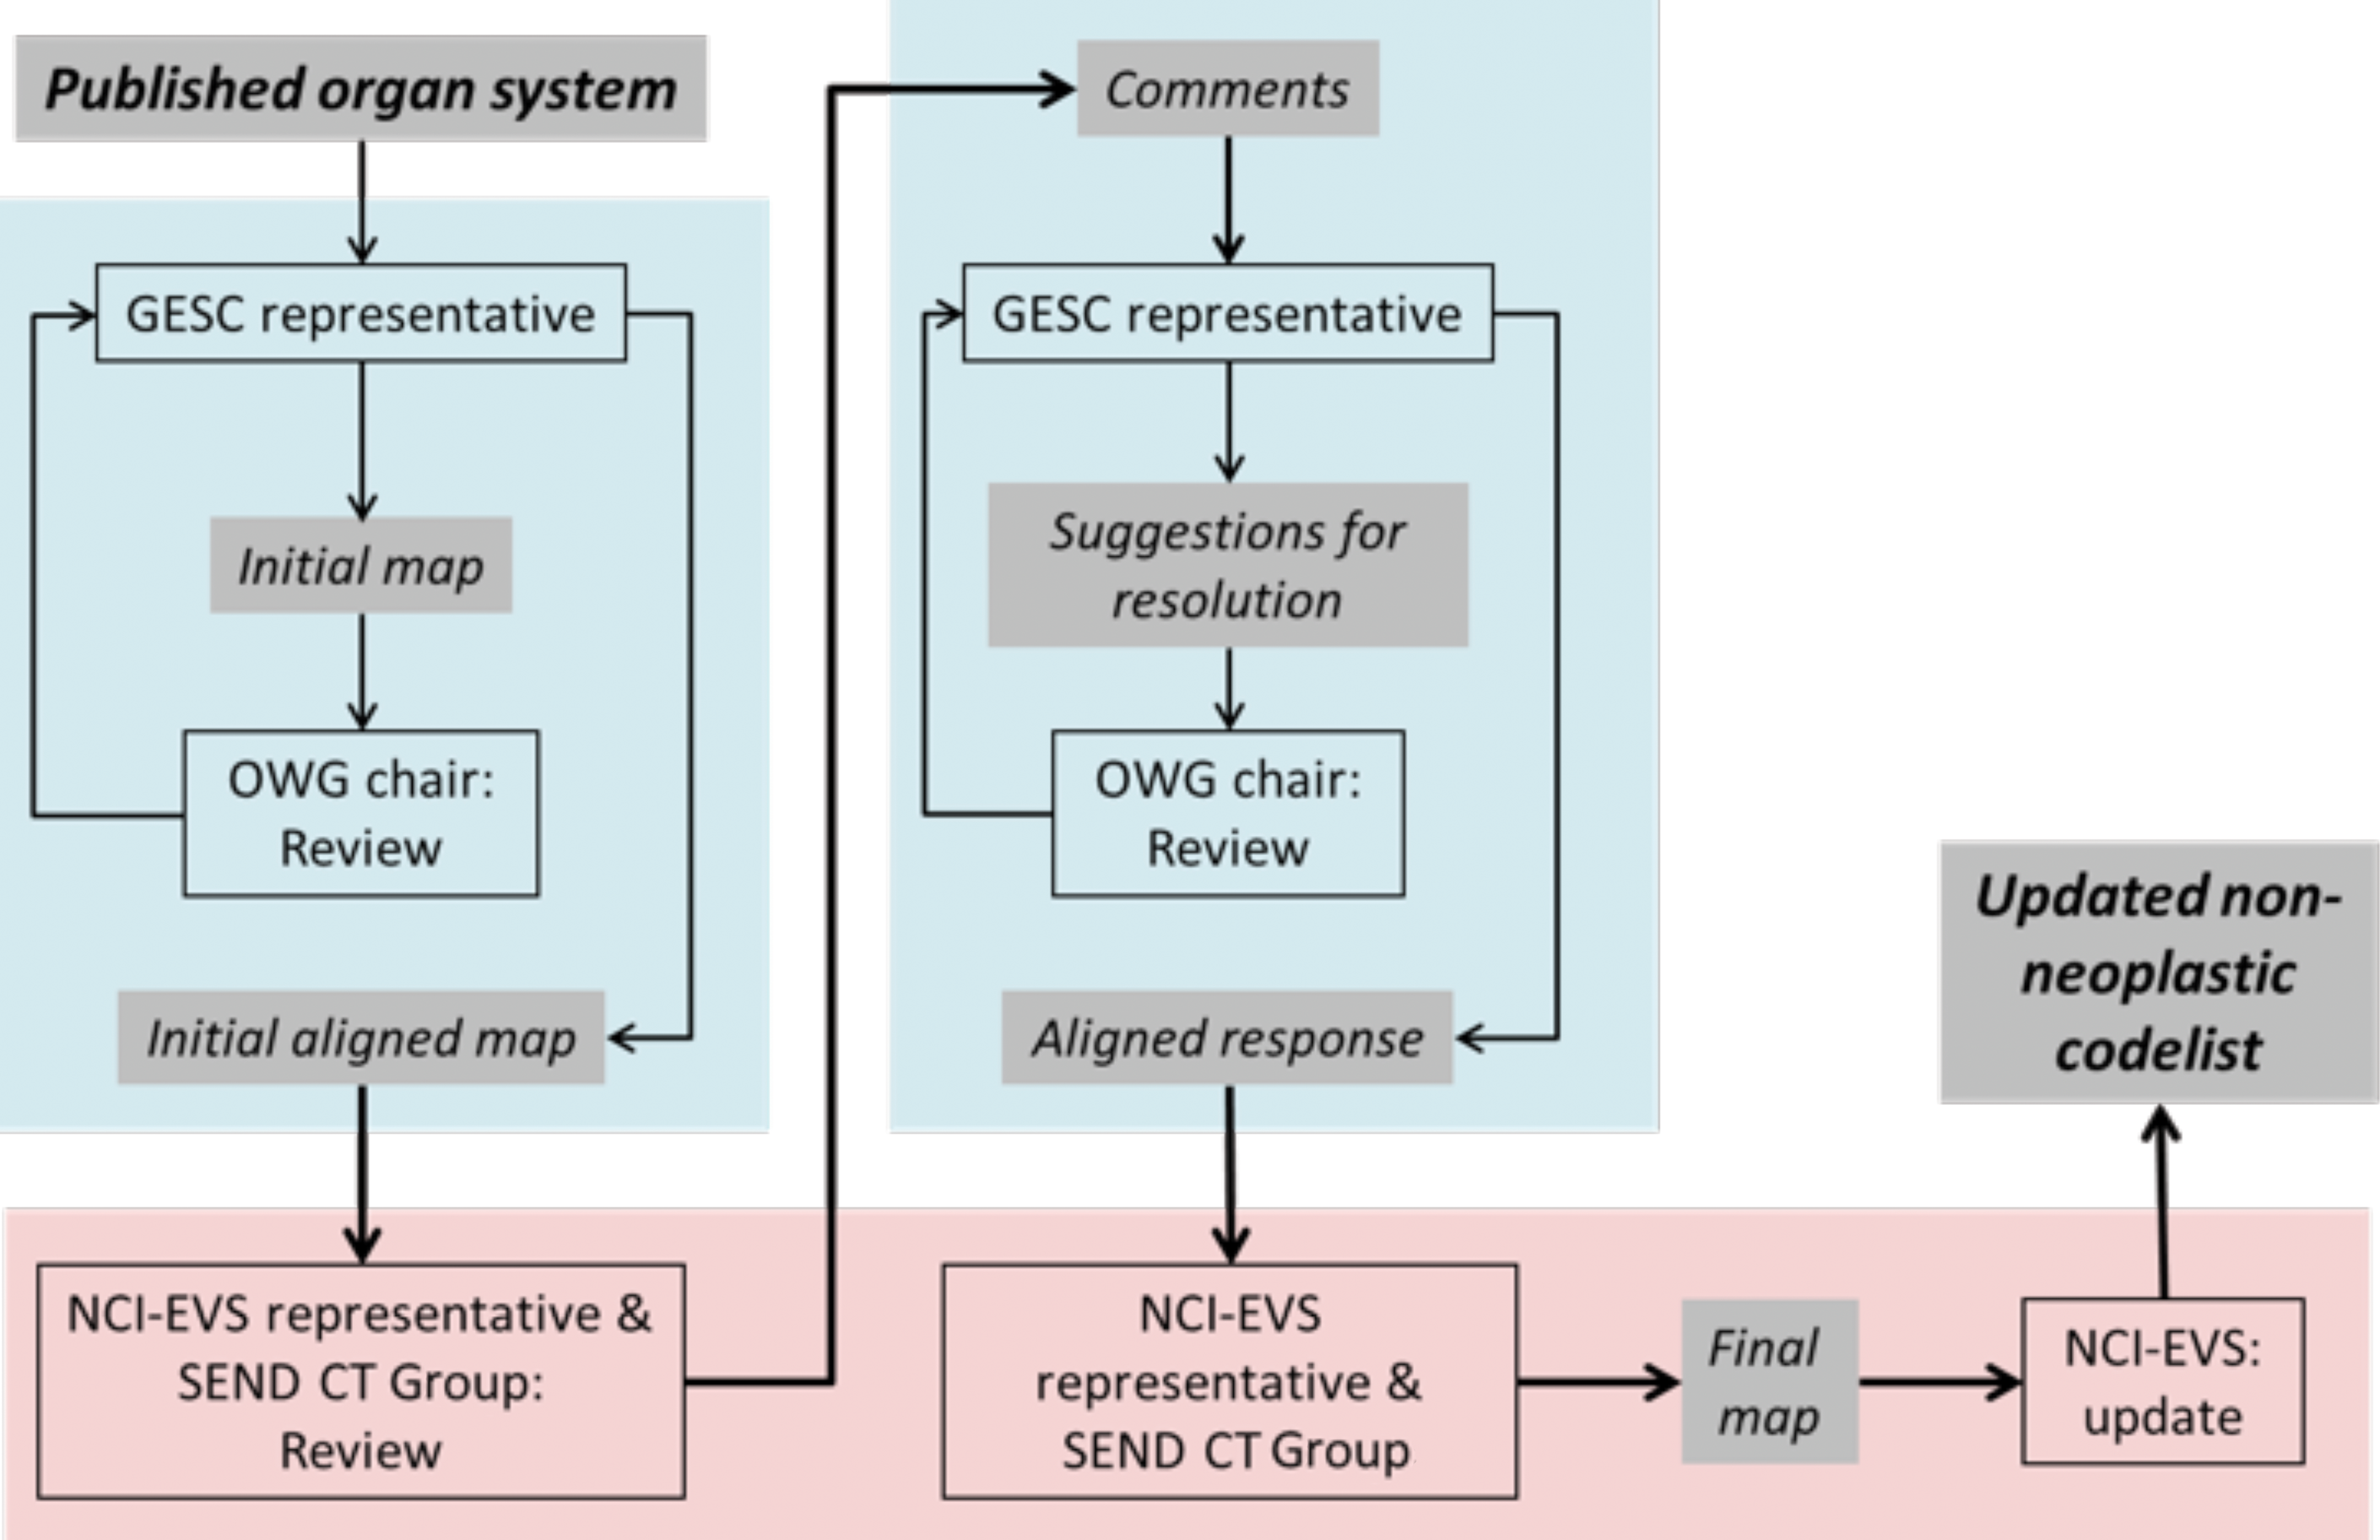
Overview of the process of sending International Harmonization of Nomenclature and Diagnostic Criteria nomenclature as published organ systems through the Global Editorial and Steering Committee, National Cancer Institute-Enterprise Vocabulary Service representative, and Standard for the Exchange of Nonclinical Data controlled terminology group to produce a final map and updated nonneoplastic codelist.
Mapping INHAND Terms to SEND codelists
There are 5 possibilities for how INHAND terms can be mapped to SEND codelists: The SEND codelist of nonneoplastic findings already contains the INHAND term (e.g., fibrosis): the INHAND term is mapped to the SEND term. The SEND codelist of nonneoplastic findings contains a synonym of the INHAND finding (e.g., INHAND: amyloidosis; SEND amyloid): the INHAND term is mapped to its synonym in SEND. There is no equivalent for the INHAND term in the SEND list of nonneoplastic findings: the INHAND term is added to the SEND list of nonneoplastic findings. A composite INHAND term matches a SEND nonneoplastic finding combined with modifier(s): the INHAND term is divided into the SEND nonneoplastic finding and modifier(s) (e.g., INHAND term “necrosis, zonal” into necrosis for population of base process (the data field for a nonneoplastic finding) and zonal for distribution. Breaking up a composite INHAND term is not considered appropriate. This is the case when it is important to use the exact term representing a spectrum of tissue changes (e.g., chronic progressive nephropathy in rodents) and is defined by the OWG: in this case, the composite INHAND term is added to the SEND list of nonneoplastic findings.
As of today, the SEND list of nonneoplastic findings contains more than 100 terms from 9 INHAND organ systems. These include respiratory, hepatobiliary, urinary, mammary gland and other glands, CNS/PNS, male reproductive, female reproductive, soft tissue, and integument. Also, the SEND lists for distribution and chronicity have been reviewed by INHAND and agreed upon. The SEND terminology can be downloaded via the link http://www.evs.nci.nih.gov/ftp1/CDISC/SEND, accessed August 1, 2016.
The review of terms from the digestive system is ongoing. Furthermore, change control has been initiated within INHAND to harmonize general terms across organs systems. This is required, as the harmonization efforts in INHAND were—and still are—an ongoing process. As an example, “thrombosis” was used in the early INHAND publications, the preferred term “thrombus” in the later ones.
Adding a New Term to a SEND Codelist
Sponsors and contract research organizations will use the SEND codelists of microscopic findings and modifiers to automatically map their original microscopic findings to the SEND compliant terms. This will be done by vendor-supplied SEND-compliant modules or sponsor-developed proprietary software. However, novel findings may emerge that do not match to any of the SEND nonneoplastic or neoplastic findings or combinations of a microscopic finding with one or more modifiers. In these cases, the sponsor has 2 options: To include the term in submissions as it is, it will be added to the list of nonneoplastic (or neoplastic) findings. This is possible, as these lists are extensible. This procedure requires a description of the finding in the respective codelist. The sponsor suggests to add the new term to the SEND codelist or to modify an existing term by using SEND or INHAND change control procedures.
The first option is an immediate work-around but may generate questions from regulatory agencies after submission. The second option will guarantee regulatory acceptance but is not an immediate solution, as it will take weeks to months.
There are 2 ways to request a new term: Via NCI-EVS:
The sponsor submits a request to the NCI-EVS to add a new term. This can be done online via the NCI home page (https://ncitermform.nci.nih.gov/ncitermform/?version=cdisc, accessed August 1, 2016). The term will be reviewed by SEND-controlled terminology team and INHAND representatives to SEND.
2. Via INHAND:
The sponsor submits a request to INHAND. The request will be reviewed by the OWG chair who may involve members of the OWG. The experts may approve the request, which is then discussed by the INHAND representative and the SEND-controlled terminology team.
INHAND provides forms for different kinds of changes, which can be downloaded via the goRENI, STP, or ESTP websites (http://www.goreni.org/, http://www.toxpath.org/, http://www.eurotoxpath.org/, all accessed August 1, 2016):
– New term request form,
– Change of or addition to criteria of published term request form,
– Change of published term request form,
– Additional synonym for published term request form,
– Addition of new photograph request form,
– Additional organ topography for published term request form, and
– Deletion of term request form.
The Future
The GESC continues mapping published rodent terminology to the SEND codelists. INHAND started addressing the nomenclature of other species on a species-by-species basis rather than an organ system basis: working groups have been established for the dog, monkey, minipig, and rabbit and are working to prepare terminology lists and descriptions of species-specific findings. The GESC as the whole committee will become a permanent standing committee of the various STPs. It will serve as an advisory group to the FDA and the SEND-Controlled Terminology Committee to review requests for additional terms or modification of terms.
The lively discussion focused on the role of synonyms in the process of mapping. In organ systems published by INHAND so far, terms previously used instead of the recommended terms, have been listed under “synonyms.” However, strictly speaking, a synonym could be used instead of the recommended term, which in many cases was not the intention of the OWG. It was suggested to differentiate between “previously used” terms and true synonyms. The GESC is going to address this within the already initiated change control processes.
Drs. Dawn Goodman and Charlotte Keenan are the INHAND representatives of the SEND-controlled terminology team. Current members of the GESC are Drs. Charlotte Keenan (Chair, STP), Julia Baker (BSTP), Alys E. Bradley (BSTP), Dawn G. Goodman (STP), Takinori Harada (JSTP), Shim-mo Hayashi (JSTP), Ronald Herbert (STP), Wolfgang Kaufmann (ESTP), Rupert Kellner (ESTP), Emily Meseck (STP), Thomas Nolte (ESTP), Susanne Rittinghausen (ESTP), Katsuhiko Yoshizawa (JSTP), and John Vahle (STP).
Footnotes
Acknowledgments
The authors wish to thank Eli Ney of the NIEHS for her unique and creative cover artwork for the symposium handouts. The authors would also like to thank Beth Mahler of EPL for her assistance with manuscript image preparation and for assistance during the symposium. The authors would also like to acknowledge the NIEHS Histology and Immunohistochemistry (IHC) Core Laboratories for contributions to some of the presentations and to Drs. Cynthia Willson and Greg Krane of the NIEHS for their critical review of this article. Appreciation also goes to Maureen Kettering, Kim Brock, Tierre Miller and Matthew Price of Association Innovation and Management, Inc., for their valuable help with annual advertising and meeting facilities. Also integral to the success of this meeting was the audiovisual technical expertise provided by CMI Communications. Refreshments were graciously provided by Experimental Pathology Laboratories, Inc., and Charles River Laboratories, Inc.
Authors’ Contribution
Authors contributed to conception or design (SE, VC, JH, KJ, LK, TN, KS, GW JW, DM); data acquisition, analysis, or interpretation (SE, VC, SHB, JH, KJ, LK, TN, KS, GW JW, DM); all authors drafted the manuscript; critically revised the manuscript; gave final approval; and agreed to be accountable for all aspects of work in ensuring that questions relating to the accuracy or integrity of any part of the work are appropriately investigated and resolved.
Declaration of Conflicting Interests
The author(s) declared no potential conflicts of interest with respect to the research, authorship, and/or publication of this article.
Funding
The author(s) disclosed receipt of the following financial support for the research, authorship, and/or publication of this article: This research was supported (in part) by the Intramural Research Program of the National Institutes of Health (NIH), National Institute of Environmental Health Sciences (NIEHS).