
Abstract
The potential of chemicals to alter susceptibility to mammary tumor formation is often assessed using a carcinogen-induced study design in various rat strains. The rate of mammary gland (MG) development must be considered so that the timing of carcinogen administration is impactful. In this study, in situ MG development was assessed in females of the Harlan Sprague-Dawley (Hsd:SD), Charles River Sprague-Dawley (Crl:SD), and Charles River Long-Evans (Crl:LE) rat strains at postnatal days 25, 33, and 45. Development was evaluated by physical assessment of growth parameters, developmental scoring, and quantitative morphometric analysis. Although body weight (BW) was consistently lower and day of vaginal opening (VO) occurred latest in female Hsd:SD rats, they exhibited accelerated pre- and peripubertal MG development compared to other strains. Glands of Crl:SD and Crl:LE rats exhibited significantly more terminal end buds (TEBs) and TEB/mm than Hsd:SD rats around the time of VO. These data suggest a considerable difference in the rate of MG development across commonly used strains, which is independent of BW and timing of VO. In mammary tumor induction studies employing these strains, administration of the carcinogen should be timed appropriately, based on strain, to specifically target the peak of TEB occurrence.
The mammary gland (MG) is the defining characteristic of mammalians, and breast or MG development is a crucial part of pubertal progression in all mammals. Aside from skin cancers, breast cancer is the most common cancer among American women, and the American Cancer Society (2016) estimates about 246,660 cases of invasive breast cancer will be diagnosed in U.S. women in 2016. The World Health Organization estimates that, excluding nonmelanoma skin cancers, breast cancer was the most common cancer in women and was second only to lung cancer worldwide (GLOBOCAN 2012). While roughly 30% of breast cancer cases can be linked to established risk factors, including genetics, the remaining 70% are associated with exogenous components such as environmental chemical exposures (Davis et al. 1993; Fenton 2006; Moller et al. 2016).
An important premise with respect to both laboratory studies in rodents and observational studies of human populations is that there are periods of mammary development, known as “windows of susceptibility” (WOS), during which the gland is particularly sensitive to environmental exposures that could influence mammary development and cancer risk in women (Barcellos-Hoff 2013; Birnbaum and Fenton 2003; Cohn et al. 2015; Forman et al. 2015; Monks and Henson 2009). These WOS can be characterized by 3 stages of growth during which the MG undergoes significant developmental changes: prenatal (formation), pubertal (proliferation), and adult (lactation; Gjorevski and Nelson 2011; Watson and Khaled 2008). In the rat, the rudimentary structure of the MG forms prenatally between gestation days 15–19 as the primary duct extends from the epithelial bud and begins to branch into the fat pad. Development of the gland is essentially dormant from parturition until puberty, as the epithelium continues to grow isometrically. Ductal elongation is initiated at puberty and is comprised of proliferating terminal end buds (TEBs) followed by extensive branching and active differentiation of the TEBs into alveolar buds, lobules, and terminal ducts. Largely under control of ovarian hormones and growth factors signaled by these hormones, the progression of female MG development is accentuated with each reproductive cycle until the epithelial tree has extended to the limits of the fat pad. During pregnancy, lobuloalveolar units mature to form functional glands which continue to produce and secrete milk components until the end of lactation, when involution and postlactational remodeling of the gland occurs. Although few studies have examined the effects of life course exposures or exposure during lactation, the effects on MG development following exposure during the gestational and peripubertal stages have been well researched and demonstrate the importance of the timing of these exposures for impaired function or disease risk across the life span (Forman et al. 2015; Saad et al. 2011).
Although mammary morphogenesis is regulated by a vast array of signaling networks, it is primarily under the control of ovarian hormones (Gjorevski and Nelson 2011; Russo and Russo 1996; Shyamala 1997). Studies utilizing ovariectomized and estrogen receptor (ER)- and progesterone receptor (PR)-deficient mice have demonstrated that estrogen and progesterone are required for normal ductal morphogenesis and lobuloalveolar formation (Bocchinfuso and Korach 1997; Cheng et al. 2004; Shyamala 1997), and the impaired mammary development observed in mice with these transcript deficiencies can be rescued by the administration of exogenous estrogen or progesterone (Bocchinfuso et al. 2000; Hennighausen and Robinson 1998). Because steroid hormones play such a critical role in MG development, it is reasonable to presume that exposure to hormonally active chemicals, known as endocrine-disrupting compounds (EDCs), can impact mammary development. EDCs can interfere with endogenous receptor signaling either directly by competing for or interfering with endogenous receptor binding, indirectly through transcription factor perturbation (aryl hydrocarbon receptor), or by altering enzymes involved in steroid biosynthesis (Shanle and Xu 2011). EDC-induced effects on normal MG development can subsequently alter the susceptibility of the gland to carcinogenesis and potentially increase the risk of mammary cancer over a lifetime (Osborne, Rudel, and Schwarzman 2015). For example, a single prenatal oral exposure to 2,3,7,8-tetrachlorodibenzo-p-dioxin resulted in stunted mammary growth in rats (Fenton et al. 2002; Lewis et al. 2001) and early life exposure has been shown to alter breast developmental timing in populations of girls (Markey et al. 2003) and also increase risk for breast cancer later in life (Warner et al. 2011). Exposure to a number of other EDCs has been shown to adversely affect MG development. An increased risk of breast cancer following prenatal/perinatal exposure to dichlorodiphenyltrichloroethane or its metabolites has been indicated in both humans and rodents (Fenton and Birnbaum 2015; Cohn et al. 2015; Cohn et al. 2007), with age at exposure and growth factor receptor status shown to be critical factors for disease risk. Delayed MG development has been observed in mice exposed to perfluorooctanoic acid in utero (Macon et al. 2011; White et al. 2009). Interestingly, a recent study by Pinney et al. (2014) reported an association between duration of breastfeeding and elevated serum levels of perfluorinated compounds (PFCs) in a cohort of girls from the Greater Cincinnati and San Francisco Bay Areas. A related study revealed an association between breast-feeding (vs. formula-fed) and delayed MG development in the same cohort (Kale et al. 2015). While neither study suggested causality, these data present another potential example of the impact of EDC exposure on mammary development and warrant further examination as to the relationship between PFC exposure and adverse effects on breast development in humans.
Due to the heightened concern regarding the impact of environmental factors on breast cancer risk and early breast development during puberty, the use of the MG as an evaluated endpoint in rodent toxicity testing has recently increased (Fenton 2009; National Toxicology Program [NTP] 2011; Organisation for Economic Co-operation and Development [OECD] 2012). The rat has long been used as a model for examining the initiation and progression of mammary carcinogenesis due to the etiological and developmental similarities to human breast cancer (Christakos, Sinha, and Dao 1976; Daniel and Prichard 1964; Gould 1995; Howell 1961; Russo and Russo 1996; Russo et al. 1983; Thompson and Singh 2000). The potential of chemicals to alter susceptibility to mammary cancer can be assessed using a “two-hit” induced breast cancer model, and a common method for inducing mammary tumors in the rat is the administration of a single dose of the polycyclic aromatic hydrocarbon 7,12-dimethylbenz[α]anthracene (DMBA). The target site for the induction of mammary adenocarcinomas is the actively proliferating epithelium of undifferentiated TEBs, and the highest incidence of carcinomas occurs when DMBA is administered at the time when the maximum number of TEBs are present (Russo and Russo 1978). If the carcinogen is administered when more differentiated structures are present (alveolar buds, alveoli, and terminal ducts), the result is the formation of benign lesions, such as fibromas and fibroadenomas (Russo 2015). Therefore, understanding the normal physiological pace of MG development to properly time the carcinogenic administration (second hit) is critical when assessing whether exposure to an EDC (first hit) can alter the susceptibility to mammary tumorigenesis.
A wide variety of rat strains have been employed in studies based upon their susceptibility or resistance to mammary cancer (Szpirer and Szpirer 2007). One of the most widely used rat strains in mammary carcinogenicity studies is the Sprague-Dawley, an outbred strain that exhibits a high degree of spontaneous tumor formation and is highly susceptible to chemically induced tumorigenesis (Szpirer and Szpirer 2007; Tennekes et al. 2004). The Long-Evans rat is another outbred strain commonly used in studies examining MG development. Females of this strain form spontaneous mammary tumors at roughly the same rate as females of the Sprague-Dawley strain (Sommer 1997) but are about one-third less sensitive to chemical induction of mammary tumors (Daniel and Joyce 1984; Moore, Bachhuber, and Gould 1983). The collective use of these 2 strains in mammary tumorigenicity studies may well provide an effective model for a comparative evaluation of the mechanisms involved in chemically induced carcinogenesis or when assessing the effect of an early-life chemical exposure on mammary tumor susceptibility.
The present work examines the natural development of the MG in 3 strains of rat: the Harlan Sprague-Dawley (Hsd:SD), the Charles River Sprague-Dawley (Crl:SD), and the Charles River Long-Evans (Crl:LE). The Hsd:SD rat is the current rat model for NTP studies and the Crl:SD and Crl:LE are 2 rat strains commonly used in toxicity studies where the MG is an endpoint. Previous studies in our laboratory led to the observation that MG development in these strains may occur at different rates. It is worth noting that 2 other rat strains commonly used in spontaneous and DMBA-induced tumor studies to assess risk following chemical exposures were not evaluated: the Wistar Han (Dhimolea et al. 2014) and the Fisher 344/N, formerly the model of the NTP (Thayer and Foster 2007). Wistar Han females demonstrate asymmetric growth of the fourth gland and the males are often missing the fifth gland (Mandrup et al. 2012), making it difficult to interpret chemical-induced changes in mammary development. The Fisher 344/N rat has a high spontaneous rate of benign mammary tumors supposedly driven by changes in prolactin, making it difficult to determine the effects of chemicals on the breast in this strain (Thayer and Foster 2007).
Although many studies have examined the effects of chemical exposures on MG development, there is no standardized method for evaluating developmental changes. Davis and Fenton (2013) describe various approaches for physical, biochemical, and morphological evaluation of mammary toxicity. Morphological evaluation includes routine assessment of histological sections, qualitative assessments of mammary whole mounts, and quantitative morphometric analysis. Qualitative assessment of mammary whole mounts employs a set of established recommended criteria to assign a developmental score to the gland based on visual observation in a manner similar to severity scoring in pathology studies (Davis and Fenton 2013; Macon et al. 2011; Mandrup et al. 2012; Tucker et al. 2015). Quantitative assessments of mammary whole mounts describe morphometric parameters including the number of primary ducts, lateral and longitudinal growth, epithelial area, branching density, and the number of TEBs (Davis and Fenton 2013; Hovey et al. 2011; Kass et al. 2015; Mandrup et al. 2012; Stanko, Easterling, and Fenton 2015). It is important to bear in mind that while the aforementioned parameters can be utilized collectively to assess MG development, single parameters may not indicate developmental shifts.
The goal of this study was to describe the characteristics of in situ MG development so that data generated from carcinogen-induced studies utilizing these strains can be appropriately interpreted. Qualitative and quantitative morphological evaluation methods were utilized to assess MG development in these strains at pre-, peri-, and postpubertal life stages in this study. Innate differences in the timing of MG development across strains may result in inconsistent outcomes in mammary tumor induction studies that follow a protocol for administering the carcinogen based on age versus stage of development.
Materials and Methods
Animal Housing
Timed-pregnant Crl:LE and Crl:SD rats (n = 12 each, 9–15 weeks old, sperm positive = day 0) were obtained from Charles River Breeding Laboratories (Raleigh, NC), and timed-pregnant Hsd:SD rats (n = 12, 9–15 weeks old, sperm positive = day 0) were obtained from Harlan Laboratories (Indianapolis, IN). Females were housed in clear plastic cages containing heat-treated pine shavings (Beta Chips, North Eastern Products Inc., Warrensburg, NY) and given food (Purina 5008 Rodent Chow, Ralston Purina Co., St. Louis, MO) and water ad libitum. In the Association for Assessment and Accreditation of Laboratory Animal Care–accredited facility, rooms were maintained at 20–24°C and 40 to 50% relative humidity, with a 14:10-hr light/dark cycle (21:00 hr lights out). Female offspring were fed Purina 5001 chow ad libitum after weaning. All animals were treated humanely as approved by the National Health and Environmental Effects Research Laboratory Institutional Animal Care and Use Committee.
Experimental Design and Necropsy
Length of gestation and litter data were recorded at parturition and all but 2 litters were culled to 6 females and 3 males on postnatal day (PND) 4. Two litters of Crl:SD pups were culled to 5 females and 3 males due to litter sex ratios. There were a total of 72 Crl:LE, 70 Crl:SD, and 66 Hsd:SD female pups. All pups were weaned on PND21. At weaning, females were housed 3/cage (2/cage in 2 Crl:SD cases) and 4 to 6 males of each strain were housed individually on the same rack in order to provide pheromonal cues required for normal estrous cycling in the females. Necropsy of 1 to 2 females/dam/strain was conducted on PND25 (n = 24 Crl:LE, 22 Crl:SD, and 22 Hsd:SD), PND33 (n = 24 Crl:LE, 24 Crl:SD, and 22 Hsd:SD), and PND45 (n = 13 Crl:LE, 14 Crl:SD, and 14 Hsd:SD). Only animals in the estrus stage of the estrous cycle were selected for necropsy on PND45. Those animals not in estrus at PND45 were allowed to age for assessment of estrous cyclicity (n = 10, 11, and 8 for Crl:LE, Crl:SD, and Hsd:SD, respectively). Stage of estrous could not be assessed prior to necropsy at PND25 or PND33 because those animals had not yet achieved vaginal opening (VO). At necropsy, body weight (BW) was recorded, the fourth and fifth inguinal MGs were collected for whole mount, and the fourth contralateral MG was collected for ERα and PR immunohistochemistry.
Pubertal Endpoints and Estrous Cyclicity
Puberty was determined by assessing the day of VO in the female offspring. Beginning on PND29, all females were examined for VO determined by the presence of a fully opened vagina. On PND33, all animals were examined for VO prior to necropsy. Those animals that were included in the necropsy but had not achieved VO were not included in the VO data set. Observation was continued until all remaining animals being examined had achieved VO, when day of VO and BW at day of VO were recorded. Stage of estrous cycle was assessed by wet mount analysis of vaginal lavage, which was conducted daily for 21 days (as described by Goldman, Murr, and Cooper 2007) from PND58 to PND78. Vaginal cells were observed by light microscopy and classified as diestrus (D; high concentration of leukocytes), proestrus (P; clusters of round, nucleated epithelial cells), estrus (E; high concentration of keratinized epithelial cells), or metestrus (M; a combination of keratinized and rounded epithelial cells) according to Goldman, Murr, and Cooper (2007). For statistical purposes, normal cycling was defined as ≤2 days in diestrus, ≤1 day in proestrus, ≤1 day in estrus, and ≤1 day in metestrus.
MG Whole Mounts and Physical Growth Parameters
The fourth and fifth inguinal MGs were unilaterally removed as a single piece of tissue, fixed, and stained in Carmine as previously described (Fenton et al. 2002). Whole mounts were examined under a Leica Z16 APO macroscope, and images were captured using a Leica DFC295 digital camera and Leica Application Suite version 3.1 imaging software. MG physical parameters were measured using ImageJ imaging software (v1.49n, National Institute of Health, USA). A ductal end was determined to be a TEB if the diameter measured greater than or equal to 100 µm (Brown et al. 1998). The gland perimeter was measured as the shortest distance around the outer edge of the gland from the leftmost TEB to the rightmost TEB. MG area was calculated using a best-fit polygon traced around the epithelial tree beginning at the base of the primary duct. The distance between MG4 and MG5 (4–5 distance) was measured as the shortest distance between the closest distal edges of MG4 and MG5. Occasionally, MGs can become distorted or misshapen during the whole mount process. While this does not affect the capacity for visual assessment of MG development, some physical parameters cannot be measured accurately in those instances. Since only glands where all parameters could be measured were used for obtaining quantitative data, the n varied slightly between quantitative and qualitative endpoints.
MG Developmental Scoring
MG whole mounts were visually assessed within each respective strain at each time point by 2 independent scorers from our laboratory (S.F. and V.C.), and development was scored on a scale of 1–4 (1 = poorly developed and 4 = well developed, half scores as needed) using developmental criteria as defined in Davis and Fenton (2013). These criteria include primary and secondary branching, gland outgrowth, TEB development, and alveolar bud and lobule density. Both MG4 and MG5 were assessed at PND25. At PND33 and PND45, only MG4 was assessed, as MG5 was not entirely present in all samples following removal of the gland. The slides were reviewed by the scorers and those that differed by a score of >1 were reevaluated by both scorers, taking into consideration all other slides within that score. These scores were then averaged to obtain the final developmental score. For intrastrain scoring, the most developed gland was assigned a value of 4, the least developed gland was assigned a value of 1, and all other glands within that strain were scored according to that range of development. Consequently, this range of score was not equivalent developmentally across strains due to inherent differences in MG development. Therefore, it was necessary to standardize the developmental scores across strains (interstrain scores). This was done by comparing glands with a mean score greater than 3.3 within each strain (selected to provide an n ≥ 3 for each strain) against each other. The intrastrain scores for each respective strain were then adjusted by the difference between the mean score of the >3.3 glands for that strain and the mean score of those same glands were compared interstrain.
Sholl Analysis
Quantitative morphometric analysis was conducted using the Sholl analysis method as previously described (Ferreira et al. 2014; Stanko, Easterling, and Fenton 2015). This method provides a measure of MG branching density. Briefly, whole mount images were thresholded and skeletonized using Image J. Branching intersections in the skeletonized image were measured using the Sholl analysis plugin (v3.4.3, available at http://fiji.sc/Sholl_Analysis#). The Sholl parameter settings for the definition of shells were 0.0 mm as the starting radius and 0.1 mm for the radius step size. The ending radius was defined as the distance from the point of attachment of the MG to the most distal intersection in the glandular epithelium as determined by the Sholl analysis. The default settings were used for all other Sholl parameters. The sample data metrics used in this study include total number of intersections (N), mammary epithelial area (MEA), intersections/mammary epithelial area (N/MEA), and the Sholl regression coefficient (k). Total intersections and Sholl regression coefficient were determined using the Sholl analysis. The Sholl regression coefficient (k) is a measure of the rate of decay of mammary branching density and describes the distal “fullness” of epithelial branching. Lower values of k denote a lower rate of decay and, thus, more uniform distal branching. MEA was measured using ImageJ and was determined by tracing the shortest distance around the glandular epithelium.
Immunohistochemistry
Formalin-fixed paraffin-embedded tissue sections (5 µm) were deparaffinized and rehydrated through graded alcohols. Endogenous peroxidase activity was quenched with 3% H2O2 followed by heat-induced antigen retrieval using a 10-mM citrate buffer solution, pH 6.0 (Biocare Medical, Concord, CA) in a Decloaker® pressure chamber for 5 min at 120°C. Nonspecific binding was blocked with 10% normal horse serum (Jackson Immunoresearch, West Grove, PA) for 20 min followed by the avidin/biotin blocking kit (Vector Laboratories, Burlingame, CA). Sections were incubated with monoclonal mouse anti-ERα or anti-PR (Beckman Coulter Inc., Fullerton, CA) at a 1:50 dilution for 60 min at room temperature. Sections were then incubated with biotinylated horse antimouse IgG (Vector Laboratories, Burlingame, CA) at a 1:500 dilution for 30 min at room temperature for ERα or at a 1:1,000 dilution for 60 min at room temperature for PR. The antigen-ERα antibody complex was detected using horseradish peroxidase-conjugated streptavidin Super Sensitive label (Biogenex Laboratories, San Ramon, CA) and 3,3-diaminobenzidine (Dake, Carpinteria, CA) and the antigen-PR antibody complex was detected using R.T.U. Vectastain Elite ABC reagent (Vector Laboratories, Burlingame, CA) and 3,3-diaminobenzidine (Dake, Carpinteria, CA). Slides were then counterstained with hematoxylin, dehydrated through graded ethanol, cleared in xylene, and coverslipped. Antibodies were validated for positive binding using a section of rat uterus and ovaries and for background binding (negative control) by incubating the same tissue with mouse IgG1 isotype control serum and secondary antibody prior to detection reagents.
Steroid Hormone Receptor Quickscore Analysis
Immunohistochemical evaluation of ERα- and PR-labeled epithelial cells was determined using light microscopy (20× objective). All epithelial cells per mammary section were evaluated. A semiquantitative assessment of the immunolabeling was done using a modified quickscore grading method (Detre, Saclani Jotti, and Dowsett 1995) as previously described in uterine myometrial cells (Dixon, He, and Haseman 2000). Briefly, an individual quickscore was obtained for each animal by assigning a value to the intensity of the nuclear antibody label (0 = no staining, 1 = weak staining, 2 = intermediate staining, and 3 = strong staining) and to the percentage of epithelial cell nuclei labeling positive for the particular hormone receptor (1 = 0–4%, 2 = 5–19%, 3 = 20–39%, 4 = 40–59%, 5 = 60–79%, and 6 = 80–100%) and then taking the product of the two. Quickscores for ER-α and PR, respectively, were determined for each animal by a board-certified veterinary pathologist (D.D.) and 2 other scorers from our laboratory (J.S. and V.C.), and those values were averaged for the overall quickscore. Nonspecific staining of mast cells for ERα and PR antibody was occasionally present, as well as in both positive and negative control slides, and this staining was not included in the quickscore assessment.
Statistical Analysis
All data are reported as mean ± standard error (SEM) unless otherwise indicated and 2-sided p < .05 was used to indicate statistically significant differences. Data were analyzed for strain-related effects by analysis of variance (ANOVA) using the general linear model or mixed model with Tukey post hoc test in SAS Enterprise Guide 4.3 (SAS Institute, Inc., Cary, NC). Dam was utilized as a random effects variable and BW was utilized as a covariate where appropriate. Incident outcomes were examined by χ2 analysis. MG developmental scores were analyzed by nonparametric one-way ANOVA using the Kruskal–Wallis test on Wilcoxon rank sums for both intrastrain and interstrain scores. Analysis of estrous cycle data was conducted using an approach based on the Markov transition matrix analysis, modified from Girard and Sager (1987), to compare strains regarding departures from “normal” cycling. For ERα and PR comparisons of epithelial cell expression, the Mann–Whitney U test with a 2-sided p value was used to compare the mean interstrain quickscores.
Results
BW
The BW of female Hsd:SD rats was consistently lower than female Charles River Laboratory (CRL) rats across all ages (Figure 1). At PND25, the mean BW of Crl:SD females was significantly greater than both Crl:LE females (7.5%, p < .01) and Hsd:SD females (13%, p < .0001). There were no differences in mean BW between Crl:LE and Crl:SD females at either PND33 or PND45. The mean BW of both Crl:LE females and Crl:SD females was significantly greater than that of Hsd:SD females at both PND33 (each approximately 12%, p < .0001) and at PND45 (13%, p < .01; 15%, p < .0001, respectively).
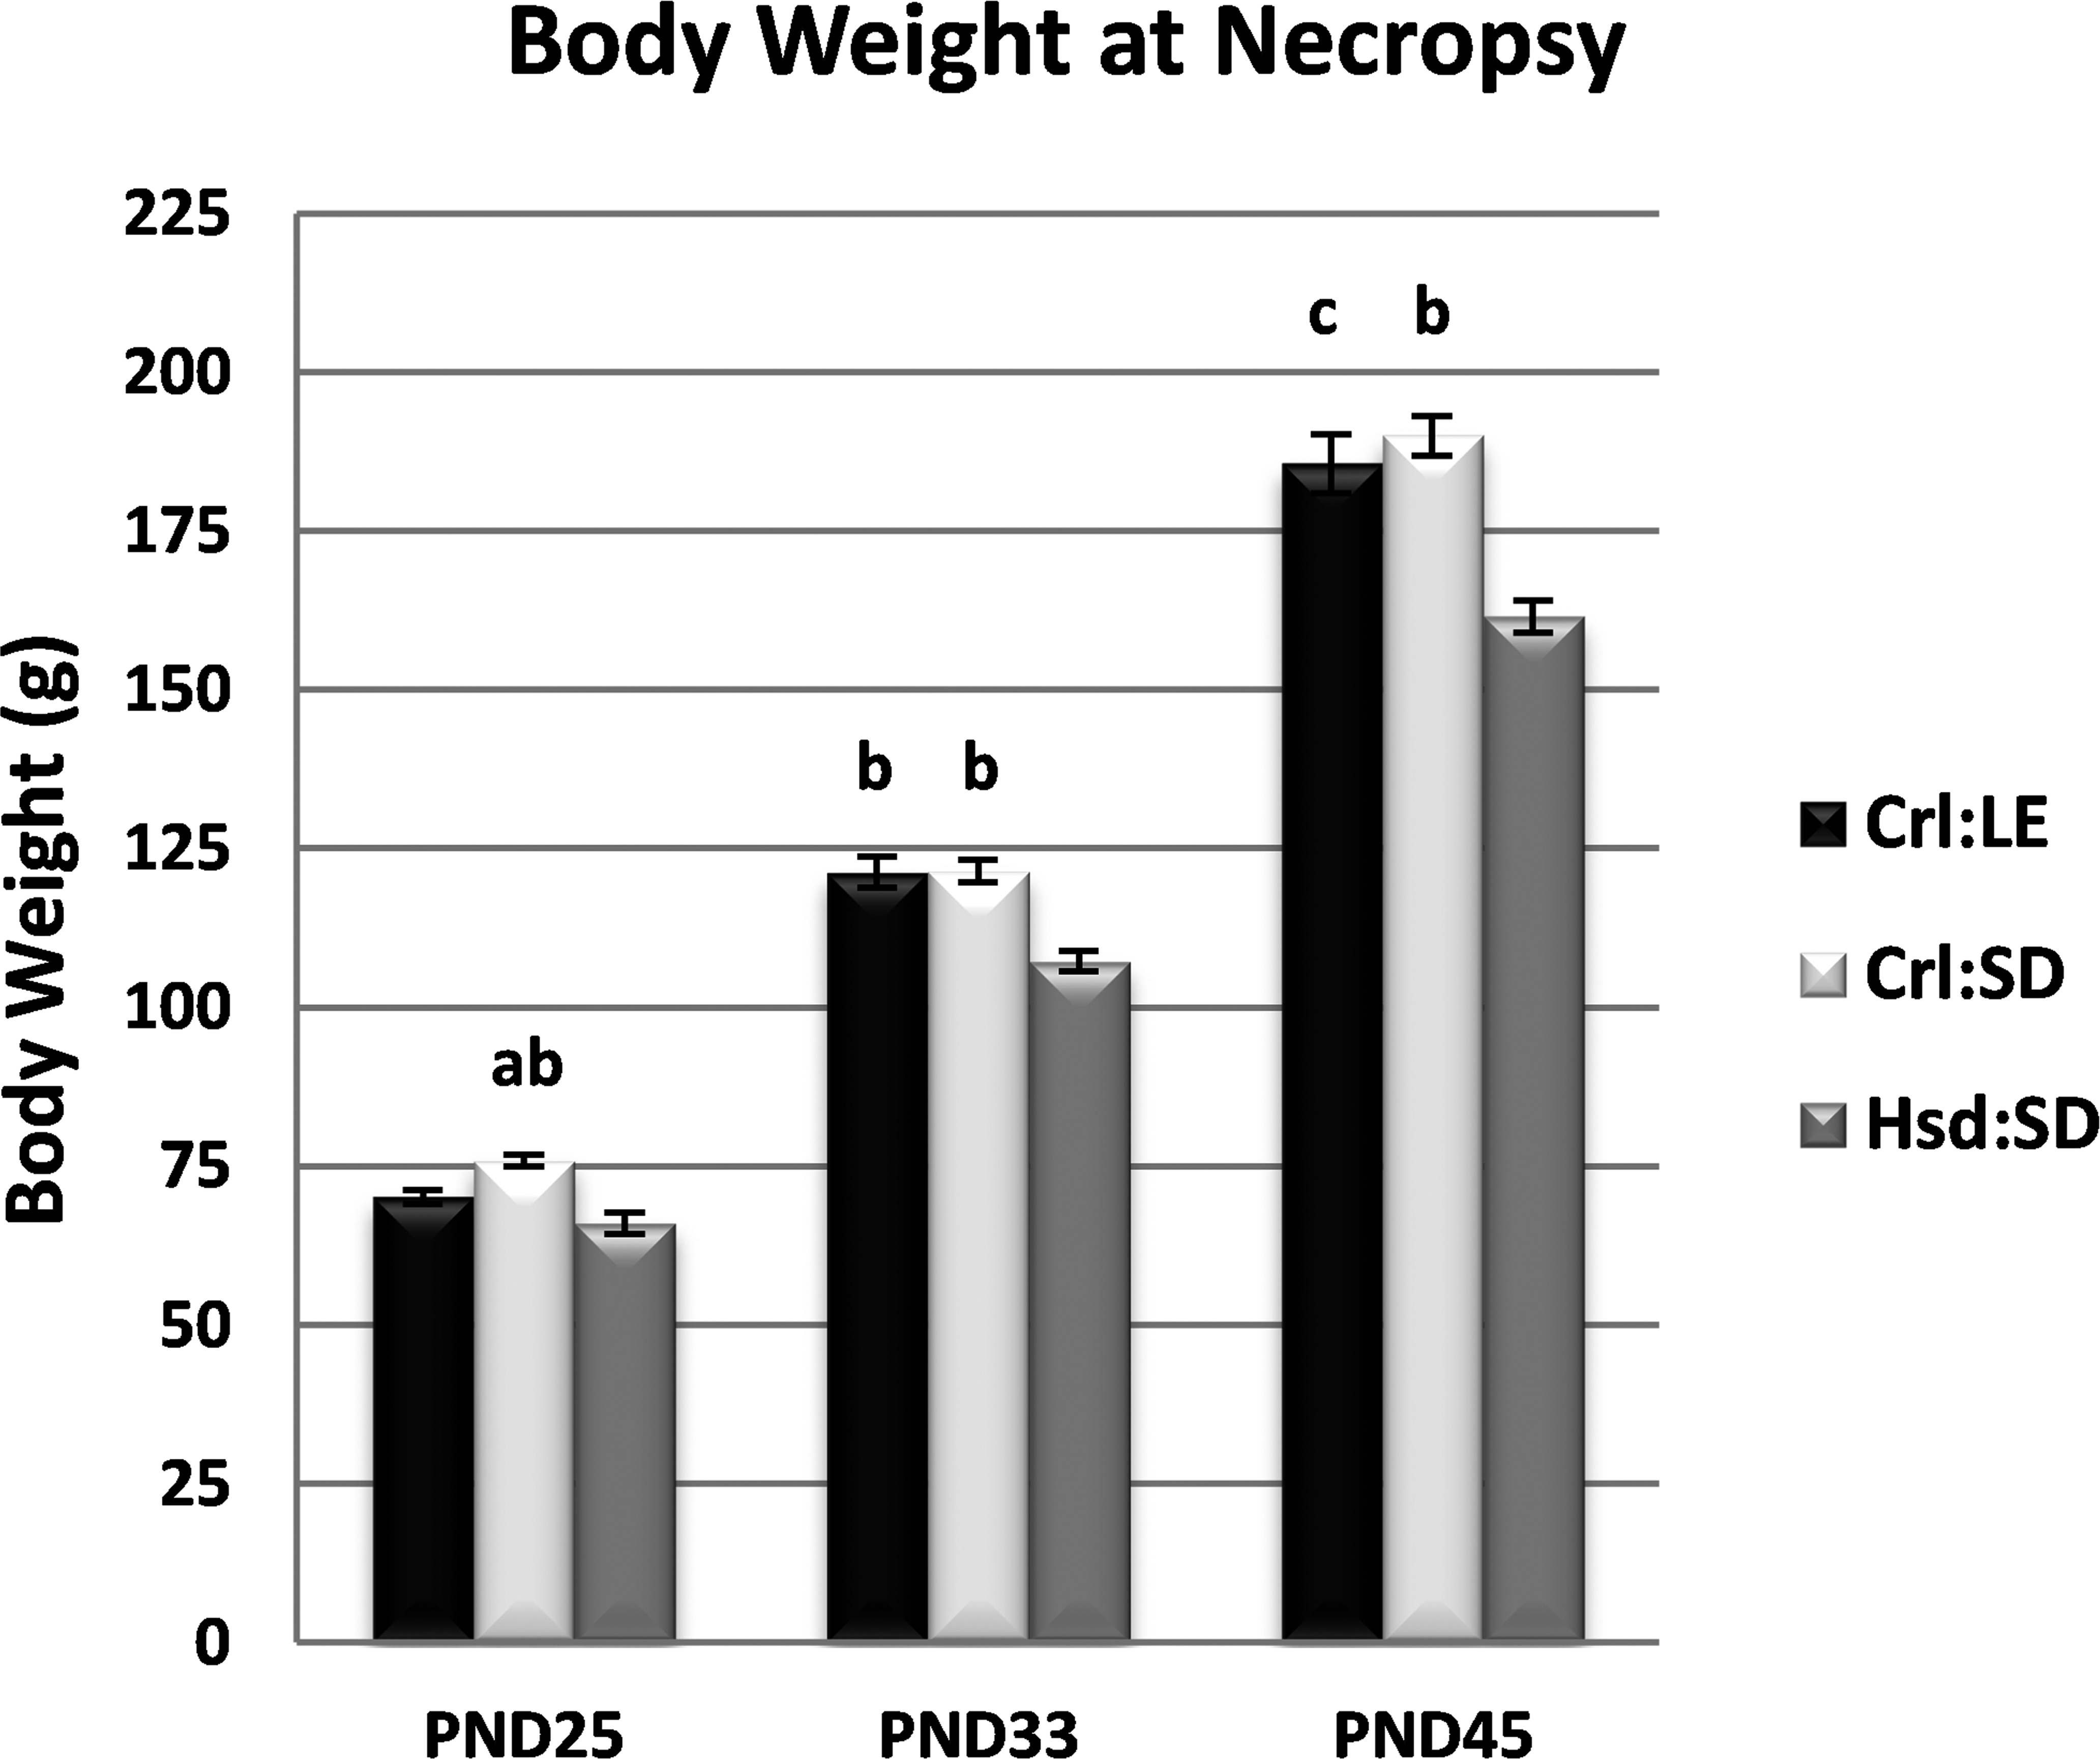
Body weight data. ap < .01 from Charles River Long-Evans (Crl:LE); bp < .0001 from Harlan Sprague-Dawley (Hsd:SD); cp < .01 from Hsd:SD by analysis of variance with Tukey multiple comparison post hoc test. n = 24, 24, 13 (Crl:LE); 22, 24, 14 (Charles River Sprague-Dawley); and 22, 22, 14 (Hsd:SD) by postnatal day, respectively.
VO and BW at VO
VO was assessed as an indicator of puberty. Because there was a significant effect of BW at VO on the day of VO, the least squares means are shown for the day of VO. The mean day of VO occurred approximately 5 days later in Hsd:SD rats (p < .0001) than in Crl:LE and Crl:SD rats (Figure 2). The mean BW at day of VO was significantly greater for Crl:SD rats than for both Crl:LE and Hsd:SD rats (10%, p < .01; 15%, p < .0001, respectively).
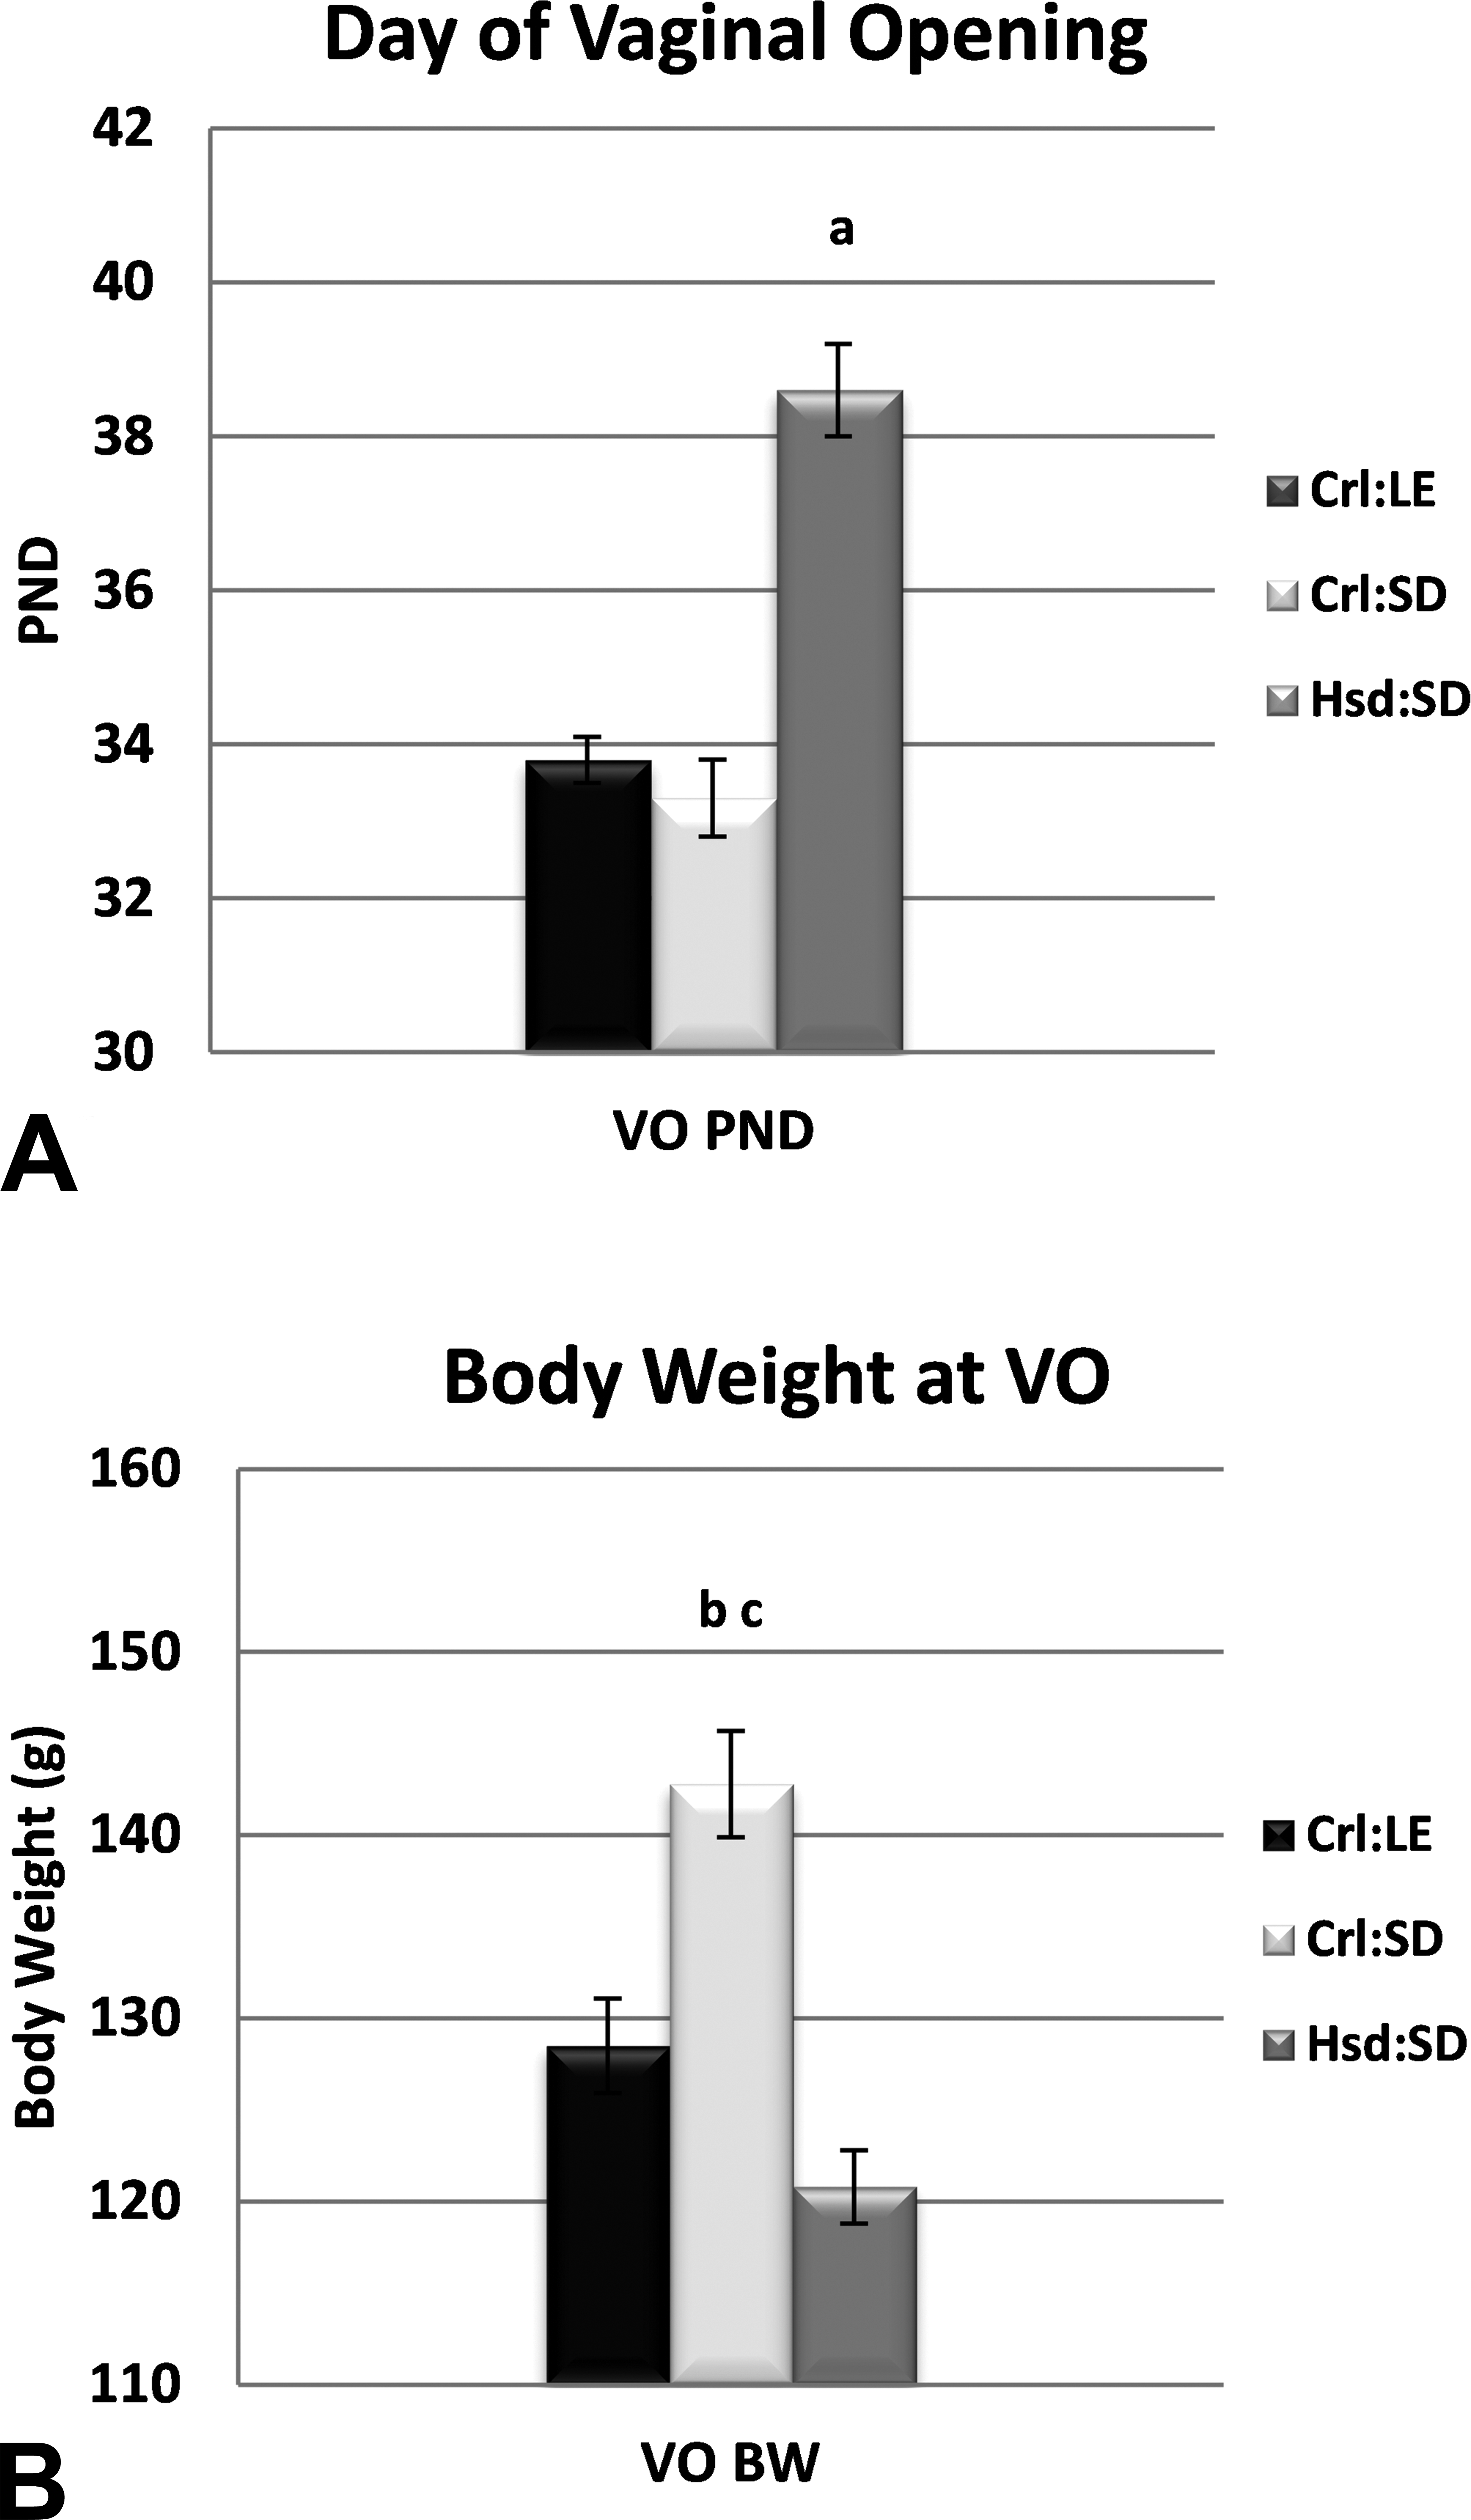
Female vaginal opening (VO) timing. (A) Least squares mean for day of VO and (B) true mean for body weight (BW) on the day of VO. There was a significant effect of BW on the day of VO. ap < .0001 from Charles River Long-Evans (Crl:LE) and Charles River Sprague-Dawley (Crl:SD); bp < .001 from Crl:LE; cp < .0001 from Harlan Sprague-Dawley (Hsd:SD) by analysis of variance with Tukey multiple comparison post hoc test. n = 28, 24, 21 (Crl:LE, Crl:SD, and Hsd:SD).
MG Development PND25
Criteria for describing the extent of MG development include longitudinal and lateral growth, alveolar budding, branching density, and the degree of TEB formation as well as the data provided in Tables 1 and 2. Figure 3 depicts MG whole mounts from each strain at PND25 and PND33 that are representative of mammary development of that strain at the respective time point. At PND25, Crl:LE rats exhibited the least developed glands while Hsd:SD rats exhibited the most developed glands. Significantly, more TEBs were observed in MGs of both Crl:SD and Hsd:SD rats than in MGs of Crl:LE rats (p < .01 and p < .05, respectively; Table 1). The mean perimeter of mammary epithelium from Hsd:SD rats (p < .05) was significantly greater than Crl:LE rats and the difference in the number of TEB/mm was significant between Crl:SD (p < .05) and Crl:LE MGs. As early as 25 days old, inguinal MGs had converged (MG 4–5 convergence) in 33% of Hsd:SD rats (p < .01), while this had not occurred in any of the Crl:LE or Crl:SD rats. Additionally, the mean distance between MG4 and MG5 in those animals where convergence had not occurred was significantly greater in Crl:LE rats (p < .01 and p < .0001, respectively) compared to both Crl:SD and Hsd:SD rats. The mean MG 4–5 distance was also significantly greater in Crl:SD rats (p < .0001) compared to Hsd:SD rats.
Physical Parameters of MG Growth.
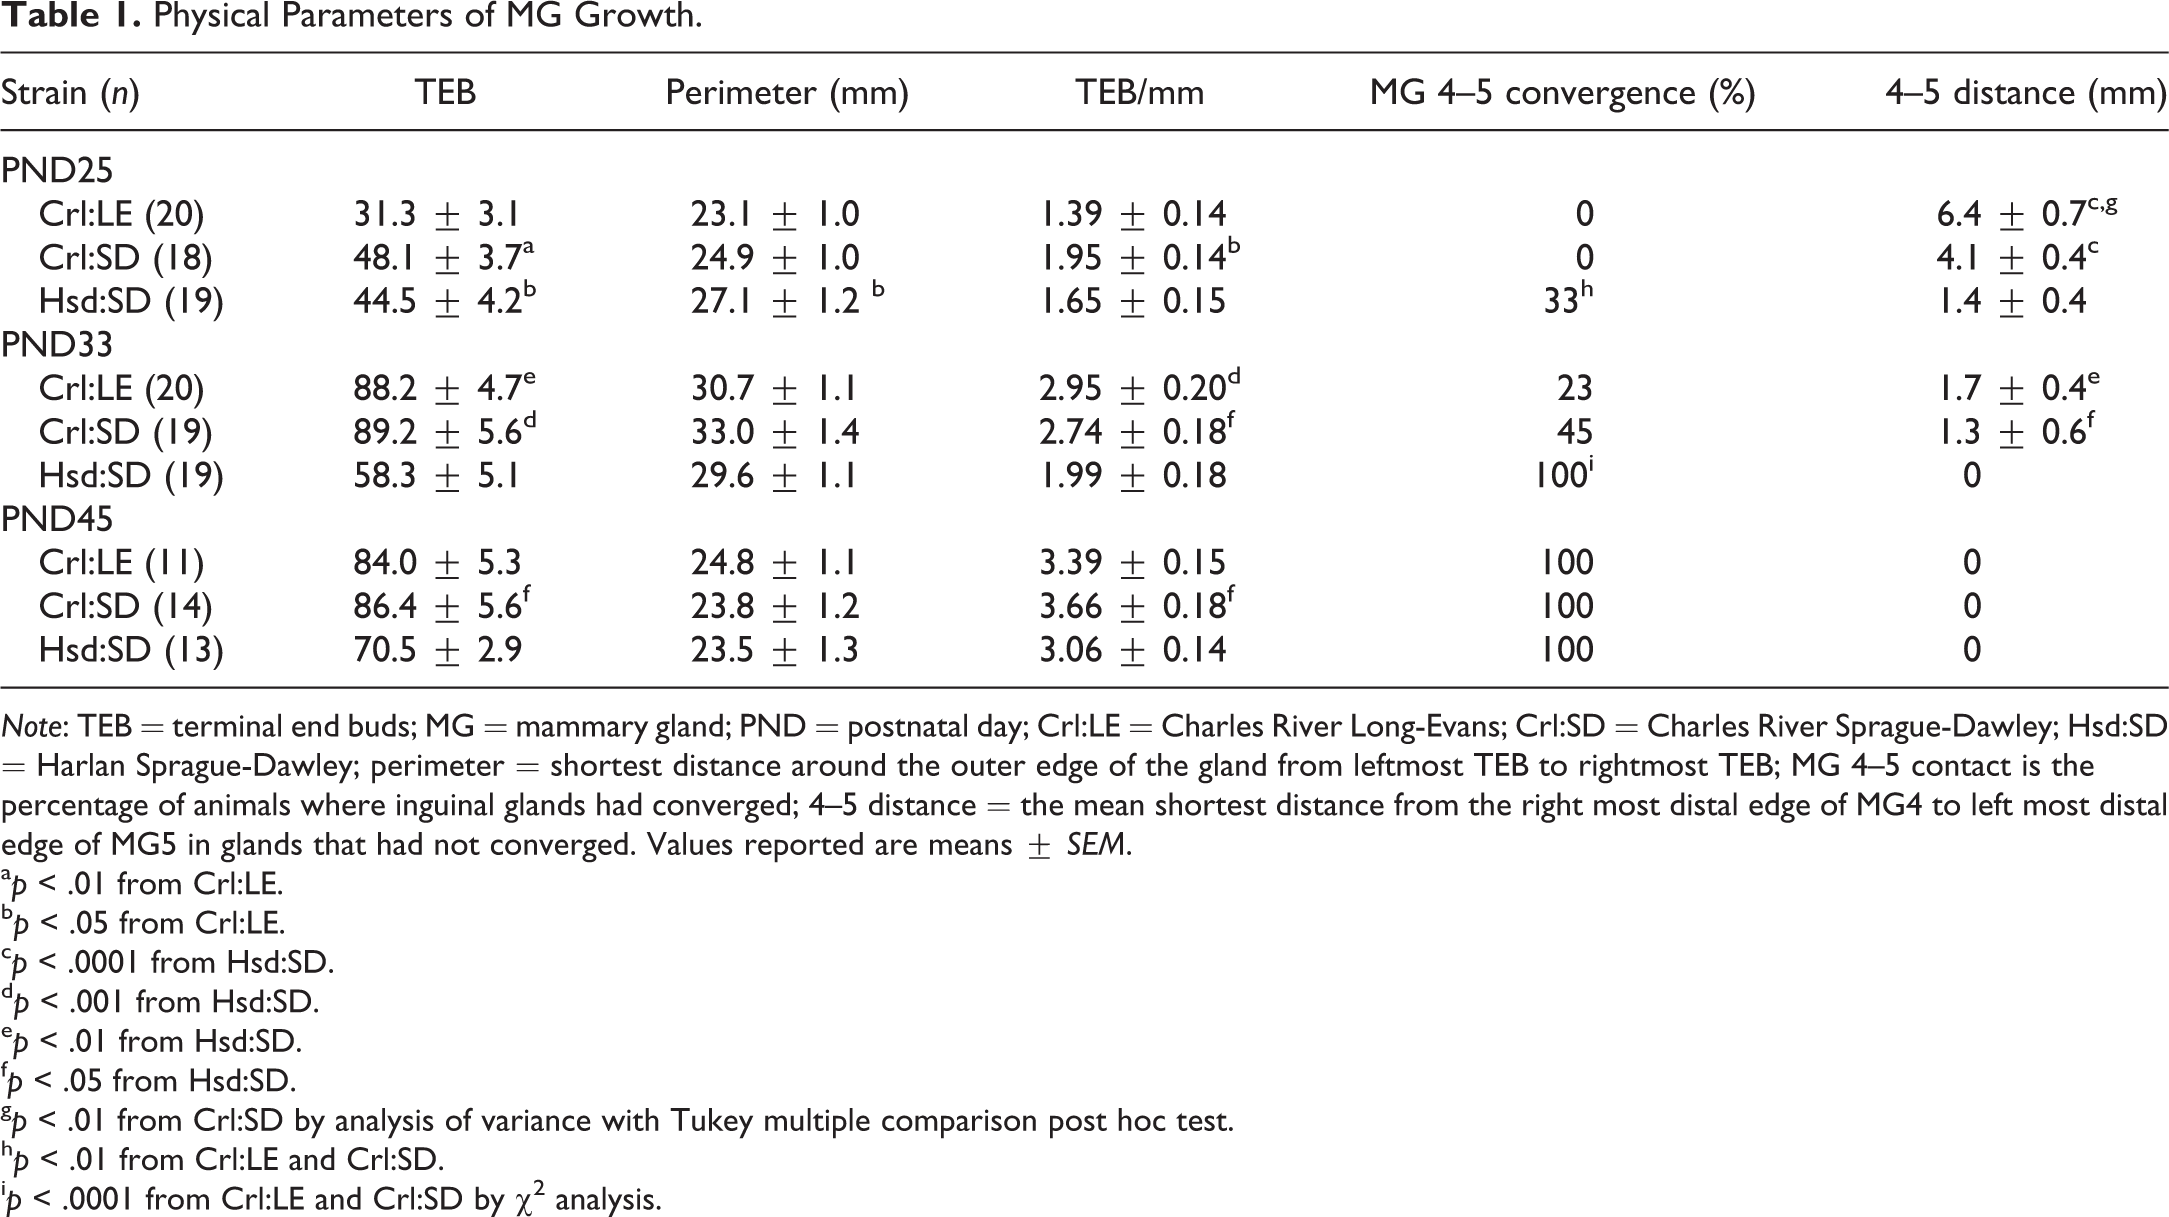
Note: TEB = terminal end buds; MG = mammary gland; PND = postnatal day; Crl:LE = Charles River Long-Evans; Crl:SD = Charles River Sprague-Dawley; Hsd:SD = Harlan Sprague-Dawley; perimeter = shortest distance around the outer edge of the gland from leftmost TEB to rightmost TEB; MG 4–5 contact is the percentage of animals where inguinal glands had converged; 4–5 distance = the mean shortest distance from the right most distal edge of MG4 to left most distal edge of MG5 in glands that had not converged. Values reported are means ± SEM.
ap < .01 from Crl:LE.
bp < .05 from Crl:LE.
cp < .0001 from Hsd:SD.
dp < .001 from Hsd:SD.
ep < .01 from Hsd:SD.
fp < .05 from Hsd:SD.
gp < .01 from Crl:SD by analysis of variance with Tukey multiple comparison post hoc test.
hp < .01 from Crl:LE and Crl:SD.
ip < .0001 from Crl:LE and Crl:SD by χ2 analysis.
Quantitative Morphometric Analysis.
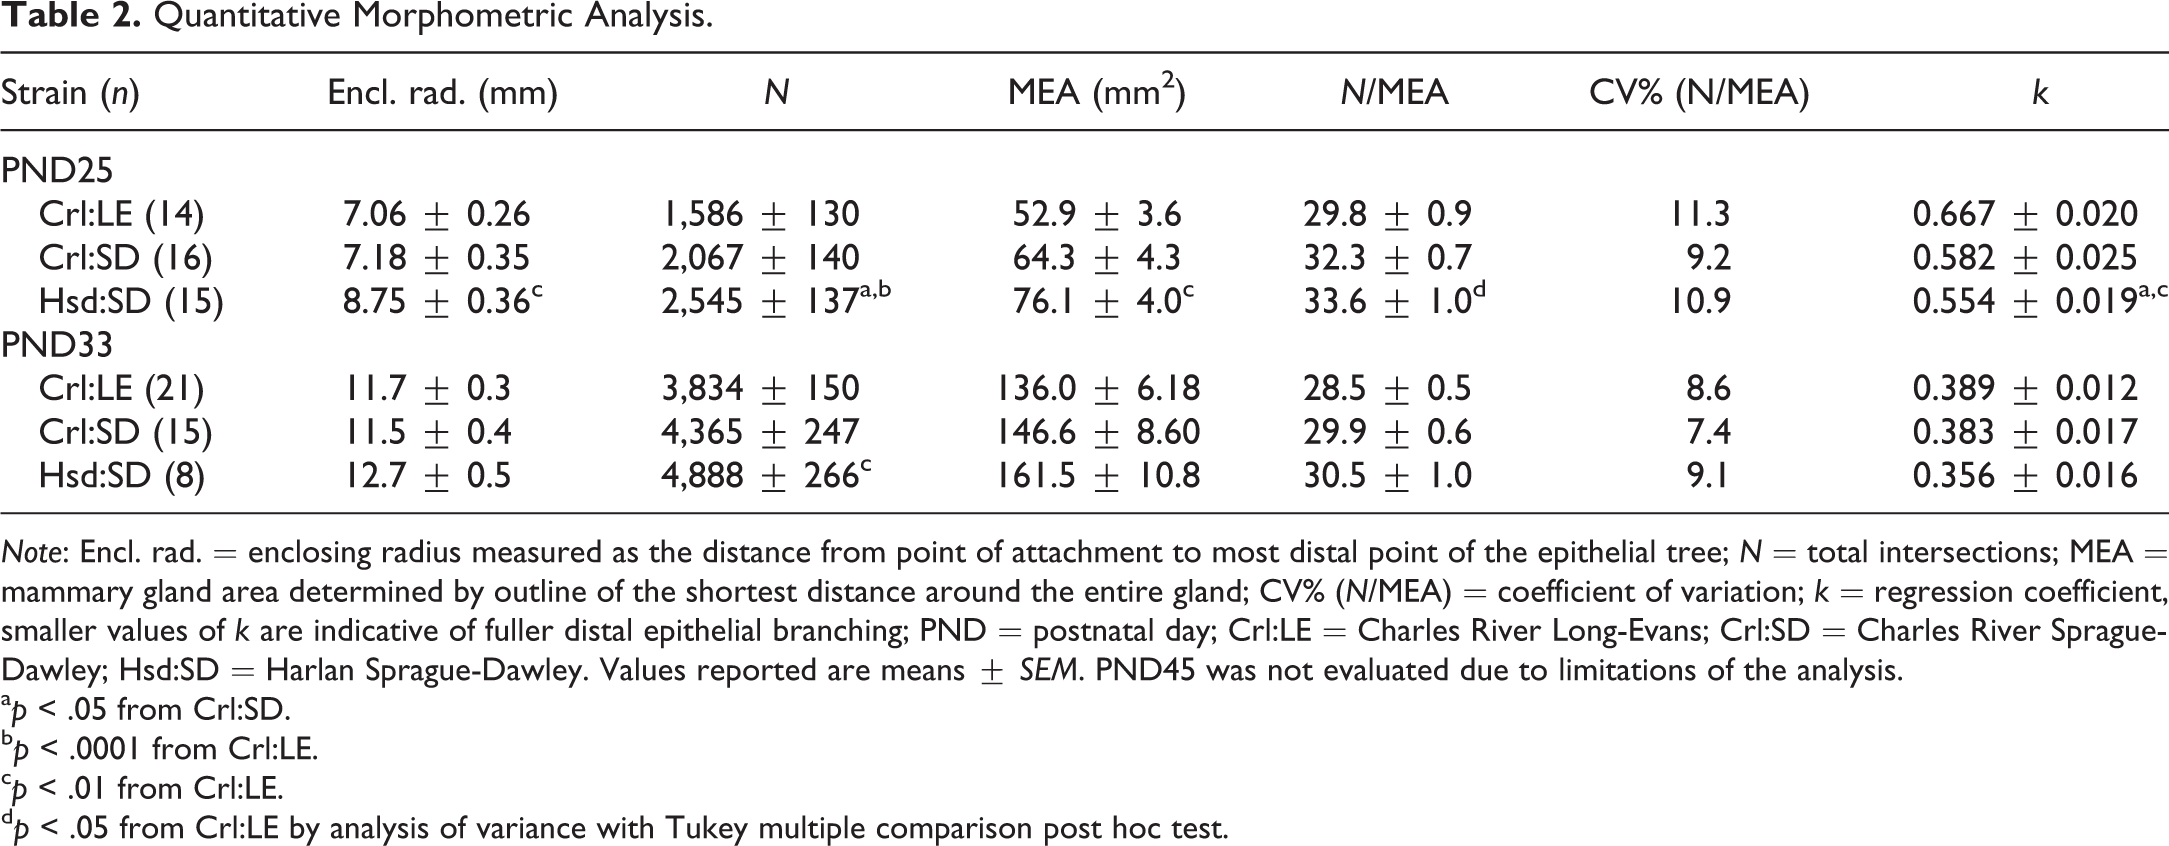
Note: Encl. rad. = enclosing radius measured as the distance from point of attachment to most distal point of the epithelial tree; N = total intersections; MEA = mammary gland area determined by outline of the shortest distance around the entire gland; CV% (N/MEA) = coefficient of variation; k = regression coefficient, smaller values of k are indicative of fuller distal epithelial branching; PND = postnatal day; Crl:LE = Charles River Long-Evans; Crl:SD = Charles River Sprague-Dawley; Hsd:SD = Harlan Sprague-Dawley. Values reported are means ± SEM. PND45 was not evaluated due to limitations of the analysis.
ap < .05 from Crl:SD.
bp < .0001 from Crl:LE.
cp < .01 from Crl:LE.
dp < .05 from Crl:LE by analysis of variance with Tukey multiple comparison post hoc test.
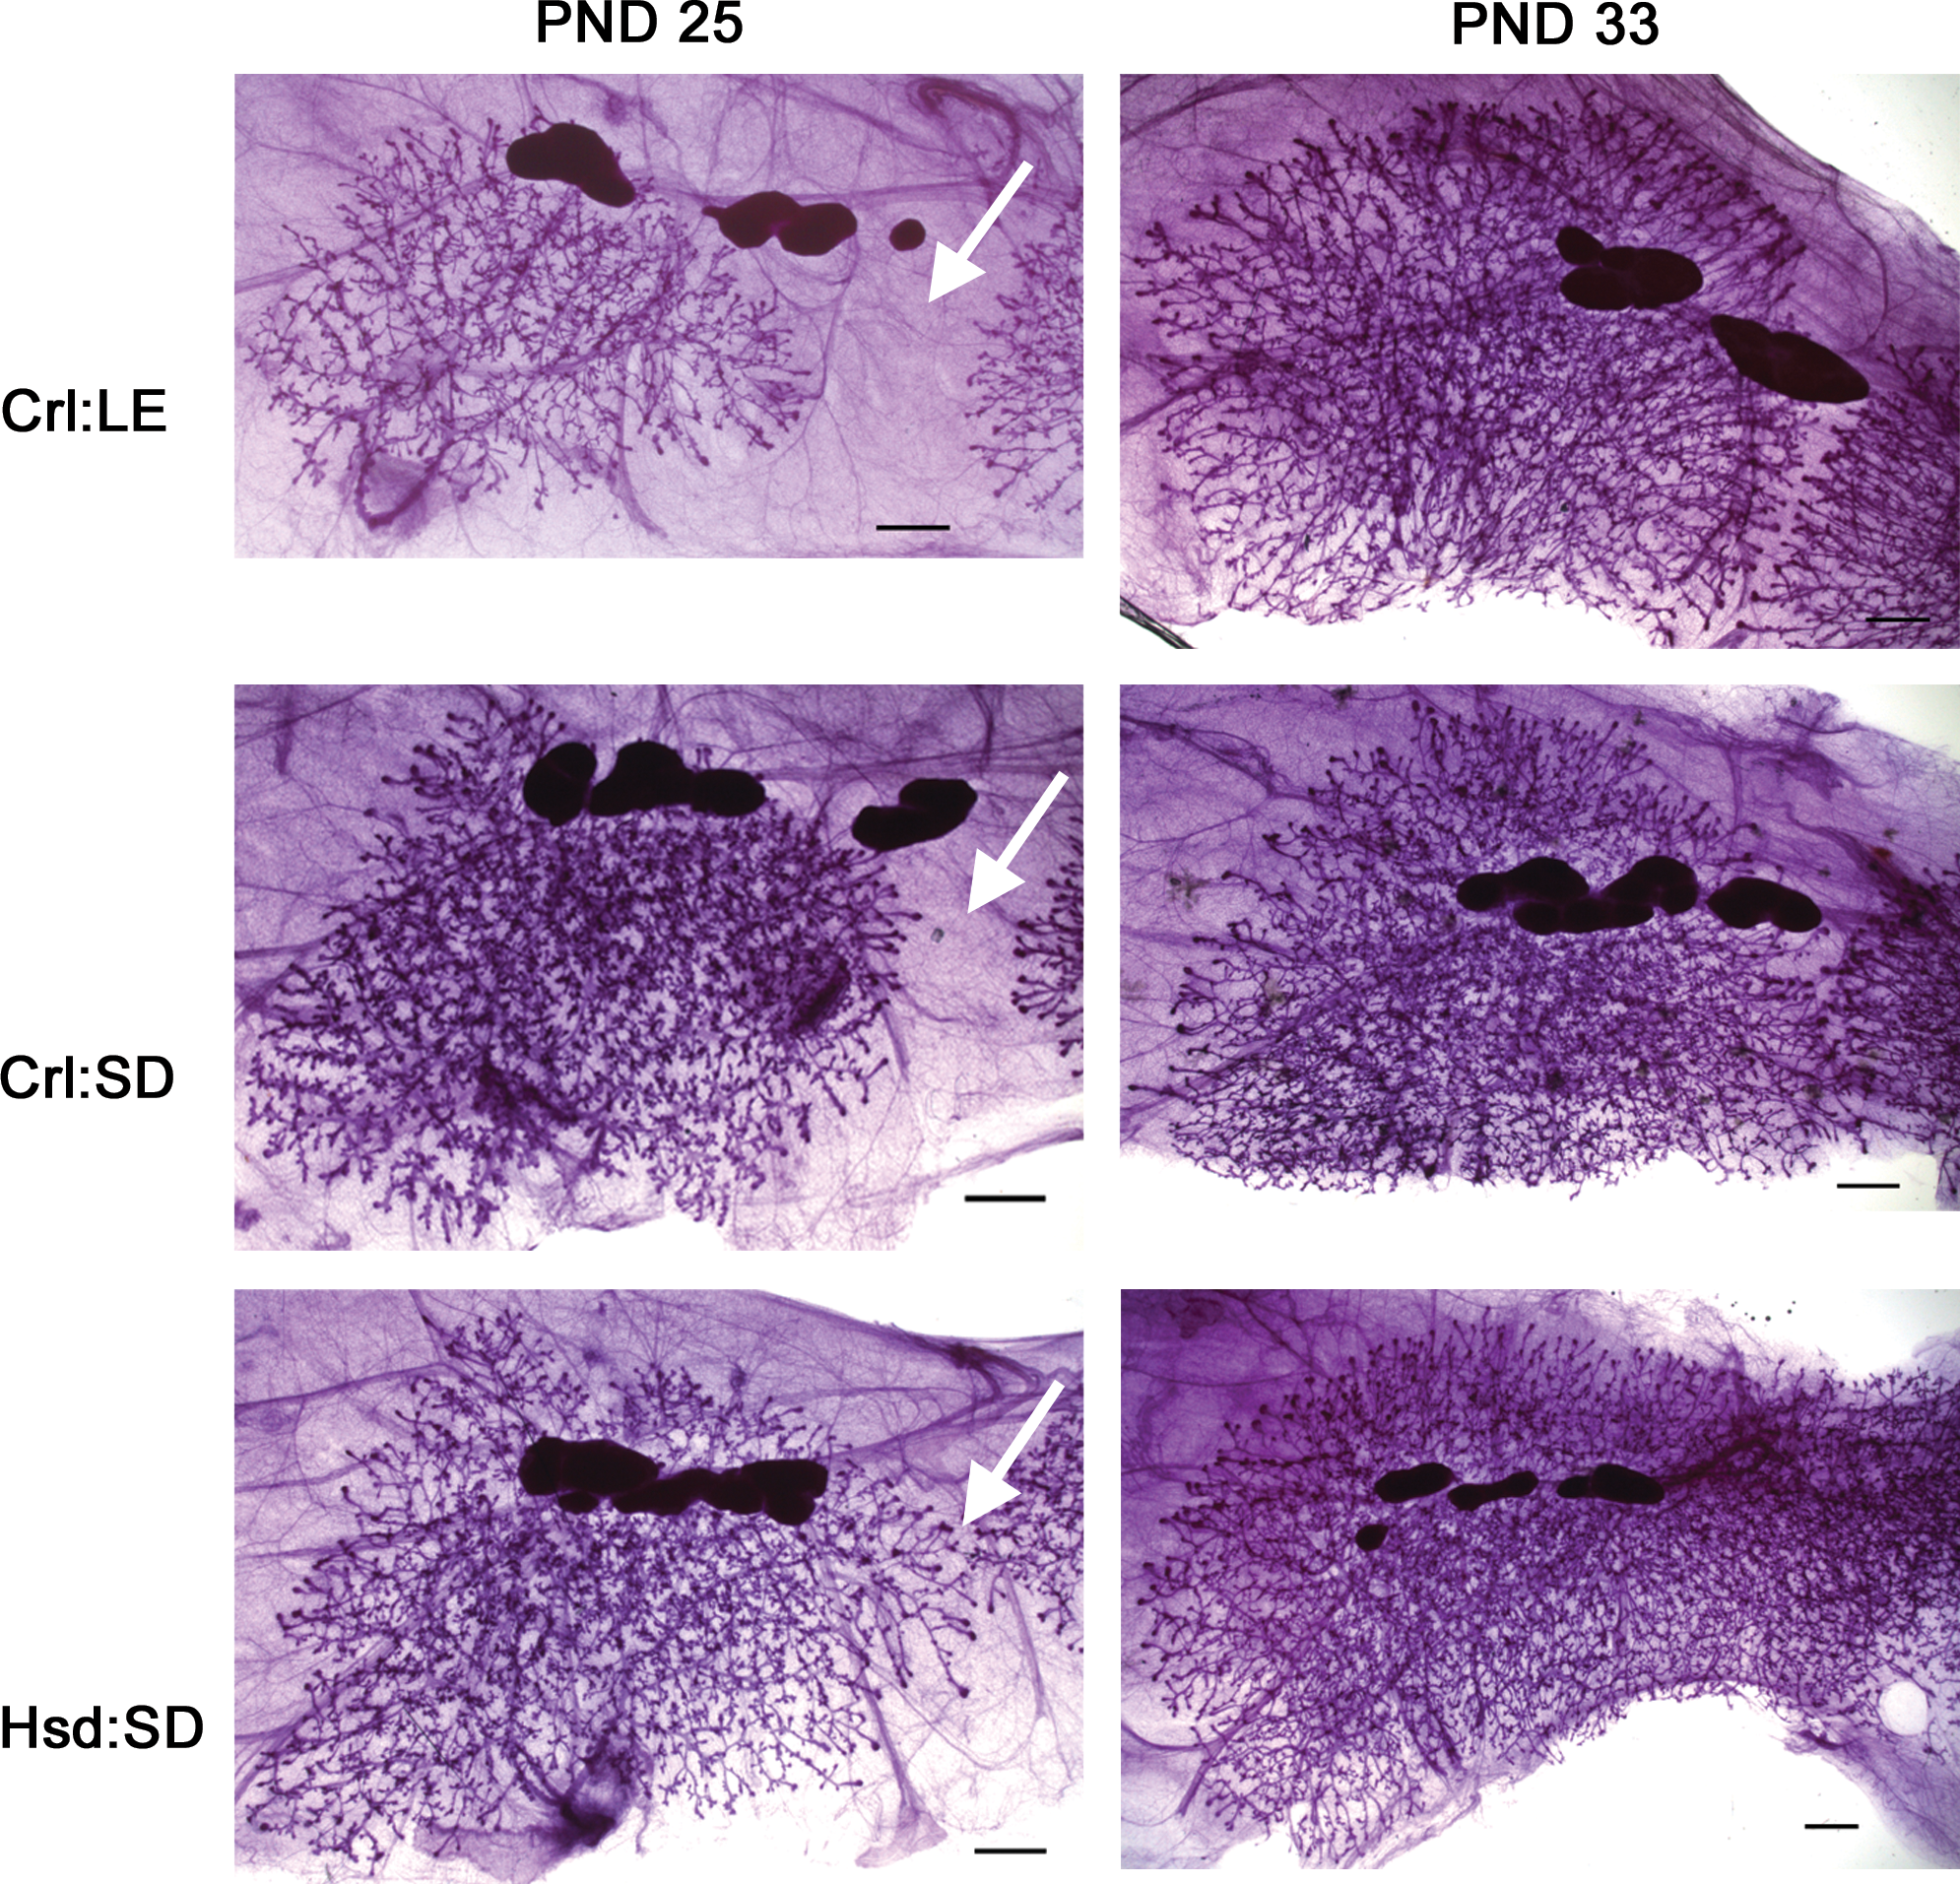
Mammary gland (MG) whole mount images at postnatal days 25 and 33. Images are of MG4 and representative of the intrastrain developmental scores at each time point. Distance between MG4 and MG5 is denoted by arrows. Scale bars are 1 mm.
MG Development PND33
At PND33, there were significantly more TEBs in MGs of Crl:LE rats (p < .01) and Crl:SD rats (p < .001) than in MGs of Hsd:SD rats (Table 1). Although there was no difference in the mean perimeter between strains, the number of TEB/mm was also greater in MGs of Crl:LE rats (p < .001) and Crl:SD rats (p < .05) compared to those of Hsd:SD rats. Convergence of inguinal glands had occurred in 100% of Hsd:SD rats (p < .0001), which was significantly more than in both Crl:SD and Crl:LE rats, and the mean distance between MG4 and MG5 in both Crl:LE rats (p < .01) and Crl:SD rats (p < .05) was significantly greater than in Hsd:SD rats. There was no significant difference in the mean MG 4–5 distance between Crl:LE and Crl:SD rats.
MG Development PND45
MGs of Hsd:SD rats exhibited accelerated development early on, but by PND45, MG development was similar in all strains. The mammary epithelial perimeter was similar and convergence of inguinal glands had occurred in all rats of each strain. The only significant differences observed at PND45 were in the number of TEBs and number of TEB/mm in MGs of Crl:SD rats (p < .05) compared to MGs of Hsd:SD rats (Table 1). The number of TEBs had peaked by PND33 in MGs of CRL rats, while the number continued to rise in MGs of Hsd:SD rats as they aged. As the number of TEB/mm also continued to increase in MGs of Hsd:SD rats across all 3 ages, it is not clear from these data what the peak age of TEB occurrence is in the Hsd:SD.
Scoring of MG Development
MGs of Hsd:SD rats exhibited characteristics of more advanced epithelial development than MGs of the other strains at the respective time points, such as MG 4–5 convergence, greater epithelial area, greater alveolar budding, and higher branching density. MG developmental scores are shown in Figure 4. There were no differences in the mean intrastrain developmental scores at any time point. At PND25, the mean standardized interstrain developmental score of Hsd:SD MGs (p < .0001) was significantly higher than the mean interstrain score of both Crl:LE MGs and Crl:SD MGs. Additionally, the mean interstrain score of Crl:SD MGs (p < .001) was significantly higher than the mean interstrain score of Crl:LE MGs. At PND33, the mean standardized interstrain developmental score of Hsd:SD MGs (p < .0001 and p < .01, respectively) was again significantly higher than the mean interstrain score of both Crl:LE MGs and Crl:SD MGs. The mean interstrain score of Crl:SD MGs (p < .05) also remained significantly higher than that of Crl:LE MGs. At PND45, there was no longer a significant difference in the mean developmental scores between strains.
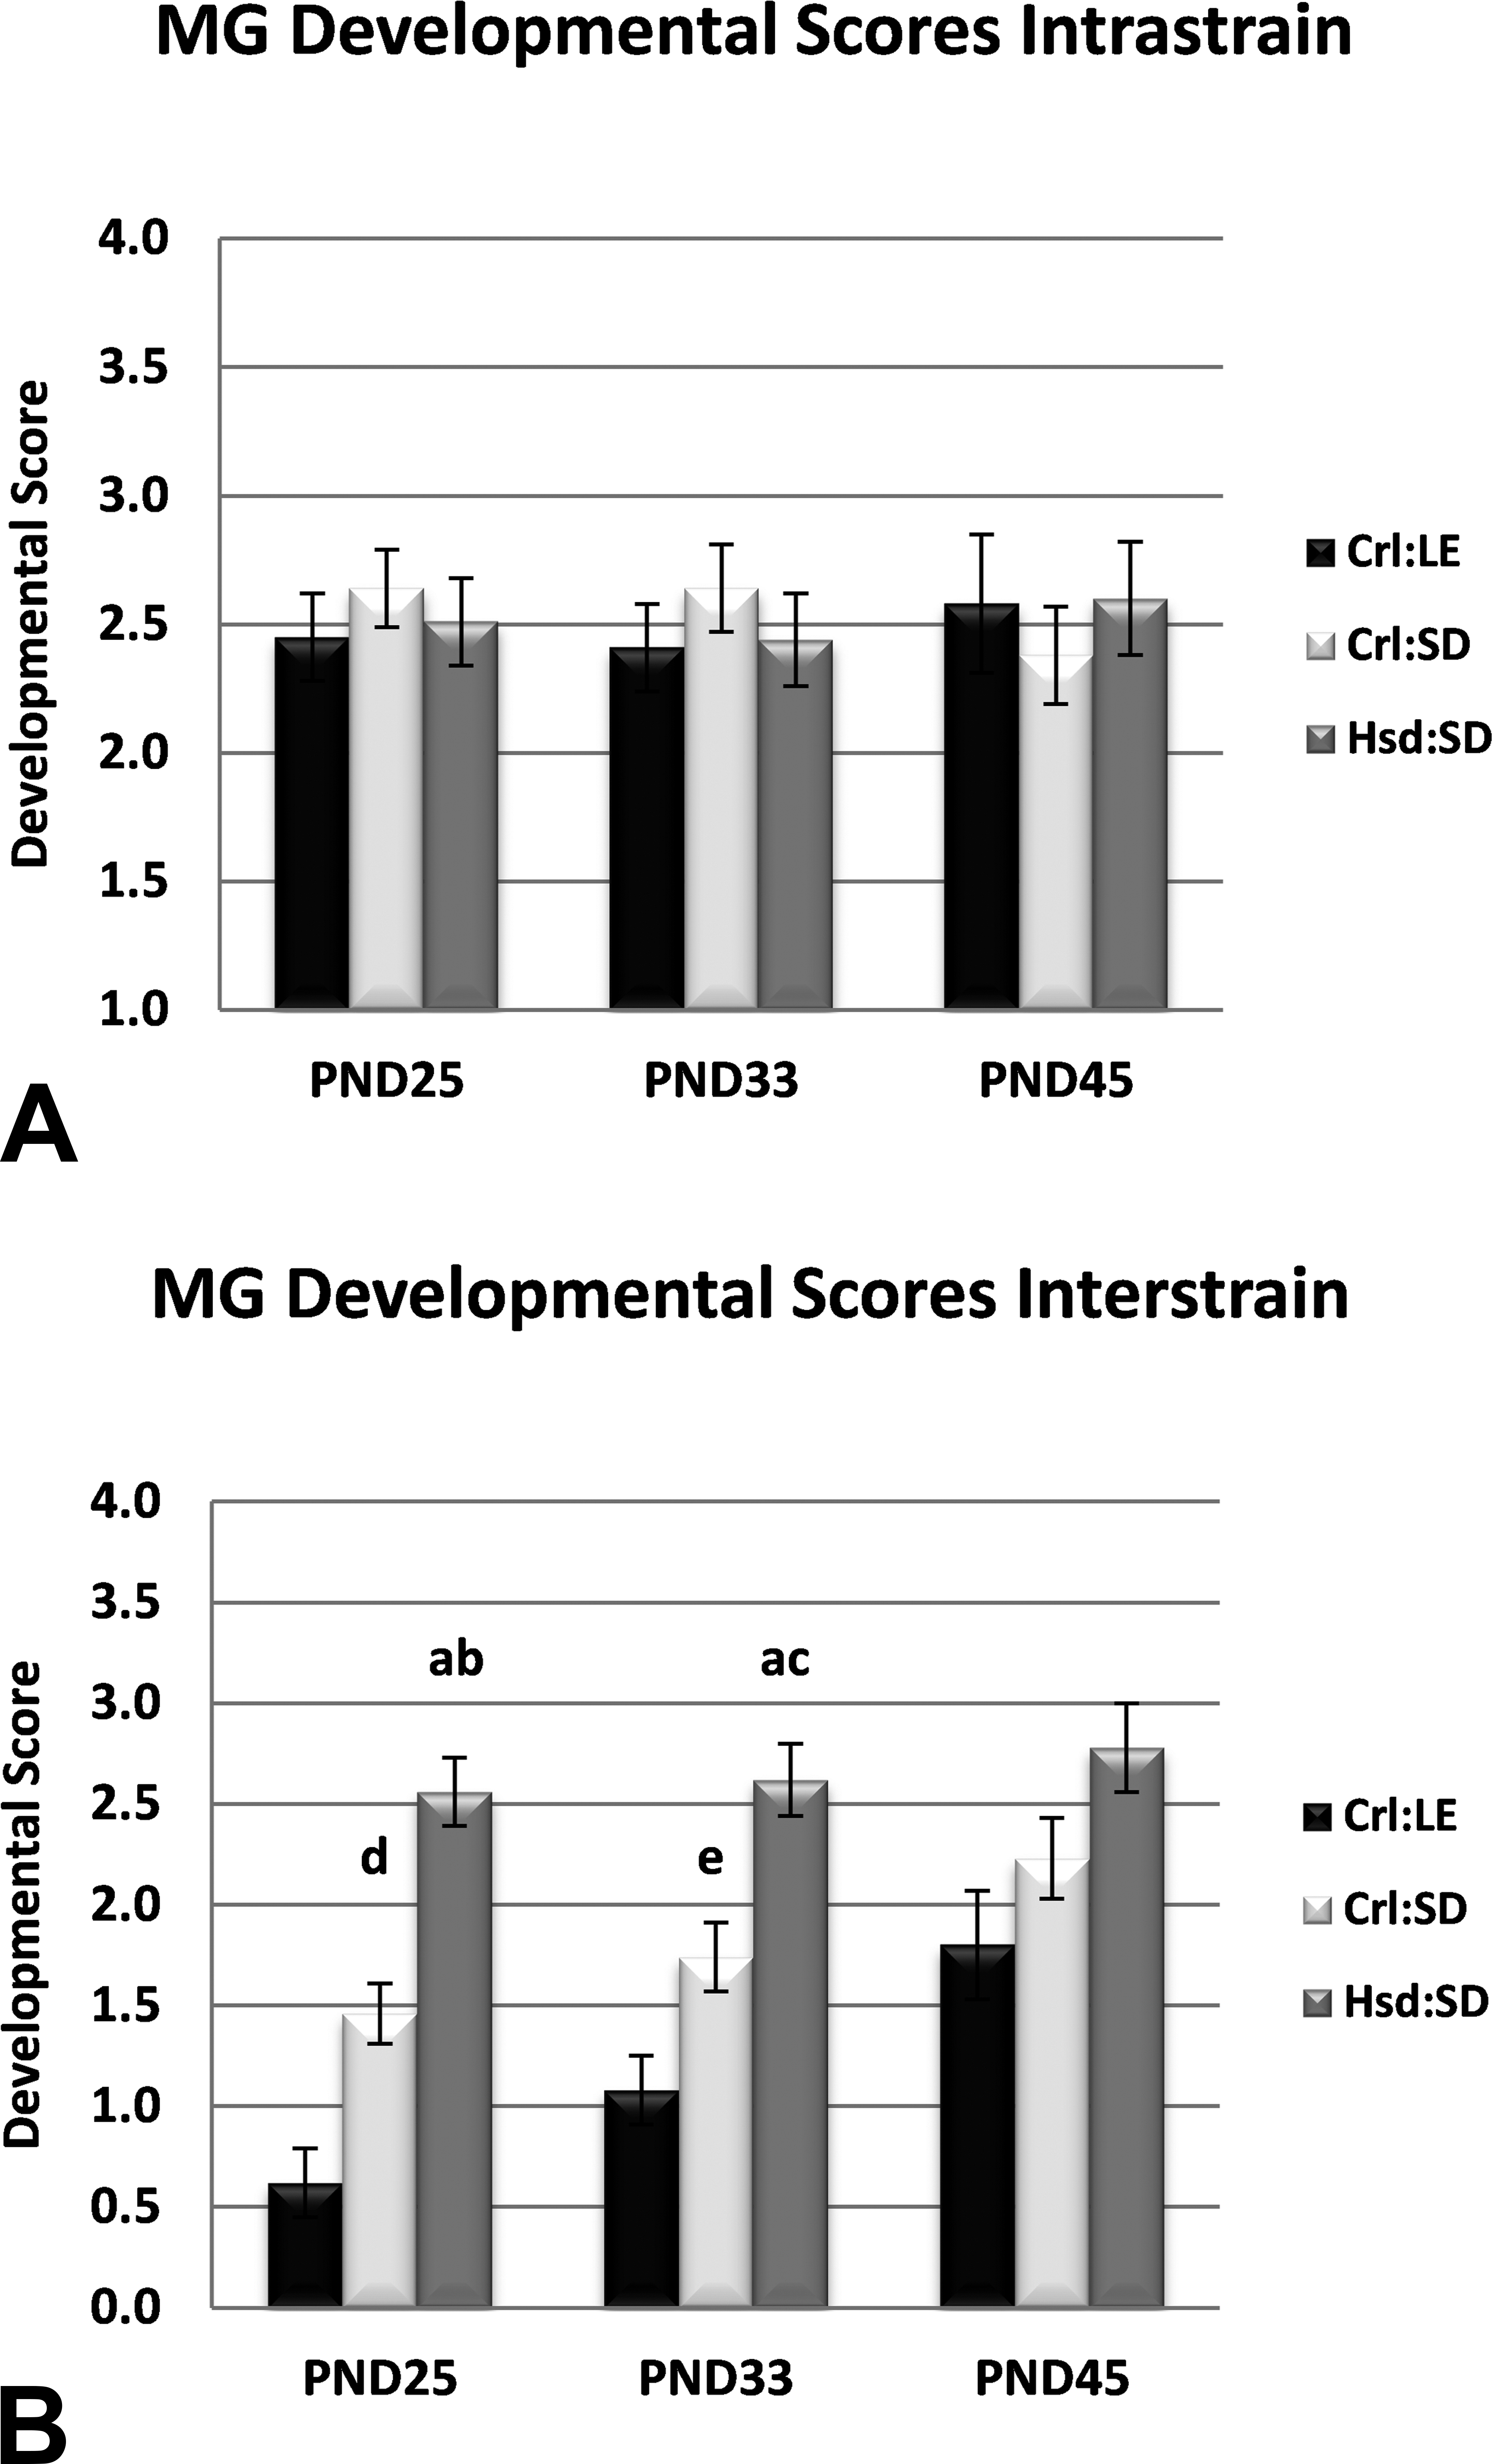
Mammary gland (MG) developmental scores. (A) No differences in MG development were observed when glands were compared within strain. (B) When adjusted for across strain comparison, at postnatal days (PNDs) 25 and 33. MG scores for Harlan Sprague-Dawley (Hsd:SD) rats were significantly greater than MG scores for Charles River Long-Evans (Crl:LE) and Charles River Sprague-Dawley (Crl:SD) rats and MG scores of Crl:SD rats were significantly greater than MG scores for Crl:LE rats. ap < .0001 from Crl:LE; bp < .001 from Crl:SD; cp < .005 from Crl:SD; dp < .001 from Crl:LE; ep < .05 from Crl:LE by nonparametric one-way analysis of variance using the Kruskal–Wallis test on Wilcoxon rank sums. n = 24, 22, 12 (Crl:LE); 22, 23, 14 (Crl:SD); and 22, 22, 13 (Hsd:SD) by PND, respectively.
Sholl Analysis
While there was a significantly greater mean total branching intersections (N) in MGs of Hsd:SD rats (p < .05 and p < .0001, respectively) compared to MGs of both Crl:SD and Crl:LE rats at PND25, the mean MEA of Hsd:SD rats (p < .01) and the mean N/MEA of Hsd:SD rats (p < .05) were significantly greater compared to MGs of Crl:LE rats (Table 2). However, the mean Sholl regression coefficient (k) was significantly lower for MGs of Hsd:SD rats (p < .01 and p < .05, respectively) than for MGs of both Crl:LE and Crl:SD rats, indicating fuller development throughout the entire epithelial area in Hsd:SD MGs. At PND33, the mean N was significantly greater in MGs of Hsd:SD rats (p < .01) compared to MGs of Crl:LE rats. Although MEA and N/MEA remained higher and k remained lower in Hsd:SD than other strains, no other significant differences in Sholl metrics between strains were observed at this time point.
Estrous Cyclicity
Overall, there were no significant differences in estrous cyclicity between Crl:LE (n = 11) and Crl:SD (n = 10) rats, but there were significant differences between Crl:LE and Hsd:SD (n = 8) rats and between Crl:SD and Hsd:SD rats (data not shown). The lengths of estrus and of metestrus were similar among the 3 strains. Diestrus was extended in Hsd:SD rats more frequently than in Crl:LE rats (p < .01) and in Crl:SD rats (p < .01). To characterize the differences in extended diestrus among strains, Hsd:SD rats had more than 2 consecutive days of diestrus 14.0% of the days, while Crl:SD rats had more than 2 consecutive days of diestrus 4.6% of the days and Crl:LE rats had more than 2 consecutive days of diestrus 5.8% of the days based on cytology.
Immunohistochemistry
ERα was expressed in the epithelial nuclei of all glands. Nuclear ERα expression was significantly greater in MGs of Hsd:SD rats at both PND25 (p < .0001 and p < .0005, respectively) and at PND33 (p < .005 and p < .0005, respectively) than in MGs of Crl:LE and Crl:SD rats based on mean quickscores (Figure 5). This is consistent with precocious maturation of the Hsd:SD MGs compared to the other strains. Nuclear ERα staining was similar in MGs of all strains at PND45. Nuclear PR was expressed in all glands and staining increased with age. Relative PR expression was significantly greater in MGs of Crl:LE rats than in MGs of Crl:SD rats on PND33 (p < .05; Figure 5). Staining was similar in each strain on PND25 and PND45.
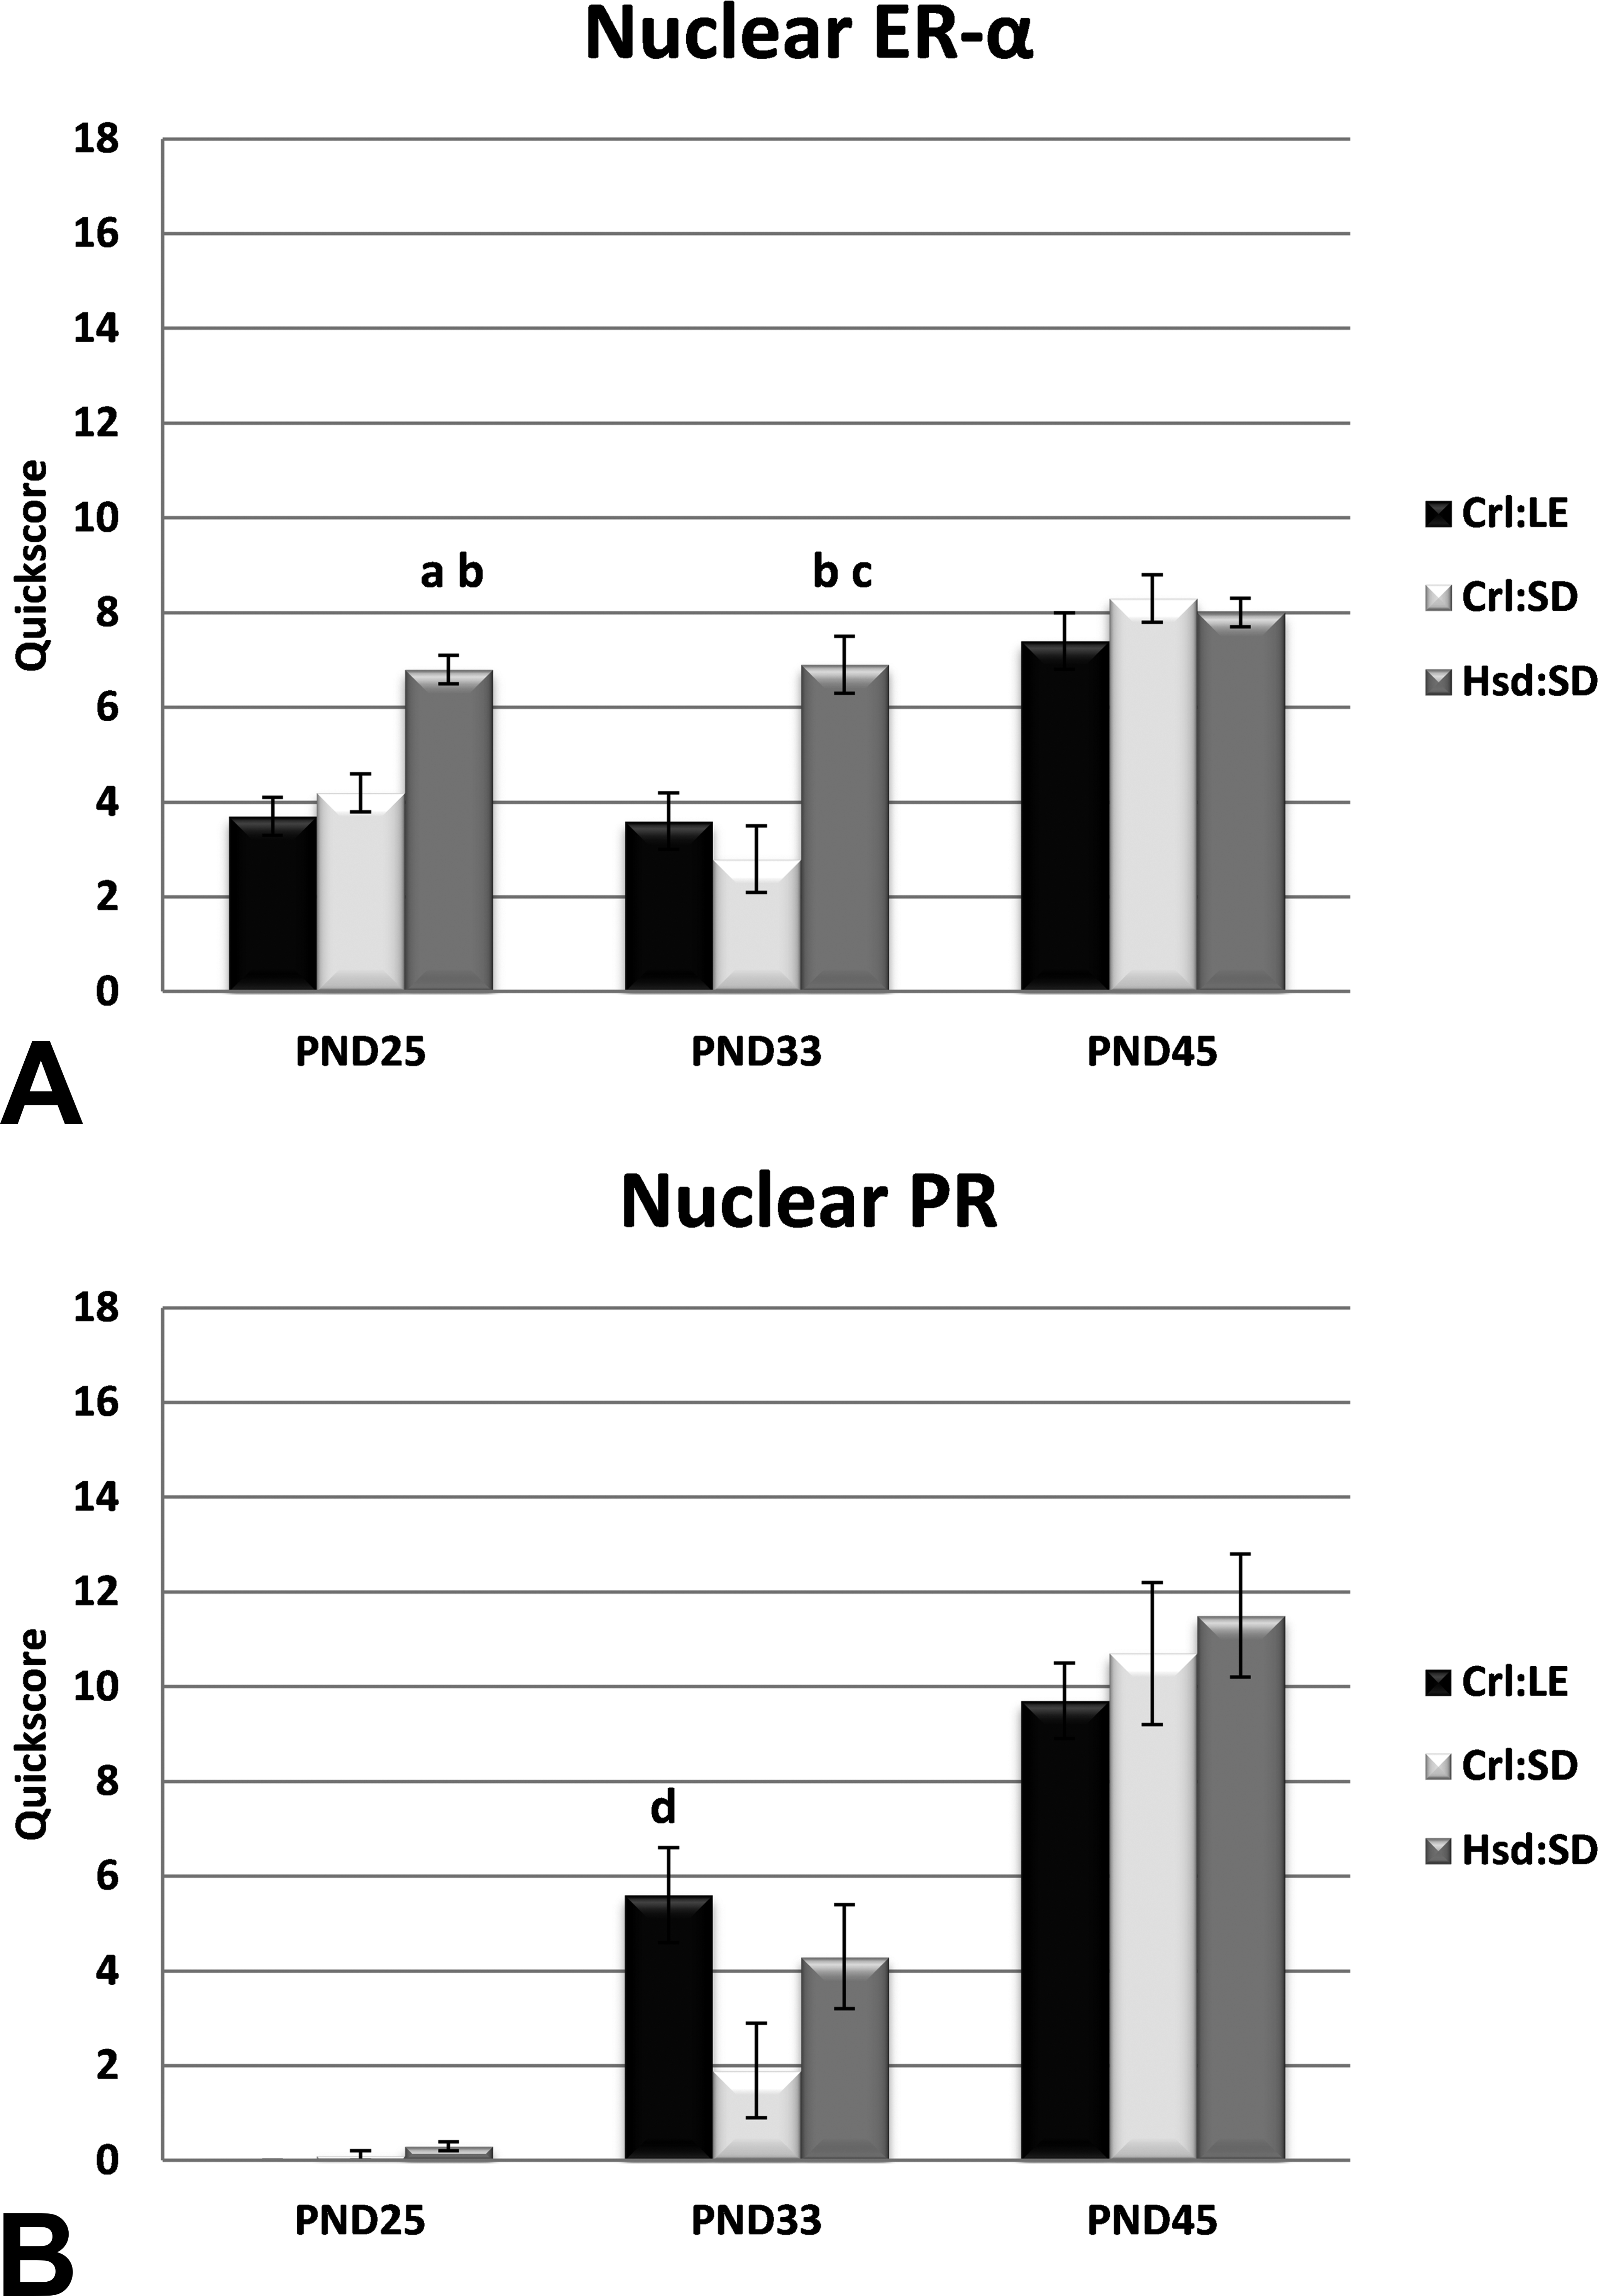
Relative estrogen receptor-α (ER-α) and progesterone receptor (PR) expression quickscore. (A) Nuclear ER-α quickscore was significantly greater in mammary glands of Harlan Sprague-Dawley rats than that of Charles River Long-Evans (Crl:LE) and Charles River Sprague-Dawley (Crl:SD) rats at postnatal days (PNDs) 25 and 33. ap < .0001 from Crl:LE; bp < .0005 from Crl:SD; cp < .005 from Crl:LE; dp = .05 from Crl:SD by analysis of variance (ANOVA) with Tukey post hoc comparison. (B) Though the quickscore for nuclear PR increased across time points, the only significant difference observed was between Crl:LE and Crl:SD at PND33 (p = .05 by ANOVA with Tukey post hoc comparison). n = 10, for all strains and time points.
Discussion
This study evaluated the natural MG development in 3 strains of rat commonly used in toxicity testing studies. As no single standard protocol currently exists, this study employed 3 different methods for assessing MG development: physical measurement of various developmental parameters, developmental scoring based on visual observation, and quantitative morphometric analysis. MGs of Hsd:SD rats consistently exhibited visual characteristics of more well-developed glands, such as greater lobuloalveolar budding than MGs of their Crl:SD and Crl:LE counterparts at PND25, PND33, and PND45. The inguinal glands had converged in 33% of Hsd:SD rats by PND25 and in 100% by PND33, whereas none had converged at PND25 and less than half had converged by PND33 in the CRL strains. At PND25, quantitative morphometric analysis recorded significantly more branching intersections in glands of Hsd:SD rats than in glands of both Crl:LE and Crl:SD rats, a greater epithelial area and a greater epithelial branching density than glands of Crl:LE rats and fuller distal epithelial branching (as indicated by a significantly lower Sholl regression coefficient) than glands of both Crl:LE and Crl:SD rats. By PND45, only observational scoring indicated any remaining differences in glandular development between strains. Taken together, these observations suggest that the mammary epithelium of Hsd:SD rats develops earlier, or at least at a faster pace, than that of both Crl:SD and Crl:LE rats. We also observed that the mammary epithelium of Crl:SD rats develops at a faster pace than that of Crl:LE rats. While MGs of Hsd:SD rats were larger and exhibited greater branching at PND25 and PND33, MGs of Crl:SD and Crl:LE rats exhibited both a greater total number of TEBs and TEB/mm.
Developmental scoring of mammary whole mounts is a useful method for evaluating changes in MG development by visual assessment rather than by the more tedious and time-consuming manner of counting and measuring. Glands are scored based on a set of predetermined criteria, similar to a pathologist’s evaluation, and reflect a well- or poorly developed gland. A handful of examples of developmental scoring exist in the literature. Rayner, Wood, and Fenton (2004), Rayner, Enoch, and Fenton (2005), and Enoch et al. (2007) used this method to evaluate MG development in Long-Evans rats. White et al. (2007), Macon et al. (2011), and Tucker et al. (2015) each utilized developmental scoring to evaluate MG development in mice. Significant differences in developmental scores of untreated/vehicle groups compared to treated groups were reported in each of these studies, demonstrating the effectiveness of this method. Utilizing the criteria described in Davis and Fenton (2013) for developmental scoring in the current study, MGs from all 3 strains were scored similarly (2.4–2.6) within the respective strain at PND25, PND33, and PND45 (Figure 4). Similar intrastrain scores are to be expected as one would expect little variation in MG development within a strain. In order to adjust for interstrain comparisons, a subset of the best developed glands from each strain were evaluated for strain differences and scored against each other. The scores of the remaining glands from each strain were then adjusted accordingly. The adjusted developmental scores for MGs of Hsd:SD rats were significantly higher than one or both of the other strains, depending on age, indicating that Hsd:SD rats exhibited more well-developed glands than their Crl:SD or Crl:LE counterparts and a trend in the rate of development of Hsd:SD > Crl:SD > Crl:LE was observed. These observations are consistent with those of the other methods of evaluation applied in this study.
Advanced development of MGs of Hsd:SD rats was further substantiated by significant differences in quantitative morphometric data at PND25 (Table 2). Stanko, Easterling, and Fenton (2015) suggested using this quantitative method for the evaluation of MGs from rats at PND25 only. However, in this study, we were able to apply it to MGs from rats at PND33 as well. While statistical differences were observed only in the mean number of intersections at PND33, the means of all parameters measured trended in a manner that supported advanced development of Hsd:SD glands. However, no differences in development between the CRL strains at either PND25 or PND33 were observed using this method. Although, to our knowledge, use of this quantitative method of assessment has not been reported elsewhere in the literature, these data demonstrate that this method is effective for detecting differences in longitudinal growth, branching density, epithelial area, and distal epithelial development in MGs of peripubertal rats. It is the only automated and low-cost method that we are aware of for assessing the degree of branching density in mouse and rat mammary tissue.
Relative nuclear ERα expression in MGs of the Harlan rats was significantly higher than in MGs of the CRL rats at both PND25 and PND33. By PND45, ERα expression was similar in all 3 strains, suggesting that all strains had reached their maximum expression levels by that time. MG development is under strong hormonal regulation and ERα and PR are essential for proper epithelial branching and lobular growth (Cheng et al. 2004; Shyamala 1997; Shyamala et al. 2002). The observed changes in receptor expression are in line with the respective developmental changes occurring in the gland at these ages. Mammary branching is ERα-mediated and accelerates peripubertally (PND25-33; Gjorevski and Nelson 2011), whereas differentiation of buds and lobules is not augmented until closer to adulthood (PND45; Russo and Russo 1996). The elevated nuclear ERα expression observed in this study correlates with the significant differences observed in both the quantitative morphometric analyses and physical parameters in the Harlan strain at PND25 and PND33. Although a significant difference in PR expression was observed between Crl:LE and Crl:SD rats at PND33, interstrain PR expression was generally similar at PND25 and PND45 and expression increased progressively across the life stages in all 3 strains.
Although these data indicate that MGs of Hsd:SD rats generally develop earlier than the CRL strains, it is important to note that they do not appear to develop TEBs at the same rate as the other strains. Because the undifferentiated TEB is the target site for induction of mammary carcinomas, the gland is most susceptible to tumorigenicity when the number of TEBs is at a maximum and, therefore, this is the ideal time to administer the tumor-inducing chemical. Exposure to EDCs that alter MG development subsequently alter the glands’ susceptibility to tumorigenesis by either affecting the number of TEBs present or shifting the time at which the maximum number of TEBs are present. In order to accurately assess changes in the WOS, it is important to identify the life stage at which the maximum number of TEBs are present in the various strains of untreated rat models that are utilized in tumorigenicity studies. It has been suggested that the number of TEBs reaches a maximum at PND 20–21 (Russo and Russo 1996; Mandrup et al. 2012), after which time the TEBs begin to differentiate into alveolar buds. Our data demonstrate that the number of TEBs is maximal at or around PND33 in the CRL strains while the number continues to increase through PND45 in the Harlan strain. The decrease in number at PND45 in the CRL strains can be explained by the fact that by this time the inguinal glands had converged, thereby reducing the epithelial perimeter, and contact inhibition had taken place, causing existing TEBs to differentiate into lobules or terminal ends. However, this pattern of development was not observed in the Harlan strain. In fact, TEBs continued to develop in all 3 strains as evidenced by the increase in TEB/mm from PND25 to PND45. This is important, as tumor type and incidence are directly related to the number of TEBs present at the time of carcinogen administration in tumor-inducing studies (Russo 2015). The administration of DMBA while undifferentiated TEBs are present induces excessive proliferation of TEBs into intraductal proliferations which leads to the formation of ductal carcinomas (Russo 2015). This is attributed to the high rate of cell proliferation and DNA synthetic activity that is the characteristic of TEBs, allowing them to take up more DMBA and produce more epoxides (Russo 2015). In contrast, alveolar buds and lobules exhibit lower proliferation rates, produce fewer polar metabolites, and also possess a greater capacity for repairing DMBA-DNA adducts, resulting in more benign lesions such as cysts and fibroadenomas (Russo 2015). The observed differences in the number of TEBs emphasize the importance of the timing of carcinogen administration in order to properly interpret susceptibility to mammary tumorigenesis in these strains.
This study also examined other developmental endpoints including BW, the day of VO, and estrous cyclicity. These other aspects of puberty and reproductive development seemed to have little association with MG development in the Harlan strain. The Hsd:SD rats consistently weighed less at each life stage and VO occurred significantly later than their CRL counterparts. The later occurrence of VO is correlated with the lower BW in the Harlan rats as the onset of puberty is known to be proportional to BW (Cheung et al. 1997). Similarly, MG development is generally considered to be isometric from parturition until puberty, when it then develops allometrically until early adulthood (Hovey, Trott, and Vonderhaar 2002; McNally and Martin 2011; Musumeci et al. 2015). However, the fact that Hsd:SD rats exhibited more developed MGs using 3 different sets of criteria than the CRL strains at PND25 and PND33, yet weighed less, suggests that mammary development is not well correlated with BW or the timing of VO, especially not in the Hsd:SD strain. Although the association between mammary growth and puberty is not completely understood, it is possible that allometric development is stimulated by peripubertal increases in circulating estrogen and Hsd:SD rat mammary tissue is more sensitive to these increases. Although serum estrogen levels were not measured in the present study, we suggest that this response is happening at the level of the MG, as evidenced by significantly greater ERα expression in the Harlan rats at PND25 and PND33. Further studies are needed to determine if during the postnatal to early postpubertal period of development, there is an effect of endocrine or paracrine factors on the MGs in the Hsd:SD that accelerate MG growth in this strain.
In summary, the data presented here indicate that MGs of Hsd:SD rats develop at a faster pace than MGs of both Crl:SD and Crl:LE rats. Additionally, we report age-dependent differences in the absolute number and trends in TEB counts and in relative ERα expression in these strains. Throughout this study, we have used the term “development” to describe the overall growth of the gland. This term takes into consideration all aspects of growth collectively, including longitudinal and lateral growth, epithelial area and convergence of adjacent glands, branching density, alveolar budding, and the number of TEBs. It is important to realize that while a gland with fewer TEBs may be less differentiated, it may not necessarily be less developed with respect to other aspects. As MGs of Hsd:SD rats developed earlier (taking into account all aspects of development collectively) compared to those of their CRL counterparts, it would be interesting to ascertain precisely when TEBs first appear in each of these strains. If, as one would expect from the preceding data, TEB formation began earlier in MGs of the Harlan strain, this strain would exhibit an earlier WOS toward estrogenic compounds. Although the maximum number of TEBs in the Harlan strain was observed at PND45, it is difficult to estimate whether this would be the equivalent time in the CRL strains, as the number of TEBs had peaked at PND33 in those strains. The trend of fewer TEBs suggests that the Harlan strain may, in fact, be less sensitive to chemically induced tumorigenesis or at least may exhibit a lower rate of tumor formation. Therefore, while the Harlan strain may be a useful model for mammary tumor-induction studies when utilized independently, caution should be exercised when comparing tumorigenicity data to that of other strains. The data provided herein also demonstrate that the Hsd:SD should be a useful tool for evaluating the response of the MG following endocrine disrupting chemical exposures in juvenile toxicity testing; we have documented VO timing, expected BWs over time, mammary epithelial nuclear receptor appearance (and peaks), and the tempo of mammary development for future reference and comparison.
Footnotes
Acknowledgments
The authors would like to thank the CMPB Immunohistochemistry core laboratory for their expertise, Dr. Darlene Dixon for assistance with immunohistochemistry scoring, Ms. Beth Mahler for assistance with images and figures, and Drs. Alex Merrick and Mark Hoenerhoff for their technical assistance in reviewing this manuscript.
Authors’ Contribution
Authors contributed to conception or design (JS, SF); data acquisition, analysis, or interpretation (JS, GK, VC, SF); drafting the manuscript (JS); and critically revising the manuscript (JS, GK, VC, SF). All authors gave final approval and agreed to be accountable for all aspects of work in ensuring that questions relating to the accuracy or integrity of any part of the work are appropriately investigated and resolved.
Declaration of Conflicting Interests
The author(s) declared no potential conflicts of interest with respect to the research, authorship, and/or publication of this article.
Funding
The author(s) received no financial support for the research, authorship, and/or publication of this article.